

The DOI matches its Crossref record; 46 of the 46 references it cites were found in a registry or an index.
Combined effects of scanning ultrasound and a tau-specific single chain antibody in a tau transgenic mouse model
Open accessAbstract
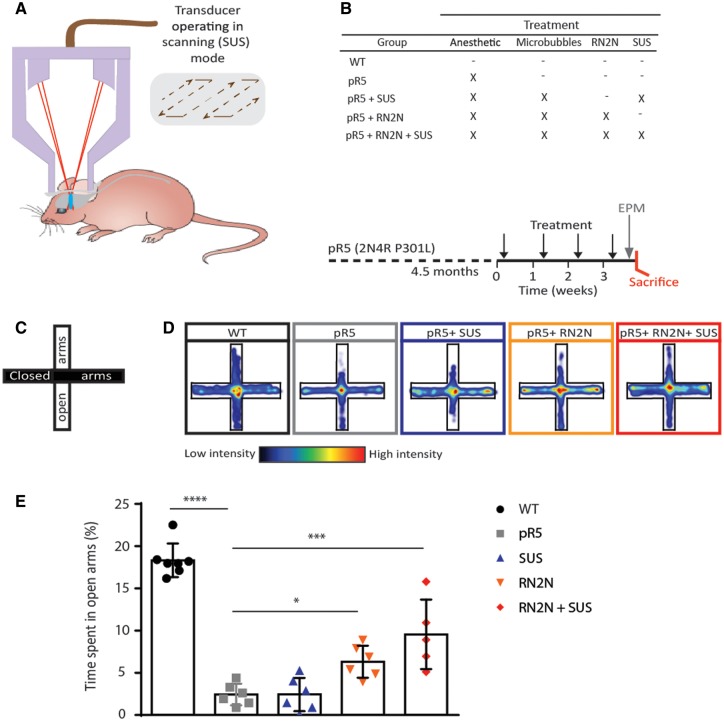
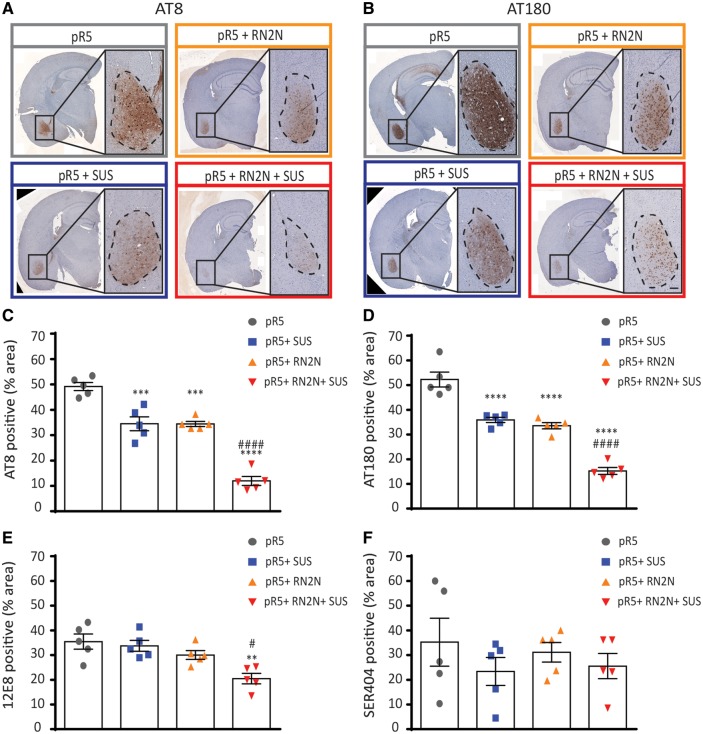
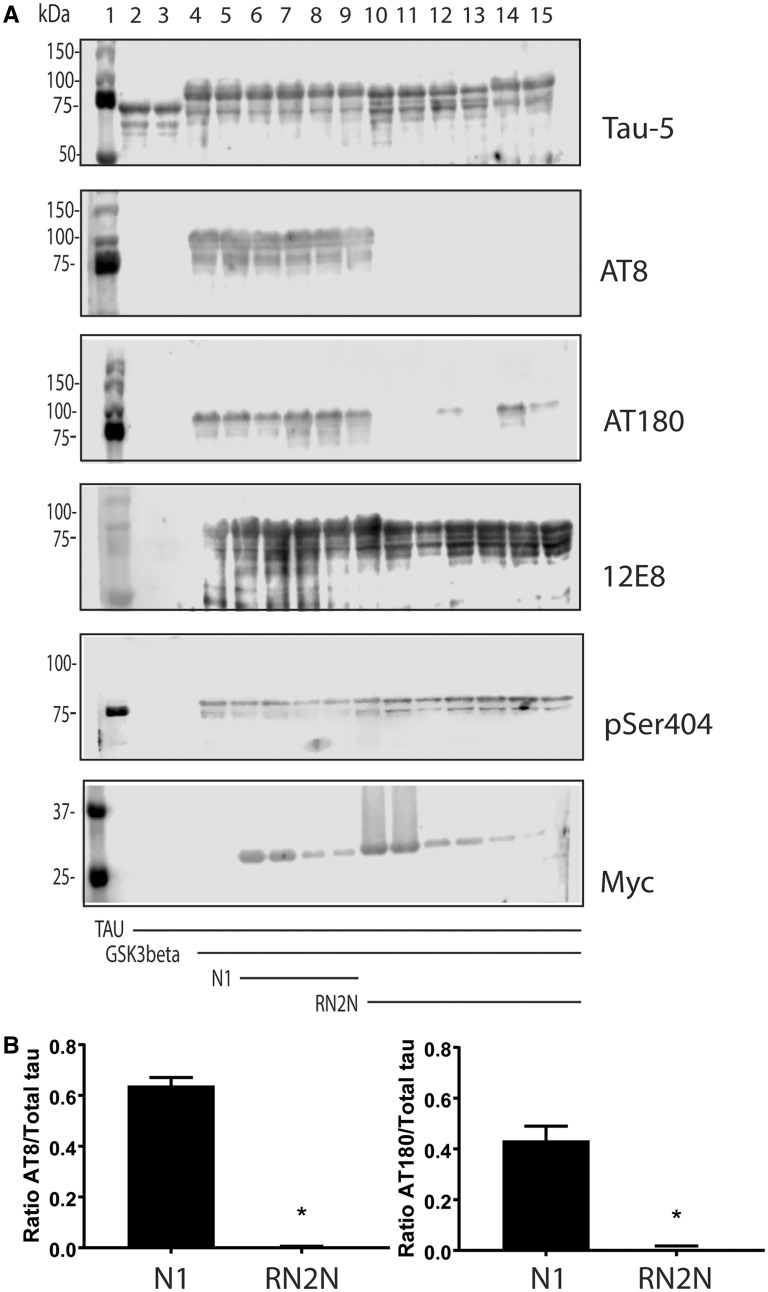
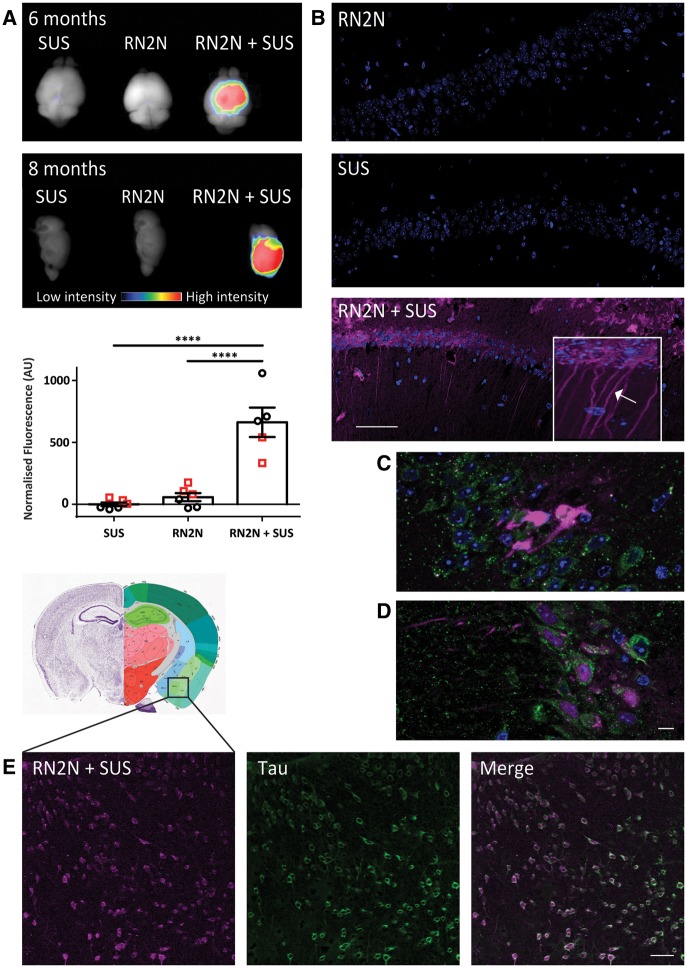
Alzheimer's disease is characterized by the deposition of amyloid-β as extracellular plaques and hyperphosphorylated tau as intracellular neurofibrillary tangles. Tau pathology characterizes not only Alzheimer's disease, but also many other tauopathies, presenting tau as an attractive therapeutic target. Passive tau immunotherapy has been previously explored; however, because only a small fraction of peripherally delivered antibodies crosses the blood-brain barrier, enters the brain and engages with tau that forms intracellular aggregates, more efficient ways of antibody delivery and neuronal uptake are warranted. In the brain, tau exists as multiple isoforms. Here, we investigated the efficacy of a novel 2N tau isoform-specific single chain antibody fragment, RN2N, delivered by passive immunization in the P301L human tau transgenic pR5 mouse model. We demonstrate that, in treated mice, RN2N reduces anxiety-like behaviour and phosphorylation of tau at distinct sites. When administration of RN2N was combined with focused ultrasound in a scanning mode (scanning ultrasound), RN2N delivery into the brain and uptake by neurons were markedly increased, and efficacy was significantly enhanced. Our study provides evidence that scanning ultrasound is a viable tool to enhance the delivery of biologics across the blood-brain barrier and improve therapeutic outcomes and further presents single-chain antibodies as an alternative to full-length antibodies.
Overview
The claims and statistics of this paper haven’t been checked yet.
Run the check — free, no account needed. It reads the open-access text and checks the sources it cites.
Integrity signals
Registry
Cites
Statistics
Figures
Verification
Claims the paper makes
The claims and statistics of this paper haven’t been checked yet.
Run the check — free, no account needed. It reads the open-access text and checks the sources it cites.
Claims other papers make about this one
Each is checked against this paper’s own text: does it say what the citing paper says it does?
In the citing paper
“Moreover, antibody fragments have been shown to reduce tau levels in vivo225,226.”
From Tau-targeting therapies for Alzheimer disease (2018) · cites this paper as [225]
Self-check
Percentages, sums and reported differences re-computed from the paper’s own numbers.
The self-check needs the paper’s full text.
Citations
Cites
Amyloid oligomers exacerbate tau pathology in a mouse model of tauopathy
Selenica, M.-L. B., Brownlow, M., Jimenez, J. P., Lee, D. C., Pena, G., Dickey, C. A., Gordon, M. N., & Morgan, D. (2013) · Neurodegenerative Diseases · doi:10.1159/000337230 · Cited by 10,359
The use of the elevated plus maze as an assay of anxiety-related behavior in rodents
Walf, A. A., & Frye, C. A. (2007) · Nature Protocols · doi:10.1038/nprot.2007.44 · Cited by 3,035
Dendritic Function of Tau Mediates Amyloid-β Toxicity in Alzheimer's Disease Mouse Models
Ittner, L. M., Ke, Y. D., Delerue, F., Bi, M., Gladbach, A., van Eersel, J., Wölfing, H., Chieng, B. C., Christie, M. J., Napier, I. A., et al. (2010) · Cell · doi:10.1016/j.cell.2010.06.036 · Cited by 1,821
Self-citationVarghese, F., Bukhari, A. B., Malhotra, R., & De, A. (2014) · PLoS ONE · doi:10.1371/journal.pone.0096801 · Cited by 1,318
Goedert, M., & Jakes, R. (1990) · The EMBO Journal · doi:10.1002/j.1460-2075.1990.tb07870.x · Cited by 929 · cited 1×
“In the adult human brain, 2N tau is under-represented compared to the 0N and 1N isoforms and is estimated to comprise 9% of total tau (Goedert and Jakes, 1990).”
Yanamandra, K., Kfoury, N., Jiang, H., Mahan, T. E., Ma, S., Maloney, S. E., Wozniak, D. F., Diamond, M. I., & Holtzman, D. M. (2013) · Neuron · doi:10.1016/j.neuron.2013.07.046 · Cited by 574
Scanning ultrasound removes amyloid-β and restores memory in an Alzheimer’s disease mouse model
Leinenga, G., & Götz, J. (2015) · Science Translational Medicine · doi:10.1126/scitranslmed.aaa2512 · Cited by 498
Self-citationTau filament formation in transgenic mice expressing P301L tau
Götz, J., Chen, F., Barmettler, R., & Nitsch, R. M. (2001) · Journal of Biological Chemistry · doi:10.1074/jbc.m006531200 · Cited by 495
Self-citationBiernat, J., Mandelkow, E. M., Schröter, C., Lichtenberg‐Kraag, B., Steiner, B., Berling, B., Meyer, H., Mercken, M., Vandermeeren, A., & Goedert, M. (1992) · The EMBO Journal · doi:10.1002/j.1460-2075.1992.tb05204.x · Cited by 484
Jordão, J. F., Ayala‐Grosso, C. A., Markham, K. A., Huang, Y., Chopra, R., McLaurin, J., Hynynen, K., & Aubert, I. (2010) · PLoS ONE · doi:10.1371/journal.pone.0010549 · Cited by 390
Cited by
Sorted by citations
Tau-targeting therapies for Alzheimer disease
Congdon, E. E., & Sigurdsson, E. M. (2018) · Nature Reviews Neurology · doi:10.1038/s41582-018-0013-z · Cited by 1,113
Blood-brain barrier opening in Alzheimer’s disease using MR-guided focused ultrasound
Lipsman, N., Meng, Y., Bethune, A. J., Huang, Y., Lam, B., Masellis, M., Herrmann, N., Heyn, C., Aubert, I., Boutet, A., et al. (2018) · Nature Communications · doi:10.1038/s41467-018-04529-6 · Cited by 950
The blood-brain barrier: Physiology and strategies for drug delivery
Pandit, R., Chen, L., & Götz, J. (2020) · Advanced Drug Delivery Reviews · doi:10.1016/j.addr.2019.11.009 · Cited by 651
Self-citationApplications of focused ultrasound in the brain: from thermoablation to drug delivery
Meng, Y., Hynynen, K., & Lipsman, N. (2020) · Nature Reviews Neurology · doi:10.1038/s41582-020-00418-z · Cited by 528
Abrahao, A., Meng, Y., Llinas, M., Huang, Y., Hamani, C., Mainprize, T., Aubert, I., Heyn, C., Black, S. E., Hynynen, K., et al. (2019) · Nature Communications · doi:10.1038/s41467-019-12426-9 · Cited by 476
Amyloid-β and tau complexity — towards improved biomarkers and targeted therapies
Polanco, J. C., Li, C., Bodea, L., Martínez‐Mármol, R., Meunier, F. A., & Götz, J. (2017) · Nature Reviews Neurology · doi:10.1038/nrneurol.2017.162 · Cited by 386
Self-citationTau-targeting therapies for Alzheimer disease: Current status and future directions
Congdon, E. E., Ji, C., Tetlow, A. M., Jiang, Y., & Sigurdsson, E. M. (2023) · Nature Reviews Neurology · doi:10.1038/s41582-023-00883-2 · Cited by 371
Blood-brain barrier opening with focused ultrasound in Parkinson’s disease dementia
Gasca-Salas, C., Fernández-Rodríguez, B., Pineda-Pardo, J. A., Rodríguez-Rojas, R., Obeso, I., Hernández-Fernández, F., del Álamo, M., Mata, D., Guida, P., Ordás-Bandera, C., et al. (2021) · Nature Communications · doi:10.1038/s41467-021-21022-9 · Cited by 319
Dendritic Tau in Alzheimer’s Disease
Ittner, A., & Ittner, L. M. (2018) · Neuron · doi:10.1016/j.neuron.2018.06.003 · Cited by 278
Tau-based therapies in neurodegeneration: opportunities and challenges
Li, C., & Götz, J. (2017) · Nature Reviews Drug Discovery · doi:10.1038/nrd.2017.155 · Cited by 272
Self-citationA review on advances of treatment modalities for Alzheimer's disease
Thoe, E. S., Fauzi, A., Tang, Y.-Q., Chamyuang, S., & Chia, A. Y. Y. (2021) · Life Sciences · doi:10.1016/j.lfs.2021.119129 · Cited by 234
Xia, Y., Prokop, S., & Giasson, B. I. (2021) · Molecular Neurodegeneration · doi:10.1186/s13024-021-00460-5 · Cited by 227
Peripheral immune system in aging and Alzheimer’s disease
Cao, W., & Zheng, H. (2018) · Molecular Neurodegeneration · doi:10.1186/s13024-018-0284-2 · Cited by 214
Intersection of pathological tau and microglia at the synapse
Vogels, T., Murgoci, A.-N., & Hromádka, T. (2019) · Acta Neuropathologica Communications · doi:10.1186/s40478-019-0754-y · Cited by 197
“Indeed, peripheral or AAVmediated delivery of tau scFv (without an Fc domain) seems to be an effective therapeutic approach in tauopathy mice [145, 224, 283, 306].”
Ruan, S., Zhou, Y., Jiang, X., & Gao, H. (2021) · Advanced Science · doi:10.1002/advs.202004025 · Cited by 200
Nanobody-based CAR-T cells for cancer immunotherapy
Kozani, P. S., Naseri, A., Mirarefin, S. M. J., Salem, F., Nikbakht, M., Bakhshi, S. E., & Kozani, P. S. (2022) · Biomarker Research · doi:10.1186/s40364-022-00371-7 · Cited by 189
Limorenko, G., & Lashuel, H. A. (2021) · Chemical Society Reviews · doi:10.1039/d1cs00127b · Cited by 168
Applications of focused ultrasound-mediated blood-brain barrier opening
Gorick, C. M., Breza, V. R., Nowak, K. M., Cheng, V. W. T., Fisher, D. G., Debski, A. C., Hoch, M. R., Demir, Z. E. F., Tran, N. M., Schwartz, M. R., et al. (2022) · Advanced Drug Delivery Reviews · doi:10.1016/j.addr.2022.114583 · Cited by 144
Non-Invasive Drug Delivery across the Blood–Brain Barrier: A Prospective Analysis
Niazi, S. K. (2023) · Pharmaceutics · doi:10.3390/pharmaceutics15112599 · Cited by 155
Exploiting the mechanical effects of ultrasound for noninvasive therapy
O’Reilly, M. A. (2024) · Science · doi:10.1126/science.adp7206 · Cited by 143
“In Alzheimer ’ s model mice, ultrasound modulation of the BBB in the absence of exogenous therapeutics has been shown to reduce A b plaque load ( 37 , 39 , 40 ), and improvements in tau pathology, another feature of Alzheimer ’ s disease, have also been seen ( 41 – 43 ).”
BackgroundJones, R. M., Deng, L., Leung, K., McMahon, D., O’Reilly, M. A., & Hynynen, K. (2018) · Theranostics · doi:10.7150/thno.24911 · Cited by 135
Liu, Y., Gong, Y., Xie, W., Huang, A., Yuan, X., Zhou, H., Zhu, X., Chen, X., Liu, J., Liu, J., et al. (2020) · Nanoscale · doi:10.1039/c9nr09713a · Cited by 123
Evans, H. T., Benetatos, J., van Roijen, M., Bodea, L., & Götz, J. (2019) · The EMBO Journal · doi:10.15252/embj.2018101174 · Cited by 112
“These were rehydrated using xylene and antigen retrieval was performed in citrate buffer (pH 5.8) as previously described, before being stained (Nisbet et al , 2017).”
InfluentialSelf-citationPandit, R., Leinenga, G., & Götz, J. (2019) · Theranostics · doi:10.7150/thno.34388 · Cited by 114
“In a previous study, we showed that just four ultrasound treatments to deliver a 2N tau isoform-specific antibody fragment reduced anxiety-like behavior and tau hyperphosphorylation in P301L tau-expressing pR5 mice when compared to a treatment with the antibody fragment alone [22].”
BackgroundMethodInfluentialSelf-citationTodd, N., Angolano, C., Ferran, C. J., Devor, A., Borsook, D., & McDannold, N. J. (2020) · Journal of Controlled Release · doi:10.1016/j.jconrel.2020.05.040 · Cited by 115
Curley, C. T., Sheybani, N., Bullock, T. N. J., & Price, R. J. (2017) · Theranostics · doi:10.7150/thno.21225 · Cited by 111
Advances and considerations in AD tau-targeted immunotherapy
Bittar, A., Bhatt, N. N., & Kayed, R. (2019) · Neurobiology of Disease · doi:10.1016/j.nbd.2019.104707 · Cited by 106
“, 2013), most antibodies are too bulky to enter the neuron for intracellular-tau clearance (Nisbet et al., 2017; Wu et al., 2018).”
BackgroundKarakatsani, M. E., Kugelman, T., Ji, R., Murillo, M. F., Wang, S., Niimi, Y., Small, S. A., Duff, K., & Konofagou, E. E. (2019) · Theranostics · doi:10.7150/thno.28717 · Cited by 101
Leinenga, G., Koh, W. K., & Götz, J. (2021) · Alzheimer's Research & Therapy · doi:10.1186/s13195-021-00809-4 · Cited by 97
Self-citationCurrent Status of Clinical Trials on Tau Immunotherapies
Ji, C., & Sigurdsson, E. M. (2021) · Drugs · doi:10.1007/s40265-021-01546-6 · Cited by 96
Shen, Y., Hua, L., Yeh, C., Shen, L., Ying, M., Zhang, Z., Liu, G., Li, S., Chen, S., Chen, X., et al. (2020) · Theranostics · doi:10.7150/thno.44152 · Cited by 101
McMahon, D., Poon, C., & Hynynen, K. (2019) · Expert Opinion on Drug Delivery · doi:10.1080/17425247.2019.1567490 · Cited by 95
“Surface cortical structures [30,44,47,48] and deep brain structures, such as the hippocampus [43] and basal ganglia [35], have been successfully targeted”
BackgroundDubey, S., Heinen, S., Krantic, S. M., McLaurin, J., Branch, D. R., Hynynen, K., & Aubert, I. (2020) · Proceedings of the National Academy of Sciences · doi:10.1073/pnas.1908658117 · Cited by 95
Optimizing intracellular antibodies (intrabodies/nanobodies) to treat neurodegenerative disorders
Messer, A. C., & Butler, D. C. (2019) · Neurobiology of Disease · doi:10.1016/j.nbd.2019.104619 · Cited by 91
Oikari, L. E., Pandit, R., Stewart, R., Cuní‐López, C., Quek, H., Sutharsan, R., Rantanen, L. M., Oksanen, M., Lehtonen, Š., de Boer, C. M., et al. (2020) · Stem Cell Reports · doi:10.1016/j.stemcr.2020.03.011 · Cited by 87
“Ultrasound has been used to facilitate delivery of an anti-Ab antibody to reduce plaque burden (Jordao et al., 2010) and a tau-specific antibody fragment to reduce pathological tau and improve associated behaviors (Nisbet et al., 2017).”
BackgroundMethodInfluentialSelf-citationTau immunotherapies: Lessons learned, current status and future considerations
Sandusky-Beltran, L. A., & Sigurdsson, E. M. (2020) · Neuropharmacology · doi:10.1016/j.neuropharm.2020.108104 · Cited by 90
Meng, Y., Goubran, M., Rabin, J. S., McSweeney, M., Ottoy, J., Pople, C. B., Huang, Y., Storace, A., Ozzoude, M., Bethune, A., et al. (2023) · Brain · doi:10.1093/brain/awac459 · Cited by 83
Therapeutic Agent Delivery Across the Blood–Brain Barrier Using Focused Ultrasound
McMahon, D., O’Reilly, M. A., & Hynynen, K. (2021) · Annual Review of Biomedical Engineering · doi:10.1146/annurev-bioeng-062117-121238 · Cited by 83
Xhima, K., Nabbouh, F., Hynynen, K., Aubert, I., & Tandon, A. (2018) · Movement Disorders · doi:10.1002/mds.101 · Cited by 86
Poon, C., Shah, K., Lin, C., Tse, R., Kim, K. K., Mooney, S. J., Aubert, I., Stefanovic, B., & Hynynen, K. (2018) · Scientific Reports · doi:10.1038/s41598-018-32250-3 · Cited by 83
Ultrasound as a versatile tool for short- and long-term improvement and monitoring of brain function
Blackmore, D. G., Razansky, D., & Götz, J. (2023) · Neuron · doi:10.1016/j.neuron.2023.02.018 · Cited by 75
Self-citationJanowicz, P. W., Leinenga, G., Götz, J., & Nisbet, R. M. (2019) · Scientific Reports · doi:10.1038/s41598-019-45577-2 · Cited by 81
Self-citationSigurdsson, E. M. (2018) · Journal of Alzheimer s Disease · doi:10.3233/jad-179937 · Cited by 76
“Also, these two studies used ultrasound [74] or vectored expression [75] of the anti-tau scFvs, which further complicates direct comparison with standard whole antibody therapy design.”
Striatal Blood–Brain Barrier Opening in Parkinson's Disease Dementia: A Pilot Exploratory Study
Pineda‐Pardo, J. A., Gasca‐Salas, C., Fernández‐Rodríguez, B., Rodríguez‐Rojas, R., del Álamo, M., Obeso, I., Hernández‐Fernández, F., Trompeta, C., Martínez‐Fernández, R., Matarazzo, M., et al. (2022) · Movement Disorders · doi:10.1002/mds.29134 · Cited by 78
Gopalan, D., Pandey, A. P., Udupa, N., & Mutalik, S. (2019) · Journal of Controlled Release · doi:10.1016/j.jconrel.2019.12.034 · Cited by 75
Burks, S. R., Kersch, C. N., Witko, J. A., Pagel, M. A., Sundby, M., Muldoon, L. L., Neuwelt, E. A., & Frank, J. A. (2021) · Proceedings of the National Academy of Sciences · doi:10.1073/pnas.2021915118 · Cited by 76
Kovacs‐Balint, Z., Tu, T., Sundby, M., Qureshi, F. M., Lewis, B. K., Jikaria, N. R., Burks, S. R., & Frank, J. A. (2018) · Theranostics · doi:10.7150/thno.24512 · Cited by 73
Focused Ultrasound Combined with Microbubbles in Central Nervous System Applications
Chen, K., Wei, K., & Liu, H. (2021) · Pharmaceutics · doi:10.3390/pharmaceutics13071084 · Cited by 77
Tau Immunotherapies for Alzheimer’s Disease and Related Tauopathies: Progress and Potential Pitfalls
Sigurdsson, E. M. (2018) · Journal of Alzheimer s Disease · doi:10.3233/jad-189010 · Cited by 67
Fischell, J. M., & Fishman, P. S. (2021) · Frontiers in Neuroscience · doi:10.3389/fnins.2021.747726 · Cited by 66
Protection of MCC950 against Alzheimer's disease via inhibiting neuronal pyroptosis in SAMP8 mice
Li, J., Zhuang, L., Luo, X., Liang, J., Sun, E., & He, Y. (2020) · Experimental Brain Research · doi:10.1007/s00221-020-05916-6 · Cited by 68
Safety and Efficacy of Scanning Ultrasound Treatment of Aged APP23 Mice
Leinenga, G., & Götz, J. (2018) · Frontiers in Neuroscience · doi:10.3389/fnins.2018.00055 · Cited by 66
“…of the transient opening of the BBB. Interestingly, we found that tau pathology (being mostly intraneuronal) could also be partially cleared with this approach as shown in the pR5 transgenic mouse model of tauopathy which accumulates hyperphosphorylated tau in neurons (Nisbet et al., 2017).”
BackgroundMethodSelf-citationBlackmore, D. G., Turpin, F. R., Palliyaguru, T., Evans, H. T., Chicoteau, A., Lee, W., Pelekanos, M., Nguyen, N., Song, J. H., Sullivan, R., et al. (2021) · Molecular Psychiatry · doi:10.1038/s41380-021-01129-7 · Cited by 64
“In the SUS mode, a motorized positioning system moves the focus of the transducer array in a grid such that the ultrasound is delivered sequentially to the entire brain [3, 4].”
BackgroundMethodSelf-citationReconsidering the role of blood-brain barrier in Alzheimer’s disease: From delivery to target
Sousa, J. A., Bernardes, C., Bernardo-Castro, S., Lino, M. M., Albino, I., Ferreira, L., Brás, J., Guerreiro, R. J., Tábuas‐Pereira, M., Baldeiras, I., et al. (2023) · Frontiers in Aging Neuroscience · doi:10.3389/fnagi.2023.1102809 · Cited by 67
Current and emerging brain applications of MR-guided focused ultrasound
Meng, Y., Suppiah, S., Mithani, K., Solomon, B., Schwartz, M. L., & Lipsman, N. (2017) · Journal of Therapeutic Ultrasound · doi:10.1186/s40349-017-0105-z · Cited by 62
“More recently, the same group demonstrated ultrasound delivered RN2N, an antibody to tau, reduced phosphorylated tau levels in a transgenic TauP301L mouse [85].”
BackgroundPelekanos, M., Leinenga, G., Odabaee, M., Odabaee, M., Saifzadeh, S., Steck, R., & Götz, J. (2018) · Theranostics · doi:10.7150/thno.22852 · Cited by 58
Self-citationWasielewska, J. M., & White, A. R. (2022) · Pharmaceutical Research · doi:10.1007/s11095-022-03185-2 · Cited by 67
Beccaria, K., Sabbagh, A., de Groot, J., Canney, M. S., Carpentier, A. C., & Heimberger, A. B. (2020) · Journal of Neuro-Oncology · doi:10.1007/s11060-020-03425-8 · Cited by 57
Blood–brain barrier opening with focused ultrasound in experimental models of Parkinson's disease
Karakatsani, M. E., Blesa, J., & Konofagou, E. E. (2019) · Movement Disorders · doi:10.1002/mds.27804 · Cited by 58
“On the other hand, FUS enhanced antibody delivery, increasing the clearance of proteins.(61) Subsequently to these experiments, BBB opening with FUS was started in 5 AD patients with early to moderate AD in a phase I safety trial.”
BackgroundMethodCurrent and Emerging Strategies for Enhancing Antibody Delivery to the Brain
Bajracharya, R., Caruso, A. C., Vella, L. J., & Nisbet, R. M. (2021) · Pharmaceutics · doi:10.3390/pharmaceutics13122014 · Cited by 55
Self-citationEfficacy of gene delivery to the brain using AAV and ultrasound depends on serotypes and brain areas
Kofoed, R. H., Dibia, C. L., Noseworthy, K., Xhima, K., Vacaresse, N., Hynynen, K., & Aubert, I. (2022) · Journal of Controlled Release · doi:10.1016/j.jconrel.2022.09.048 · Cited by 59
ImmunoPET-informed sequence for focused ultrasound-targeted mCD47 blockade controls glioma
Sheybani, N., Breza, V. R., Paul, S., McCauley, K. S., Berr, S. S., Miller, G. W., Neumann, K. D., & Price, R. J. (2021) · Journal of Controlled Release · doi:10.1016/j.jconrel.2021.01.023 · Cited by 56
Nisbet, R. M., & Götz, J. (2018) · Journal of Alzheimer s Disease · doi:10.3233/jad-179907 · Cited by 57
Self-citationLiu, X., Naomi, S. S. M., Sharon, W. L., & Russell, E. J. (2021) · Aging and Disease · doi:10.14336/ad.2021.0510 · Cited by 60
“SUS equipped with a motorized positioning system can move the transducer in small increments to cover large anatomic regions and is often used for whole brain drug delivery [7, 33].”
BackgroundMethodInfluentialJones, R. M., & Hynynen, K. (2018) · British Journal of Radiology · doi:10.1259/bjr.20180601 · Cited by 46
Ultrasonic technologies in imaging and drug delivery
Ho, Y.-J., Huang, C., Fan, C., Liu, H., & Yeh, C. (2021) · Cellular and Molecular Life Sciences · doi:10.1007/s00018-021-03904-9 · Cited by 44
The blood-brain barrier, a key bridge to treat neurodegenerative diseases
Hang, Z., Zhou, L., Xing, C., Wen, Y., & Du, H. (2023) · Ageing Research Reviews · doi:10.1016/j.arr.2023.102070 · Cited by 46
Blackmore, D. G., Turpin, F. R., Mohamed, A. Z., Zong, F., Pandit, R., Pelekanos, M., Nasrallah, F. A., Sah, P., Bartlett, P. F., & Götz, J. (2018) · Theranostics · doi:10.7150/thno.27941 · Cited by 43
“Ultrasound-mediated BBB opening (termed obicodilation by us [1]) has proven effective and safe in removing toxic protein aggregates in a range of Alzheimer's mouse models, either on its own [15,18-21], or in combination with a therapeutic”
InfluentialSelf-citationRapid and Effective Generation of Nanobody Based CARs using PCR and Gibson Assembly
Munter, S. D., Parys, A. V., Bral, L., Ingels, J., Goetgeluk, G., Bonte, S., Pille, M., Billiet, L., Weening, K., Verhee, A., et al. (2020) · International Journal of Molecular Sciences · doi:10.3390/ijms21030883 · Cited by 46
“aggregate on the T cell surface and therefore not induce premature T cell activation and exhaustion [19]; (ii) will not lose affinity, a possible and known side effect in the design of scFvs [14,15].”
BackgroundRen, W., Xu, Y., Huang, Z., Li, Y., Tu, Z., Zou, L., He, Q., Fu, J., Liu, S., & Hammock, B. D. (2020) · Food Chemistry · doi:10.1016/j.foodchem.2020.126546 · Cited by 42
Exosomes and ultrasound: The future of theranostic applications
Sridharan, B., & Lim, H. G. (2023) · Materials Today Bio · doi:10.1016/j.mtbio.2023.100556 · Cited by 41
Focused ultrasound mitigates pathology and improves spatial memory in Alzheimer's mice and patients
Karakatsani, M. E., Ji, R., Murillo, M. F., Kugelman, T., Kwon, N., Lao, Y., Liu, K., Pouliopoulos, A. N., Honig, L. S., Duff, K., et al. (2023) · Theranostics · doi:10.7150/thno.79898 · Cited by 49
Focused ultrasound in Parkinson's disease: A twofold path toward disease modification
Foffani, G., Trigo‐Damas, I., Pineda‐Pardo, J. A., Blesa, J., Rodríguez‐Rojas, R., Martínez‐Fernández, R., & Obeso, J. A. (2019) · Movement Disorders · doi:10.1002/mds.27805 · Cited by 45
Annadurai, N., Sanctis, J. B. D., Hajdúch, M., & Das, V. (2021) · Experimental Neurology · doi:10.1016/j.expneurol.2021.113756 · Cited by 41
Wasielewska, J. M., Chaves, J. C. S., Johnston, R. L., Milton, L. A., Hernández, D., Chen, L., Song, J. H., Lee, W., Leinenga, G., Nisbet, R. M., et al. (2022) · Theranostics · doi:10.7150/thno.72685 · Cited by 41
Self-citationChen, L., Sutharsan, R., Lee, J. L., Cruz, E., Asnicar, B., Palliyaguru, T., Wasielewska, J. M., Gaudin, A., Song, J. H., Leinenga, G., et al. (2022) · Theranostics · doi:10.7150/thno.65539 · Cited by 43
“[44, 45], chemotherapeutic drugs such as doxorubicin or methotrexate [46, 47], antibodies in various formats [48-51], and as viral vectors for gene therapy [52].”
BackgroundSelf-citationFocused ultrasound gene delivery for the treatment of neurological disorders
Kofoed, R. H., & Aubert, I. (2024) · Trends in Molecular Medicine · doi:10.1016/j.molmed.2023.12.006 · Cited by 44
Liu, N., Liang, X., Chen, Y., & Xie, L. (2024) · Ageing Research Reviews · doi:10.1016/j.arr.2024.102199 · Cited by 44
Zhang, C., Ötjengerdes, R., Roewe, J., Mejı́as, R., & Marschall, A. L. J. (2020) · BioDrugs · doi:10.1007/s40259-020-00419-w · Cited by 44
de Koning, L. A., Vazquez-Matias, D. A., Beaino, W., Vugts, D. J., van Dongen, G. A. M. S., van der Flier, W. M., Ries, M. G., van Vuurden, D. G., Vijverberg, E. G. B., & van de Giessen, E. (2025) · The Journal of Prevention of Alzheimer s Disease · doi:10.1016/j.tjpad.2025.100204 · Cited by 41
Guo, P., Zeng, M., Wang, S., Cao, B., Liu, M., Zhang, Y., Jia, J., Zhang, Q., Zhang, B., Wang, R., et al. (2022) · Molecules · doi:10.3390/molecules27082488 · Cited by 37
“The most common pathological feature in the brain of AD patients is the accumulation of amyloid Aβ plaques and intracellular neurofibrillary tangles (NFTs) composed of hyperphosphorylated p-Tau protein [3,4].”
BackgroundAdeno‐associated virus‐based Alzheimer's disease mouse models and potential new therapeutic avenues
Ittner, L. M., Klugmann, M., & Ke, Y. D. (2019) · British Journal of Pharmacology · doi:10.1111/bph.14637 · Cited by 36
“…intracellular Aβ when delivered via rAAV2 into the brains of 2‐month‐old 3xTgAD mice, significantly reducing both Aβ and Tau pathology burden (Sudol et al., 2009). scFvs targeting Tau protein have also shown efficacy in preventing neuropathology and deficits in pR5 mice (Nisbet et al., 2017).”
BackgroundThe Blood-Brain Barrier in Alzheimer’s Disease
Storck, S. E., Hartz, A. M. S., & Pietrzik, C. U. (2020) · Handbook of experimental pharmacology · doi:10.1007/164_2020_418 · Cited by 31
Leinenga, G., Koh, W. K., & Götz, J. (2019) · Brain Research Bulletin · doi:10.1016/j.brainresbull.2019.08.002 · Cited by 31
Self-citationChen, L., Cruz, E., Oikari, L. E., Padmanabhan, P., Song, J. H., & Götz, J. (2022) · Advanced Drug Delivery Reviews · doi:10.1016/j.addr.2022.114517 · Cited by 35
Self-citationNovel models for Parkinson’s disease and their impact on future drug discovery
Trigo‐Damas, I., del Rey, N. L., & Blesa, J. (2018) · Expert Opinion on Drug Discovery · doi:10.1080/17460441.2018.1428556 · Cited by 31
“Several attempts have been made to specifically target AD pathology with ultrasound, either to deliver an Aβ-specific antibody [105] to or just scanning over the skull to open the BBB throughout the brain [106], resulting in a reduction in plaque burden and monomeric and oligomeric Aβ species.”
BackgroundBenn, J., Mukadam, A. S., & McEwan, W. A. (2021) · Seminars in Cell and Developmental Biology · doi:10.1016/j.semcdb.2021.09.012 · Cited by 31
Focused ultrasound and Alzheimer’s disease A systematic review
Souza, R. M. D. C. E., da Silva, I. C. S., Delgado, A. B. T., da Silva, P. H. V., & Costa, V. R. X. (2018) · Dementia & Neuropsychologia · doi:10.1590/1980-57642018dn12-040003 · Cited by 30
Spencer, B. J., Brüschweiler, S., Sealey‐Cardona, M., Rockenstein, E. M., Adame, A., Florio, J. B., Mante, M., Trinh, I., Rissman, R. A., Konrat, R., et al. (2018) · Acta Neuropathologica · doi:10.1007/s00401-018-1869-0 · Cited by 30
“While other investigators have developed svFvs against the 2 N Tau splice variant [60], p-Tau [49] or the GSK3ß phosphorylation region at the N-terminus of Tau [38], we specifically targeted the 3-repeat Tau.”
Clinical relevance of animal models in aging-related dementia research
Padmanabhan, P., & Götz, J. (2023) · Nature Aging · doi:10.1038/s43587-023-00402-4 · Cited by 30
Self-citationMR-guided focused ultrasound in movement disorders and beyond: Lessons learned and new frontiers
Natera‐Villalba, E., Ruiz-Yanzi, M.-A., Gasca‐Salas, C., Matarazzo, M., & Martínez‐Fernández, R. (2024) · Parkinsonism & Related Disorders · doi:10.1016/j.parkreldis.2024.106040 · Cited by 28
Scanning ultrasound-mediated memory and functional improvements do not require amyloid-β reduction
Leinenga, G., To, X. V., Bodea, L., Yousef, J. M., Richter-Stretton, G. L., Palliyaguru, T., Chicoteau, A., Dagley, L. F., Nasrallah, F. A., & Götz, J. (2024) · Molecular Psychiatry · doi:10.1038/s41380-024-02509-5 · Cited by 29
“Here, we explored two frequencies: We used 1 MHz (in the following, we term this SUS only paradigm HighF), a frequency routinely used in mice for the purpose of BBB opening [8, 15] and via intracranially implanted transducers in AD patients [13].”
InfluentialSelf-citationUltrasound-Mediated Diagnosis and Therapy based on Ultrasound Contrast Agents
Yoon, Y. I., Tang, W., & Chen, X. S. (2017) · Small Methods · doi:10.1002/smtd.201700173 · Cited by 27
Павлов, А. Н., Dubrovsky, A. I., Koronovskii, A. A., Pavlova, O. N., SEMYACHKINA-GLUSHKOVSKAYA, O. V., & Kurths, J. (2020) · Chaos An Interdisciplinary Journal of Nonlinear Science · doi:10.1063/5.0011823 · Cited by 27
Bajracharya, R., Cruz, E., Götz, J., & Nisbet, R. M. (2022) · Journal of Controlled Release · doi:10.1016/j.jconrel.2022.07.026 · Cited by 27
Self-citationNeuronally expressed anti-tau scFv prevents tauopathy-induced phenotypes in Drosophila models
Krishnaswamy, S., Huang, H.-W., Marchal, I. S., Ryoo, H. D., & Sigurdsson, E. M. (2020) · Neurobiology of Disease · doi:10.1016/j.nbd.2020.104770 · Cited by 24
Weber‐Adrian, D., Kofoed, R. H., Silburt, J., Noroozian, Z., Shah, K., Burgess, A., Rideout, S., Kügler, S., Hynynen, K., & Aubert, I. (2021) · Scientific Reports · doi:10.1038/s41598-021-81046-5 · Cited by 27
Capilla-López, M. D., Deprada-Fernandez, Á., Andrade‐Talavera, Y., Martínez‐Gallego, I., Coatl-Cuaya, H., Sotillo, P. S., Rodríguez-Álvarez, J., Moreno, A. R., Parra‐Damas, A., & Saura, C. A. (2025) · Molecular Psychiatry · doi:10.1038/s41380-025-02901-9 · Cited by 33
Ng, P. Y., Chang, I. S., Koh, R. Y., & Chye, S. M. (2020) · Metabolic Brain Disease · doi:10.1007/s11011-020-00591-6 · Cited by 25
“SUS-enhanced delivery method increased the amount of antibody delivered to the brain and neurons (Nisbet et al. 2017).”
BackgroundMethodInfluentialBok, J., Ha, J., Ahn, B. J., & Jang, Y. (2022) · International Journal of Molecular Sciences · doi:10.3390/ijms24010679 · Cited by 25
Metadata
- Authors
- Nisbet, R. M., Van der Jeugd, A., Leinenga, G., Evans, H. T., Janowicz, P. W., & Götz, J.
- Affiliations
- The University of Queensland (AU)
- Clem Jones Centre for Ageing Dementia Research, Queensland Brain Institute, The University of Queensland, St Lucia Campus, Brisbane, QLD 4072, Australia
- Corresponding author
- Götz, Jürgen
- Venue
- Brain
- Publisher
- Oxford University Press (OUP)
- Published
- 2017-04-04
- Volume
- 140
- Issue
- 5
- Pages
- 1220-1230
- ISSN
- 0006-8950 (ISSN-L)
- 1460-2156
- PMC
- PMC5405237
- OpenAlex
- W2605011026
- Cited by
- 187
- References
- 46
- Citations by year
- 2026: 7 · 2025: 15 · 2024: 22 · 2023: 17 · 2022: 20 · 2021: 31 · 2020: 25 · 2019: 17 · 2018: 25 · 2017: 8
- FWCI
- 15.18
- Type
- journal article
- Language
- en
- Open access
- hybrid
- doi.org
- Licence
- Locations
- Brain (publishedVersion, cc-by-nc)
- Europe PMC (PubMed Central) (publishedVersion, cc-by-nc)
- PubMed Central (publishedVersion, cc-by-nc)
- PubMed (publishedVersion)
- Funders
- estate of Dr Clem Jones AO
- State Government of Queensland
- Federal Government of Australia (ACT900116)
- The Brain Foundation
- Australian Research Council (DP13300101932)
- National Health and Medical Research Council of Australia (APP1037746, APP1003150)
- Topics
- Life Sciences › Neuroscience › Cellular and Molecular Neuroscience › Alzheimer's disease research and treatments
- Physical Sciences › Engineering › Biomedical Engineering › Ultrasound and Hyperthermia Applications
- Life Sciences › Neuroscience › Neurology › Barrier Structure and Function Studies
- Keywords
- tau pathology, Alzheimer's disease, single-chain antibody, passive immunotherapy, blood-brain barrier, tau phosphorylation, anxiety-like behavior, tau immunotherapy
- MeSH terms
- Animals, Antibodies, Brain, Combined Modality Therapy, Disease Models, Animal, Humans, Immunization, Passive, Mice, Transgenic, Neurons, Phosphorylation, Ultrasonic Therapy, tau Proteins, Maze Learning, Protein Isoforms, Tauopathies, Mice
About these checks
Registry, retraction, Cites and statistics results are computed, not judged, with one exception: a printed reference that no index lists is read once by a model before it counts as a citation error. Claims are extracted by a model and kept only when their quote appears verbatim in the text; each cited source is then checked, with a model’s help, for whether it says what the claim relies on. Those verdicts can be wrong — read the claim’s quote and the cited source before relying on one.
Statistics and arithmetic are recomputed, not judged.
Confidence bands are shown only for fields calibrated on our annotated test set. None is calibrated yet, so no band is shown.
What counts as a claim ›How we measure confidence ›How we check this ›
Are you an author, or do you see a problem with this page? Request a review
