

The DOI matches its Crossref record; 105 of the 105 references it cites were found in a registry or an index; 54 of the 64 sources its claims cite were checked for support.
Confronting false discoveries in single-cell differential expression
Open accessAbstract
Differential expression analysis in single-cell transcriptomics enables the dissection of cell-type-specific responses to perturbations such as disease, trauma, or experimental manipulation. While many statistical methods are available to identify differentially expressed genes, the principles that distinguish these methods and their performance remain unclear. Here, we show that the relative performance of these methods is contingent on their ability to account for variation between biological replicates. Methods that ignore this inevitable variation are biased and prone to false discoveries. Indeed, the most widely used methods can discover hundreds of differentially expressed genes in the absence of biological differences. Our results suggest an urgent need for a paradigm shift in the methods used to perform differential expression analysis in single-cell data.
Overview
AI snapshot
Written from the paper’s full text.
TL;DR
The paper benchmarks 14 differential expression methods on 18 ground-truth datasets and finds that pseudobulk methods, which aggregate cells within biological replicates, outperform single-cell methods. Methods that ignore between-replicate variation are biased toward highly expressed genes and can produce hundreds of false discoveries even without biological differences.
Key findings
- In 18 ground-truth datasets, all six top-performing DE methods aggregated cells within biological replicates to form pseudobulks; pseudobulk versus single-cell differences were highly significant and robust to concordance methodology.
- Single-cell DE methods were biased toward highly expressed genes: false positives were more highly expressed, abundant ERCC spike-ins were incorrectly called DE, and a compendium of 46 scRNA-seq datasets showed a systematic preference for highly expressed genes.
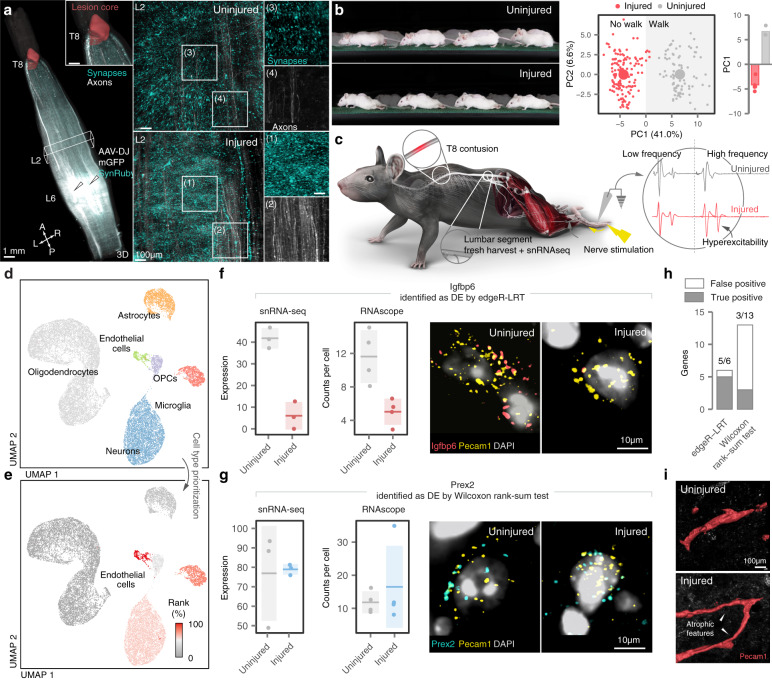
- Failing to account for biological replicates produced false discoveries: simulations identified hundreds of DE genes with no perturbation; random splits of unstimulated controls in 14 datasets produced excess false positives; spatial transcriptomics identified thousands of DE genes within each spinal cord region.
- In injured mouse spinal cord snRNA-seq (19,237 nuclei), RNAscope validated 5 of 6 genes called by edgeR-LRT versus 3 of 13 called by Wilcoxon rank-sum (p < 0.05, χ² test); GLMMs converged to pseudobulk performance in datasets of 500 or more cells and took an average of 13.5 h per cell type versus minutes for pseudobulk methods.
Methods
- Literature review of 500 recent scRNA-seq studies, of which 205 conducted DE analysis between biological conditions, identified 14 methods: 7 single-cell methods, 6 pseudobulk methods, and 1 linear mixed model.
- The study used 18 ground-truth datasets from four publications with matched bulk and scRNA-seq in the same purified cells, perturbations, and laboratories; concordance was measured by area under the concordance curve (AUCC) and rank correlation, with GO term enrichment, a 46-dataset scRNA-seq compendium, Splatter simulations, 14 control-group datasets, spatial transcriptomics, and spinal cord injury snRNA-seq plus RNAscope.
- Additional analyses disabled pseudobulk aggregation, created pseudo-replicates by shuffling replicates, compared variance between biological replicates and pseudo-replicates, and evaluated Poisson or negative binomial GLMMs.
Limitations
- The paper does not include a dedicated limitations section. It states that the enormous computational requirements of GLMMs prevented evaluation in the full ground-truth datasets, so downsampled datasets of 25–1,000 cells were used; the ground-truth resource was limited to 18 datasets from four publications.
- Evident from the text: simulations used parameters estimated from the Kang et al. dataset and may not capture all biological or technical heterogeneity; the in vivo RNAscope validation screened selected putatively DE genes rather than all DE genes; and human-versus-mouse variability conclusions rely on the assembled compendium datasets.
Model-written summary. Check it against the paper before relying on it.
Integrity signals
Registry
Cites
Statistics
Figures
Verification
Claims the paper makes
88 Own result · 47 Own interpretation · 14 Partly supported · 9 No basis given · 7 Supported · 5 Couldn’t confirm · 4 No full text of the sources · 3 Own method · 1 Mixed support · accuracy not yet measured
Some cited sources support this claim and some don’t — read each source’s verdict below.
In the paper
“Within our compendium, we identified a total of fourteen studies with control groups that included six or more samples5,6,15,49–59.”
§ Confronting false discoveries in single-cell differential expression > Methods > Analysis of published scRNA-seq control groups
What the sources say
- Supportedcites [5] source
The citation identifies a study eligible for the citing authors’ compendium, rather than attributing the tally of fourteen studies to Kang et al. In Methods > IFN-β stimulation and culture (page not provided), the paper reports eight untreated samples pooled as the control condition, meeting the six-sample threshold. (LLM, conf=0.92)
- Supportedcites [6] 2019, Single-cell transcriptomic analysis of Alzheimer’s disease, Nature source
The Methods section (‘Selection of individuals from the Religious Order Study (ROS) cohort’) says this study selected 24 no-pathology controls and 24 individuals with AD pathology. It therefore qualifies as a study with at least six control samples. The total of fourteen studies describes the citing authors’ compendium, not a finding attributed to this individual source. (LLM, conf=0.91)
- Supportedcites [15] source
The Results section (‘Lung aging atlas reveals deregulated transcriptional control’; page not provided) reports single-cell data from eight young mice and seven old mice. This supports citing the paper as one study with a control group of at least six samples; the total of fourteen studies is the citing authors’ count of their compendium, not a count attributed to this source alone. (LLM, conf=0.92)
- Supportedcites [49] 2020, Single-nucleus transcriptomics of the prefrontal cortex in major depressive disorder implicates oligodendrocyte precursor cells and excitatory neurons, Nat. Neu-rosci source
This paper is cited as one of the studies in the compendium, not as the source of the compendium-wide count. Its Table 1 reports 17 controls, exceeding the six-sample threshold. (LLM, conf=0.91)
- Supportedcites [50] source
The citation identifies this paper as one of the studies in the citing authors’ compendium with at least six control samples; the count of fourteen is the citing authors’ own tally. The Methods (Subjects and specimen collection) state that blood was collected from six asymptomatic control donors, and the Abstract likewise reports six healthy controls. (LLM, conf=0.92)
- Partly supportedcites [51] sourceExperimental — accuracy not yet measured
The Fig. 9 caption reports six Sham/Veh controls for behavioral tests, so this paper does contain a control group of six. But the Methods report only three Sham samples in the Drop-seq data and four per group selected for T4-treatment sequencing. The paper cannot establish the citing authors’ count of fourteen studies or show that this study had six control sequencing samples. (LLM, conf=0.84)
- Disputedcites [52] 2018, Single-cell RNA-seq uncovers a robust transcriptional response to morphine by glia, Cell Rep sourceExperimental — accuracy not yet measured
The cited paper is one study, so it cannot establish the compendium-wide total of fourteen. For its own control group, STAR⋆METHODS reports four mock-treatment biological replicates in the single-cell analysis, not six or more samples; its bulk RNA-seq analysis reports three mock-treatment replicates. (LLM, conf=0.86)
Checked by a reasoning model — may be wrong.
- Partly supportedcites [53] sourceExperimental — accuracy not yet measured
The study description (section labeled Abstract; page not provided) reports uninjured, intact-tail samples alongside amputated-tail samples, supporting its identification as a study with a control condition. It says there were at least two biological replicates per condition, but does not establish that the control group had six or more samples. The count of fourteen studies is the citing authors’ compendium count, not a finding attributed to this individual source. (LLM, conf=0.77)
- Supportedcites [54] 2019, Cell type-specific transcriptional programs in mouse prefrontal cortex during adolescence and addiction, Nat. Commun source
This citation identifies one study included in the citing authors’ compendium; it is not offered as evidence for the compendium-wide count of fourteen. The Methods (Animals; Tissue collection and library preparation, pages unavailable) report 12 mice in each saline and cocaine group, with two mice pooled per biological replicate, yielding six control replicates. (LLM, conf=0.91)
- Disputedcites [55] 2020, Single cell transcriptome profiling of the human alcohol-dependent brain, Hum. Mol. Genet sourceExperimental — accuracy not yet measured
The Results and Discussion section (page unavailable) says this study included four control donors, not six or more. The Conclusions section likewise describes seven donors in total: three with alcohol dependence and four controls. This source therefore cannot support its inclusion as a study meeting the stated control-group threshold; it does not address the compendium-wide count of fourteen. (LLM, conf=0.91)
Checked by a reasoning model — may be wrong.
plainn = 14- Asserted: passes — The authors put it forward as true.
- Checkable: passes — It can be checked against evidence.
- Load-bearing: passes — The paper’s conclusions depend on it.
- Based: passes — The paper gives a reason why it holds.
- Rests on an assumption: The 46 published scRNA-seq datasets in the compendium are representative of single-cell RNA-seq studies generally.
- Supported
Every source the paper cites for this claim was checked and supports it.
In the paper
“Moreover, comparisons to matching proteomics data 13 revealed that pseudobulk methods also more accurately predicted changes in protein abundance (Supplementary Fig. 1e-f ).”
What the sources say
- Supportedcites [13] 2018, Gene expression variability across cells and species shapes innate immunity, Nature source
Citation 13 is attached to the matching proteomics data, not to the pseudobulk-versus-single-cell comparison, which the citing authors report from their own Supplementary Fig. 1e–f. The source’s Methods (‘Cell state specific gene signatures’; page unavailable) describes matching its proteomics and RNA-seq data by gene name, supporting its identification as the data source. (LLM, conf=0.88)
plaincorrelational- Asserted: passes — The authors put it forward as true.
- Checkable: passes — It can be checked against evidence.
- Load-bearing: passes — The paper’s conclusions depend on it.
- Based: passes — The paper gives a reason why it holds.
- Supported
Every source the paper cites for this claim was checked and supports it.
In the paper
“Within the same experimental condition, replicates exhibit inherent differences in gene expression, which reflect both biological and technical factors 22 .”
What the sources say
- Supportedcites [22] source
The Discussion’s “Outlook” section describes biological and technical components of gene-expression variation among single-cell samples from the same biological condition. The Results section on batch effects also reports substantial variation between technical replicates from the same individual. Page numbers are not provided in our copy. (LLM, conf=0.89)
plaindirect- Asserted: passes — The authors put it forward as true.
- Checkable: passes — It can be checked against evidence.
- Load-bearing: passes — The paper’s conclusions depend on it.
- Based: passes — The paper gives a reason why it holds.
- Supported
Every source the paper cites for this claim was checked and supports it.
In the paper
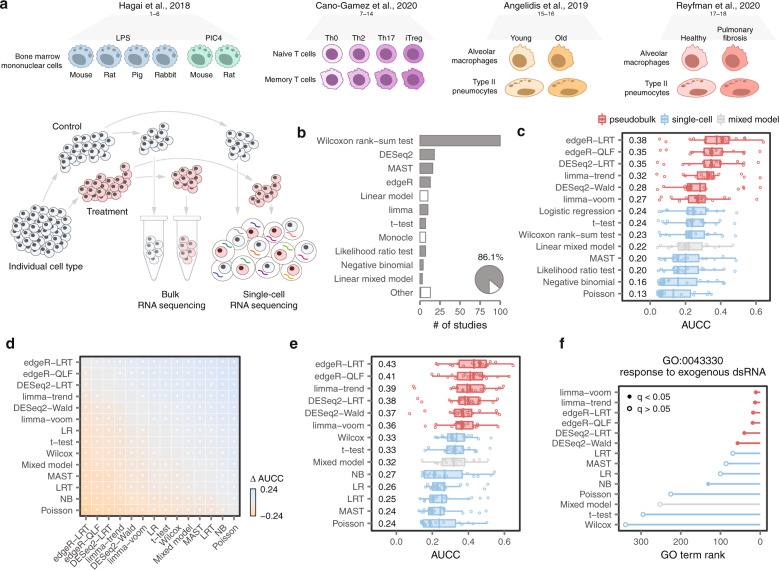
“This analysis immediately revealed that all six of the top-performing methods shared a common analytical property. These methods aggregated cells within a biological replicate, to form so-called ‘pseudobulks’, before applying a statistical test (Fig. 1c ) 18 .”
What the sources say
- Supportedcites [18] source
Section 3.1 describes summing counts across cells within each plate, then using those sums for DE testing with plates treated as replicates. The statement that six methods were top-performing is presented as the citing authors’ own analysis, not a finding attributed to this source. (LLM, conf=0.87)
plain- Asserted: passes — The authors put it forward as true.
- Checkable: passes — It can be checked against evidence.
- Load-bearing: passes — The paper’s conclusions depend on it.
- Based: passes — The paper gives a reason why it holds.
- Supported
The cited sources that could be checked couldn’t confirm or dispute this claim.
In the paper
“For example, single-cell methods failed to identify the relevant GO term when comparing mouse phagocytes stimulated with poly(I:C) 12 , a synthetic double-stranded RNA (Fig. 1f ).”
What the sources say
- Could not verifycites [12] sourceExperimental — accuracy not yet measured
The Methods section on bone marrow-derived phagocytes reports poly(I:C) stimulation of rodent cells and single-cell analysis, but does not report whether a GO term was identified. Searches for GO-term enrichment and a failure to identify a term found no passage addressing the claimed result. (LLM, conf=0.76)
plainSingle case- Asserted: passes — The authors put it forward as true.
- Checkable: passes — It can be checked against evidence.
- Load-bearing: passes — The paper’s conclusions depend on it.
- Based: passes — The paper gives a reason why it holds.
- Could not verify
The cited sources support only part of this claim — read each source’s verdict below.
In the paper
“An extensive survey of the literature identified a total of eighteen ‘gold standard’ datasets that met these criteria (Fig. 1a ) 12 – 15 .”
What the sources say
- Supportedcites [12] source
The Methods (Cross-species dermal fibroblast stimulation with dsRNA and IFNB; page unavailable) describe both bulk and single-cell RNA-seq of stimulated fibroblasts, including a shared main stimulation time point. The citation identifies this paper as a source of a qualifying dataset, not as the source of the citing authors’ literature survey or its total of eighteen datasets. (LLM, conf=0.86)
- Supportedcites [13] 2018, Gene expression variability across cells and species shapes innate immunity, Nature source
The citation identifies this paper as one of the datasets, rather than attributing the citing authors’ literature survey or total of eighteen to it. The Introduction and Results (Study design; page unavailable) describe bulk and single-cell profiling of purified CD4+ T-cell populations exposed to cytokine conditions, supporting that identification. (LLM, conf=0.87)
- Supportedcites [14] 2020, Single-cell transcriptomics identifies an effectorness gradient shaping the response of CD4+ T cells to cytokines, Nat. Commun source
This citation identifies one of the datasets in the citing authors’ eighteen-dataset survey; it does not attribute the survey’s total to Angelidis et al. The source’s Results (‘Cell type-specific effects of aging’; page unavailable) report scRNA-seq comparisons with bulk RNA-seq of flow-sorted epithelial cells and macrophages from young and old mice. (LLM, conf=0.86)
- Partly supportedcites [15] sourceExperimental — accuracy not yet measured
Split into 2 atoms — 0 confirmed, 1 partially supported, 0 disputed, 0 misattributed, 1 unverifiable. Expand the claim to see per-atom verdicts.
plain- Asserted: passes — The authors put it forward as true.
- Checkable: passes — It can be checked against evidence.
- Load-bearing: passes — The paper’s conclusions depend on it.
- Based: passes — The paper gives a reason why it holds.
- Supported
The cited sources support only part of this claim — read each source’s verdict below.
In the paper
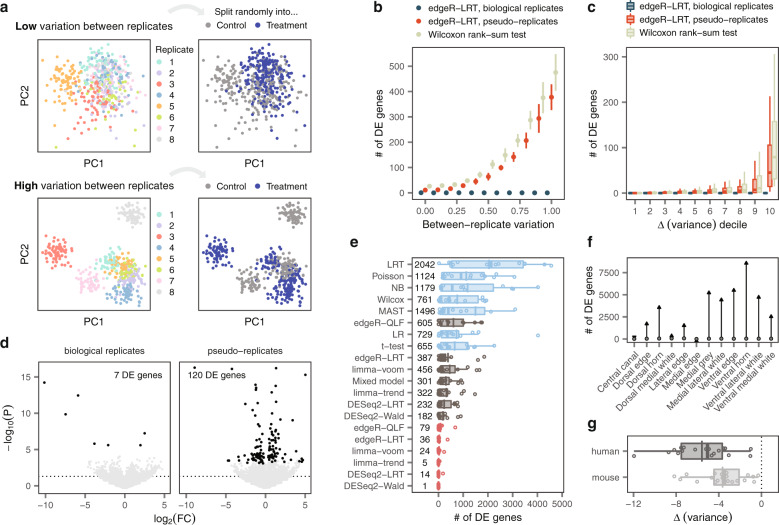
“This unbiased analysis indicated that endothelial cells underwent the most profound transcriptional changes in the spinal cord below the injury (Fig. 5e ).”
What the sources say
- Partly supportedcites [27] sourceExperimental — accuracy not yet measured
The paper’s Abstract describes applying Augur to lumbar spinal-cord cells after injury, but its spinal-cord prioritization focuses on interneuron subtypes. The Abstract reports profound changes in endothelial cells in Alzheimer’s disease datasets, not in the spinal cord below an injury. It therefore supports the use of Augur in a spinal-cord injury setting, but not the attributed endothelial-cell finding. (LLM, conf=0.86)
- Not checked — no full text of the sourcecites [28] 2020, A curated database reveals trends in single-cell transcriptomics, Database source
hedgeddirect- Asserted: passes — The authors put it forward as true.
- Checkable: passes — It can be checked against evidence.
- Load-bearing: passes — The paper’s conclusions depend on it.
- Based: passes — The paper gives a reason why it holds.
- Partly supported
The cited sources support only part of this claim — read each source’s verdict below.
In the paper
“Several of the validated edgeR-LRT genes, including Slc7a11 and Igfbp6 , are involved in the response to hypoxia within endothelial cells, supporting the establishment of a chronically hypoxic state in the lumbar spinal cord 31 – 33 .”
What the sources say
- Partly supportedcites [31] sourceExperimental — accuracy not yet measured
The section “HIF regulates antioxidant defenses in hypoxic cells” (page unavailable) says hypoxia induces SLC7A11 expression in breast cancer cells. It does not establish that SLC7A11 or Igfbp6 responds to hypoxia in endothelial cells, and the retrieved passages do not address Igfbp6. (LLM, conf=0.88)
- Supportedcites [32] source
The Results section reports that hypoxia significantly increased IGFBP-6 expression in human endothelial cells, with similar induction observed in rat brain vessel endothelial cells. This supports the Igfbp6–endothelial hypoxia link for which this source is cited; the edgeR-LRT validation and lumbar spinal cord interpretation are the citing authors’ own findings and inference. (LLM, conf=0.92)
- Could not verifycites [33] sourceExperimental — accuracy not yet measured
The Results section, “Endogenous trace amines induce hypoxia after SCI” (page unavailable), reports chronic hypoxia in spinal cord tissue caudal to injury. But the paper’s mRNA analysis (Online Methods; page unavailable) does not identify Slc7a11 or Igfbp6 or describe either gene’s role in endothelial-cell responses to hypoxia. Searches for both gene names found no matching passage. (LLM, conf=0.75)
plaincorrelational- Asserted: passes — The authors put it forward as true.
- Checkable: passes — It can be checked against evidence.
- Load-bearing: unclear — It is unclear whether the paper’s conclusions depend on it.
- Based: passes — The paper gives a reason why it holds.
- Partly supported
The cited sources support only part of this claim — read each source’s verdict below.
In the paper
“However, these studies relied almost entirely on synthetic data, supplemented by a few illustrative case studies.”
What the sources say
- Supportedcites [18] source
Section 2.2 describes simulations used to test differential-expression methods, while Section 4.1 describes an analysis of one real mouse embryonic stem-cell dataset to assess the relevance of the simulation results. This supports the characterization of this paper as relying mainly on synthetic data with a real-data case study; it does not establish the same pattern for every study implied by “these studies.” (LLM, conf=0.88)
- Partly supportedcites [34] sourceExperimental — accuracy not yet measured
The Results (Simulation; no page available) describe this paper’s simulation study, and the Discussion (no page available) says it also examined a few independent real datasets. That supports the characterization of this paper’s approach, but the copy does not establish that previous studies generally relied almost entirely on synthetic data or used real data only as illustrative case studies. (LLM, conf=0.78)
plain- Asserted: passes — The authors put it forward as true.
- Checkable: passes — It can be checked against evidence.
- Load-bearing: passes — The paper’s conclusions depend on it.
- Based: passes — The paper gives a reason why it holds.
- Supported
The cited sources support only part of this claim — read each source’s verdict below.
In the paper
“the most widely used analysis packages in the field currently employ DE methods prone to false discoveries by default 35 , 36 .”
What the sources say
- Could not verifycites [35] sourceExperimental — accuracy not yet measured
The STAR Methods (Quantification and statistical analysis; page unavailable) describe differential-expression testing with Seurat’s FindMarkers, but specify a test rather than identifying its default. Our copy does not assess whether widely used packages’ default DE methods are prone to false discoveries (searched: false discoveries, false positives, and default DE tests). (LLM, conf=0.76)
- Partly supportedcites [36] sourceExperimental — accuracy not yet measured
The Results section ('SCANPY integrates canonical analysis methods in a scalable way'; page unavailable) says SCANPY identifies marker genes using differential expression tests. The Background also identifies established single-cell analysis frameworks. Neither passage says the most widely used packages employ such tests by default or that their methods are prone to false discoveries. (LLM, conf=0.78)
plaindirect- Asserted: passes — The authors put it forward as true.
- Checkable: passes — It can be checked against evidence.
- Load-bearing: passes — The paper’s conclusions depend on it.
- Based: passes — The paper gives a reason why it holds.
- Could not verify
- It may state two separate claims as one. 21
- Probably not a substantial claim. 21
- The quote only partly states this claim. 2
The cited sources support only part of this claim — read each source’s verdict below.
In the paper
“The presence of variability between replicates is unavoidable, and can be attributed to both technical factors and intrinsic biological differences 22 .”
What the sources say
- Partly supportedcites [22] sourceExperimental — accuracy not yet measured
The Results section, “Batch effects associated with UMI-based single cell data” (page unavailable), reports variation associated with both individual origin and technical C1 batches. The paper supports those two sources of variation in its single-cell study, but does not establish that variability between replicates is universally unavoidable. (LLM, conf=0.82)
plaindirect- Asserted: passes — The authors put it forward as true.
- Checkable: passes — It can be checked against evidence.
- Load-bearing: passes — The paper’s conclusions depend on it.
- Based: passes — The paper gives a reason why it holds.
It may state two separate claims as one.
- Partly supported
Every source the paper cites for this claim was checked and supports it.
In the paper
“By explicitly modeling variation both within and between biological replicates, mixed models should benefit from increased statistical power compared to pseudobulk methods 9 .”
What the sources say
- Supportedcites [9] 2020, muscat detects subpopulation-specific state transitions from multi-sample multi-condition singlecell transcriptomics data, Nat. Commun source
The Discussion says pseudobulk aggregation loses within-sample variance information and reports decreased power relative to mixed-effects models. The Power Analysis (Fig. 3) likewise reports a large loss of power for aggregation methods across many sample sizes. The supplied passages identify sections but do not give page numbers. (LLM, conf=0.94)
hedgedconditional- Asserted: passes — The authors put it forward as true.
- Checkable: passes — It can be checked against evidence.
- Load-bearing: passes — The paper’s conclusions depend on it.
- Based: passes — The paper gives a reason why it holds.
Probably not a substantial claim.
- Supported
The cited sources support only part of this claim — read each source’s verdict below.
In the paper
“Previous benchmarks of DE analysis methods for single-cell transcriptomics have relied heavily on simulated data, or else have compared the results of different methods in scenarios where no ground truth was available 10 , 17 .”
What the sources say
- Partly supportedcites [10] 2021, A practical solution to pseudoreplication bias in single-cell studies, Nat. Commun sourceExperimental — accuracy not yet measured
The Introduction describes this paper’s benchmark of 16 single-cell differential-state analysis methods using simulated data, so it supports the simulation-based part by example. Its discussion of earlier comparison studies (Introduction; page unavailable) does not say they relied heavily on simulations or compared methods without ground truth. The latter claim is not supported by this source. (LLM, conf=0.82)
- Not checked — no full text of the sourcecites [17] source
plain- Asserted: passes — The authors put it forward as true.
- Checkable: passes — It can be checked against evidence.
- Load-bearing: passes — The paper’s conclusions depend on it.
- Based: passes — The paper gives a reason why it holds.
It may state two separate claims as one.
- Partly supported
Every source the paper cites for this claim was checked and supports it.
In the paper
“The possibility that conflating variability between replicates with the biological effect of interest can lead to spurious findings has previously been recognized 18 , 34 .”
What the sources say
- Supportedcites [18] source
The Introduction says that variability between replicate plates can explain apparent differential expression between groups and that ignoring plate effects can produce spurious findings. Section 2.3 reports that plate effects led to false positives in the authors’ simulations. The supplied passages do not specify page numbers. (LLM, conf=0.93)
- Supportedcites [34] source
The Discussion says that pseudoreplication has been addressed repeatedly and that failing to account for correlation among non-independent replicates inflates type 1 errors and produces spurious results. It also reports false positives from treating cells within an individual as independent. The supplied passages have no page numbers. (LLM, conf=0.93)
plaindirect- Asserted: passes — The authors put it forward as true.
- Checkable: passes — It can be checked against evidence.
- Load-bearing: fails — The paper’s conclusions may not depend on it.
- Based: passes — The paper gives a reason why it holds.
Probably not a substantial claim. The paper’s conclusions may not depend on it.
- Supported
The cited sources support only part of this claim — read each source’s verdict below.
In the paper
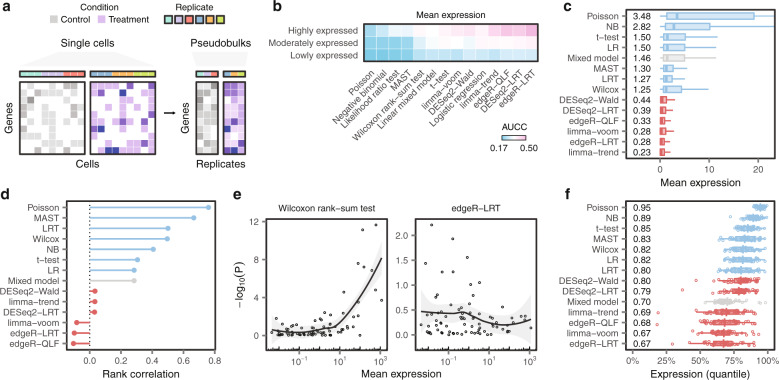
“Previous studies demonstrated that inferences about DE are generally more accurate for highly expressed genes19,20.”
§ Confronting false discoveries in single-cell differential expression > Results > Single-cell DE methods are biased towards highly expressed genes
What the sources say
- Could not verifycites [19] sourceExperimental — accuracy not yet measured
Section 4.2 discusses how summation affects DE rankings and the significance of genes driven by outlier cells, but it does not compare inference accuracy by gene expression level. Searches for highly and lowly expressed genes likewise found no passage in our copy establishing that DE inferences are generally more accurate for highly expressed genes. (LLM, conf=0.70)
- Partly supportedcites [20] sourceExperimental — accuracy not yet measured
The section “Most statistical analysis methods for RNA-seq suffer from high FDRs” reports that false-positive DE calls tended to involve genes with lower expression. The Discussion likewise links low-expression false positives to large datasets analyzed with parametric methods. This supports the direction of the claim, but the paper does not establish that DE inferences are generally more accurate for highly expressed genes across methods and conditions. (LLM, conf=0.82)
boostedcorrelational- Asserted: passes — The authors put it forward as true.
- Checkable: passes — It can be checked against evidence.
- Load-bearing: passes — The paper’s conclusions depend on it.
- Based: passes — The paper gives a reason why it holds.
Probably not a substantial claim.
- Could not verify
Every source the paper cites for this claim was checked and supports it.
In the paper
“The sparsity and heterogeneity of single-cell data initially encouraged the development of specialized statistical methods to identify differentially expressed mRNAs7,8.”
§ Confronting false discoveries in single-cell differential expression > Introduction
What the sources say
- Supportedcites [7] source
The Abstract describes drop-out events, technical noise and biological variability as challenges for differential-expression analysis. It then introduces a specialized Bayesian method for detecting differential expression in single-cell RNA-seq data, supporting the cited paraphrase. (LLM, conf=0.92)
- Supportedcites [8] source
The Background describes sparse, bimodal single-cell expression and biological variability as challenges for analysis. It also describes a specialized method developed to test differential gene expression while accounting for that pattern; the Conclusion identifies MAST as another such framework. (LLM, conf=0.91)
plaindirect- Asserted: passes — The authors put it forward as true.
- Checkable: passes — It can be checked against evidence.
- Load-bearing: fails — The paper’s conclusions may not depend on it.
- Based: passes — The paper gives a reason why it holds.
Probably not a substantial claim. The paper’s conclusions may not depend on it.
- Supported
The cited sources support only part of this claim — read each source’s verdict below.
In the paper
“The maturation of single-cell technologies now enables large-scale comparisons of cell states within complex tissues, thus providing the appropriate resolution to dissect cell-type-specific responses to perturbation5,6.”
§ Confronting false discoveries in single-cell differential expression > Introduction
What the sources say
- Partly supportedcites [5] sourceExperimental — accuracy not yet measured
The paper reports profiling thousands of cells and identifying cell-type-specific responses to IFN-β stimulation in peripheral blood immune cells (Abstract; page unavailable). It does not demonstrate large-scale comparisons within complex tissues: the same section says applying the method to solid tissue remains challenging. (LLM, conf=0.86)
- Supportedcites [6] 2019, Single-cell transcriptomic analysis of Alzheimer’s disease, Nature source
The Abstract describes profiling 80,660 single-nucleus transcriptomes across 48 brains and using the resulting cellular-level view to identify cell-type-specific responses to AD pathology. The Discussion reports pathology-responsive signatures across six major cell types and 40 subpopulations. This directly exemplifies the large-scale, cell-resolved comparison attributed to the source. (LLM, conf=0.91)
plaindirect- Asserted: passes — The authors put it forward as true.
- Checkable: passes — It can be checked against evidence.
- Load-bearing: fails — The paper’s conclusions may not depend on it.
- Based: passes — The paper gives a reason why it holds.
Probably not a substantial claim. The paper’s conclusions may not depend on it. It may state two separate claims as one.
- Partly supported
The cited sources that could be checked couldn’t confirm or dispute this claim.
In the paper
“We specifically focused on the lumbar spinal cord, since this region undergoes multifaceted changes that lead to the irreversible degradation of neuronal function25,26.”
§ Confronting false discoveries in single-cell differential expression > Results > True and false discoveries in the injured mouse spinal cord
What the sources say
- Not checked — no full text of the sourcecites [25] source
- Could not verifycites [26] Hao, Y. et al. Integrated analysis of multimodal single-cell data. Preprint at http://doi.org/10.1101/2020.10.12.335331 (2020). sourceExperimental — accuracy not yet measured
The Results passages concern immune-cell populations, and the Discussion describes multimodal single-cell analysis; neither addresses changes in the lumbar spinal cord or neuronal function after injury. Searches for the claimed spinal-cord injury and neuronal-degradation terms found no relevant passage in our copy. No page numbers were provided. (LLM, conf=0.78)
plaindirect- Asserted: passes — The authors put it forward as true.
- Checkable: passes — It can be checked against evidence.
- Load-bearing: passes — The paper’s conclusions depend on it.
- Based: passes — The paper gives a reason why it holds.
Probably not a substantial claim.
The cited sources support only part of this claim — read each source’s verdict below.
In the paper
“Several of the validated edgeR-LRT genes, including Slc7a11 and Igfbp6, are involved in the response to hypoxia within endothelial cells, supporting the establishment of a chronically hypoxic state in the lumbar spinal cord31–33.”
§ Confronting false discoveries in single-cell differential expression > Results > True and false discoveries in the injured mouse spinal cord
What the sources say
- Could not verifycites [31] sourceExperimental — accuracy not yet measured
The Methods (§2.1) describe single-cell qPCR datasets of T cells, and the Results (§3.5) evaluate a differential-expression LRT. Searches for Slc7a11, Igfbp6, endothelial hypoxia, and the lumbar spinal cord found no passage addressing the attributed biological claim. Page numbers were unavailable in our copy. (LLM, conf=0.75)
- Could not verifycites [32] sourceExperimental — accuracy not yet measured
The Results and discussion section describes DESeq2 analyses, including an example using rat dorsal root ganglion data, but does not address hypoxia in endothelial cells or the lumbar spinal cord. Searches for Slc7a11, Igfbp6, edgeR-LRT, and chronic hypoxia found no passage supporting the attributed claim. (LLM, conf=0.75)
- Partly supportedcites [33] sourceExperimental — accuracy not yet measured
The Introduction identifies edgeR as software for differential-expression analysis, supporting the reference to edgeR as a method. But the Model section describes an exact test, not an LRT, and the paper does not address Slc7a11, Igfbp6, endothelial hypoxia, or the lumbar spinal cord. It therefore cannot support the sentence’s biological conclusion. (LLM, conf=0.86)
plaincorrelational- Asserted: passes — The authors put it forward as true.
- Checkable: passes — It can be checked against evidence.
- Load-bearing: unclear — It is unclear whether the paper’s conclusions depend on it.
- Based: passes — The paper gives a reason why it holds.
It may state two separate claims as one.
- Could not verify
The cited sources support only part of this claim — read each source’s verdict below.
In the paper
“Previous benchmarks of DE analysis methods for single-cell transcriptomics have relied heavily on simulated data, or else have compared the results of different methods in scenarios where no ground truth was available10,17.”
§ Confronting false discoveries in single-cell differential expression > Methods > Ground-truth datasets
What the sources say
- Partly supportedcites [10] 2021, A practical solution to pseudoreplication bias in single-cell studies, Nat. Commun sourceExperimental — accuracy not yet measured
The Discussion (page not provided) says that papers evaluating single-cell-specific tools used simulations, supporting the simulated-data part of the claim. Our copy does not say that previous benchmarks compared methods without ground truth. (LLM, conf=0.83)
- Not checked — no full text of the sourcecites [17] source
plain- Asserted: passes — The authors put it forward as true.
- Checkable: passes — It can be checked against evidence.
- Load-bearing: passes — The paper’s conclusions depend on it.
- Based: passes — The paper gives a reason why it holds.
It may state two separate claims as one.
- Partly supported
A result the paper reports from its own data — it cites no other source for it, so there is none to check. The quote shows it is in the paper.
In the paper
“This systematic analysis confirmed that single-cell methods produced a systematic excess of false positives compared to pseudobulk methods (Fig. 4e ).”
plaindirectn = 6- Asserted: passes — The authors put it forward as true.
- Checkable: passes — It can be checked against evidence.
- Load-bearing: passes — The paper’s conclusions depend on it.
- Based: passes — The paper gives a reason why it holds.
The quote only partly states this claim.
A result the paper reports from its own data — it cites no other source for it, so there is none to check. The quote shows it is in the paper.
In the paper
“Conversely, the Wilcoxon rank-sum test and edgeR-LRT each nominated an additional 44 and 12 genes as DE, respectively (Supplementary Fig. 9a ).”
plain- Asserted: passes — The authors put it forward as true.
- Checkable: passes — It can be checked against evidence.
- Load-bearing: passes — The paper’s conclusions depend on it.
- Based: passes — The paper gives a reason why it holds.
It may state two separate claims as one.
A result the paper reports from its own data — it cites no other source for it, so there is none to check. The quote shows it is in the paper.
In the paper
“We found that the injury triggered the aberrant growth of new synapses throughout lumbar segments, combined with the emergence of abnormal segmental reflexes (Fig. 5a and Supplementary Fig. 8a ).”
plaindirect- Asserted: passes — The authors put it forward as true.
- Checkable: passes — It can be checked against evidence.
- Load-bearing: unclear — It is unclear whether the paper’s conclusions depend on it.
- Based: passes — The paper gives a reason why it holds.
It may state two separate claims as one.
A result the paper reports from its own data — it cites no other source for it, so there is none to check. The quote shows it is in the paper.
In the paper
“The differences between pseudobulk and single-cell methods were highly significant (Fig. 1d ), and robust to the methodology used to quantify concordance (Supplementary Fig. 1a-d ).”
boostedcorrelational- Asserted: passes — The authors put it forward as true.
- Checkable: passes — It can be checked against evidence.
- Load-bearing: passes — The paper’s conclusions depend on it.
- Based: passes — The paper gives a reason why it holds.
It may state two separate claims as one.
A result the paper reports from its own data — it cites no other source for it, so there is none to check. The quote shows it is in the paper.
In the paper
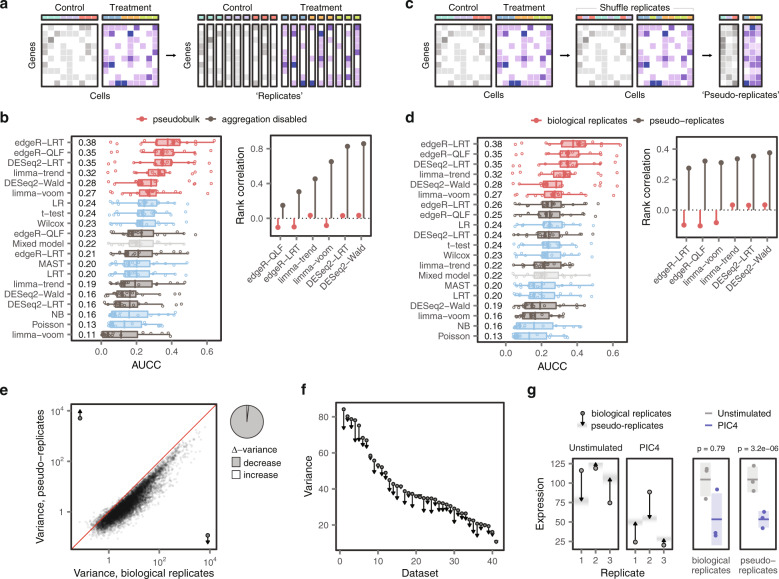
“This experiment induced a similar decrease in the performance of pseudobulk methods, combined with the re-emergence of a bias towards highly expressed genes (Fig. 3d and Supplementary Fig. 4d–f ).”
plaindirect- Asserted: passes — The authors put it forward as true.
- Checkable: passes — It can be checked against evidence.
- Load-bearing: passes — The paper’s conclusions depend on it.
- Based: passes — The paper gives a reason why it holds.
It may state two separate claims as one.
A result the paper reports from its own data — it cites no other source for it, so there is none to check. The quote shows it is in the paper.
In the paper
“Together, these methods have been used by almost 90% of recent studies (Fig. 1b ).”
plain- Asserted: passes — The authors put it forward as true.
- Checkable: passes — It can be checked against evidence.
- Load-bearing: fails — The paper’s conclusions may not depend on it.
- Based: passes — The paper gives a reason why it holds.
Probably not a substantial claim. The paper’s conclusions may not depend on it.
A result the paper reports from its own data — it cites no other source for it, so there is none to check. The quote shows it is in the paper.
In the paper
“Moreover, the computational resources required to fit the best-performing GLMMs were enormous. Even in downsampled datasets, DE analysis of a single cell type took an average of 13.5 h (Supplementary Fig. 10c-d ).”
plain- Asserted: passes — The authors put it forward as true.
- Checkable: passes — It can be checked against evidence.
- Load-bearing: passes — The paper’s conclusions depend on it.
- Based: passes — The paper gives a reason why it holds.
It may state two separate claims as one.
The paper states this without a source or data behind it here, so there is nothing to check it against. The quote shows it is in the paper.
In the paper
“we asked why mixed models failed to match the performance of pseudobulk methods.”
plain- Asserted: fails — The authors may not put it forward as true.
- Checkable: passes — It can be checked against evidence.
- Load-bearing: passes — The paper’s conclusions depend on it.
- Based: fails — The paper may give no reason why it holds.
Probably not a substantial claim. The authors may not put it forward as true. The paper may give no reason why it holds.
A result the paper reports from its own data — it cites no other source for it, so there is none to check. The quote shows it is in the paper.
In the paper
“In total, 205 of the 500 studies conducted DE analysis between biological conditions.”
plain- Asserted: passes — The authors put it forward as true.
- Checkable: passes — It can be checked against evidence.
- Load-bearing: fails — The paper’s conclusions may not depend on it.
- Based: passes — The paper gives a reason why it holds.
Probably not a substantial claim. The paper’s conclusions may not depend on it.
A result the paper reports from its own data — it cites no other source for it, so there is none to check. The quote shows it is in the paper.
In the paper
“Strikingly, single-cell methods identified hundreds of DE genes in the absence of any perturbation (Fig. 4b and Supplementary Fig. 4a).”
§ Confronting false discoveries in single-cell differential expression > Results > False discoveries in single-cell DE
plain- Asserted: passes — The authors put it forward as true.
- Checkable: passes — It can be checked against evidence.
- Load-bearing: passes — The paper’s conclusions depend on it.
- Based: passes — The paper gives a reason why it holds.
The quote only partly states this claim.
The paper states this without a source or data behind it here, so there is nothing to check it against. The quote shows it is in the paper.
In the paper
“In line with the expected consequences of chronic hypoxia, we detected the presence of numerous atrophic blood vessels below the level of injury (Fig. 5i).”
§ Confronting false discoveries in single-cell differential expression > Results > True and false discoveries in the injured mouse spinal cord
plain- Asserted: passes — The authors put it forward as true.
- Checkable: passes — It can be checked against evidence.
- Load-bearing: fails — The paper’s conclusions may not depend on it.
- Based: passes — The paper gives a reason why it holds.
Probably not a substantial claim. The paper’s conclusions may not depend on it.
A conclusion the paper draws from its own results — it cites no other source for it, so there is none to check. The quote shows it is in the paper.
In the paper
“This underestimation of the variance biases single-cell methods towards highly expressed genes, compromising their ability to generate biologically accurate results.”
plaindirect- Asserted: passes — The authors put it forward as true.
- Checkable: passes — It can be checked against evidence.
- Load-bearing: passes — The paper’s conclusions depend on it.
- Based: passes — The paper gives a reason why it holds.
It may state two separate claims as one.
A conclusion the paper draws from its own results — it cites no other source for it, so there is none to check. The quote shows it is in the paper.
In the paper
“Conversely, valid single-cell DE analysis that accounted for variation between biological replicates yielded reproducible conclusions that could be validated in vivo.”
hedgedcorrelational- Asserted: passes — The authors put it forward as true.
- Checkable: passes — It can be checked against evidence.
- Load-bearing: passes — The paper’s conclusions depend on it.
- Based: passes — The paper gives a reason why it holds.
It may state two separate claims as one.
A claim is checked only against the cited paper’s full text, never its abstract, and none is available for its sources.
In the paper
“This chaotic reorganization of circuits below the SCI has been linked to spasticity and neuronal dysfunction (Fig. 5b and Supplementary Fig. 8b-c ) 25 , 26 .”
What the sources say
plaincorrelational- Asserted: passes — The authors put it forward as true.
- Checkable: passes — It can be checked against evidence.
- Load-bearing: fails — The paper’s conclusions may not depend on it.
- Based: passes — The paper gives a reason why it holds.
Probably not a substantial claim. The paper’s conclusions may not depend on it.
A conclusion the paper draws from its own results — it cites no other source for it, so there is none to check. The quote shows it is in the paper.
In the paper
“Aggregating random groups of cells to form pseudo-replicates, or ignoring replicates altogether in comparisons of single cells, both introduced a bias towards highly expressed genes and a corresponding loss of performance.”
plaindirect- Asserted: passes — The authors put it forward as true.
- Checkable: passes — It can be checked against evidence.
- Load-bearing: passes — The paper’s conclusions depend on it.
- Based: passes — The paper gives a reason why it holds.
It may state two separate claims as one.
The paper states this without a source or data behind it here, so there is nothing to check it against. The quote shows it is in the paper.
In the paper
“Consequently, the pervasiveness of false discoveries in published analyses of single-cell data and the propensity for these false discoveries to affect the biological conclusions of a study have remained unclear.”
plain- Asserted: passes — The authors put it forward as true.
- Checkable: passes — It can be checked against evidence.
- Load-bearing: passes — The paper’s conclusions depend on it.
- Based: passes — The paper gives a reason why it holds.
Probably not a substantial claim. It may state two separate claims as one.
What the paper did — it cites no source for this, so there is none to check. The quote shows it is in the paper.
In the paper
“The enormous computational requirements of the GLMMs prevented us from evaluating these models in the full ground truth datasets; instead, we analyzed a series of downsampled datasets, each containing between 25 and 1,000 cells.”
plaindirect- Asserted: passes — The authors put it forward as true.
- Checkable: passes — It can be checked against evidence.
- Load-bearing: fails — The paper’s conclusions may not depend on it.
- Based: passes — The paper gives a reason why it holds.
Probably not a substantial claim. The paper’s conclusions may not depend on it. It may state two separate claims as one.
A conclusion the paper draws from its own results — it cites no other source for it, so there is none to check. The quote shows it is in the paper.
In the paper
“and are most likely to manifest in studies of human tissue”
hedgedcorrelational- Asserted: passes — The authors put it forward as true.
- Checkable: passes — It can be checked against evidence.
- Load-bearing: fails — The paper’s conclusions may not depend on it.
- Based: fails — The paper may give no reason why it holds.
Probably not a substantial claim. The paper’s conclusions may not depend on it. The paper may give no reason why it holds.
The paper states this without a source or data behind it here, so there is nothing to check it against. The quote shows it is in the paper.
In the paper
“We reasoned that the best possible approximation to the biological ground truth in a scRNA-seq experiment would consist of a matched bulk RNA-seq dataset in the same purified cell type, exposed to the same perturbation under identical experimental conditions, and sequenced in the same laboratory.”
hedged- Asserted: passes — The authors put it forward as true.
- Checkable: fails — It may be too vague to check against evidence.
- Load-bearing: passes — The paper’s conclusions depend on it.
- Based: fails — The paper may give no reason why it holds.
Probably not a substantial claim. It may be too vague to check against evidence. The paper may give no reason why it holds.
A conclusion the paper draws from its own results — it cites no other source for it, so there is none to check. The quote shows it is in the paper.
In the paper
“suggesting that inference at the level of biological replicates is critical to understand the cellular and molecular basis for human disease.”
hedgeddirect- Asserted: passes — The authors put it forward as true.
- Checkable: fails — It may be too vague to check against evidence.
- Load-bearing: passes — The paper’s conclusions depend on it.
- Based: passes — The paper gives a reason why it holds.
Probably not a substantial claim. It may be too vague to check against evidence.
A conclusion the paper draws from its own results — it cites no other source for it, so there is none to check. The quote shows it is in the paper.
In the paper
“Understanding these mechanisms led us to discover that the same fundamental issues affect other high-dimensional assays, including spatial transcriptomics”
plaindirect- Asserted: passes — The authors put it forward as true.
- Checkable: passes — It can be checked against evidence.
- Load-bearing: fails — The paper’s conclusions may not depend on it.
- Based: fails — The paper may give no reason why it holds.
Probably not a substantial claim. The paper’s conclusions may not depend on it. The paper may give no reason why it holds.
The paper states this without a source or data behind it here, so there is nothing to check it against. The quote shows it is in the paper.
In the paper
“However, simulations require specifying a model from which synthetic patterns of differential expression are generated.”
§ Confronting false discoveries in single-cell differential expression > Introduction
plain- Asserted: passes — The authors put it forward as true.
- Checkable: passes — It can be checked against evidence.
- Load-bearing: passes — The paper’s conclusions depend on it.
- Based: passes — The paper gives a reason why it holds.
Probably not a substantial claim.
A conclusion the paper draws from its own results — it cites no other source for it, so there is none to check. The quote shows it is in the paper.
In the paper
“Methods that ignore this inevitable variation are biased and prone to false discoveries.”
§ Confronting false discoveries in single-cell differential expression > Abstract
plaindirect- Asserted: passes — The authors put it forward as true.
- Checkable: passes — It can be checked against evidence.
- Load-bearing: passes — The paper’s conclusions depend on it.
- Based: passes — The paper gives a reason why it holds.
It may state two separate claims as one.
In the paper
“Single-cell RNA-seq (scRNA-seq) enables the quantification of RNA abundance at the resolution of individual cells4.”
§ Confronting false discoveries in single-cell differential expression > Introduction
What the sources say
- Not checked — no full text of the sourcecites [4] 2018, From tissues to cell types and back: single-cell gene expression analysis of tissue architecture, Annu. Rev. Biomed. Data Sci source
plaindirect- Asserted: passes — The authors put it forward as true.
- Checkable: passes — It can be checked against evidence.
- Load-bearing: fails — The paper’s conclusions may not depend on it.
- Based: passes — The paper gives a reason why it holds.
Probably not a substantial claim. The paper’s conclusions may not depend on it.
A conclusion the paper draws from its own results — it cites no other source for it, so there is none to check. The quote shows it is in the paper.
In the paper
“Aggregating random groups of cells to form pseudo-replicates, or ignoring replicates altogether in comparisons of single cells, both introduced a bias towards highly expressed genes and a corresponding loss of performance.”
§ Confronting false discoveries in single-cell differential expression > Results > DE analysis of single-cell data must account for biological replicates
plaindirect- Asserted: passes — The authors put it forward as true.
- Checkable: passes — It can be checked against evidence.
- Load-bearing: passes — The paper’s conclusions depend on it.
- Based: passes — The paper gives a reason why it holds.
It may state two separate claims as one.
A conclusion the paper draws from its own results — it cites no other source for it, so there is none to check. The quote shows it is in the paper.
In the paper
“We recognized that both experiments entailed a loss of information about biological replicates.”
§ Confronting false discoveries in single-cell differential expression > Results > DE analysis of single-cell data must account for biological replicates
plaindirect- Asserted: passes — The authors put it forward as true.
- Checkable: passes — It can be checked against evidence.
- Load-bearing: passes — The paper’s conclusions depend on it.
- Based: passes — The paper gives a reason why it holds.
It may state two separate claims as one.
A conclusion the paper draws from its own results — it cites no other source for it, so there is none to check. The quote shows it is in the paper.
In the paper
“While we show that accounting for biological replicates is critical for any DE analysis, this result stresses the paramount importance of addressing this issue in single-cell studies of human tissue.”
§ Confronting false discoveries in single-cell differential expression > Results > False discoveries in single-cell DE
boosteddirect- Asserted: passes — The authors put it forward as true.
- Checkable: passes — It can be checked against evidence.
- Load-bearing: passes — The paper’s conclusions depend on it.
- Based: passes — The paper gives a reason why it holds.
It may state two separate claims as one.
A conclusion the paper draws from its own results — it cites no other source for it, so there is none to check. The quote shows it is in the paper.
In the paper
“This underestimation of the variance biases single-cell methods towards highly expressed genes, compromising their ability to generate biologically accurate results.”
§ Confronting false discoveries in single-cell differential expression > Results > DE analysis of single-cell data must account for biological replicates
plaindirect- Asserted: passes — The authors put it forward as true.
- Checkable: passes — It can be checked against evidence.
- Load-bearing: passes — The paper’s conclusions depend on it.
- Based: passes — The paper gives a reason why it holds.
It may state two separate claims as one.
What the paper did — it cites no source for this, so there is none to check. The quote shows it is in the paper.
In the paper
“To evaluate the concordance of DE analysis, we used k = 500 except where otherwise noted, but found our results were insensitive to the precise value of k.”
§ Confronting false discoveries in single-cell differential expression > Methods > Measuring concordance between single-cell and bulk RNA-seq
plain- Asserted: passes — The authors put it forward as true.
- Checkable: passes — It can be checked against evidence.
- Load-bearing: fails — The paper’s conclusions may not depend on it.
- Based: passes — The paper gives a reason why it holds.
Probably not a substantial claim. The paper’s conclusions may not depend on it.
What the paper did — it cites no source for this, so there is none to check. The quote shows it is in the paper.
In the paper
“The enormous computational requirements of the GLMMs prevented us from evaluating these models in the full ground truth datasets; instead, we analyzed a series of downsampled datasets, each containing between 25 and 1,000 cells.”
§ Confronting false discoveries in single-cell differential expression > Methods > Mixed models
plaindirect- Asserted: passes — The authors put it forward as true.
- Checkable: passes — It can be checked against evidence.
- Load-bearing: fails — The paper’s conclusions may not depend on it.
- Based: passes — The paper gives a reason why it holds.
Probably not a substantial claim. The paper’s conclusions may not depend on it. It may state two separate claims as one.
The authors state this as an assumption.
The closest possible approximation to the experimental ground truth can be obtained from matched bulk and scRNA-seq performed on the same population of purified cells, exposed to the same perturbations, and sequenced in the same laboratories.
“We posited that the closest possible approximation to this ground truth could be obtained from matched bulk and scRNA-seq performed on the same population of purified cells, exposed to the same perturbations, and sequenced in the same laboratories.”
The paper relies on this without support.
Measurements of gene expression in single cells are inherently sparse.
“Measurements of gene expression in single cells are inherently sparse.”
The paper relies on this without support.
Many factors that produce variability between biological replicates can be minimized in animal models, including genetic background, environment, intensity and timing of the biological perturbation, and sample processing.
“Many of the factors that produce this variability between replicates can be minimized in animal models, including the genetic background, environment, intensity and timing of the biological perturbation, and sample processing.”
The paper relies on this without support.
Sources of variation between biological replicates are inherently more difficult to control in experiments involving human subjects.
“In contrast, these sources of variation are inherently more difficult to control in experiments involving human subjects.”
The paper relies on this without support.
The pervasiveness of false discoveries in published analyses of single-cell data and the propensity for these false discoveries to affect the biological conclusions of a study have remained unclear.
“Consequently, the pervasiveness of false discoveries in published analyses of single-cell data and the propensity for these false discoveries to affect the biological conclusions of a study have remained unclear.”
The paper relies on this without support.
The 500 most recent entries in the curated database are representative of scRNA-seq studies published in the past two years.
“we limited our analysis to the 500 most recently published studies”
The paper relies on this without support.
The 18 ground truth datasets are representative of single-cell experiments for assessing DE methods.
“which led us to compile a resource of eighteen ground truth datasets from four publications12–15”
The paper relies on this without support.
The 46 published scRNA-seq datasets in the compendium are representative of single-cell RNA-seq studies generally.
“We assembled a compendium of 46 published single-cell or single-nucleus RNA-seq studies (Supplementary Fig. 3), and performed DE analyses across this compendium to establish the generality of our conclusions.”
The paper relies on this without support.
Randomly splitting a control group into artificial control and treatment groups creates a valid null distribution for DE analysis.
“For each of these studies, we split the control group randomly into artificial ‘control’ and ‘treatment’ groups, and performed DE analysis.”
Claims other papers make about this one
Each is checked against this paper’s own text: does it say what the citing paper says it does?
The source backs part of the claim, not all of it — or backs it for a different population, condition or comparison.
In the citing paper
“Demultiplexing of pooled scRNA-seq is required to associate metadata with individual samples to account for between sample variation, replicate strengthened differential expression analysis, and confirmation of sample representation across scRNA-seq datasets and cell clusters (Squair et al, 2021; Zimmerman et al, 2021).”
From Evaluation of genetic demultiplexing of single-cell sequencing data from model species (2023) · cites this paper as Squair et al, 2021
Experimental — accuracy not yet measuredThe cited source says what the claim attributes to it.
In the citing paper
“DGE analysis was conducted using a pseudobulk approach to mitigate Type I error inflation [25].”
From Cardiac Macrophages Exhibit Dynamic Heterogeneity and Functional Specialization During Experimental Autoimmune Myocarditis. (2026) · cites this paper as [25]
The cited source says what the claim attributes to it.
In the citing paper
“This is a serious drawback as the lack of biological replicates has also been shown to be a major cause of false discoveries (Hicks et al, 2018; Squair et al, 2021).”
From Evaluation of genetic demultiplexing of single-cell sequencing data from model species (2023) · cites this paper as Squair et al, 2021
The check wasn’t confident either way, so it gives no verdict — never disputed.
In the citing paper
“suggesting that, given a sufficient sample size, pseudo-bulk expression profiles are likely suitable for co-expression network analysis.”
From hdWGCNA identifies co-expression networks in high-dimensional transcriptomics data (2023) · cites this paper as [17]
Experimental — accuracy not yet measuredIn the citing paper
“On the one hand, modeling pseudobulk counts has been demonstrated to prevent pseudo-replication bias36,37.”
From Transcriptome-wide analysis of differential expression in perturbation atlases (2025) · cites this paper as [36]
In the citing paper
“In single cell differential expression analyses, a failure to account for biological variability across supra-cellular sampling units (i.e. animal, donor, etc.) can lead to overestimation of effects; this phenomenon is referred to as “pseudoreplication bias” 36,37.”
From Transcriptome-wide analysis of differential expression in perturbation atlases (2025) · cites this paper as [36]
In the citing paper
“Previous benchmark study showed that Seurat18, DESeq226, edgeR27, and Limma25 are among the top methods in discovering differentially expressed genes using single-cell data28.”
From ASGARD is a single-cell guided pipeline to aid repurposing of drugs (2023) · cites this paper as [28]
In the citing paper
“Single-cell-specific methods were found to systematically underestimate the variance of gene expression and to be prone to wrongly labelling highly expressed genes as differentially expressed86.”
From Best practices for single-cell analysis across modalities (2023) · cites this paper as [86]
In the citing paper
“Pseudoreplication leads to an inflated false discovery rate (FDR) as DGE methods do not account for the inherent correlation of replicates (cells from the same individual)86–88.”
From Best practices for single-cell analysis across modalities (2023) · cites this paper as [86]
In the citing paper
“but methods designed for bulk RNA-seq data perform favourably84–86.”
From Best practices for single-cell analysis across modalities (2023) · cites this paper as [86]
In the citing paper
“Two benchmarking studies, one applying the aforementioned simulation tool and one using different example data sets, demonstrated that the “pseudobulk” approach in combination with classical differential gene expression methods such as edgeR44 and limma-voom45 outperforms single cell specific methods and mixed models in multi sample DE analysis43,46.”
From scPower accelerates and optimizes the design of multi-sample single cell transcriptomic studies (2021) · cites this paper as [46]
Self-check
Percentages, sums and reported differences re-computed from the paper’s own numbers.
Each contradiction between two passages listed here was confirmed by an independent check.
Rated minor: it would not touch a result — a value no result rests on, a p-value that stays on the same side of the significance level, or a conflict that is clerical, resolved elsewhere in the paper, or outside its own findings.
In the paper
§ Confronting false discoveries in single-cell differential expression > Results > False discoveries in single-cell DE
“we calculated the variability between replicates within 41 human and mouse scRNA-seq datasets.”
§ Confronting false discoveries in single-cell differential expression > Methods > Analysis of published scRNA-seq control groups
“we computed the mean ∆-variance across all genes in the 38 human or mouse scRNA-seq datasets in our compendium (n = 18 human datasets and 20 mouse datasets).”
Rated minor: it would not touch a result — a value no result rests on, a p-value that stays on the same side of the significance level, or a conflict that is clerical, resolved elsewhere in the paper, or outside its own findings.
In the paper
§ Confronting false discoveries in single-cell differential expression > Methods > Application to spinal cord injury
“7 genes identified by edgeR-LRT (Slc7a11, catalog no. 422511; Gjb2, catalog no. 518881; Pi16, catalog no. 451311; Rbp4, catalog no. 508501; Col1a1, catalog no. 319371; Igfbp6, catalog no. 425721).”
§ Confronting false discoveries in single-cell differential expression > Results > True and false discoveries in the injured mouse spinal cord
“RNAscope validated five of the six genes called as DE by edgeR-LRT.”
Citations
Cites
Moderated estimation of fold change and dispersion for RNA-seq data with DESeq2
Love, M. I., Huber, W., & Anders, S. (2014) · Genome Biology · doi:10.1186/s13059-014-0550-8 · Cited by 95,106
Subramanian, A., Tamayo, P., Mootha, V. K., Mukherjee, S., Ebert, B. L., Gillette, M. A., Paulovich, A., Pomeroy, S. L., Golub, T. R., Lander, E. S., et al. (2005) · Proceedings of the National Academy of Sciences · doi:10.1073/pnas.0506580102 · Cited by 53,625
Robinson, M. D., McCarthy, D. J., & Smyth, G. K. (2010) · Bioinformatics · doi:10.1093/bioinformatics/btp616 · Cited by 41,364
limma powers differential expression analyses for RNA-sequencing and microarray studies
Ritchie, M. E., Phipson, B., Wu, D., Hu, Y., Law, C. W., Shi, W., & Smyth, G. K. (2015) · Nucleic Acids Research · doi:10.1093/nar/gkv007 · Cited by 40,458
Integrated analysis of multimodal single-cell data
Hao, Y., Hao, S., Andersen-Nissen, E., Mauck, W. M., Zheng, S., Butler, A., Lee, M. J., Wilk, A. J., Darby, C., Zagar, M., et al. (2020) · doi:10.1101/2020.10.12.335331 · Cited by 15,508
Comprehensive Integration of Single-Cell Data
Stuart, T., Butler, A., Hoffman, P., Hafemeister, C., Papalexi, E., Mauck, W. M., Hao, Y., Stoeckius, M., Smibert, P., & Satija, R. (2019) · Cell · doi:10.1016/j.cell.2019.05.031 · Cited by 15,453
RNA-Seq: a revolutionary tool for transcriptomics
Wang, Z., Gerstein, M., & Snyder, M. (2009) · Nature Reviews Genetics · doi:10.1038/nrg2484 · Cited by 13,174
SCANPY: large-scale single-cell gene expression data analysis
Wolf, F. A., Angerer, P., & Theis, F. J. (2018) · Genome Biology · doi:10.1186/s13059-017-1382-0 · Cited by 8,881
voom: precision weights unlock linear model analysis tools for RNA-seq read counts
Law, C. W., Chen, Y., Shi, W., & Smyth, G. K. (2014) · Genome Biology · doi:10.1186/gb-2014-15-2-r29 · Cited by 6,155
McCarthy, D. J., Chen, Y., & Smyth, G. K. (2012) · Nucleic Acids Research · doi:10.1093/nar/gks042 · Cited by 5,195
Research works printed but not linked: 1
- 10.1007/978-1-4939-3578-9$\_$19 · DOI
Cited by
Sorted by citations
Items 901–1,000 of 1,210
Intersection of transient cell states with stable cell types in hippocampusPreprint
Olmstead, J. A., King, L. E., & Bloodgood, B. L. (2025) · eLife · doi:10.7554/elife.109663
A comprehensive bulk and single-cell transcriptional atlas of pediatric leukemiasPreprint
Pushel, I., Mamidi, T. K. K., Yoo, B., Lansdon, L. A., Louiselle, D. A., Gibson, M., Guest, E. M., Wood, N. M., August, K. J., Flatt, T. G., et al. (2025) · bioRxiv (Cold Spring Harbor Laboratory) · doi:10.64898/2025.12.23.696262
Radjasandirane, R., Cretin, G., Diharce, J., de Brevern, A. G., & Gelly, J. (2025) · medRxiv · doi:10.64898/2025.12.22.25342839
Navigating Tumor Microenvironments with Spatial Transcriptomics for Effective Therapeutics
Krolla, C., Das, T., Tsouris, A., Chakraborty, S., & Andrieux, G. (2026) · Interdisciplinary biotechnological advances · doi:10.1007/978-981-95-3612-2_4
Vermeersch, A.-S., Verdonckt, T.-W., Struyfs, C., Meester, E. D., Waickman, A. T., Thomas, S. M., Ariën, K. K., Lagatie, O., & Nieuwerburgh, F. V. (2026) · bioRxiv (Cold Spring Harbor Laboratory) · doi:10.64898/2026.01.04.697597
Vidal, J. I. N. (2026) · Research Square · doi:10.21203/rs.3.rs-8475138/v1
Lao, J., Han, Z., Lou, X., Ye, J., Gao, C., & Wu, L. (2026) · Thoracic Cancer · doi:10.1111/1759-7714.70244
Robbins, A. B., Ranum, P. T., Huerta-Ocampo, I., Kuckyr, M., & Davidson, B. L. (2026) · bioRxiv (Cold Spring Harbor Laboratory) · doi:10.64898/2026.01.07.698249
Zhang, G., Liu, N., Tian, X., Yin, Y., Hu, L., & Jiang, G. (2026) · Environmental Science & Technology · doi:10.1021/acs.est.5c14405
Li, Z., Yao, Y., Qiao, Y., Zhang, L., Yu, B., Jiang, Y., & Zhu, Y. (2026) · Frontiers in Neurology · doi:10.3389/fneur.2026.1697322
Biase, F. H., Morozyuk, M., & Ezepha, C. (2026) · bioRxiv (Cold Spring Harbor Laboratory) · doi:10.64898/2026.02.01.703145
Madduri, A. V., Ellis, R. J., Lakhani, C. M., Bennett, D. A., & Patel, C. J. (2026) · medRxiv · doi:10.64898/2026.01.31.26345282
Zhang, C. X., Li, J., Luo, O., Fu, X., Andrews, T. S., Steinberg, G. R., & Wang, D. (2026) · bioRxiv (Cold Spring Harbor Laboratory) · doi:10.64898/2026.02.07.704573
Yang, L., Miao, B., Sun, Q., Zhang, F., Sun, H., Zhou, Z., Hu, Y., Cui, Z., Wang, D., Liu, C., et al. (2026) · Frontiers in Immunology · doi:10.3389/fimmu.2026.1776874
Kurlekar, S., Lima, J. D. C. C., Kupfer, N., Pugh, C. W., Mole, D. R., Adam, J., & Ratcliffe, P. J. (2026) · bioRxiv (Cold Spring Harbor Laboratory) · doi:10.64898/2026.02.18.706657
Sontake, V., Kartha, V. K., Sahu, N., Fuentes, D., Chio, L., Miyazaki, H., Chen, J., Gupta, A., Nonora, J., Vaidyanathan, A., et al. (2026) · bioRxiv (Cold Spring Harbor Laboratory) · doi:10.64898/2026.02.26.708253
Wei, W.-T., Yan, Z., Wu, H., Zhou, M., Mo, D.-X., Wan, X., Ma, R., Wu, M.-M., Huang, J.-H., Liu, Y.-J., et al. (2026) · Science China Life Sciences · doi:10.1007/s11427-025-3108-3
Blanco‐Luquin, I., Martinez‐de‐Morentin, X., Vilas‐Zornoza, A., Mouzo, D., Lopez, A. L., Macías, M., Alignani, D., Maillo, A., Alvarez, A. C. G., Ibrahim, L. A., et al. (2026) · Scientific Data · doi:10.1038/s41597-026-06971-4
Cheng, Y., Kettlewell, T., Laidlaw, R. F., Hardy, O. M., McCluskey, A., Otto, T. D., & Somma, D. (2026) · bioRxiv (Cold Spring Harbor Laboratory) · doi:10.64898/2026.03.09.710522
COVID-19 as a trigger for the development or progression of neurodegenerative diseases
Shcherbak, S. G., Vologzhanin, D. A., Макаренко, С. В., Голота, А. С., Mironov, V. G., & Kamilova, Т. A. (2026) · Physical and rehabilitation medicine medical rehabilitation · doi:10.36425/rehab698851
SPICEY: an R package for quantifying tissue specificity from single cell multi-omics data
Fuentes-Páez, G., Molina, N., Ramos-Rodríguez, M., & Pasquali, L. (2026) · BMC Bioinformatics · doi:10.1186/s12859-026-06418-y
Liebenberg, K., Craig, E., Tibshirani, R. J., & Eberlin, L. S. (2026) · Bioinformatics · doi:10.1093/bioinformatics/btag137
Innate immune sensing of cell traversal by Plasmodium sporozoites drives protective T cell responsesPreprint
Pohl, K. G., Gao, X., McGowan, J., Mukherjee, P., Le, S., Carreira, P. E., Ngo, C., Sutton, H. J., Brumhard, S., Hiller, A. L., et al. (2026) · bioRxiv (Cold Spring Harbor Laboratory) · doi:10.64898/2026.03.20.713171
Planer, J. D., Morley, M. P., Cai, S., Peterson, A. R., Lu, M., Yang, Y., Hallquist, H., Schaefer, S. E., Carl, J., Zhou, S., et al. (2026) · bioRxiv (Cold Spring Harbor Laboratory) · doi:10.64898/2026.03.20.713166
Sharma, V., Khantwal, C. M., & Konwar, K. M. (2026) · bioRxiv (Cold Spring Harbor Laboratory) · doi:10.64898/2026.03.22.713285
Ding, J., Kang, H., Spangenberg, A. L., Liu, Y., Martínez, F. J. M., Carr, T. F., & Cusanovich, D. A. (2026) · bioRxiv (Cold Spring Harbor Laboratory) · doi:10.64898/2026.03.27.714744
Novel Mechanisms of Chemosensory Adaptation to the Cave EnvironmentPreprint
Choi, N., Rice, E. S., Maggs, X., Zhang, Z., Nikaido, M., Warren, W. C., & Yoshizawa, M. (2026) · SSRN Electronic Journal · doi:10.64898/2026.04.03.716434
Xu, Z., Tao, S., Feng, S., Ye, X., Wang, T., Hu, H., Heidrich-O’Hare, E., Chen, W., & Duerr, R. H. (2026) · Nature Communications · doi:10.1038/s41467-026-71383-2
New inborn errors of human phagocytes
Neehus, A. (2023) · theses.fr (ABES) · doi:10.70675/cb65d83fz5ca3z4c26z84fbz1e758c88e756
Alshabrmi, F. M. (2026) · Cell Biochemistry and Biophysics · doi:10.1007/s12013-026-02067-3
Almazán, A. (2022) · theses.fr (ABES) · doi:10.70675/16c4a6f1z6fa5z4443za73azacfdf9be258a
Sukmak, R., Mathie, H. A., Taylor, R. S., Sun, J., Shih, B. B.-J., Bell, C. R., Gray, M., Macqueen, D. J., & Hope, J. C. (2026) · Frontiers in Immunology · doi:10.3389/fimmu.2026.1764014
Post-selection inference for transcriptomic data analysis
Enjalbert-Courrech, N. (2024) · theses.fr (ABES) · doi:10.70675/c7a2bbf3z742az40fcza856z0f8d400c4ec7
Kernel-based testing and their application to single-cell data
Ozier‐Lafontaine, A. (2023) · theses.fr (ABES) · doi:10.70675/7af84e54zb1daz46a6z85f3zb80dbad89733
Single-cell transcriptomics of human brain disorders
Arbabi, K., Carito, G., Luquez, T., & Wainberg, M. (2026) · Molecular Psychiatry · doi:10.1038/s41380-026-03573-9 · Cited by 1
Wolf, C. L., Ruiz, R. K., Khou, S., Cornelison, R., Stelow, E. B., Kowalewski, K. M., Lazzara, M. J., Poissonnier, A., Coussens, L. M., & Kelly, K. A. (2026) · Frontiers in Immunology · doi:10.3389/fimmu.2026.1894080
Subhash, S., Bammert, M., Yueh, B., Chu, T. H., Barbi, M., Alici-Garipcan, A., Eskiocak, O., Ozler, K., Nizam, A., Katcher, A. H., et al. (2026) · bioRxiv (Cold Spring Harbor Laboratory) · doi:10.64898/2026.04.21.720013
Caballero, A., Chi, L., & Delgado-Olguı́n, P. (2026) · Molecular Metabolism · doi:10.1016/j.molmet.2026.102375
Distinct phases of immune system programming during ART-suppressed immunodeficiency virus infectionPreprint
Kaza, M., Varco-Merth, B., McElfresh, G., et al. (2026) · bioRxiv (Cold Spring Harbor Laboratory) · doi:10.64898/2026.04.29.721702
Dooley, N. L., Pava, Z., Andrew, D., Stevens, N. E., Frame, T. C. M., Loughland, J. R., Soon, M. S. F., Oyong, D. A., Rivera, F. D. L., Mukhiya, R., et al. (2026) · medRxiv · doi:10.64898/2026.04.29.26352021
scHG: A supercell framework with high-order graph learning enables scalable multi-omics analysis
Huang, Y., Gan, Y., & Gong, X. (2026) · PLoS Computational Biology · doi:10.1371/journal.pcbi.1013851
Khantham, C., Rodriguez‐Martin, I., Kerick, M., Villanueva-Martín, G., Callejas, J. L., Ortego‐Centeno, N., del Castillo, A. G., Simeón‐Aznar, C. P., Ruíz‐Villaverde, R., Andrés‐León, E., et al. (2026) · bioRxiv (Cold Spring Harbor Laboratory) · doi:10.64898/2026.05.06.723148
Cross-Platform Comparative Spatial Transcriptomics in High-Grade Serous Carcinoma
Youssef, O., Selander, L., Zheng, S., Csellar, L., Hänninen, S. M., Tang, J., Carpén, O., & Laury, A. R. (2026) · Laboratory Investigation · doi:10.1016/j.labinv.2026.106134
Identifying Treatment Related Signatures In Glioblastoma Using KaleidoCellPreprint
Radig, J., Welz, C., Jerome, M. S., Ostheimer, P., Fellenz, S., Radlwimmer, B., & Herrmann, C. (2026) · bioRxiv (Cold Spring Harbor Laboratory) · doi:10.64898/2026.05.13.724848
Overview of Single-Cell Analysis
Solanki, D., Murjani, K., & Singh, V. (2026) · Springer eBooks · doi:10.1007/978-981-95-9789-5_1
Reid, A. T., Veerati, P. C., Nichol, K., Schuliga, M. J., Read, J. M., Collison, A., Wark, P. A. B., Ton, F., & Grainge, C. (2026) · American Journal of Physiology-Lung Cellular and Molecular Physiology · doi:10.1152/ajplung.00321.2025
Comprehensive assessment of alternative splicing analysis methods for single-cell RNA-seq
Jiang, Q., Li, G., Xing, L., Zhang, D., & Sun, J. (2026) · iScience · doi:10.1016/j.isci.2026.116090
Sumera, A., Crichton, A., Kind, P. C., Sibley, C. R., & Booker, S. A. (2026) · Frontiers in Neuroscience · doi:10.3389/fnins.2026.1819200
Computational blueprints for cell fate programming
Yang, P. (2026) · Stem Cell Reports · doi:10.1016/j.stemcr.2026.102929
Flowers, B., Lialios, P., Park, E., Smith, N., Burgess, R. J., Whalley, J., & Lee, J.-S. (2026) · bioRxiv (Cold Spring Harbor Laboratory) · doi:10.64898/2026.05.26.728026
Le, B., Nguyen, D. P. Q., Binh, D. H. N., Vo, B. L., Anh, L. D., & Ta, H. D. K. (2026) · Computational Biology and Chemistry · doi:10.1016/j.compbiolchem.2026.109154
Piecing together the alveolar-capillary unit: arterial-venous capillary polarization
Majka, S. M., Niethamer, T. K., Caporarello, N., Thorndyke, H. F., Clair, G. C., West, J. D., Karmouty‐Quintana, H., & Alvira, C. M. (2026) · American Journal of Physiology-Lung Cellular and Molecular Physiology · doi:10.1152/ajplung.00101.2026
Single-cell characterization of tumor immune landscapes in colorectal cancer humanized micePreprint
Bootsma, S., Saris, J., Yim, A. Y. F. L., Lenos, K., Braga, F. A. V., Grootjans, J., & Vermeulen, L. (2026) · bioRxiv (Cold Spring Harbor Laboratory) · doi:10.64898/2026.06.01.729295
DataXflowGen for GenAI-driven model generation
Crouch, S. A. W., & Breitenbach, T. (2026) · Scientific Reports · doi:10.1038/s41598-026-56492-8
Bootwisas, N., Marupanthorn, K., & Marupanthorn, P. (2026) · Research Square · doi:10.21203/rs.3.rs-9928967/v1
Hartert, T. V., Rosas‐Salazar, C., Newcomb, D. C., Snyder, B. M., Berdnikovs, S., McKennan, C. G., Osmundson, S. S., Liu, Z., Tafoya, E., Folad, W., et al. (2026) · BMJ Open Respiratory Research · doi:10.1136/bmjresp-2025-004049
Lorenzi, V., Moullet, M., Icoresi-Mazzeo, C., Colligan, R. M., Danks, M. R., Cohen, C. E., Parranga, A., Kim, C. E., Sancho‐Serra, C., Sakata, R. C., et al. (2026) · bioRxiv (Cold Spring Harbor Laboratory) · doi:10.64898/2026.06.08.730878
Parental care is a genetic capacitorPreprint
Parey, E., Houslay, T. M., Sun, S., Trowsdale, A. T., Gavriouchkina, D., Blunskyte-Hendley, M., Kilner, R. M., Marlétaz, F., & Rahia Mashoodh, A. (2026) · bioRxiv (Cold Spring Harbor Laboratory) · doi:10.64898/2026.06.09.731115
Bhak, Y., Jeon, S., & Bhak, J. (2026) · bioRxiv (Cold Spring Harbor Laboratory) · doi:10.64898/2026.06.08.731002
RAI1 safeguards fidelity and tempo of human neurodevelopmental gene expressionPreprint
Zhou, B., Mohanty, S., Riggle, P., Tsukahara, T., Lin, G., Dang, L. T., Sutton, M. A., & Iwase, S. (2026) · bioRxiv (Cold Spring Harbor Laboratory) · doi:10.64898/2026.06.11.731717 · Cited by 1
Nowshad, F., Su, M., & Guthrie, L. (2026) · bioRxiv (Cold Spring Harbor Laboratory) · doi:10.64898/2026.06.11.731733
JAK–STAT3–MYC axis defines pathogenic stem cell-like memory CD4+ T cells in rheumatoid arthritis
Yang, S., Kim, M., Park, K.-L., Kim, H., Park, J. W., Park, J. K., & Lee, E. B. (2026) · Clinical Immunology · doi:10.1016/j.clim.2026.110733
Developmentally dynamic, non-convergent transcriptomic profiles in CNV models for schizophrenia risk
French, H., Yao, S., Bast, L., Adam, A. R., Stümpges, P., Memic, F., Mullé, J. G., Sullivan, P. F., & Hjerling‐Leffler, J. (2026) · Molecular Psychiatry · doi:10.1038/s41380-026-03679-0
Fujita, I., Kaji, T., Noguchi, I., Tokumaru, K., Maeda, H., Maruyama, T., & Watanabe, H. (2026) · ACS Pharmacology & Translational Science · doi:10.1021/acsptsci.6c00079
Age but not sex modifies lymphoid immune responses in murine sepsisPreprint
Wang, D., Rodhouse, C. E., Tang, H., Hernández-Ríos, M., Yu, X., Wu, R., Wiggins, W. B., Dirain, M., Ungaro, R., Nacionales, D. C., et al. (2026) · Research Square · doi:10.21203/rs.3.rs-9751570/v1
Decoding Immune Regulation: From Genetic Variation to Mechanism Through Single-Cell Genomics
Koh, J. H., & Ye, C. (2026) · Immune Network · doi:10.4110/in.2026.26.e24
Zahedi, M., Hamidi, A. K., Jafari‐Raddani, F., Shirkouhi, M. A., Amoli, M. M., & Razi, F. (2026) · Research Square · doi:10.21203/rs.3.rs-10040418/v1
Cerebellar microRNA-206 Tunes Purkinje Neuron Firing Dynamics to Control Sensorimotor GatingPreprint
Heyer, M. P., Ishikawa, M., Wang, J., Evangelista, J. E., Fakira, A. K., Ma’ayan, A., Feng, G., & Kenny, P. J. (2026) · SSRN Electronic Journal · doi:10.64898/2026.06.29.734826
Yao, J., Zhu, C.-Q., Deng, X.-J., Jiong-biao, Y., Wu, T.-P., Sun, Y., & Li, W. (2026) · Frontiers in Cellular and Infection Microbiology · doi:10.3389/fcimb.2026.1875481
Can urinary single-cell transcriptomics reveal new dimensions of allograft biology?
Mas, V. R., & Luo, X. (2026) · American Journal of Transplantation · doi:10.1016/j.ajt.2026.06.017
Tan, Y., Xiang, J., Wang, Z., Wang, Y., Chen, A., & Wu, Q. (2026) · Cancer Informatics · doi:10.1177/11769351261466300
HLiCA: An integrated cell atlas of the healthy human liverPreprint
Edgar, R. D., Portman, J. R., Hu, H., Pouyabahar, D., Rahman, R. R., Stueckmann, D., Choi, Y., Neavin, D. R., Atif, J., Clarke, Z. A., et al. (2026) · bioRxiv (Cold Spring Harbor Laboratory) · doi:10.64898/2026.06.30.735539
Lu, C., Wang, L., Cao, X., Zhao, K., Yin, N., & Zhang, D. (2026) · Frontiers in Immunology · doi:10.3389/fimmu.2026.1883412
Network-based machine learning to identify biomarkers for systemic lupus erythematosus
Park, M., Kim, D., Lee, J., Noh, J., Kim, C. J., Oh, Y., Suh, C. S., Kim, J.-W., Im, S., Kim, S., et al. (2026) · BMC Biology · doi:10.1186/s12915-026-02681-w
Jiang, S., Qi, C., Chen, Y., Song, X., & Wei, Z. (2026) · bioRxiv (Cold Spring Harbor Laboratory) · doi:10.64898/2026.07.06.736807
Lai, X., & Wen, J. (2026) · Progress in Neuro-Psychopharmacology and Biological Psychiatry · doi:10.1016/j.pnpbp.2026.111835
Wang, X., Liu, M., Jia, M., Wang, Q., Li, X., Zou, Q., Huang, X., Zhang, L., Lv, X., Wang, J., et al. (2026) · The Innovation Oncology · doi:10.59717/j.xinn-oncol.2026.100027
Filippidis, P., Lu, C., Orlinick, B. L., Pang, A. P. S., Nelson, A., Spudich, S., Roman, F. M., Zigáčková, D., Singareddy, N., Mehta, S. S., et al. (2026) · Science Advances · doi:10.1126/sciadv.aee1278
Huang, Z., Liu, J.-J., Zhao, C., & Fang, W. (2026) · Food and Chemical Toxicology · doi:10.1016/j.fct.2026.116275
From stasis to systematics: deciphering the pathophysiology of secondary lymphedema through omics
Stull-Lane, A. R., Chen, X., Book, A. J., Kratchmarov, R., Pal, S., Shin, J. Y., Ashokan, G., Hespe, G. E., Mehrara, B. J., & Kataru, R. P. (2026) · Frontiers in Immunology · doi:10.3389/fimmu.2026.1850725
Cellular and molecular dysregulation of the esophageal epithelium in systemic sclerosis
Dapas, M., Clevenger, M. H., Makinde, H. M., Therron, T., Carlson, D. A., Carns, M. A., Aren, K., Wei, C., Mian, K., Muhammad, L. N., et al. (2026) · JCI Insight · doi:10.1172/jci.insight.195322
Liu, C., Li, W., Liao, T., Li, Z., Huang, G., & Wang, Q. (2026) · Frontiers in Pharmacology · doi:10.3389/fphar.2026.1842271
Progranulin haploinsufficiency remodels the cerebral microvasculature and neurovascular unitPreprint
Chakraborty, S., Weick, M., Franciosa, S. A., Tabrizi, Z., Swinehart, C., Moore, G. R., Lee, D., Bhatt, N. N., Cano, A., Poorva, P., et al. (2026) · bioRxiv (Cold Spring Harbor Laboratory) · doi:10.64898/2026.07.20.738719
Bhat, S. S., Niranjan, V., BODHIREDDY, T., Kulkarni, S. R., Bandikatte, S. A., & Lavanya, C. (2026) · NeuroMarkers. · doi:10.1016/j.neumar.2026.100182
Intracerebral Hemorrhage Induces Monocyte TNF Signaling in Patients That Is Suppressed by BAF 312
DeLong, J. H., Díaz-Pérez, S., Sheth, K. N., Cha, J., Malanga, C. J., Wagner, P., Pezous, N., Hanin, A., Walsh, K. B., Hinson, H. E., et al. (2026) · Annals of Clinical and Translational Neurology · doi:10.1002/acn3.70485
Ham, E., Boedeker, K., Keating, C. R., Ye, R.-S., Montalbano, F., Mankaruse, S., Ding, X., Rennhack, J. P., & Qiu, W. (2026) · Molecular Carcinogenesis · doi:10.1002/mc.70156
Orsolini, L., Giulietti, M., Longo, G., Piva, F., & Volpe, U. (2026) · Research Square · doi:10.21203/rs.3.rs-10395576/v1
Kanannejad, S., Bongiorni, N., Nordera, E., Redaelli, S., Rusconi, I., Zanin, R., Giustacchini, A., & Chatterjee, S. (2026) · bioRxiv (Cold Spring Harbor Laboratory) · doi:10.64898/2026.07.27.740477
Jones, G. H., Gilbert, J. R., Johnston, J. N., Akula, N., Schulmann, A., Arakelian, M. H., Peng, S., Yuan, P., Winful, E. A., Yavi, M., et al. (2026) · Molecular Psychiatry · doi:10.1038/s41380-026-03777-z
Li, Y. (2026) · Computational Biology and Chemistry · doi:10.1016/j.compbiolchem.2026.109287
Gupta, A., & Singh, S. (2026) · Computational Biology and Chemistry · doi:10.1016/j.compbiolchem.2026.109284
Cang, H., & Sun, S. (2026) · bioRxiv (Cold Spring Harbor Laboratory) · doi:10.64898/2026.07.27.740807
Stephens, G. S., Alcantara‐Gonzalez, D., & Scharfman, H. E. (2026) · bioRxiv (Cold Spring Harbor Laboratory) · doi:10.64898/2026.07.28.741316
Ye, X., Wu, G., Xie, J., Wu, Y., Chen, D., Chen, Y., Xu, S., & Luo, S. (2026) · Frontiers in Cardiovascular Medicine · doi:10.3389/fcvm.2026.1840776
meng, K., Wang, L., Gong, X., Tang, W., Jia, G., Wang, Y., & He, C. (2026) · Functional & Integrative Genomics · doi:10.1007/s10142-026-01980-3
RKMR: A Rapid Kernel Machine Regression Framework for Optimal Marker Detection in Spatial Omics DataPreprint
Seal, S., Chakraborty, A., Mattila, C., Rubinstein, M., Angel, P. M., Ghosh, D., Chung, D., & Neelon, B. (2026) · bioRxiv (Cold Spring Harbor Laboratory) · doi:10.64898/2026.07.27.740999
Multi-sample and multi-group spatial colocalization analysis using PANORAMIC
Chang, J., Espín-Pérez, A., Molina, P., Khurana, R., Zhang, W., Tian, L., & Plevritis, S. K. (2026) · Bioinformatics · doi:10.1093/bioinformatics/btag546
Reduced expression of Brain Expressed X-linked genes in Alzheimer's disease
Li, L., Kenner, E., Wan, L., Yan, Z., & Feng, J. (2026) · Journal of Alzheimer s Disease · doi:10.1177/13872877261471446
Metadata
- Authors
- Squair, J. W., Gautier, M., Kathe, C., Anderson, M. A., James, N. D., Hutson, T. H., Hudelle, R., Qaiser, T., Matson, K. J. E., Barraud, Q., Levine, A. J., La Manno, G., Skinnider, M. A., & Courtine, G.
- Affiliations
- University of British Columbia (CA)
- Centre Hospitalier Universitaire Vaudois (CH)
- National Institute of Neurological Disorders and Stroke (US)
- Corresponding author
- Skinnider, Michael A.
- Courtine, Grégoire
- ORCID
- Venue
- Nature Communications
- Publisher
- openRxiv
- Published
- 2021-03-12
- Volume
- 12
- Issue
- 1
- Pages
- 5692-5692
- ISSN
- 2041-1723 (ISSN-L)
- PMC
- PMC8479118
- OpenAlex
- W3202649987
- Cited by
- 1,086
- References
- 104
- Citations by year
- 2026: 396 · 2025: 214 · 2024: 231 · 2023: 145 · 2022: 86 · 2021: 12
- FWCI
- 34.62
- Type
- journal article
- Language
- en
- Open access
- gold
- doi.org
- Licence
- Locations
- Nature Communications (publishedVersion, cc-by)
- bioRxiv (Cold Spring Harbor Laboratory) (submittedVersion)
- PubMed Central (publishedVersion, cc-by)
- PubMed (publishedVersion)
- SERVAL (Université de Lausanne) (publishedVersion, cc-by)
- IRIS (submittedVersion, cc-by)
- RePEc: Research Papers in Economics (submittedVersion)
- DOAJ (DOAJ: Directory of Open Access Journals) (submittedVersion, cc-by-sa)
- Infoscience (Ecole Polytechnique Fédérale de Lausanne) (submittedVersion, cc-by-nc-nd)
- Funders
- National Science Foundation
- Wings for Life
- Compute Canada
- Western Canada Research Grid
- Wyss Center for Bio and Neuroengineering
- Schweizerischer Nationalfonds zur Förderung der Wissenschaftlichen Forschung (185728, 192558, 193445, 190495, 310030)
- University of British Columbia
- National Institutes of Health
- Canadian Institutes of Health Research
- National Supercomputing Center, Korea Institute of Science and Technology Information
- National Institute of Neurological Disorders and Stroke
- H2020 European Research Council (682999)
- Topics
- Life Sciences › Biochemistry, Genetics and Molecular Biology › Molecular Biology › Single-cell and spatial transcriptomics
- Life Sciences › Biochemistry, Genetics and Molecular Biology › Molecular Biology › Gene expression and cancer classification
- Life Sciences › Biochemistry, Genetics and Molecular Biology › Molecular Biology › Bioinformatics and Genomic Networks
- Keywords
- single-cell differential expression, false discovery, biological replicates, comparison of statistical methods, differentially expressed genes, spinal cord injury, mouse spinal cord, cell type-specific responses, false positives
- MeSH terms
- Data Accuracy, Biological Variation, Population, Biological Variation, Individual, RNA-Seq, Animals, Gene Expression Regulation, Humans, Rabbits, Swine, Models, Statistical, Mice, Rats, Single-Cell Analysis, Datasets as Topic
About these checks
Registry, retraction, Cites and statistics results are computed, not judged, with one exception: a printed reference that no index lists is read once by a model before it counts as a citation error. Claims are extracted by a model and kept only when their quote appears verbatim in the text; each cited source is then checked, with a model’s help, for whether it says what the claim relies on. Those verdicts can be wrong — read the claim’s quote and the cited source before relying on one.
A language model drew the claims from the paper on 2026-10-10, under version 3 of the claim definition (model deepseek-v4.1-flash, prompt extract-v3).
A second model labelled each claim on 2026-10-10 (model jev-1.13-20260917, definition revision gold-guideline-v0.2).
Cited sources are checked with a language model’s help (gpt-6-sol).
Statistics and arithmetic are recomputed, not judged.
Confidence bands are shown only for fields calibrated on our annotated test set. None is calibrated yet, so no band is shown.
What counts as a claim ›How we measure confidence ›How we check this ›
Are you an author, or do you see a problem with this page? Request a review
