

Regional and correlative sweat analysis using high-throughput microfluidic sensing patches toward decoding sweat
Open accessThe DOI matches its Crossref record; 49 of the 49 references it cites were found in a registry or an index; 27 of the 56 sources its claims cite were checked for support.
Abstract
], [glucose], and sweat rate in exercise and chemically induced sweat. The patch is demonstrated for investigating regional sweat composition, predicting whole-body fluid/electrolyte loss during exercise, uncovering relationships between sweat metrics, and tracking glucose dynamics to explore sweat-to-blood correlations in healthy and diabetic individuals. By enabling a comprehensive sweat analysis, the presented device is a crucial tool for advancing sweat testing beyond the research stage for point-of-care medical and athletic applications.
Overview
CoChat Summary
## TL;DR
This paper presents a high-throughput, roll-to-roll fabricated wearable microfluidic sweat patch for simultaneous measurement of sweat analytes and sweat rate. Using it, the authors show that regional sweat patterns can help estimate whole-body fluid loss, that sweat sodium and potassium are generally positively correlated within individuals, and that iontophoretic sweat glucose does not robustly predict blood glucose across healthy and diabetic cohorts.
## Key findings
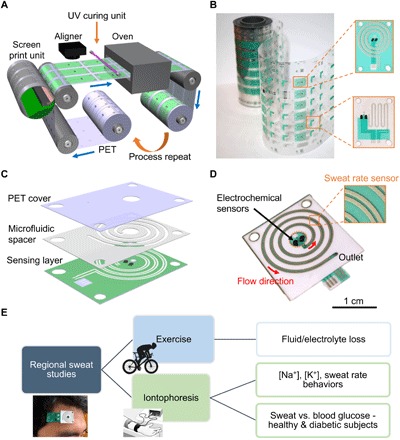
- The patch was fabricated by R2R rotary screen printing and laser cutting, and the authors report production at 60 devices per minute on a 100-m web length.
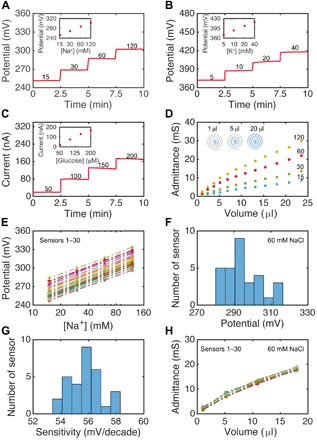
- Functional sensors showed calibration performance of 56.2 mV/decade for Na\+ (with a mean of 55.7 mV/decade, SD 1.1 mV/decade across 30 sensors), 51.3 mV/decade for K\+, and 1.0 nA/μM sensitivity for glucose over 50–200 μM.
- For exercise sweat, sweat [Na\+] and secretion rate were typically positively correlated across regions and subjects; for subject 1, regional sweat rate vs whole-body fluid loss had r = 0.70 (forehead) and r = 0.68 (forearm), with P = 0.012 and 0.014, respectively.
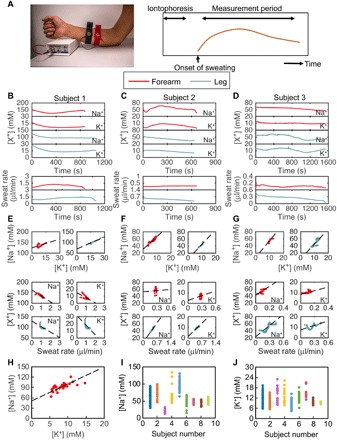
- In iontophoretic sweat, sweat [Na\+] and [K\+] were generally positively correlated within individuals; one subject’s off-body ICP-MS comparison gave Pearson’s r = 0.70.
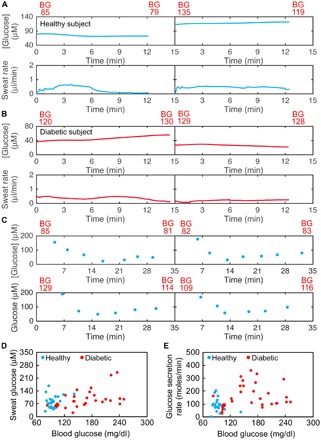
- Across 20 healthy and 28 diabetic subjects, average iontophoretic sweat glucose and blood glucose showed only a mild positive correlation (Pearson’s r = 0.3, P = 0.016); after cohort-wise outlier removal the correlations were 0.28 (healthy, P = 0.167) and 0.42 (diabetic, P = 0.016).
- The authors also report that multiplying sweat glucose by sweat rate gave an even weaker relationship with blood glucose (Pearson’s coefficient = 0.2).
## Methods
- The study combines wearable microfluidic sweat patch design/fabrication with on-body and off-body human sweat measurements. The patch integrates electrochemical sensors for Na\+, K\+, and glucose with an impedance-based sweat rate sensor.
- Human trials included exercise (stationary cycling) and pilocarpine iontophoresis. On-body regional sites included the forehead, underarm, forearm, back, and leg; iontophoresis sweat was collected from the forearm and distal leg.
- Main analyses included sensor calibration in standard solutions, ICP-MS for Na\+ and K\+, HPAEC-PAD / LC for sweat glucose validation, and correlation analyses between regional sweat variables, whole-body fluid loss, and blood glucose.
## Limitations
- The paper states that a simple relation does not seem to exist across healthy and diabetic cohorts for predicting blood glucose from iontophoretic sweat glucose and sweat rate, limiting universal diabetes thresholds.
- The authors explicitly note that their findings do not preclude more complex, individual-specific relations; this means the current analysis is limited by using simple population-level correlations, rather than longitudinal personalized models.
- Evident from the text: some reported findings rely on small numbers of subjects in specific demonstrations (for example, three subjects in some real-time sweat experiments and one-subject examples for certain off-body validations), which limits generalizability.
Model-written summary. Check it against the paper before relying on it.
Integrity signals
Registry
Cites
Statistics
Figures

Verification
Claims the paper makes
16 Valid · 1 Not valid · 6 Not checked · 90 Own results and interpretations
The cited sources support only part of this claim — read each source’s verdict below.
In the paper
“Traditional methods for sweat testing require off-body measurements in specialized settings by trained experts, preventing individuals from monitoring their health status immediately, independently, or routinely (11, 12).”
§ Regional and correlative sweat analysis using high-throughput microfluidic sensing patches toward decoding sweat > INTRODUCTION Sweat is an attractive biofluid for point-of-care health monitoring because it can be locally and noninvasively induced and carries diverse biomolecules ranging from small electrolytes and metabolites to hormones and larger proteins that filter in from deeper in the body (1–5). This ease of access and rich composition give sweat potential to be used to probe the state of the body at a chemical level. Sweat testing has historically been used in applications ranging from medical diagnosis of cystic fibrosis and autonomic neuropathy to assessment of fluid and electrolyte balance in endurance athletes (6–10). Traditional methods for sweat testing require off-body measurements in specialized settings by trained experts, preventing individuals from monitoring their health status immediately, independently, or routinely (11, 12). By taking advantage of flexible and hybrid electronics (13–17), wearable sweat sensors address this limitation by enabling in situ sweat measurements with real-time feedback, creating potential for preventive care, timely diagnosis, and treatment (18–34). Yet, wearable sweat sensor development has stagnated at the experimental and laboratory stage, largely due to an incomplete understanding of sweat dynamics and the physiological information carried in sweat. Sweat behaviors of only a few analytes, including ethanol and chloride, have been extensively investigated and related to blood concentrations or health status (6, 8, 27, 35). Preliminary or small-scale correlation studies have shown promising applications for other analytes such as metabolites and certain neuroimmune biomarkers present in sweat (3, 27–29, 36), including a recent work that shows how exercise sweat glucose of three healthy subjects roughly tracks their blood glucose, making a preliminary case for semiquantitative glucose prediction (29). However, more comprehensive studies are needed to robustly establish the diagnostic utility and limitations of sweat testing in these cases. One of the primary obstacles to conducting the large-scale population studies needed to decode sweat is achieving high-throughput fabrication of sweat sensors with uniform, reliable performance and high yield. This is critical to ensuring that sensors can be deployed with minimal preparatory overhead and produced in large enough quantities to support simultaneous regional sweat measurements in multisubject and longitudinal trials. Roll-to-roll (R2R) rotary screen printing is a promising method for high-throughput and cost-effective fabrication of flexible electronics (37, 38). Laser ablation allows for rapid materials patterning at small scales and is useful for engraving microfluidic channels into flexible plastic substrates (39, 40). These R2R-compatible methods are advantageous over traditional, multistep lithography and etching processes as components can be mass produced on large substrate areas at high speeds using automated systems with minimal human involvement (41). By uniting R2R rotary screen printing of sensing electronics with R2R laser cutting of microfluidic channels, we present a wearable patch that can be mass produced at high yield for simultaneous sweat flow control and electrical/electrochemical sensing. While R2R printing of electrochemical electrodes and microfluidic structures has been previously and independently introduced, the system presented here further demonstrates R2R fabrication of integrated sweat rate sensors and microfluidics, representing a key application-oriented technological advancement that can help decode the rate-dependent modulation of sweat analyte secretion (41, 42). The patch has two aligned layers: The first hosts a patterned electrode system for transducing analyte concentrations and monitoring sweat rate, and the second is a microfluidic adhesive layer with a sweat collection reservoir and a spiral microfluidic channel to guide sweat flow. Encapsulating sweat within the microfluidic facilitates accurate sweat analysis by minimizing evaporation and environmental contamination and providing efficient sweat sampling to reduce mixing and carryover effects. The wearable patch can monitor sweat parameters such as [Na+], [K+], [glucose], and sweat rate simultaneously at diverse regions of the body. We specifically demonstrate its use for applications in exercise physiology and medical health monitoring. Localized sweat behavior is extrapolated to estimate whole-body fluid and electrolyte loss toward dehydration monitoring during exercise. Regional iontophoresis sweat parameters are investigated toward decoding sweat for medical diagnostics, including studying electrolyte relations and the correlation between sweat and blood glucose levels for healthy and diabetic subjects. Through its rapid manufacturability and by enabling diverse analysis of sweat dynamics and composition, the presented device bridges a key gap in our ability to decode sweat toward personalized, point-of-care health and fitness monitoring.
What the sources say
- Not matchedcites [11]
Couldn’t be matched to a paper in Crossref, so it can’t be checked.
- Partly supportedcites [12] sourceExperimental — accuracy not yet measured
The Sweat collection section (page unavailable) describes subjects reporting to a laboratory, and the paper describes subsequent sample analysis with an ion chromatograph. This supports laboratory-based, off-body testing, but the paper does not establish that traditional methods require trained experts or that they prevent immediate, independent, or routine health monitoring. (LLM, conf=0.84)
plainstates a cause- Asserted: passes — The authors put it forward as true.
- Checkable: passes — It can be checked against evidence.
- Load-bearing: passes — The paper’s conclusions depend on it.
- Based: passes — The paper gives a reason why it holds.
- Not matched
The cited sources support only part of this claim — read each source’s verdict below.
In the paper
“These R2R-compatible methods are advantageous over traditional, multistep lithography and etching processes as components can be mass produced on large substrate areas at high speeds using automated systems with minimal human involvement (41).”
§ Regional and correlative sweat analysis using high-throughput microfluidic sensing patches toward decoding sweat > INTRODUCTION Sweat is an attractive biofluid for point-of-care health monitoring because it can be locally and noninvasively induced and carries diverse biomolecules ranging from small electrolytes and metabolites to hormones and larger proteins that filter in from deeper in the body (1–5). This ease of access and rich composition give sweat potential to be used to probe the state of the body at a chemical level. Sweat testing has historically been used in applications ranging from medical diagnosis of cystic fibrosis and autonomic neuropathy to assessment of fluid and electrolyte balance in endurance athletes (6–10). Traditional methods for sweat testing require off-body measurements in specialized settings by trained experts, preventing individuals from monitoring their health status immediately, independently, or routinely (11, 12). By taking advantage of flexible and hybrid electronics (13–17), wearable sweat sensors address this limitation by enabling in situ sweat measurements with real-time feedback, creating potential for preventive care, timely diagnosis, and treatment (18–34). Yet, wearable sweat sensor development has stagnated at the experimental and laboratory stage, largely due to an incomplete understanding of sweat dynamics and the physiological information carried in sweat. Sweat behaviors of only a few analytes, including ethanol and chloride, have been extensively investigated and related to blood concentrations or health status (6, 8, 27, 35). Preliminary or small-scale correlation studies have shown promising applications for other analytes such as metabolites and certain neuroimmune biomarkers present in sweat (3, 27–29, 36), including a recent work that shows how exercise sweat glucose of three healthy subjects roughly tracks their blood glucose, making a preliminary case for semiquantitative glucose prediction (29). However, more comprehensive studies are needed to robustly establish the diagnostic utility and limitations of sweat testing in these cases. One of the primary obstacles to conducting the large-scale population studies needed to decode sweat is achieving high-throughput fabrication of sweat sensors with uniform, reliable performance and high yield. This is critical to ensuring that sensors can be deployed with minimal preparatory overhead and produced in large enough quantities to support simultaneous regional sweat measurements in multisubject and longitudinal trials. Roll-to-roll (R2R) rotary screen printing is a promising method for high-throughput and cost-effective fabrication of flexible electronics (37, 38). Laser ablation allows for rapid materials patterning at small scales and is useful for engraving microfluidic channels into flexible plastic substrates (39, 40). These R2R-compatible methods are advantageous over traditional, multistep lithography and etching processes as components can be mass produced on large substrate areas at high speeds using automated systems with minimal human involvement (41). By uniting R2R rotary screen printing of sensing electronics with R2R laser cutting of microfluidic channels, we present a wearable patch that can be mass produced at high yield for simultaneous sweat flow control and electrical/electrochemical sensing. While R2R printing of electrochemical electrodes and microfluidic structures has been previously and independently introduced, the system presented here further demonstrates R2R fabrication of integrated sweat rate sensors and microfluidics, representing a key application-oriented technological advancement that can help decode the rate-dependent modulation of sweat analyte secretion (41, 42). The patch has two aligned layers: The first hosts a patterned electrode system for transducing analyte concentrations and monitoring sweat rate, and the second is a microfluidic adhesive layer with a sweat collection reservoir and a spiral microfluidic channel to guide sweat flow. Encapsulating sweat within the microfluidic facilitates accurate sweat analysis by minimizing evaporation and environmental contamination and providing efficient sweat sampling to reduce mixing and carryover effects. The wearable patch can monitor sweat parameters such as [Na+], [K+], [glucose], and sweat rate simultaneously at diverse regions of the body. We specifically demonstrate its use for applications in exercise physiology and medical health monitoring. Localized sweat behavior is extrapolated to estimate whole-body fluid and electrolyte loss toward dehydration monitoring during exercise. Regional iontophoresis sweat parameters are investigated toward decoding sweat for medical diagnostics, including studying electrolyte relations and the correlation between sweat and blood glucose levels for healthy and diabetic subjects. Through its rapid manufacturability and by enabling diverse analysis of sweat dynamics and composition, the presented device bridges a key gap in our ability to decode sweat toward personalized, point-of-care health and fitness monitoring.
What the sources say
- Partly supportedcites [41] sourceExperimental — accuracy not yet measured
The Abstract says R2R printing offers high-speed, large-area fabrication advantages over photolithography, and the R2R Gravure Printing section reports producing 150,000 electrodes on a 150 m web in about 30 minutes. The copy does not establish the comparison with etching or the claim that production requires minimal human involvement. Page numbers are not available in the supplied copy. (LLM, conf=0.85)
plainstates a cause- Asserted: passes — The authors put it forward as true.
- Checkable: passes — It can be checked against evidence.
- Load-bearing: passes — The paper’s conclusions depend on it.
- Based: passes — The paper gives a reason why it holds.
- Partly supported
The cited sources support only part of this claim — read each source’s verdict below.
In the paper
“Roll-to-roll (R2R) rotary screen printing is a promising method for high-throughput and cost-effective fabrication of flexible electronics (37, 38).”
§ Regional and correlative sweat analysis using high-throughput microfluidic sensing patches toward decoding sweat > INTRODUCTION Sweat is an attractive biofluid for point-of-care health monitoring because it can be locally and noninvasively induced and carries diverse biomolecules ranging from small electrolytes and metabolites to hormones and larger proteins that filter in from deeper in the body (1–5). This ease of access and rich composition give sweat potential to be used to probe the state of the body at a chemical level. Sweat testing has historically been used in applications ranging from medical diagnosis of cystic fibrosis and autonomic neuropathy to assessment of fluid and electrolyte balance in endurance athletes (6–10). Traditional methods for sweat testing require off-body measurements in specialized settings by trained experts, preventing individuals from monitoring their health status immediately, independently, or routinely (11, 12). By taking advantage of flexible and hybrid electronics (13–17), wearable sweat sensors address this limitation by enabling in situ sweat measurements with real-time feedback, creating potential for preventive care, timely diagnosis, and treatment (18–34). Yet, wearable sweat sensor development has stagnated at the experimental and laboratory stage, largely due to an incomplete understanding of sweat dynamics and the physiological information carried in sweat. Sweat behaviors of only a few analytes, including ethanol and chloride, have been extensively investigated and related to blood concentrations or health status (6, 8, 27, 35). Preliminary or small-scale correlation studies have shown promising applications for other analytes such as metabolites and certain neuroimmune biomarkers present in sweat (3, 27–29, 36), including a recent work that shows how exercise sweat glucose of three healthy subjects roughly tracks their blood glucose, making a preliminary case for semiquantitative glucose prediction (29). However, more comprehensive studies are needed to robustly establish the diagnostic utility and limitations of sweat testing in these cases. One of the primary obstacles to conducting the large-scale population studies needed to decode sweat is achieving high-throughput fabrication of sweat sensors with uniform, reliable performance and high yield. This is critical to ensuring that sensors can be deployed with minimal preparatory overhead and produced in large enough quantities to support simultaneous regional sweat measurements in multisubject and longitudinal trials. Roll-to-roll (R2R) rotary screen printing is a promising method for high-throughput and cost-effective fabrication of flexible electronics (37, 38). Laser ablation allows for rapid materials patterning at small scales and is useful for engraving microfluidic channels into flexible plastic substrates (39, 40). These R2R-compatible methods are advantageous over traditional, multistep lithography and etching processes as components can be mass produced on large substrate areas at high speeds using automated systems with minimal human involvement (41). By uniting R2R rotary screen printing of sensing electronics with R2R laser cutting of microfluidic channels, we present a wearable patch that can be mass produced at high yield for simultaneous sweat flow control and electrical/electrochemical sensing. While R2R printing of electrochemical electrodes and microfluidic structures has been previously and independently introduced, the system presented here further demonstrates R2R fabrication of integrated sweat rate sensors and microfluidics, representing a key application-oriented technological advancement that can help decode the rate-dependent modulation of sweat analyte secretion (41, 42). The patch has two aligned layers: The first hosts a patterned electrode system for transducing analyte concentrations and monitoring sweat rate, and the second is a microfluidic adhesive layer with a sweat collection reservoir and a spiral microfluidic channel to guide sweat flow. Encapsulating sweat within the microfluidic facilitates accurate sweat analysis by minimizing evaporation and environmental contamination and providing efficient sweat sampling to reduce mixing and carryover effects. The wearable patch can monitor sweat parameters such as [Na+], [K+], [glucose], and sweat rate simultaneously at diverse regions of the body. We specifically demonstrate its use for applications in exercise physiology and medical health monitoring. Localized sweat behavior is extrapolated to estimate whole-body fluid and electrolyte loss toward dehydration monitoring during exercise. Regional iontophoresis sweat parameters are investigated toward decoding sweat for medical diagnostics, including studying electrolyte relations and the correlation between sweat and blood glucose levels for healthy and diabetic subjects. Through its rapid manufacturability and by enabling diverse analysis of sweat dynamics and composition, the presented device bridges a key gap in our ability to decode sweat toward personalized, point-of-care health and fitness monitoring.
What the sources say
- Supportedcites [37] source
The Screen Printing subsection (Non-Contact Printing Technologies) states that flatbed and rotary screen assemblies are both used for R2R manufacturing, that rotary screens substitute flatbed screens 'for continuous processing', and that 'relatively high speeds can be achieved by rotary screen as compared to flatbed', while describing screen-printing as adding 'simplicity, affordability, speed and adaptability'. The R2R Printing section lists 'rotary screen-printing' among the favorable candidates for R2R configuration and describes R2R as having 'the potential for a continuous and high throughput process', and Section IV states printing technologies enable large-area electronics and sensors by R2R 'in a cost effective way'. The only qualification is the noted drawback that rotary screens are expensive and hard to clean, which does not contradict the 'promising' framing. (LLM, conf=0.88)
- Partly supportedcites [38] sourceExperimental — accuracy not yet measured
The paper says additive printing can reduce costs and enable high-speed roll-to-roll manufacture on flexible substrates; it also describes screen printing as fast (Abstract, page not provided). It does not specifically discuss roll-to-roll rotary screen printing, and its Methods describe screen printing on PET substrates rather than a rotary roll-to-roll process. (LLM, conf=0.85)
plain- Asserted: passes — The authors put it forward as true.
- Checkable: passes — It can be checked against evidence.
- Load-bearing: passes — The paper’s conclusions depend on it.
- Based: passes — The paper gives a reason why it holds.
- Supported
The cited sources support only part of this claim — read each source’s verdict below.
In the paper
“Sweat behaviors of only a few analytes, including ethanol and chloride, have been extensively investigated and related to blood concentrations or health status (6, 8, 27, 35).”
§ Regional and correlative sweat analysis using high-throughput microfluidic sensing patches toward decoding sweat > INTRODUCTION Sweat is an attractive biofluid for point-of-care health monitoring because it can be locally and noninvasively induced and carries diverse biomolecules ranging from small electrolytes and metabolites to hormones and larger proteins that filter in from deeper in the body (1–5). This ease of access and rich composition give sweat potential to be used to probe the state of the body at a chemical level. Sweat testing has historically been used in applications ranging from medical diagnosis of cystic fibrosis and autonomic neuropathy to assessment of fluid and electrolyte balance in endurance athletes (6–10). Traditional methods for sweat testing require off-body measurements in specialized settings by trained experts, preventing individuals from monitoring their health status immediately, independently, or routinely (11, 12). By taking advantage of flexible and hybrid electronics (13–17), wearable sweat sensors address this limitation by enabling in situ sweat measurements with real-time feedback, creating potential for preventive care, timely diagnosis, and treatment (18–34). Yet, wearable sweat sensor development has stagnated at the experimental and laboratory stage, largely due to an incomplete understanding of sweat dynamics and the physiological information carried in sweat. Sweat behaviors of only a few analytes, including ethanol and chloride, have been extensively investigated and related to blood concentrations or health status (6, 8, 27, 35). Preliminary or small-scale correlation studies have shown promising applications for other analytes such as metabolites and certain neuroimmune biomarkers present in sweat (3, 27–29, 36), including a recent work that shows how exercise sweat glucose of three healthy subjects roughly tracks their blood glucose, making a preliminary case for semiquantitative glucose prediction (29). However, more comprehensive studies are needed to robustly establish the diagnostic utility and limitations of sweat testing in these cases. One of the primary obstacles to conducting the large-scale population studies needed to decode sweat is achieving high-throughput fabrication of sweat sensors with uniform, reliable performance and high yield. This is critical to ensuring that sensors can be deployed with minimal preparatory overhead and produced in large enough quantities to support simultaneous regional sweat measurements in multisubject and longitudinal trials. Roll-to-roll (R2R) rotary screen printing is a promising method for high-throughput and cost-effective fabrication of flexible electronics (37, 38). Laser ablation allows for rapid materials patterning at small scales and is useful for engraving microfluidic channels into flexible plastic substrates (39, 40). These R2R-compatible methods are advantageous over traditional, multistep lithography and etching processes as components can be mass produced on large substrate areas at high speeds using automated systems with minimal human involvement (41). By uniting R2R rotary screen printing of sensing electronics with R2R laser cutting of microfluidic channels, we present a wearable patch that can be mass produced at high yield for simultaneous sweat flow control and electrical/electrochemical sensing. While R2R printing of electrochemical electrodes and microfluidic structures has been previously and independently introduced, the system presented here further demonstrates R2R fabrication of integrated sweat rate sensors and microfluidics, representing a key application-oriented technological advancement that can help decode the rate-dependent modulation of sweat analyte secretion (41, 42). The patch has two aligned layers: The first hosts a patterned electrode system for transducing analyte concentrations and monitoring sweat rate, and the second is a microfluidic adhesive layer with a sweat collection reservoir and a spiral microfluidic channel to guide sweat flow. Encapsulating sweat within the microfluidic facilitates accurate sweat analysis by minimizing evaporation and environmental contamination and providing efficient sweat sampling to reduce mixing and carryover effects. The wearable patch can monitor sweat parameters such as [Na+], [K+], [glucose], and sweat rate simultaneously at diverse regions of the body. We specifically demonstrate its use for applications in exercise physiology and medical health monitoring. Localized sweat behavior is extrapolated to estimate whole-body fluid and electrolyte loss toward dehydration monitoring during exercise. Regional iontophoresis sweat parameters are investigated toward decoding sweat for medical diagnostics, including studying electrolyte relations and the correlation between sweat and blood glucose levels for healthy and diabetic subjects. Through its rapid manufacturability and by enabling diverse analysis of sweat dynamics and composition, the presented device bridges a key gap in our ability to decode sweat toward personalized, point-of-care health and fitness monitoring.
What the sources say
- Not checked — no full text of the sourcecites [6] source
- Not checked — no full text of the sourcecites [8] source
- Partly supportedcites [27] sourceExperimental — accuracy not yet measured
The Significance section (page not provided) describes sweat chloride testing as an established diagnostic measure for cystic fibrosis and reports higher sweat chloride in patients than in healthy subjects. The References list names studies relating sweat ethanol to blood alcohol, but this paper does not establish the broader claim that only a few analytes have been extensively investigated. (LLM, conf=0.83)
- Not checked — no full text of the sourcecites [35] source
plainstates an association- Asserted: passes — The authors put it forward as true.
- Checkable: passes — It can be checked against evidence.
- Load-bearing: passes — The paper’s conclusions depend on it.
- Based: passes — The paper gives a reason why it holds.
The cited sources support only part of this claim — read each source’s verdict below.
In the paper
“As both Na+ and K+ in sweat share Cl− as their primary counter ion, a balance between the cation levels is consistent with the fluid’s overall charge neutrality (21).”
§ Regional and correlative sweat analysis using high-throughput microfluidic sensing patches toward decoding sweat > RESULTS AND DISCUSSION > Iontophoretic sweat relations While understanding the composition of exercise sweat is important for athletic and physiology applications, chemically induced sweat is more useful for medical diagnostics in sedentary conditions (27). For this reason, we further study sweat induced through pilocarpine iontophoresis. Figure 4 explores electrolyte trends in iontophoretic sweat obtained from two locations, the forearm and lower leg. Figure 4 (B to D) shows real-time simultaneous measurement of sweat [Na+], [K+], and secretion rate for three subjects. The time delay for onset of sweating, which is typically within 3 min after the completion of iontophoresis, is adjusted to zero for display purposes. All three subjects show slightly higher [Na+] levels for their arm compared to their leg, with comparable sweat rates in both locations. Here, subject 1 in Figs. 3E and 4E is the same subject. However, the forearm sweat [Na+] shows very different behavior in exercise and iontophoresis sweat as stimulation mechanism for sweat secretion differs. In addition, sweat [Na+] is easily influenced by factors such as sweat secretion rate and hydration status. We also observed considerable amount of variations in sweat concentration and secretion rate on single individual from day to day. All these factors can have possible contributions on observed difference in [Na+]. Figure 4 (E to G) explores the relationship between these parameters in more detail based on data obtained in Fig. 4 (B to D). While subjects 2 and 3 have [Na+] and [K+] increasing with sweat rate, subject 1 consistently shows the opposite trend. For all subjects, [Na+] and [K+] levels are positively correlated. This is corroborated by data from sweat samples collected and tested off-body using a commercial inductively coupled plasma mass spectrometry (ICP-MS) tool, as shown in Fig. 4H, for one subject whose [Na+] and [K+] levels have a Pearson’s correlation coefficient of 0.70. Similar strong correlations are found for other subjects in fig. S6. Over the course of several iontophoresis trials, it is possible to build the range of [Na+] and [K+] in the sweat of each subject. Comparing these ranges across individuals in Fig. 4 (I and J), subjects with relatively higher [Na+] tend to have lower [K+]. As both Na+ and K+ in sweat share Cl− as their primary counter ion, a balance between the cation levels is consistent with the fluid’s overall charge neutrality (21).
What the sources say
- Partly supportedcites [21] sourceExperimental — accuracy not yet measured
The Ions (mM) section identifies Na⁺ and Cl⁻ as abundant sweat ions and says Na⁺ enters the gland lumen to restore charge neutrality. It does not say that a balance between Na⁺ and K⁺ levels maintains neutrality; it instead notes that other anions, including bicarbonate, contribute to sweat’s ionic composition. (LLM, conf=0.84)
plainstates an association- Asserted: passes — The authors put it forward as true.
- Checkable: passes — It can be checked against evidence.
- Load-bearing: unclear — It is unclear whether the paper’s conclusions depend on it.
- Based: passes — The paper gives a reason why it holds.
- Partly supported
59 more claims · 1 with their cited sources checked
Create a free account to see all 113 claims and to verify the 1 reference still open.
- Probably not a substantial claim. 18
- It may state two separate claims as one. 36
Claims other papers make about this one
Each is checked against this paper’s own text: does it say what the citing paper says it does?
The source backs part of the claim, not all of it — or backs it for a different population, condition or comparison.
In the citing paper
“For this reason, most wearable sweat sensors have focused on exercise, thermal, or chemically stimulated sweat produced at rates of 10’s or 100’s of nL min−1 cm−2 or higher10–23.”
From A wearable patch for continuous analysis of thermoregulatory sweat at rest (2021) · cites this paper as [17]
Experimental — accuracy not yet measuredThe cited source says what the claim attributes to it.
In the citing paper
“Another study found a significant correlation in diabetic patients, but not healthy participants (Nyein et al. 2019).”
From Physiological mechanisms determining eccrine sweat composition (2020) · cites this paper as Nyein et al. 2019
The check wasn’t confident either way, so it gives no verdict — never disputed.
In the citing paper
“They are unable to draw low volumes of resting sweat rapidly into the device, limiting real-time assessment.”
From A wearable patch for continuous analysis of thermoregulatory sweat at rest (2021) · cites this paper as [17]
Experimental — accuracy not yet measured
Citations
Cites
Fully integrated wearable sensor arrays for multiplexed in situ perspiration analysis
Gao, W., Emaminejad, S., Nyein, H. Y. Y., Challa, S., Chen, K., Peck, A., Fahad, H. M., Ota, H., Shiraki, H., Kiriya, D., et al. (2016) · Nature · doi:10.1038/nature16521 · Cited by 5,087
Self-citationAn ultra-lightweight design for imperceptible plastic electronics
Kaltenbrunner, M., Sekitani, T., Reeder, J., Yokota, T., Kuribara, K., Tokuhara, T., Drack, M., Schwödiauer, R., Graz, I., Bauer-Gogonea, S., et al. (2013) · Nature · doi:10.1038/nature12314 · Cited by 2,485
Skin electronics from scalable fabrication of an intrinsically stretchable transistor array
Wang, S., Xu, J., Wang, W., Wang, G.-J. N., Rastak, R., Molina-Lopez, F., Chung, J. W., Niu, S., Feig, V. R., Lopez, J., et al. (2018) · Nature · doi:10.1038/nature25494 · Cited by 2,198
Lee, H., Choi, T. K., Lee, Y. B., Cho, H. R., Ghaffari, R., Wang, L., Choi, H. J., Chung, T. D., Lu, N., Hyeon, T., et al. (2016) · Nature Nanotechnology · doi:10.1038/nnano.2016.38 · Cited by 1,802
Gibson, L. E., & Cooke, R. E. (1959) · Pediatrics · doi:10.1542/peds.23.3.545 · Cited by 1,434
Wearable and flexible electronics for continuous molecular monitoring
Yang, Y., & Gao, W. (2019) · Chemical Society Reviews · doi:10.1039/c7cs00730b · Cited by 1,315
Technologies for Printing Sensors and Electronics Over Large Flexible Substrates: A Review
Khan, S., Lorenzelli, L., & Dahiya, R. S. (2015) · IEEE Sensors Journal · doi:10.1109/jsen.2014.2375203 · Cited by 1,225
Highly ordered nanowire arrays on plastic substrates for ultrasensitive flexible chemical sensors
McAlpine, M. C., Ahmad, H., Wang, D., & Heath, J. R. (2007) · Nature Materials · doi:10.1038/nmat1891 · Cited by 959
Imani, S., Bandodkar, A. J., Mohan, A. M. V., Kumar, R., Yu, S., Wang, J., & Mercier, P. P. (2016) · Nature Communications · doi:10.1038/ncomms11650 · Cited by 861
Emaminejad, S., Gao, W., Wu, E., Davies, Z. A., Yin Yin Nyein, H., Challa, S., Ryan, S. P., Fahad, H. M., Chen, K., Shahpar, Z., et al. (2017) · Proceedings of the National Academy of Sciences · doi:10.1073/pnas.1701740114 · Cited by 839
Self-citation
Research works printed but not linked: 1
- L. B. Baker, Sweat testing methodology in the field: Challenges and best practices. Sports Sci. Exchange 28, 1–6 (2016).
Cited by
Electrochemical glucose sensors in diabetes management: an updated review (2010–2020)
Teymourian, H., Barfidokht, A., & Wang, J. (2020) · Chemical Society Reviews · doi:10.1039/d0cs00304b · Cited by 881
Skin-Interfaced Wearable Sweat Sensors for Precision Medicine
Min, J., Tu, J., Xu, C., Lukas, H., Shin, S., Yang, Y., Solomon, S. A., Mukasa, D., & Gao, W. (2023) · Chemical Reviews · doi:10.1021/acs.chemrev.2c00823 · Cited by 712
Tehrani, F., Teymourian, H., Wuerstle, B., Kavner, J., Patel, R., Furmidge, A., Aghavali, R., Hosseini-Toudeshki, H., Brown, C., Zhang, F., et al. (2022) · Nature Biomedical Engineering · doi:10.1038/s41551-022-00887-1 · Cited by 625
Wearable chemical sensors for biomarker discovery in the omics era
Sempionatto, J. R., Lasalde-Ramírez, J. A., Mahato, K., Wang, J., & Gao, W. (2022) · Nature Reviews Chemistry · doi:10.1038/s41570-022-00439-w · Cited by 613
Shao, Y., Ying, Y., & Ping, J. (2020) · Chemical Society Reviews · doi:10.1039/c9cs00587k · Cited by 472
Wearable Electrochemical Glucose Sensors in Diabetes Management: A Comprehensive Review
Saha, T., Del Caño, R., Mahato, K., De la Paz, E., Chen, C., Ding, S., Yin, L., & Wang, J. (2023) · Chemical Reviews · doi:10.1021/acs.chemrev.3c00078 · Cited by 442
A wearable patch for continuous analysis of thermoregulatory sweat at rest
Nyein, H. Y. Y., Bariya, M., Tran, B., Ahn, C. H., Brown, B. J., Ji, W., Davis, N., & Javey, A. (2021) · Nature Communications · doi:10.1038/s41467-021-22109-z · Cited by 437
Self-citationWearable flexible sweat sensors for healthcare monitoring: a review
Chung, M., Fortunato, G., & Radacsi, N. (2019) · Journal of The Royal Society Interface · doi:10.1098/rsif.2019.0217 · Cited by 378
An autonomous wearable biosensor powered by a perovskite solar cell
Min, J., Demchyshyn, S., Sempionatto, J. R., Song, Y., Hailegnaw, B., Xu, C., Yang, Y., Solomon, S., Putz, C., Lehner, L. E., et al. (2023) · Nature Electronics · doi:10.1038/s41928-023-00996-y · Cited by 372
Physiological mechanisms determining eccrine sweat composition
Baker, L. B., & Wolfe, A. S. (2020) · European Journal of Applied Physiology · doi:10.1007/s00421-020-04323-7 · Cited by 367
Wang, Y., Zhao, C., Wang, J., Luo, X., Xie, L., Zhan, S., Kim, J., Wang, X., Liu, X., & Ying, Y. (2021) · Science Advances · doi:10.1126/sciadv.abe4553 · Cited by 340
Applied body-fluid analysis by wearable devices
Brasier, N., Wang, J., Gao, W., Sempionatto, J. R., Dincer, C., Ates, H. C., Güder, F., Olenik, S., Schauwecker, I., Schaffarczyk, D., et al. (2024) · Nature · doi:10.1038/s41586-024-08249-4 · Cited by 298
“…in microfluidic roll-to-roll process innovation and the rapid printing of flexible bioelectronics have led to classes of wearable biochemical-sensing solutions that exploit colorimetric and electro-chemical sensing capabilities for the real-time biochemical analysis of body fluids 10,15,94 .”
Wearable electrochemical biosensors in North America
Min, J., Sempionatto, J. R., Teymourian, H., Wang, J., & Gao, W. (2021) · Biosensors and Bioelectronics · doi:10.1016/j.bios.2020.112750 · Cited by 278
“fabrication of microfluidic sensing patches via roll-to-roll processes for reproducible sweat analysis(Nyein et al., 2019).”
Baker, L. B., Model, J. B., Barnes, K. A., Anderson, M. L., Lee, S. P., Lee, K. A., Brown, S. D., Reimel, A. J., Roberts, T. J., Nuccio, R. P., et al. (2020) · Science Advances · doi:10.1126/sciadv.abe3929 · Cited by 243
Evolution of 3D Printing Methods and Materials for Electrochemical Energy Storage
Egorov, V., Gulzar, U., Zhang, Y., Breen, S., & O'Dwyer, C. (2020) · Advanced Materials · doi:10.1002/adma.202000556 · Cited by 233
Recent advances and perspectives in sweat based wearable electrochemical sensors
Mohan, A. M. V., Rajendran, V., Mishra, R. K., & Jayaraman, M. (2020) · TrAC Trends in Analytical Chemistry · doi:10.1016/j.trac.2020.116024 · Cited by 231
Sun, H., Bu, Y., Liu, H., Wang, J., Yang, W., Li, Q., Guo, Z., Liu, C., & Shen, C. (2022) · Science Bulletin · doi:10.1016/j.scib.2022.07.020 · Cited by 226
Kong, L., Li, W., Zhang, T., Ma, H., Cao, Y., Wang, K., Zhou, Y., Shamim, A., Zheng, L., Wang, X., et al. (2024) · Advanced Materials · doi:10.1002/adma.202400333 · Cited by 227
Yao, Y., Chen, J., Guo, Y., Lv, T., Chen, Z., Li, N., Cao, S., Chen, B., & Chen, T. (2021) · Biosensors and Bioelectronics · doi:10.1016/j.bios.2021.113078 · Cited by 213
The challenges and promise of sweat sensing
Davis, N., Heikenfeld, J., Milla, C., & Javey, A. (2024) · Nature Biotechnology · doi:10.1038/s41587-023-02059-1 · Cited by 211
“In the academic laboratory or in collaboration with manufacturing facilities, researchers may achieve repeatable results using methods such as roll-to-roll screen printing of electrode designs 78 and use of pipetting robots 98 .”
InfluentialSelf-citationSempionatto, J. R., Moon, J.-M., & Wang, J. (2021) · ACS Sensors · doi:10.1021/acssensors.1c00139 · Cited by 208
Khoshmanesh, F., Thurgood, P., Pirogova, E., Nahavandi, S., & Baratchi, S. (2021) · Biosensors and Bioelectronics · doi:10.1016/j.bios.2020.112946 · Cited by 204
Wiorek, A., Parrilla, M., Cuartero, M., & Crespo, G. A. (2020) · Analytical Chemistry · doi:10.1021/acs.analchem.0c02211 · Cited by 201
Ardalan, S., Hosseinifard, M., Vosough, M., & Golmohammadi, H. (2020) · Biosensors and Bioelectronics · doi:10.1016/j.bios.2020.112450 · Cited by 195
Integrated Smart Janus Textile Bands for Self-Pumping Sweat Sampling and Analysis
He, X., Yang, S., Pei, Q., Song, Y., Liu, C., Xu, T., & Zhang, X. (2020) · ACS Sensors · doi:10.1021/acssensors.0c00563 · Cited by 187
Biomarkers and Detection Platforms for Human Health and Performance Monitoring: A Review
Sim, D., Brothers, M. C., Slocik, J. M., Islam, A. E., Maruyama, B., Grigsby, C. C., Naik, R. R., & Kim, S. S. (2022) · Advanced Science · doi:10.1002/advs.202104426 · Cited by 186
Liu, Y., Yu, Q., Luo, X., Yang, L., & Cui, Y. (2021) · Microsystems & Nanoengineering · doi:10.1038/s41378-021-00302-w · Cited by 182
State of Sweat: Emerging Wearable Systems for Real-Time, Noninvasive Sweat Sensing and Analytics
Ghaffari, R., Yang, D. S., Kim, J., Mansour, A., Wright, J. A., Model, J. B., Wright, D. E., Rogers, J. A., & Ray, T. R. (2021) · ACS Sensors · doi:10.1021/acssensors.1c01133 · Cited by 178
Zhong, B., Qin, X., Xu, H., Liu, L., Li, L., Li, Z., Cao, L., Lou, Z., Jackman, J. A., Cho, N.-J., et al. (2024) · Nature Communications · doi:10.1038/s41467-024-44751-z · Cited by 176
Soft Wearable Systems for Colorimetric and Electrochemical Analysis of Biofluids
Ghaffari, R., Choi, J., Raj, M. S., Chen, S., Lee, S. P., Reeder, J. T., Aranyosi, A. J., Leech, A., Li, W., Schon, S., et al. (2020) · Advanced Functional Materials · doi:10.1002/adfm.201907269 · Cited by 173
Zhao, T., Fu, Y., Sun, C., Zhao, X., Jiao, C., Du, A., Wang, Q., Mao, Y., & Liu, B. (2022) · Biosensors and Bioelectronics · doi:10.1016/j.bios.2022.114115 · Cited by 172
Wearable flexible microfluidic sensing technologies
Chen, S., Qiao, Z., Niu, Y., Yeo, J. C., Liu, Y., Qi, J., Fan, S., Liu, X., Lee, J. Y., & Lim, C. T. (2023) · Nature Reviews Bioengineering · doi:10.1038/s44222-023-00094-w · Cited by 168
“To produce microfluidic-based sensors at a large scale, roll-to-roll processing of polymeric rolls can be integrated with screen-printing technologies 228,229 and laser die cutting 55 , allowing the rapid (1-minute) fabrication of electrochemical and colourimetric devices.”
MethodZhai, Q., Yap, L. W., Wang, R., Gong, S., Guo, Z., Liu, Y., Lyu, Q., Wang, J., Simon, G. P., & Cheng, W. (2020) · Analytical Chemistry · doi:10.1021/acs.analchem.0c00274 · Cited by 162
Zhong, B., Jiang, K., Wang, L., & Shen, G. (2022) · Advanced Science · doi:10.1002/advs.202103257 · Cited by 164
A non-printed integrated-circuit textile for wireless theranostics
Yang, Y., Wei, X., Zhang, N., Zheng, J., Chen, X., Wen, Q., Luo, X., Lee, C.-Y., Liu, X., Zhang, X., et al. (2021) · Nature Communications · doi:10.1038/s41467-021-25075-8 · Cited by 158
“When it was nighttime (simulating when the wearer was asleep), the abnormal situation could be encoded into binaries of (10) for “high-level” risk.”
BackgroundWearable Self‐Powered Electrochemical Devices for Continuous Health Management
Parrilla, M., & Wael, K. D. (2021) · Advanced Functional Materials · doi:10.1002/adfm.202107042 · Cited by 163
A wearable sensor for the detection of sodium and potassium in human sweat during exercise
Pirovano, P., Dorrian, M., Shinde, A., Donohoe, A., Brady, A. J., Moyna, N. M., Wallace, G., Diamond, D., & McCaul, M. (2020) · Talanta · doi:10.1016/j.talanta.2020.121145 · Cited by 158
“This response pattern for Na+ is consistent with what we and others have previously published [8,17,28] during on-body trials.”
ResultWen, F., He, T., Liu, H., Chen, H.-Y., Zhang, T., & Lee, C. (2020) · Nano Energy · doi:10.1016/j.nanoen.2020.105155 · Cited by 158
“In addition to the wireless interface Bluetooth [247], many designs embed the radio frequency identity (RFID) tag to realize the device in compact and portable fashion [248].”
MethodInfluentialGlove-based sensors for multimodal monitoring of natural sweat
Bariya, M., Li, L., Ghattamaneni, R., Ahn, C. H., Nyein, H. Y. Y., Tai, L.-C., & Javey, A. (2020) · Science Advances · doi:10.1126/sciadv.abb8308 · Cited by 154
“For the alcohol sensor, electrodeposition of Au nanodendrites is followed by cyclic voltammetry to deposit two interdigitated layers each of Prussian Blue mediator and nickel hexacyanoferrate (NiHCF) stabilizer, as demonstrated in previous work (4, 51).”
MethodSelf-citationThe role of sampling in wearable sweat sensors
Liu, C., Xu, T., Wang, D., & Zhang, X. (2020) · Talanta · doi:10.1016/j.talanta.2020.120801 · Cited by 151
Zhao, J., Nyein, H. Y. Y., Hou, L., Lin, Y., Bariya, M., Ahn, C. H., Ji, W., Fan, Z., & Javey, A. (2021) · Advanced Materials · doi:10.1002/adma.202006444 · Cited by 144
Self-citationLiu, Y., Li, X., Yang, H., Zhang, P., Wang, P., Sun, Y. H., Yang, F., Liu, W., Li, Y., Tian, Y., et al. (2023) · ACS Nano · doi:10.1021/acsnano.2c11267 · Cited by 145
Integrated Devices for Non‐Invasive Diagnostics
Ates, H. C., Brunauer, A., von Stetten, F., Urban, G. A., Güder, F., Merkoçi, A., Früh, S. M., & Dincer, C. (2021) · Advanced Functional Materials · doi:10.1002/adfm.202010388 · Cited by 116
Advances in Sweat Wearables: Sample Extraction, Real-Time Biosensing, and Flexible Platforms
Qiao, L., Benzigar, M. R., Subramony, J. A., Lovell, N. H., & Liu, G. (2020) · ACS Applied Materials & Interfaces · doi:10.1021/acsami.0c07614 · Cited by 144
Advances in Biosensing and Environmental Monitoring Based on Electrospun Nanofibers
Kang, S., Zhao, K., Yu, D., Zheng, X., & Huang, C. (2022) · Advanced Fiber Materials · doi:10.1007/s42765-021-00129-0 · Cited by 138
From the beaker to the body: translational challenges for electrochemical, aptamer-based sensors
Arroyo-Currás, N., Dauphin-Ducharme, P., Scida, K., & Chávez, J. L. (2020) · Analytical Methods · doi:10.1039/d0ay00026d · Cited by 129
Engineering Materials for Electrochemical Sweat Sensing
Wang, Z., Shin, J., Park, J., Lee, H., Kim, D., & Liu, H. (2020) · Advanced Functional Materials · doi:10.1002/adfm.202008130 · Cited by 145
Wearable Biosensors for Body Computing
Lin, Y., Bariya, M., & Javey, A. (2020) · Advanced Functional Materials · doi:10.1002/adfm.202008087 · Cited by 138
Self-citationRecent Advances in Electrochemical Sensors for Wearable Sweat Monitoring: A Review
Yeung, K. K., Huang, T., Hua, Y., Zhang, K., Yuen, M. M. F., & Gao, Z. (2021) · IEEE Sensors Journal · doi:10.1109/jsen.2021.3074311 · Cited by 134
Reeder, J. T., Xue, Y., Franklin, D., Deng, Y., Choi, J., Prado, O., Kim, R., Liu, C. Y., Hanson, J., Ciraldo, J. P., et al. (2019) · Nature Communications · doi:10.1038/s41467-019-13431-8 · Cited by 129
Khor, S. M., Choi, J., Won, P., & Ko, S. H. (2022) · Nanomaterials · doi:10.3390/nano12020221 · Cited by 137
“Roll-to-roll (R2R) rotary screen printing is a promising method for producing highperformance and cost-effective flexible wearable electronics [51] (Figure 6a).”
BackgroundMethodInfluentialFlexible Electrochemical Biosensors for Health Monitoring
Yang, A., & Yan, F. (2021) · ACS Applied Electronic Materials · doi:10.1021/acsaelm.0c00534 · Cited by 122
Wearable potentiometric biosensor for analysis of urea in sweat
Ibáñez-Redín, G., Cagnani, G. R., Gomes, N. O., Raymundo‐Pereira, P. A., Machado, S. A. S., Gutierrez, M. A., Krieger, J. E., & Oliveira, O. N. (2022) · Biosensors and Bioelectronics · doi:10.1016/j.bios.2022.114994 · Cited by 129
Bio-inspired flexible electronics for smart E-skin
Nie, B., Liu, S., Qu, Q., Zhang, Y., Zhao, M., & Liu, J. (2021) · Acta Biomaterialia · doi:10.1016/j.actbio.2021.06.018 · Cited by 130
Sweat as a Source of Next-Generation Digital Biomarkers
Brasier, N., & Eckstein, J. (2019) · Digital Biomarkers · doi:10.1159/000504387 · Cited by 129
Flexible Sweat Sensors: From Films to Textiles
Luo, D., Sun, H., Li, Q., Niu, X., He, Y., & Liu, H. (2023) · ACS Sensors · doi:10.1021/acssensors.2c02642 · Cited by 121
Li, H., Wu, G., Weng, Z., Sun, H., Nistala, R., & Zhang, Y. (2021) · ACS Sensors · doi:10.1021/acssensors.0c02330 · Cited by 122
Hybrid Integration of Wearable Devices for Physiological Monitoring
Zhang, Y., Zheng, X. T., Zhang, X., Pan, J., & Thean, A. (2024) · Chemical Reviews · doi:10.1021/acs.chemrev.3c00471 · Cited by 137
A Bionic Skin for Health Management: Excellent Breathability, In Situ Sensing, and Big Data Analysis
Shi, S., Ming, Y., Wu, H., Zhi, C., Yang, L., Meng, S., Si, Y., Wang, D., Fei, B., & Hu, J. (2023) · Advanced Materials · doi:10.1002/adma.202306435 · Cited by 124
Pu, X., Tang, Q., Chen, W., Huang, Z., Liu, G., Zeng, Q., Chen, J., Guo, H., Xin, L., & Hu, C. (2020) · Nano Energy · doi:10.1016/j.nanoen.2020.105047 · Cited by 106
Zhao, J., Zha, J., Zeng, Z., & Tan, C. (2021) · Journal of Materials Chemistry A · doi:10.1039/d1ta02493k · Cited by 107
Self-citationWearable Sweat Biosensors Refresh Personalized Health/Medical Diagnostics
Ji, W., Zhu, J., Wu, W., Wang, N., Wang, J., Wu, J., Wu, Q., Wang, X., Yu, C., Wei, G., et al. (2021) · Research · doi:10.34133/2021/9757126 · Cited by 126
Recent progress in the fabrication of flexible materials for wearable sensors
Liu, H., Wang, L., Lin, G., & Feng, Y. (2021) · Biomaterials Science · doi:10.1039/d1bm01136g · Cited by 113
Park, H., Park, W., & Lee, C. H. (2021) · NPG Asia Materials · doi:10.1038/s41427-020-00280-x · Cited by 114
Access and Management of Sweat for Non‐Invasive Biomarker Monitoring: A Comprehensive Review
Saha, T., Caño, R. D., la Paz, E. D., Sandhu, S. S., & Wang, J. (2022) · Small · doi:10.1002/smll.202206064 · Cited by 105
Flexible Wearable Sensors in Medical Monitoring
Yuan, Y., Лю, Б., Li, H., Li, M., Song, Y., Wang, R., Wang, T., & Zhang, H. (2022) · Biosensors · doi:10.3390/bios12121069 · Cited by 118
Hybridized wearable patch as a multi-parameter and multi-functional human-machine interface
Tang, G., Shi, Q., Zhang, Z., He, T., Sun, Z., & Lee, C. (2020) · Nano Energy · doi:10.1016/j.nanoen.2020.105582 · Cited by 103
Poletti, F., Zanfrognini, B., Favaretto, L., Quintano, V., Sun, J., Treossi, E., Melucci, M., Palermo, V., & Zanardi, C. (2021) · Sensors and Actuators B Chemical · doi:10.1016/j.snb.2021.130253 · Cited by 105
Recent advances of flexible sensors for biomedical applications
Shen, G. (2021) · Progress in Natural Science Materials International · doi:10.1016/j.pnsc.2021.10.005 · Cited by 106
Wearable soft electrochemical microfluidic device integrated with iontophoresis for sweat biosensing
Bolat, G., la Paz, E. D., Azeredo, N. F. B., Kartolo, M., Kim, J., Silva, A. N. D. L. E., Rueda, R. D. Z., Brown, C., Angnes, L., Wang, J., et al. (2022) · Analytical and Bioanalytical Chemistry · doi:10.1007/s00216-021-03865-9 · Cited by 104
Reddy, V. S., Agarwal, B., Ye, Z., Zhang, C., Roy, K., Chinnappan, A., Narayan, R. J., Ramakrishna, S., & Ghosh, R. (2022) · Nanomaterials · doi:10.3390/nano12071082 · Cited by 107
Materials, Structure, and Interface of Stretchable Interconnects for Wearable Bioelectronics
Li, Y., Veronica, A., Ma, J., & Nyein, H. Y. Y. (2024) · Advanced Materials · doi:10.1002/adma.202408456 · Cited by 124
Self-citationDetection of low glucose levels in sweat with colorimetric wearable biosensors
Vaquer, A., Barón, E., & de la Rica, R. (2021) · The Analyst · doi:10.1039/d1an00283j · Cited by 89
Hydrophilic metal-organic frameworks integrated uricase for wearable detection of sweat uric acid
Xiao, J., Luo, Y., Su, L., Lu, J., Han, W., Xu, T., & Zhang, X. (2022) · Analytica Chimica Acta · doi:10.1016/j.aca.2022.339843 · Cited by 93
Epidermal wearable optical sensors for sweat monitoring
Wang, J., Luo, Y., Zhou, Z., Xiao, J., Xu, T., & Zhang, X. (2024) · Communications Materials · doi:10.1038/s43246-024-00518-z · Cited by 97
Nicotine Monitoring with a Wearable Sweat Band
Tai, L., Ahn, C. H., Nyein, H. Y. Y., Ji, W., Bariya, M., Lin, Y., Li, L., & Javey, A. (2020) · ACS Sensors · doi:10.1021/acssensors.0c00791 · Cited by 88
Self-citationIn-situ preparation of lactate-sensing membrane for the noninvasive and wearable analysis of sweat
Jiang, D., Xu, C., Zhang, Q., Ye, Y., Cai, Y., Li, K. C., Li, Y., Huang, X., & Wang, Y. (2022) · Biosensors and Bioelectronics · doi:10.1016/j.bios.2022.114303 · Cited by 88
Highly Concentrated, Conductive, Defect-free Graphene Ink for Screen-Printed Sensor Application
Kim, D. S., Jeong, J.-M., Park, H. J., Kim, Y. K., Lee, K. G., & Choi, B. G. (2021) · Nano-Micro Letters · doi:10.1007/s40820-021-00617-3 · Cited by 104
Bauer, M., Wunderlich, L., Weinzierl, F., Lei, Y., Duerkop, A., Alshareef, H. N., & Baeumner, A. J. (2020) · Analytical and Bioanalytical Chemistry · doi:10.1007/s00216-020-02939-4 · Cited by 89
“Glucose Amperometric, enzymatic (GOx) SPE, graphite/Ag in microfluidic PET patch 11 μM 50–200 μM 1 nA/μM 1 min 2019 [49]”
MethodGarland, N. T., Schmieder, J., Johnson, Z. T., Hjort, R. G., Chen, B., Andersen, C., Sanborn, D., Kjeldgaard, G., Pola, C. C., Li, J., et al. (2023) · ACS Applied Materials & Interfaces · doi:10.1021/acsami.3c04665 · Cited by 90
Klous, L., de Ruiter, C. J., Scherrer, S., Gerrett, N., & Daanen, H. A. M. (2021) · European Journal of Applied Physiology · doi:10.1007/s00421-020-04562-8 · Cited by 86
Xu, J., Zhang, Z., Gan, S., Gao, H., Kong, H., Song, Z., Ge, X., Bao, Y., & Niu, L. (2020) · ACS Sensors · doi:10.1021/acssensors.0c00960 · Cited by 82
Demuru, S., Kunnel, B. P., & Briand, D. (2020) · Advanced Materials Technologies · doi:10.1002/admt.202000328 · Cited by 89
Hu, B., Kang, X., Xu, S., Zhu, J., Yang, L., & Jiang, C. (2023) · Analytical Chemistry · doi:10.1021/acs.analchem.2c03806 · Cited by 79
Liu, T., Liu, L., Gou, G., Fang, Z., Sun, J., Chen, J., Cheng, J., Han, M., Ma, T., Liu, C., et al. (2023) · ACS Applied Materials & Interfaces · doi:10.1021/acsami.3c02690 · Cited by 80
Park, H. J., Jeong, J., Son, S. G., Kim, S. J., Lee, M., Kim, H., Jeong, J., Hwang, S. Y., Park, J., Eom, Y., et al. (2021) · Advanced Functional Materials · doi:10.1002/adfm.202011059 · Cited by 75
Yu, M., Li, Y., Hu, Y., Tang, L., Yang, F., Lv, W.-L., Zhang, Z., & Zhang, G. (2021) · Journal of Electroanalytical Chemistry · doi:10.1016/j.jelechem.2021.115029 · Cited by 80
Involvement of metal organic frameworks in wearable electrochemical sensor for efficient performance
Sharma, A., Singh, A., Gupta, V., Sundramoorthy, A. K., & Arya, S. K. (2023) · Trends in Environmental Analytical Chemistry · doi:10.1016/j.teac.2023.e00200 · Cited by 77
Wearable strain sensor for real-time sweat volume monitoring
Wang, L., Xu, T., Fan, C. G., & Zhang, X. (2020) · iScience · doi:10.1016/j.isci.2020.102028 · Cited by 76
Clinical Opportunities for Continuous Biosensing and Closed-Loop Therapies
Li, J., Liang, J., Laken, S. J., Langer, R., & Traverso, G. (2020) · Trends in Chemistry · doi:10.1016/j.trechm.2020.02.009 · Cited by 77
Ahamed, A., Ge, L., Zhao, K., Veksha, A., Bobacka, J., & Lisak, G. (2021) · Chemosphere · doi:10.1016/j.chemosphere.2021.130462 · Cited by 73
Emerging wearable flexible sensors for sweat analysis
Heng, W., Yang, G., Kim, W. S., & Xu, K. (2021) · Bio-Design and Manufacturing · doi:10.1007/s42242-021-00171-2 · Cited by 75
Hussain, S., & Park, S. (2020) · ACS Sensors · doi:10.1021/acssensors.0c01757 · Cited by 76
Ultra-simple wearable local sweat volume monitoring patch based on swellable hydrogels
Zhao, F. J., Bonmarin, M., Chen, Z. C., Larson, M., Fay, D., Runnoe, D., & Heikenfeld, J. (2020) · Lab on a Chip · doi:10.1039/c9lc00911f · Cited by 71
Paul, B., Demuru, S., Lafaye, C., Saubade, M., & Briand, D. (2021) · Advanced Materials Technologies · doi:10.1002/admt.202000910 · Cited by 73
A wearable electrochemical fabric for cytokine monitoring
Chu, H., Hu, X., Lee, C.-Y., Zhang, A., Ye, Y., Wang, Y., Chen, Y., Yan, X., Wang, X., Wei, J., et al. (2023) · Biosensors and Bioelectronics · doi:10.1016/j.bios.2023.115301 · Cited by 71
Li, L., Tan, Y., Xu, W., Ni, Y., Yang, J., & Tan, D. (2023) · International Journal of Mechanical Sciences · doi:10.1016/j.ijmecsci.2023.108376 · Cited by 69
Lee, D., Bhardwaj, J., & Jang, J. (2022) · Scientific Reports · doi:10.1038/s41598-022-06101-1 · Cited by 74
Demuru, S., Huang, C.-H., Parvez, K., Worsley, R. E., Mattana, G., Piro, B., Noël, V., Casiraghi, C., & Briand, D. (2022) · ACS Applied Nano Materials · doi:10.1021/acsanm.1c04434 · Cited by 74
Skin-interfaced colorimetric microfluidic devices for on-demand sweat analysis
Liu, W., Cheng, H., & Wang, X. (2023) · npj Flexible Electronics · doi:10.1038/s41528-023-00275-y · Cited by 80
Metadata
- Authors
- Nyein, H. Y. Y., Bariya, M., Kivimäki, L., Uusitalo, S., Liaw, T. S., Jansson, E., Ahn, C. H., Hangasky, J. A., Zhao, J., Lin, Y., Happonen, T., Chao, M., Liedert, C., Zhao, Y., Tai, L.-C., Hiltunen, J., & Javey, A.
- Affiliations
- Lawrence Berkeley National Laboratory (US)
- VTT Technical Research Centre of Finland (FI)
- University of California, Berkeley (US)
- QB3 (US)
- Corresponding author
- Javey, Ali
- ORCID
- Venue
- Science Advances
- Published
- 2019-08-02
- Volume
- 5
- Issue
- 8
- Pages
- eaaw9906-eaaw9906
- ISSN
- 2375-2548 (ISSN-L)
- PMC
- PMC6697435
- OpenAlex
- W2966925761
- Cited by
- 388
- References
- 49
- Citations by year
- 2026: 46 · 2025: 57 · 2024: 56 · 2023: 59 · 2022: 71 · 2021: 47 · 2020: 45 · 2019: 6
- FWCI
- 14.87
- Type
- journal article
- Language
- en
- Open access
- gold
- doi.org
- Licence
- cc-by-nc
- Locations
- Science Advances (publishedVersion, cc-by-nc)
- PubMed Central (publishedVersion, cc-by-nc)
- PubMed (publishedVersion)
- eScholarship (California Digital Library) (submittedVersion, cc-by-nc)
- OSTI OAI (U.S. Department of Energy Office of Scientific and Technical Information) (submittedVersion)
- eScholarship (California Digital Library) (submittedVersion)
- Rare & Special e-Zone (The Hong Kong University of Science and Technology) (submittedVersion)
- Funders
- National Science Foundation Nanomanufacturing Systems for Mobile Computing and Mobile Energy Technologies
- Berkeley Sensor and Actuator Center
- Bakar fellowship
- Topics
- Physical Sciences › Engineering › Biomedical Engineering › Advanced Sensor and Energy Harvesting Materials
- Physical Sciences › Chemistry › Analytical Chemistry › Electrochemical sensors and biosensors
- Physical Sciences › Engineering › Biomedical Engineering › Microfluidic and Capillary Electrophoresis Applications
- Keywords
- sweat analysis, high-throughput sensing, sweat glucose, sweat rate, diabetes mellitus, point-of-care testing, athletic performance monitoring
- MeSH terms
- Diabetes Mellitus, Glucose, Humans, Ions, Potassium, Sodium, Sweat, Biosensing Techniques, Microfluidics, High-Throughput Screening Assays
About these checks
Registry, retraction, Cites and statistics results are computed, not judged, with one exception: a printed reference that no index lists is read once by a model before it counts as a citation error. Claims are extracted by a model and kept only when their quote appears verbatim in the text; each cited source is then checked, with a model’s help, for whether it says what the claim relies on. Those verdicts can be wrong — read the claim’s quote and the cited source before relying on one.
The claim verdicts this report counts are experimental: their accuracy is not yet measured.
A language model drew the claims from the paper on 2026-10-10, under version 3 of the claim definition (model deepseek-v4.1-flash, prompt extract-v3).
A second model labelled each claim on 2026-10-10 (model jev-1.13-20260917, definition revision gold-guideline-v0.2).
Cited sources are checked with a language model’s help (gpt-6-sol and qwen3.8-omni-flash).
Statistics and arithmetic are recomputed, not judged.
Confidence bands are shown only for fields calibrated on our annotated test set. None is calibrated yet, so no band is shown.
What counts as a claim ›How we measure confidence ›How we check this ›
Are you an author, or do you see a problem with this page? Request a review
Data sources
Bibliographic data: Semantic Scholar, OpenAlex, Crossref.
Contains information from the Semantic Scholar Academic Graph Datasets, made available under the ODC Attribution License (ODC-BY 1.0).
Semantic Scholar’s data is described in: Kinney, R., et al. (2023). The Semantic Scholar Open Data Platform. arXiv:2301.10140.
