

The DOI matches its Crossref record; 33 of the 33 references it cites were found in a registry or an index.
Metatranscriptomics of the Human Oral Microbiome during Health and Disease
Open accessAbstract
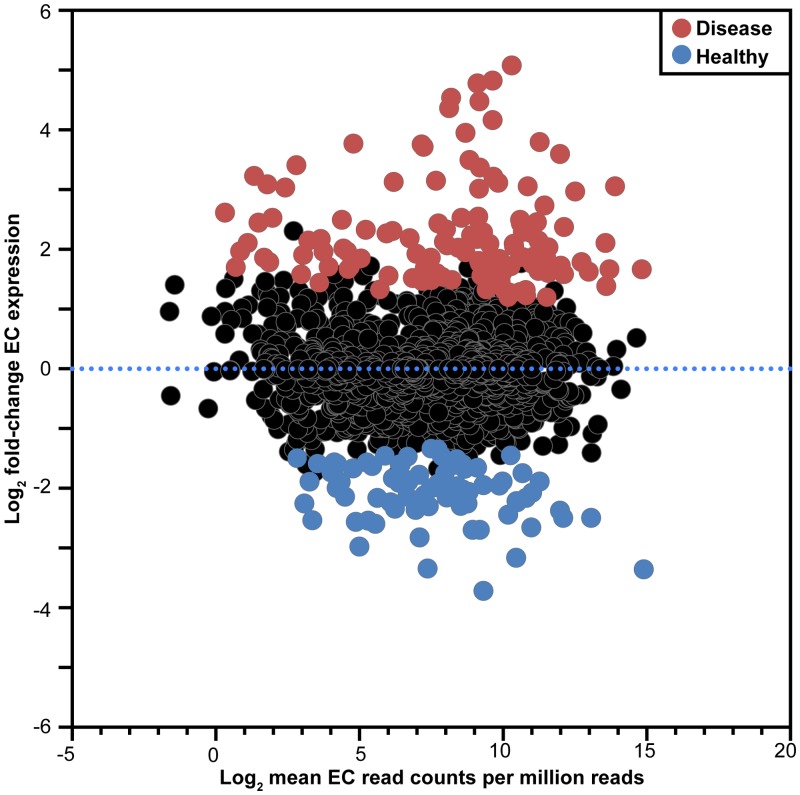
The human microbiome plays important roles in health, but when disrupted, these same indigenous microbes can cause disease. The composition of the microbiome changes during the transition from health to disease; however, these changes are often not conserved among patients. Since microbiome-associated diseases like periodontitis cause similar patient symptoms despite interpatient variability in microbial community composition, we hypothesized that human-associated microbial communities undergo conserved changes in metabolism during disease. Here, we used patient-matched healthy and diseased samples to compare gene expression of 160,000 genes in healthy and diseased periodontal communities. We show that health- and disease-associated communities exhibit defined differences in metabolism that are conserved between patients. In contrast, the metabolic gene expression of individual species was highly variable between patients. These results demonstrate that despite high interpatient variability in microbial composition, disease-associated communities display conserved metabolic profiles that are generally accomplished by a patient-specific cohort of microbes. IMPORTANCE The human microbiome project has shown that shifts in our microbiota are associated with many diseases, including obesity, Crohn’s disease, diabetes, and periodontitis. While changes in microbial populations are apparent during these diseases, the species associated with each disease can vary from patient to patient. Taking into account this interpatient variability, we hypothesized that specific microbiota-associated diseases would be marked by conserved microbial community behaviors. Here, we use gene expression analyses of patient-matched healthy and diseased human periodontal plaque to show that microbial communities have highly conserved metabolic gene expression profiles, whereas individual species within the community do not. Furthermore, disease-associated communities exhibit conserved changes in metabolic and virulence gene expression.
Overview
The claims and statistics of this paper haven’t been checked yet.
Run the check — free, no account needed. It reads the open-access text and checks the sources it cites.
Integrity signals
Registry
Cites
Statistics
Figures
Verification
Claims the paper makes
The claims and statistics of this paper haven’t been checked yet.
Run the check — free, no account needed. It reads the open-access text and checks the sources it cites.
Claims other papers make about this one
Each is checked against this paper’s own text: does it say what the citing paper says it does?
In the citing paper
“Culture‐independent methods have improved our understanding of microbial diversity in the oral cavity.”
From The oral microbiome: Role of key organisms and complex networks in oral health and disease (2021) · cites this paper as [14]
In the citing paper
“Application of transcriptomic approaches has proved extremely significant for delineating both microbial and host gene expression in the context of oral health and pathology.14, 68, 94”
From The oral microbiome: Role of key organisms and complex networks in oral health and disease (2021) · cites this paper as [14]
In the citing paper
“However, despite dissimilar phylogeny, functional signatures among the oral microbiota are often conserved from one individual to another.13, 14”
From The oral microbiome: Role of key organisms and complex networks in oral health and disease (2021) · cites this paper as [14]
Self-check
Percentages, sums and reported differences re-computed from the paper’s own numbers.
The self-check needs the paper’s full text.
Citations
Cites
Fast gapped-read alignment with Bowtie 2
Langmead, B., & Salzberg, S. L. (2012) · Nature Methods · doi:10.1038/nmeth.1923 · Cited by 56,400
QIIME allows analysis of high-throughput community sequencing data
Caporaso, J. G., Kuczynski, J., Stombaugh, J., Bittinger, K., Bushman, F. D., Costello, E. K., Fierer, N., Peña, A. G., Goodrich, J. K., Gordon, J. I., et al. (2010) · Nature Methods · doi:10.1038/nmeth.f.303 · Cited by 34,887
KEGG: Kyoto Encyclopedia of Genes and Genomes
Ogata, H., Goto, S., Sato, K., Fujibuchi, W., Bono, H., & Kanehisa, M. (1999) · Nucleic Acids Research · doi:10.1093/nar/27.1.29 · Cited by 31,232
Greengenes, a Chimera-Checked 16S rRNA Gene Database and Workbench Compatible with ARB
DeSantis, T. Z., Hugenholtz, P., Larsen, N., Rojas, M., Brodie, E. L., Keller, K., Huber, T., Dalevi, D., Hu, P., & Andersen, G. L. (2006) · Applied and Environmental Microbiology · doi:10.1128/aem.03006-05 · Cited by 10,891
Diet rapidly and reproducibly alters the human gut microbiome
David, L. A., Maurice, C. F., Carmody, R. N., Gootenberg, D. B., Button, J. E., Wolfe, B. E., Ling, A. V., Devlin, A. S., Varma, Y., Fischbach, M. A., et al. (2014) · Nature · doi:10.1038/nature12820 · Cited by 10,100
Predictive functional profiling of microbial communities using 16S rRNA marker gene sequences
Langille, M. G. I., Zaneveld, J., Caporaso, J. G., McDonald, D., Knights, D., Reyes, J. A., Clemente, J. C., Burkepile, D. E., Vega Thurber, R. L., Knight, R., et al. (2013) · Nature Biotechnology · doi:10.1038/nbt.2676 · Cited by 9,116
Ultra-high-throughput microbial community analysis on the Illumina HiSeq and MiSeq platforms
Caporaso, J. G., Lauber, C. L., Walters, W. A., Berg-Lyons, D., Huntley, J., Fierer, N., Owens, S. M., Betley, J., Fraser, L., Bauer, M., et al. (2012) · The ISME Journal · doi:10.1038/ismej.2012.8 · Cited by 8,839
Human gut microbes associated with obesity
Ley, R. E., Turnbaugh, P. J., Klein, S., & Gordon, J. I. (2006) · Nature · doi:10.1038/4441022a · Cited by 8,785
UniFrac: a New Phylogenetic Method for Comparing Microbial Communities
Lozupone, C., & Knight, R. (2005) · Applied and Environmental Microbiology · doi:10.1128/aem.71.12.8228-8235.2005 · Cited by 8,227
Interactions Between the Microbiota and the Immune System
Hooper, L. V., Littman, D. R., & Macpherson, A. J. (2012) · Science · doi:10.1126/science.1223490 · Cited by 4,173
Cited by
Sorted by citations
Periodontitis: from microbial immune subversion to systemic inflammation
Hajishengallis, G. (2015) · Nature Reviews Immunology · doi:10.1038/nri3785 · Cited by 3,046
“Dysbiotic microbial communities in the periodontium resist immune elimination and create permissive conditions for growth in a nutritionally favourable inflammatory environment 11,13,17-19, 41 , 42 .”
BackgroundOral microbiomes: more and more importance in oral cavity and whole body
Gao, L., Xu, T., Huang, G., Jiang, S., Gu, Y., & Chen, F. (2018) · Protein & Cell · doi:10.1007/s13238-018-0548-1 · Cited by 770
“However, imbalance of microbial flora contributes to oral diseases such as dental caries, periodontitis (Holt et al., 1988; Jorth et al., 2014; Liu et al., 2012; Philip et al., 2018; Wasfi et al., 2018; Costalonga and Herzberg, 2014), oral mucosal diseases (Saikaly, 2018) and systemic diseases,…”
BackgroundInfluentialThe oral microbiome: Role of key organisms and complex networks in oral health and disease
Sedghi, L., DiMassa, V., Harrington, A., Lynch, S. V., & Kapila, Y. L. (2021) · Periodontology 2000 · doi:10.1111/prd.12393 · Cited by 755
The role of the microbiota in periodontal disease
Curtis, M. A., Diaz, P. I., & Van Dyke, T. E. (2020) · Periodontology 2000 · doi:10.1111/prd.12296 · Cited by 698
Honeybee gut microbiota promotes host weight gain via bacterial metabolism and hormonal signaling
Zheng, H., Powell, J. E., Steele, M. I., Dietrich, C., & Moran, N. A. (2017) · Proceedings of the National Academy of Sciences · doi:10.1073/pnas.1701819114 · Cited by 664
Polymicrobial synergy and dysbiosis in inflammatory disease
Lamont, R. J., & Hajishengallis, G. (2015) · Trends in Molecular Medicine · doi:10.1016/j.molmed.2014.11.004 · Cited by 585
Insights into the human oral microbiome
Verma, D., Garg, P. K., & Dubey, A. K. (2018) · Archives of Microbiology · doi:10.1007/s00203-018-1505-3 · Cited by 586
“Therefore, NGS has been widely adopted to sequence a large number of samples for generating massive data rapidly in a cost-effective manner (Zaura et al. 2009; Ling et al. 2010; Alcaraz et al. 2012; Liu et al. 2012; Hasan et al. 2014; Jorth et al. 2014; Xu et al. 2014; Ambardar et al. 2016; Galloway et al. 2017; Menon…”
BackgroundMetagenomics, Metatranscriptomics, and Metabolomics Approaches for Microbiome Analysis
Aguiar‐Pulido, V., Huang, W., Suárez-Ulloa, V., Cickovski, T., Mathee, K., & Narasimhan, G. (2016) · Evolutionary Bioinformatics · doi:10.4137/ebo.s36436 · Cited by 549
The Human Oral Microbiome in Health and Disease: From Sequences to Ecosystems
Willis, J. R., & Gabaldón, T. (2020) · Microorganisms · doi:10.3390/microorganisms8020308 · Cited by 495
“One study that employed metatranscriptomics techniques compared the expression profiles of 160,000 genes and showed conserved differences in metabolism, despite variation in microbiome composition, suggesting that, in a disease state, the organisms present in a sample perform similar functions, even if species differ…”
BackgroundPresent status and future directions: Microbiology of endodontic infections
Siqueira, J. F., Jr., & Rôças, I. N. (2021) · International Endodontic Journal · doi:10.1111/iej.13677 · Cited by 447
Resilience of the Oral Microbiota in Health: Mechanisms That Prevent Dysbiosis
Rosier, B. T., Marsh, P. D., & Mira, A. (2018) · Journal of Dental Research · doi:10.1177/0022034517742139 · Cited by 448
The inflammophilic character of the periodontitis-associated microbiota
Hajishengallis, G. (2014) · Molecular Oral Microbiology · doi:10.1111/omi.12065 · Cited by 407
“…that periodontitis is not caused by a select few bacteria, historically referred to as ‘periopathogens’ (Abusleme et al ., 2013; Dewhirst et al ., 2010; Duran-Pinedo et al ., 2014; Griffen et al ., 2012; Hajishengallis et al ., 2011; Jiao et al ., 2013; Jorth et al ., 2014; Orth et al ., 2011).”
Ecology of the Oral Microbiome: Beyond Bacteria
Baker, J. L., Bor, B., Agnello, M., Shi, W., & He, X. (2017) · Trends in Microbiology · doi:10.1016/j.tim.2016.12.012 · Cited by 376
“disease than the species that are present [30, 31].”
BackgroundThe Oral Microbiome and Cancer
Irfan, M., Delgado, R. Z. R., & Frias-Lopez, J. (2020) · Frontiers in Immunology · doi:10.3389/fimmu.2020.591088 · Cited by 341
Yost, S. C., Duran-Pinedo, A. E., Teles, R. P., Krishnan, K., & Frias‐Lopez, J. (2015) · Genome Medicine · doi:10.1186/s13073-015-0153-3 · Cited by 350
“To date, only a few studies have been used to study the transcriptome of the community-wide oral microbiome, either to characterize microbial expression in caries [50,51] or periodontitis [52] but none of them addressed the question of why some dental site suffer peridontitis progression while other remain stable.”
BackgroundThe microbiome extends host evolutionary potential
Henry, L. P., Bruijning, M., Forsberg, S. K. G., & Ayroles, J. F. (2021) · Nature Communications · doi:10.1038/s41467-021-25315-x · Cited by 373
Staphylococcus aureus Shifts toward Commensalism in Response to Corynebacterium Species
Ramsey, M. M., Freire, M. O., Gabrilska, R. A., Rumbaugh, K. P., & Lemon, K. P. (2016) · Frontiers in Microbiology · doi:10.3389/fmicb.2016.01230 · Cited by 299
“RNAseq libraries were prepared using methods adapted from those described previously (Jorth et al., 2014).”
MethodThe Evolving Microbiome of Dental Caries
Spatafora, G. A., Li, Y., He, X., Cowan, A. N., & Tanner, A. C. R. (2024) · Microorganisms · doi:10.3390/microorganisms12010121 · Cited by 341
“[216,217].”
Pseudomonas aeruginosa transcriptome during human infection
Cornforth, D. M., Dees, J. L., Ibberson, C. B., Huse, H., Mathiesen, I. H. M., Kirketerp‐Møller, K., Wolcott, R. D., Rumbaugh, K. P., Bjarnsholt, T., & Whiteley, M. (2018) · Proceedings of the National Academy of Sciences · doi:10.1073/pnas.1717525115 · Cited by 270
Self-citationBikel, S., Valdez-Lara, A., Cornejo-Granados, F., Rico, K., Canizales-Quinteros, S., Soberón, X., Del Pozo-Yauner, L., & Ochoa-Leyva, A. (2015) · Computational and Structural Biotechnology Journal · doi:10.1016/j.csbj.2015.06.001 · Cited by 263
“For example, through the mapping of metatranscriptomic sequences to KEGG database [64], the pathways whose expressed genes are up and down regulated or unchanged in the microbiome during health and disease conditions are obtained [84].”
Sharma, N., Bhatia, S., Sodhi, A. S., & Batra, N. (2018) · AIMS Microbiology · doi:10.3934/microbiol.2018.1.42 · Cited by 275
Oral Bacteria and Intestinal Dysbiosis in Colorectal Cancer
Koliarakis, I., Messaritakis, I., Νikolouzakis, Τ. Κ., Hamilos, G., Souglakos, J., & Tsiaoussis, J. (2019) · International Journal of Molecular Sciences · doi:10.3390/ijms20174146 · Cited by 255
“gingivalis can further shape the biofilm structure, altering the growth and gene expression of passenger bacteria, and impairing host immunity, through several virulence factors [128].”
BackgroundNew Technologies for Studying Biofilms
Franklin, M. J., Chang, C. B., Akiyama, T., & Bothner, B. B. (2015) · Microbiology Spectrum · doi:10.1128/microbiolspec.mb-0016-2014 · Cited by 238
Gil‐Cardoso, K., Ginés, I., Pinent, M., Ardèvol, A., Blay, M., & Terra, X. (2016) · Nutrition Research Reviews · doi:10.1017/s0954422416000159 · Cited by 236
“In mammals, the microbiota is involved in the maintenance and development of the immune system, in the regulation of several metabolic pathways, and in general body homeostasis((123,124)).”
BackgroundDysbiosis in chronic periodontitis: Key microbial players and interactions with the human host
Deng, Z.-L., Szafrański, S. P., Jarek, M., Bhuju, S., & Wagner‐Döbler, I. (2017) · Scientific Reports · doi:10.1038/s41598-017-03804-8 · Cited by 230
Comparative In silico Analysis of Butyrate Production Pathways in Gut Commensals and Pathogens
Anand, S., Kaur, H., & Mande, S. S. (2016) · Frontiers in Microbiology · doi:10.3389/fmicb.2016.01945 · Cited by 225
“These butyrogenic oral pathogens include Fusobacterium nucleatum (discussed earlier in this manuscript) which primarily utilizes amino acid metabolism for butyrate production (Jorth et al., 2014).”
BackgroundResultInfluentialThe periodontal war: microbes and immunity
Ebersole, J. L., Dawson, D. R., Emecen‐Huja, P., Nagarajan, R., Howard, K., Grady, M. E., Thompson, K. L., Peyyala, R., Al‐Attar, A., Lethbridge, K., et al. (2017) · Periodontology 2000 · doi:10.1111/prd.12222 · Cited by 217
“Thus, an important newer initiative is identifying novel bioinformatics approaches to help visualize and interpret the diversity of the metagenomics signatures in healthy and diseased sulci (456), as well as the metatransciptomic patterns that are needed to provide clear insights into the biology of the host–bacteria…”
BackgroundChronic Inflammation as a Link between Periodontitis and Carcinogenesis
Hoare, A., Soto, C., Rojas-Celis, V., & Bravo, D. (2019) · Mediators of Inflammation · doi:10.1155/2019/1029857 · Cited by 219
“nucleatum has been found to be transcriptionally active in different forms of periodontal diseases [147, 148].”
BackgroundTools for Analysis of the Microbiome
Galloway-Peña, J., & Hanson, B. (2020) · Digestive Diseases and Sciences · doi:10.1007/s10620-020-06091-y · Cited by 234
“Comparisons are made between different groups or variables to determine which pathways are up- and down-regulated or during different health and disease conditions [56].”
BackgroundSijen, T. (2014) · Forensic Science International Genetics · doi:10.1016/j.fsigen.2014.11.015 · Cited by 194
“health issues such as periodontitis, obesity, inflammatory bowel diseases and vaginosis [34,35].”
BackgroundDuran-Pinedo, A. E., & Frias-Lopez, J. (2015) · Microbes and Infection · doi:10.1016/j.micinf.2015.03.014 · Cited by 187
“Metatranscriptome analysis has been just recently performed to study oral communities in caries [52], periodontitis [50,53] and during biofilm formation and after meal ingestion [49], giving us new insights into the functional activities of the oral biofilm under different conditions.”
Gut microbiota: a key player in health and disease. A review focused on obesity
Villanueva-Millán, M. J., Pérez‐Matute, P., & Oteo, J. A. (2015) · Journal of Physiology and Biochemistry · doi:10.1007/s13105-015-0390-3 · Cited by 195
“These microbial species constitute what is known as the human microbiota [47].”
BackgroundVelsko, I. M., Fellows Yates, J. A., Aron, F., Hagan, R. W., Frantz, L. A. F., Loe, L., Martinez, J. B. R., Chaves, E., Gosden, C., Larson, G., et al. (2019) · Microbiome · doi:10.1186/s40168-019-0717-3 · Cited by 170
“tween samples of the same condition [31, 32], we further assessed if potential metabolic profiles differ between”
BackgroundMethodBelibasakis, G. N., Belstrøm, D., Eick, S., Gürsoy, U. K., Johansson, A., & Könönen, E. (2023) · Periodontology 2000 · doi:10.1111/prd.12473 · Cited by 171
Johnson, H., Trinidad, D., Guzman, S., Khan, Z., Parziale, J. V., DeBruyn, J. M., & Lents, N. H. (2016) · PLoS ONE · doi:10.1371/journal.pone.0167370 · Cited by 174
Cowley, E. S., Kopf, S., LaRiviere, A., Ziebis, W., & Newman, D. K. (2015) · mBio · doi:10.1128/mbio.00767-15 · Cited by 168
“Yet a growing body of research on the stability of microbes in different ecosystems, such as the human gut, indicates that, while diversity at the organismal level can be vast, the metabolic networks that underpin microbial communities are often conserved and constrained by environmental parameters (11).”
BackgroundCRISPR-Cas antimicrobials: Challenges and future prospects
Pursey, E., Sünderhauf, D., Gaze, W. H., Westra, E. R., & van Houte, S. (2018) · PLoS Pathogens · doi:10.1371/journal.ppat.1006990 · Cited by 157
Elucidation of complexity and prediction of interactions in microbial communities
Zúñiga, C., Zaramela, L. S., & Zengler, K. (2017) · Microbial Biotechnology · doi:10.1111/1751-7915.12855 · Cited by 159
“…metatranscrip-tomics has been used to determine the relationship between the oral and the gut community (Franzosa et al. , 2014) and to study human microbiome-related diseases, e.g. periodontitis (Jorth et al. , 2014), colorectal cancer (Dutilh et al. , 2013) and acne vulgaris (Kang et al. , 2015).”
MethodSubgingival Microbiome Shifts and Community Dynamics in Periodontal Diseases
Diaz, P. I., Hoare, A., & Hong, B. (2016) · Journal of the California Dental Association · doi:10.1080/19424396.2016.12221035 · Cited by 152
Kaur, H., Merchant, M., Haque, M. M., & Mande, S. S. (2020) · Frontiers in Microbiology · doi:10.3389/fmicb.2020.00551 · Cited by 159
Metabolic and Community Synergy of Oral Bacteria in Colorectal Cancer
Flynn, K. J., Baxter, N. T., & Schloss, P. D. (2016) · mSphere · doi:10.1128/msphere.00102-16 · Cited by 156
“a diverse microbial composition between patients (11).”
Immune and regulatory functions of neutrophils in inflammatory bone loss
Hajishengallis, G., Moutsopoulos, N. M., Hajishengallis, E., & Chavakis, T. (2016) · Seminars in Immunology · doi:10.1016/j.smim.2016.02.002 · Cited by 150
Yost, S., Stashenko, P., Choi, Y., Kukuruzinska, M., Genco, C. A., Salama, A., Weinberg, E. O., Kramer, C. D., & Frias-Lopez, J. (2018) · International Journal of Oral Science · doi:10.1038/s41368-018-0037-7 · Cited by 144
Forensic body fluid identification: state of the art
Harbison, S., & Fleming, R. I. (2016) · Research and Reports in Forensic Medical Science · doi:10.2147/rrfms.s57994 · Cited by 149
Fusobacterium nucleatum Metabolically Integrates Commensals and Pathogens in Oral Biofilms
Sakanaka, A., Kuboniwa, M., Shimma, S., Alghamdi, S. A., Mayumi, S., Lamont, R. J., Fukusaki, E., & Amano, A. (2022) · mSystems · doi:10.1128/msystems.00170-22 · Cited by 149
Zenobia, C., & Hajishengallis, G. (2015) · Virulence · doi:10.1080/21505594.2014.999567 · Cited by 134
“gingivalis (and other periodontal bacteria) are significantly altered when compared in healthy versus diseased sites from the same patient.(4) For instance, virulence gene expression (e.”
BackgroundRebollar, E. A., Antwis, R. E., Becker, M. H., Belden, L. K., Bletz, M. C., Brucker, R. M., Harrison, X. A., Hughey, M. C., Kueneman, J. G., Loudon, A. H., et al. (2016) · Frontiers in Microbiology · doi:10.3389/fmicb.2016.00068 · Cited by 139
“Defensive AMPs appear to be released constitutively into the mucus at low concentrations, but they can be increased significantly when the amphibian hosts are alarmed or injured (Pask et al., 2012) and can be affected by environmental stressors (Katzenback et al., 2014).”
BackgroundDabdoub, S. M., Ganesan, S. M., & Kumar, P. (2016) · Scientific Reports · doi:10.1038/srep38993 · Cited by 131
Microbiota and Metatranscriptome Changes Accompanying the Onset of Gingivitis
Nowicki, E. M., Shroff, R., Singleton, J. A., Renaud, D. E., Wallace, D. L., Drury, J., Zirnheld, J., Colleti, B., Ellington, A. D., Lamont, R. J., et al. (2018) · mBio · doi:10.1128/mbio.00575-18 · Cited by 129
“As seen in other studies, metabolic pathways more strongly associated with disease were pyrimidine metabolism (17) and propanoate and butanoate metabolism (16, 22, 36).”
BackgroundMethodInfluentialSelf-citationScannapieco, F. A., & Dongari‐Bagtzoglou, A. I. (2021) · Journal of Periodontology · doi:10.1002/jper.21-0120 · Cited by 125
LRLSHMDA: Laplacian Regularized Least Squares for Human Microbe–Disease Association prediction
Wang, F., Huang, Z.-A., Chen, X., Zhu, Z., Wen, Z., Zhao, J., & Yan, G. (2017) · Scientific Reports · doi:10.1038/s41598-017-08127-2 · Cited by 126
Metatranscriptome of the Oral Microbiome in Health and Disease
Solbiati, J., & Frias‐Lopez, J. (2018) · Journal of Dental Research · doi:10.1177/0022034518761644 · Cited by 119
Szafrański, S. P., Wos‐Oxley, M. L., Vilchez‐Vargas, R., Jáuregui, R., Plumeier, I., Klawonn, F., Tomasch, J., Meisinger, C., Kühnisch, J., Sztajer, H., et al. (2014) · Applied and Environmental Microbiology · doi:10.1128/aem.03534-14 · Cited by 118
“As a next step, metatranscriptomics (52, 53) or other specialized analyses can then be applied to a smaller number of representative samples.”
BackgroundHoggard, M., Mackenzie, B. W., Jain, R., Taylor, M. W., Biswas, K., & Douglas, R. G. (2016) · Clinical Microbiology Reviews · doi:10.1128/cmr.00060-16 · Cited by 122
“In one study, the application of metatranscriptomics to periodontal disease identified conserved changes in microbial community metabolism associated with this disease, against a background of high interpatient variability in community composition (205).”
BackgroundDiversification of Type VI Secretion System Toxins Reveals Ancient Antagonism among Bee Gut Microbes
Steele, M. I., Kwong, W. K., Whiteley, M., & Moran, N. A. (2017) · mBio · doi:10.1128/mbio.01630-17 · Cited by 127
“For experiment B, DNA and RNA were extracted using the bead-beating and RNA-Bee method described by Jorth et al. (51).”
Self-citationChung, Y. W., Gwak, H., Moon, S., Rho, M., & Ryu, J.-H. (2020) · PLoS ONE · doi:10.1371/journal.pone.0227886 · Cited by 115
Chatzigiannidou, I., Teughels, W., de Wiele, T. V., & Boon, N. (2020) · npj Biofilms and Microbiomes · doi:10.1038/s41522-020-0124-3 · Cited by 118
Prediction of Periodontal Inflammation via Metabolic Profiling of Saliva
Kuboniwa, M., Sakanaka, A., Hashino, E., Bamba, T., Fukusaki, E., & Amano, A. (2016) · Journal of Dental Research · doi:10.1177/0022034516661142 · Cited by 110
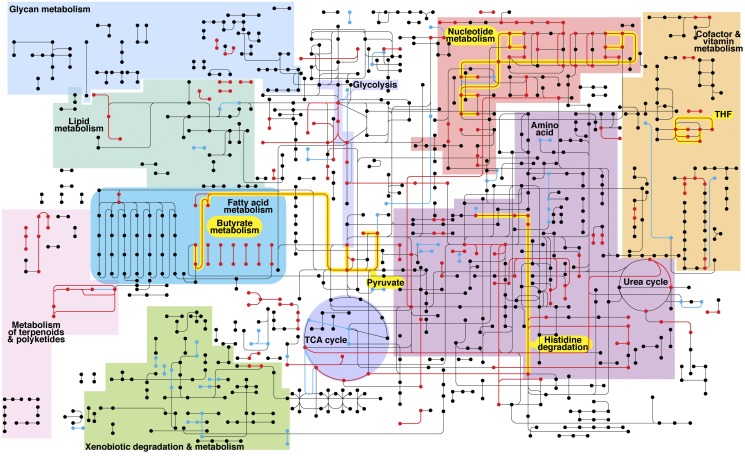
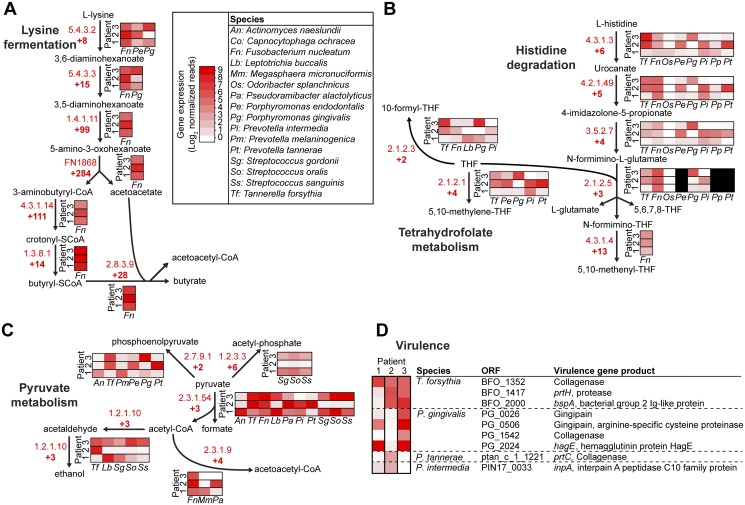
“A recent metatranscriptomics study that utilized subgingival plaque samples identified enhanced expression of genes associated with histidine degradation as a conserved metabolic shift during development of periodontal disease (Jorth et al. 2014).”
BackgroundAdvancements toward a systems level understanding of the human oral microbiome
McLean, J. S. (2014) · Frontiers in Cellular and Infection Microbiology · doi:10.3389/fcimb.2014.00098 · Cited by 108
Altitude influences microbial diversity and herbage fermentation in the rumen of yaks
Fan, Q., Wanapat, M., Yan, T., & Hou, F. (2020) · BMC Microbiology · doi:10.1186/s12866-020-02054-5 · Cited by 112
Understanding human health through metatranscriptomics
Ojala, T., Kankuri, E. M., & Kankainen, M. (2023) · Trends in Molecular Medicine · doi:10.1016/j.molmed.2023.02.002 · Cited by 113
Aleti, G., Baker, J. L., Tang, X., Alvarez, R., Dinis, M., Tran, N. C., Melnik, A. V., Zhong, C., Ernst, M., Dorrestein, P. C., et al. (2019) · mBio · doi:10.1128/mbio.00321-19 · Cited by 107
Dysbiotic Biofilms Deregulate the Periodontal Inflammatory Response
Herrero, E. R., Fernandes, S., Verspecht, T., Ugarte-Berzal, E., Boon, N., Proost, P., Bernaerts, K., Quirynen, M., & Teughels, W. (2018) · Journal of Dental Research · doi:10.1177/0022034517752675 · Cited by 104
Transcriptome analysis in whole blood reveals increased microbial diversity in schizophrenia
Loohuis, L. M. O., Mangul, S., Ori, A. P. S., Jospin, G., Koslicki, D., Yang, H. T., Wu, T., Boks, M. P., Lomen‐Hoerth, C., Wiedau‐Pazos, M., et al. (2018) · Translational Psychiatry · doi:10.1038/s41398-018-0107-9 · Cited by 106
Dual Transcriptomic Profiling of Host and Microbiota during Health and Disease in Pediatric Asthma
Pérez‐Losada, M., Castro‐Nallar, E., Bendall, M. L., Freishtat, R. J., & Crandall, K. A. (2015) · PLoS ONE · doi:10.1371/journal.pone.0131819 · Cited by 106
“microbiota [16–18, 20, 22, 63].”
BackgroundEnvironmental filtering increases with elevation for the assembly of gut microbiota in wild pikas
Li, H., Zhou, R., Zhu, J., Huang, X., & Qu, J. (2019) · Microbial Biotechnology · doi:10.1111/1751-7915.13450 · Cited by 102
“Since some species in this genus have been reported to be involved in pyruvate metabolism in humans (Jorth et al., 2014), we speculate they play important roles in the gut niche of high-altitude pikas.”
BackgroundIntrinsic Antimicrobial Resistance Determinants in the Superbug Pseudomonas aeruginosa
Murray, J. L., Kwon, T., Marcotte, E. M., & Whiteley, M. (2015) · mBio · doi:10.1128/mbio.01603-15 · Cited by 106
Self-citationPeriodontal inflammation: Integrating genes and dysbiosis
Zhang, S., Yu, N., & Arce, R. M. (2019) · Periodontology 2000 · doi:10.1111/prd.12267 · Cited by 109
Porphyromonas gingivalis: Immune Subversion Activities and Role in Periodontal Dysbiosis
Hajishengallis, G., & Diaz, P. I. (2020) · Current Oral Health Reports · doi:10.1007/s40496-020-00249-3 · Cited by 104
Capturing the genetic makeup of the active microbiome in situ
Singer, E., Wagner, M., & Woyke, T. (2017) · The ISME Journal · doi:10.1038/ismej.2017.59 · Cited by 99
“…et al., 2013; Chemerys et al., 2014; Kim et al., 2014; Pinnell et al., 2014; Verastegui et al., 2014; Werner et al., 2014; Franzosa et al., 2014; Jorth et al., 2014; Schwab et al., 2014; Lamendella et al., 2014; Satinsky et al., 2014; Klindworth et al., 2014; Hua et al., 2014; Simón-Soro et…”
Guerrero-Preston, R. E., White, J. R., Godoy‐Vitorino, F., Rodríguez-Hilario, A., Navarro, K., González, H., Michailidi, C., Jedlicka, A., Canapp, S., Bondy, J., et al. (2017) · Oncotarget · doi:10.18632/oncotarget.20677 · Cited by 98
“Some studies have observed that Fusobacterium nucleatum upregulates the expression of lysine degradation pathway leading to butyrate production in periodontitis patients [87].”
Armed to the Teeth—The Oral Mucosa Immunity System and Microbiota
Ptasiewicz, M., Grywalska, E., Mertowska, P., Korona‐Głowniak, I., Poniewierska-Baran, A., Niedźwiedzka‐Rystwej, P., & Chałas, R. (2022) · International Journal of Molecular Sciences · doi:10.3390/ijms23020882 · Cited by 107
Fungal-bacterial interactions and their relevance to oral health: linking the clinic and the bench
Diaz, P. I., Strausbaugh, L. D., & Dongari‐Bagtzoglou, A. I. (2014) · Frontiers in Cellular and Infection Microbiology · doi:10.3389/fcimb.2014.00101 · Cited by 101
Jenior, M. L., Leslie, J. L., Young, V. B., & Schloss, P. D. (2018) · mSphere · doi:10.1128/msphere.00261-18 · Cited by 96
“…lack of animal-based replication for the metatranscriptomic data does potentially limit the ability to generalize our results, this approach has been successfully utilized by numerous groups in the past to accurately characterize transcriptional activity across communities of bacteria (19, 31–33).”
Short-Chain Fatty Acid and FFAR2 Activation – A New Option for Treating Infections?
Schlatterer, K., Peschel, A., & Kretschmer, D. (2021) · Frontiers in Cellular and Infection Microbiology · doi:10.3389/fcimb.2021.785833 · Cited by 94
Oral fungal-bacterial biofilm models in vitro: a review
Chevalier, M., Ranque, S., & Prêcheur, I. (2017) · Medical Mycology · doi:10.1093/mmy/myx111 · Cited by 92
Unravelling interspecies interactions across heterogeneities in complex biofilm communities
Røder, H. L., Olsen, N. M. C., Whiteley, M., & Burmølle, M. (2019) · Environmental Microbiology · doi:10.1111/1462-2920.14834 · Cited by 92
Self-citationLima, B. P., Shi, W., & Lux, R. (2017) · MicrobiologyOpen · doi:10.1002/mbo3.444 · Cited by 90
“nucleatum is a key contributor to butyrate production (Jorth et al., 2014), which has been linked to the development of periodontal disease (Niederman, Buyle- Bodin, Lu, Robinson, & Naleway, 1997).”
BackgroundSakanaka, A., Kuboniwa, M., Hashino, E., Bamba, T., Fukusaki, E., & Amano, A. (2017) · Scientific Reports · doi:10.1038/srep42818 · Cited by 90
Impact of systemic factors in shaping the periodontal microbiome
Teles, F., Wang, Y., Hajishengallis, G., Hastürk, H., & Marchesan, J. T. (2020) · Periodontology 2000 · doi:10.1111/prd.12356 · Cited by 93
Janem, W. F., Scannapieco, F. A., Sabharwal, A., Tsompana, M., Berman, H. A., Haase, E. M., Miecznikowski, J. C., & Mastrandrea, L. D. (2017) · PLoS ONE · doi:10.1371/journal.pone.0172647 · Cited by 88
Szafrański, S. P., Deng, Z.-L., Tomasch, J., Jarek, M., Bhuju, S., Meisinger, C., Kühnisch, J., Sztajer, H., & Wagner‐Döbler, I. (2015) · npj Biofilms and Microbiomes · doi:10.1038/npjbiofilms.2015.17 · Cited by 85
The human microbiome encodes resistance to the antidiabetic drug acarbose
Balaich, J. N., Estrella, M. A., Wu, G. G., Jeffrey, P. D., Biswas, A. G., Zhao, L., Korennykh, A. V., & Donia, M. S. (2021) · Nature · doi:10.1038/s41586-021-04091-0 · Cited by 85
Mucosal Microbiome in Patients with Recurrent Aphthous Stomatitis
Hijazi, K., Lowe, T., Meharg, C., Berry, S. H., Foley, J., & Hold, G. L. (2014) · Journal of Dental Research · doi:10.1177/0022034514565458 · Cited by 86
“Metagenomic studies of the oral microbiome in RAS patients, as recently reported for healthy individuals ( Jorth et al. 2014), will define conserved changes in metabolic and virulence gene expression of bacterial communities associated with RAS.”
BackgroundEdlund, A., Yang, Y., Yooseph, S., Hall, A. P., Nguyen, D. D., Dorrestein, P. C., Nelson, K. E., He, X., Lux, R., Shi, W., et al. (2015) · The ISME Journal · doi:10.1038/ismej.2015.72 · Cited by 84
“…sequencing of mRNA, expression profiles have been generated representing snapshots of the activity within in vivo oral bacterial communities from individual subjects representing healthy and diseased groups (Frias-Lopez and DuranPinedo, 2012; Jorth et al., 2014; Benítez-Páez et al., 2014).”
BackgroundThe enduring importance of animal modelsin understanding periodontal disease
Hajishengallis, G., Lamont, R. J., & Graves, D. T. (2015) · Virulence · doi:10.4161/21505594.2014.990806 · Cited by 92
“This notion is supported by a recent metatranscriptomic study which showed that disease-associated microbial communities exhibit conserved metabolic and virulence gene expression profiles, despite high inter-patient variability in terms of microbial composition.(26) Therefore, a conserved periodontitis-associated micr…”
ResultDysbiosis From a Microbial and Host Perspective Relative to Oral Health and Disease
Cugini, C., Ramasubbu, N., Tsiagbe, V. K., & Fine, D. H. (2021) · Frontiers in Microbiology · doi:10.3389/fmicb.2021.617485 · Cited by 91
Shiba, T., Watanabe, T., Kachi, H., Koyanagi, T., Maruyama, N., Murase, K., Takeuchi, Y., Maruyama, F., Izumi, Y., & Nakagawa, I. (2016) · Scientific Reports · doi:10.1038/srep30997 · Cited by 83
“Functional pathways in healthy and periodontitis sites have been compared by metatranscriptomic analysis 43 .”
Manor, O., Levy, R., & Borenstein, E. (2014) · Cell Metabolism · doi:10.1016/j.cmet.2014.07.021 · Cited by 84
“Other studies used meta-transcriptome derived networks to identify pathways not previously associated with periodontal disease (Jorth et al., 2014) or alternative pathways to biomass production (Xiong et al., 2012).”
The Oral Mouse Microbiome Promotes Tumorigenesis in Oral Squamous Cell Carcinoma
Stashenko, P., Yost, S. C., Choi, Y., Danciu, T., Chen, T., Yoganathan, S., Kressirer, C. A., Ruiz-Tourrella, M., Das, B., Kokaras, A. S., et al. (2019) · mSystems · doi:10.1128/msystems.00323-19 · Cited by 84
Moutsopoulos, N. M., Chalmers, N. I., Barb, J. J., Abusleme, L., Greenwell‐Wild, T., Dutzan, N., Paster, B. J., Munson, P. J., Fine, D. H., Uzel, G., et al. (2015) · PLoS Pathogens · doi:10.1371/journal.ppat.1004698 · Cited by 80
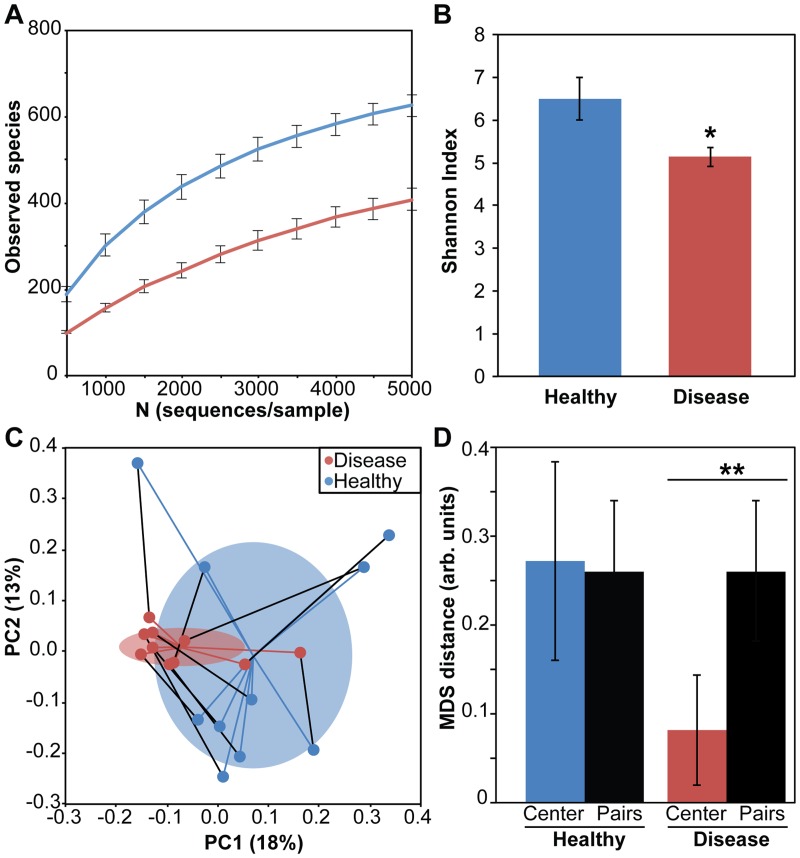
“Typically, increased microbial diversity has been documented in the majority of studies of periodontitis [13,14,9], but recently a study of metatranscriptomics in periodontitis has reported decreased richness and diversity in diseased sites [29].”
Ecological Therapeutic Opportunities for Oral Diseases
Hoare, A., Marsh, P. D., & Diaz, P. I. (2017) · Microbiology Spectrum · doi:10.1128/microbiolspec.bad-0006-2016 · Cited by 85
“Such metabolic models may allow prediction of the role that each species may have in the health- and/or disease-associated consortia (5, 276, 277, 278).”
BackgroundEnvironmental factors and periodontal microbiome
Buduneli, N. (2020) · Periodontology 2000 · doi:10.1111/prd.12355 · Cited by 83
Self-citationHigh-resolution characterization of the human microbiome
Noecker, C. A., McNally, C. P., Eng, A., & Borenstein, E. (2016) · Translational research · doi:10.1016/j.trsl.2016.07.012 · Cited by 81
Detection, treatment and prevention of endodontic biofilm infections: what’s new in 2020?
Abusrewil, S., Alshanta, O. A., Albashaireh, K. Z., Alqahtani, S. S., Nile, C. J., Scott, J. A., & McLean, W. (2020) · Critical Reviews in Microbiology · doi:10.1080/1040841x.2020.1739622 · Cited by 77
“These changes are not conserved among patients, with inter-individual microbiome variability resulting in similar patient symptoms (Jorth et al. 2014).”
BackgroundAsgari, E., Garakani, K., McHardy, A. C., & Mofrad, M. R. K. (2018) · Bioinformatics · doi:10.1093/bioinformatics/bty296 · Cited by 85
“Consequently, dysbiosis of the human microbiome can promote several diseases, including asthma [2, 3], irritable bowel syndrome [4, 5], Clostridium difficile infection [6], chronic periodontitis [7, 8], cutaneous leishmaniasis [9], obesity [10, 11], chronic kidney disease [12], Ulcerative colitis [13], and Crohns dise…”
Transcriptome analysis of bacteriophage communities in periodontal health and disease
Santiago-Rodríguez, T. M., Naidu, M., Abeles, S. R., Boehm, T. K., Ly, M., & Pride, D. T. (2015) · BMC Genomics · doi:10.1186/s12864-015-1781-0 · Cited by 75
“Despite the lack of studies characterizing oral phage gene expression, there have been efforts to characterize their bacterial counterparts [29, 38] and to associate patterns of transcription with disease severity [39].”
BackgroundCorrêa, R. O., Vieira, A. T., Sernaglia, E. M., Lancellotti, M., Vieira, A. T., Ávila-Campos, M. J., Rodrigues, H. G., & Vinolo, M. A. R. (2017) · Cellular Microbiology · doi:10.1111/cmi.12720 · Cited by 76
Is there an association between obstructive sleep apnea syndrome and periodontal inflammation?
Nizam, N., Başoğlu, Ö. K., Taşbakan, M. S., Lappin, D. F., & Buduneli, N. (2015) · Clinical Oral Investigations · doi:10.1007/s00784-015-1544-y · Cited by 74
Self-citationBiosensor and Lab-on-a-chip Biomarker-identifying Technologies for Oral and Periodontal Diseases
Steigmann, L., Maekawa, S., Sima, C., Travan, S., Wang, C.-W., & Giannobile, W. V. (2020) · Frontiers in Pharmacology · doi:10.3389/fphar.2020.588480 · Cited by 77
Metadata
- Authors
- Jorth, P., Turner, K. H., Gumus, P., Nizam, N., Buduneli, N., & Whiteley, M.
- Affiliations
- The University of Texas at Austin (US)
- Department of Periodontology, School of Dentistry, Ege University, Izmir, Turkey
- Ege University (TR)
- Venue
- mBio
- Publisher
- American Society for Microbiology
- Published
- 2014-05
- Volume
- 5
- Issue
- 2
- Pages
- e01012-14
- ISSN
- 2150-7511 (ISSN-L)
- 2161-2129
- PMC
- PMC3977359
- OpenAlex
- W2146975236
- Cited by
- 386
- References
- 33
- Citations by year
- 2026: 18 · 2025: 30 · 2024: 24 · 2023: 13 · 2022: 25 · 2021: 33 · 2020: 45 · 2019: 39 · 2018: 33 · 2017: 40 · 2016: 33 · 2015: 39 · 2014: 14
- FWCI
- 56.09
- Type
- journal article
- Language
- en
- Open access
- gold
- doi.org
- Licence
- Locations
- mBio (publishedVersion, cc-by-nc-sa)
- Europe PMC (PubMed Central) (publishedVersion, cc-by-nc-sa)
- PubMed Central (publishedVersion, cc-by-nc-sa)
- PubMed (publishedVersion)
- DOAJ (DOAJ: Directory of Open Access Journals) (submittedVersion, cc-by-sa)
- Funders
- National Institutes of Health (5f31de021633-02)
- National Institute of Dental and Craniofacial Research (F31 DE021633, R01DE023193, 5F31DE021633-02, R01DE020100)
- Topics
- Health Sciences › Dentistry › Periodontics › Oral microbiology and periodontitis research
- Life Sciences › Biochemistry, Genetics and Molecular Biology › Molecular Biology › Gut microbiota and health
- Life Sciences › Biochemistry, Genetics and Molecular Biology › Molecular Biology › Genomics and Phylogenetic Studies
- Keywords
- oral microbiota, periodontitis, metatranscriptomics, microbial community metabolism, interpatient variability, periodontal plaque, virulence gene expression
- MeSH terms
- Adult, Female, Humans, Male, Mouth, Periodontitis, Metagenome, Transcriptome, Microbiota, Dysbiosis
About these checks
Registry, retraction, Cites and statistics results are computed, not judged, with one exception: a printed reference that no index lists is read once by a model before it counts as a citation error. Claims are extracted by a model and kept only when their quote appears verbatim in the text; each cited source is then checked, with a model’s help, for whether it says what the claim relies on. Those verdicts can be wrong — read the claim’s quote and the cited source before relying on one.
Statistics and arithmetic are recomputed, not judged.
Confidence bands are shown only for fields calibrated on our annotated test set. None is calibrated yet, so no band is shown.
What counts as a claim ›How we measure confidence ›How we check this ›
Are you an author, or do you see a problem with this page? Request a review
