

The DOI matches its Crossref record; 40 of the 40 references it cites were found in a registry or an index.
Evaluating glymphatic pathway function utilizing clinically relevant intrathecal infusion of CSF tracer
Open accessAbstract
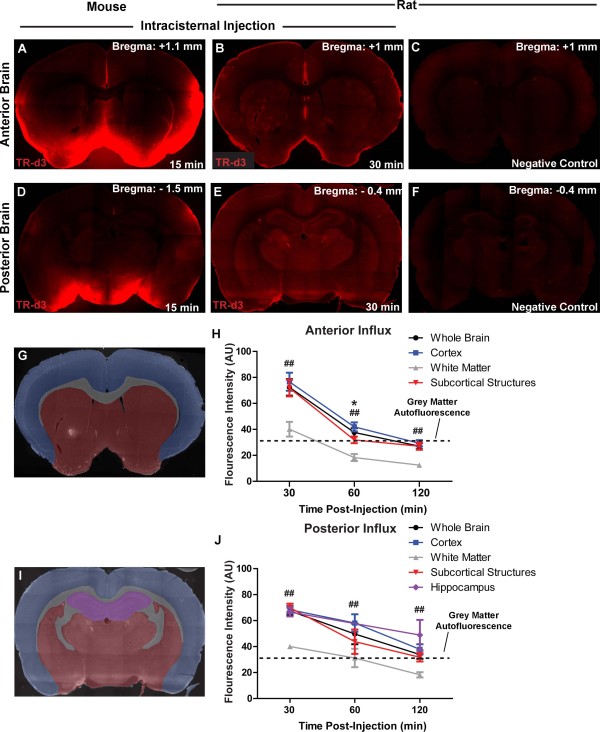
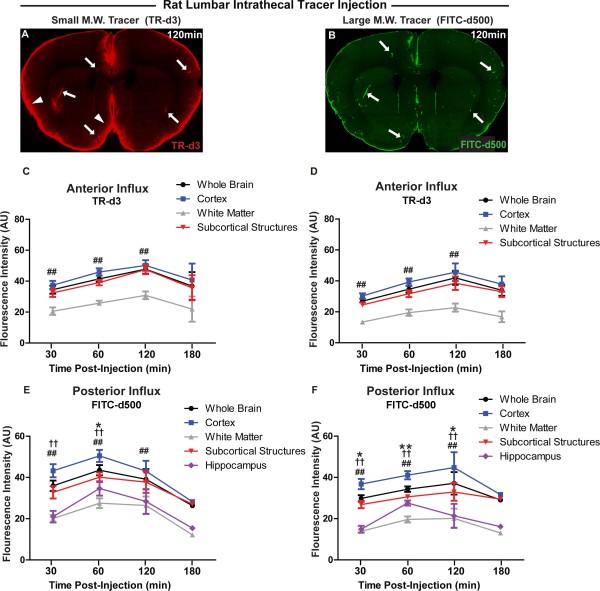
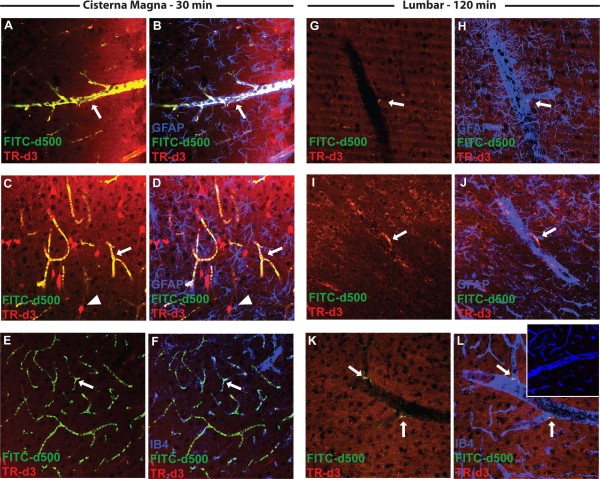
Background: Neurodegenerative diseases such as Alzheimer’s are associated with the aggregation of endogenous peptides and proteins that contribute to neuronal dysfunction and loss. The glymphatic system, a brain-wide perivascular pathway along which cerebrospinal fluid (CSF) and interstitial fluid (ISF) rapidly exchange, has recently been identified as a key contributor to the clearance of interstitial solutes from the brain, including amyloid β. These findings suggest that measuring changes in glymphatic pathway function may be an important prognostic for evaluating neurodegenerative disease susceptibility or progression. However, no clinically acceptable approach to evaluate glymphatic pathway function in humans has yet been developed. Methods: Time-sequenced ex vivo fluorescence imaging of coronal rat and mouse brain slices was performed at 30–180 min following intrathecal infusion of CSF tracer (Texas Red- dextran-3, MW 3 kD; FITC- dextran-500, MW 500 kD) into the cisterna magna or lumbar spine. Tracer influx into different brain regions (cortex, white matter, subcortical structures, and hippocampus) in rat was quantified to map the movement of CSF tracer following infusion along both routes, and to determine whether glymphatic pathway function could be evaluated after lumbar intrathecal infusion. Results: Following lumbar intrathecal infusions, small molecular weight TR-d3 entered the brain along perivascular pathways and exchanged broadly with the brain ISF, consistent with the initial characterization of the glymphatic pathway in mice. Large molecular weight FITC-d500 remained confined to the perivascular spaces. Lumbar intrathecal infusions exhibited a reduced and delayed peak parenchymal fluorescence intensity compared to intracisternal infusions. Conclusion: Lumbar intrathecal contrast delivery is a clinically useful approach that could be used in conjunction with dynamic contrast enhanced MRI nuclear imaging to assess glymphatic pathway function in humans.
Overview
The claims and statistics of this paper haven’t been checked yet.
Run the check — free, no account needed. It reads the open-access text and checks the sources it cites.
Integrity signals
Registry
Cites
Statistics
Figures
Verification
Claims the paper makes
The claims and statistics of this paper haven’t been checked yet.
Run the check — free, no account needed. It reads the open-access text and checks the sources it cites.
Claims other papers make about this one
Each is checked against this paper’s own text: does it say what the citing paper says it does?
The source backs part of the claim, not all of it — or backs it for a different population, condition or comparison.
In the citing paper
“Clearance of MRI contrast agents, such as gadobutrol, has previously been proposed to potentially resemble clearance of brain macromolecules with similar properties (14), including amyloidβ (7) and tau (21, 66).”
From Brain-wide glymphatic enhancement and clearance in humans assessed with MRI. (2018) · cites this paper as [66]
Experimental — accuracy not yet measured
Self-check
Percentages, sums and reported differences re-computed from the paper’s own numbers.
The self-check needs the paper’s full text.
Citations
Cites
The Amyloid Hypothesis of Alzheimer’s Disease: Progress and Problems on the Road to Therapeutics
Hardy, J., & Selkoe, D. J. (2002) · Science · doi:10.1126/science.1072994 · Cited by 13,864
Iliff, J. J., Wang, M., Liao, Y., Plogg, B. A., Peng, W., Gundersen, G. A., Benveniste, H., Vates, G. E., Deane, R., Goldman, S. A., et al. (2012) · Science Translational Medicine · doi:10.1126/scitranslmed.3003748 · Cited by 5,824
Self-citationProtein aggregation and neurodegenerative disease
Ross, C. A., & Poirier, M. A. (2004) · Nature Medicine · doi:10.1038/nm1066 · Cited by 3,454
Diffusion in Brain Extracellular Space
Syková, E., & Nicholson, C. (2008) · Physiological Reviews · doi:10.1152/physrev.00027.2007 · Cited by 1,481
Aggregation and Motor Neuron Toxicity of an ALS-Linked SOD1 Mutant Independent from Wild-Type SOD1
Bruijn, L. I., Houseweart, M. K., Kato, S., Anderson, K. L., Anderson, S., Ohama, E., Reaume, A. G., Scott, R. W., & Cleveland, D. W. (1998) · Science · doi:10.1126/science.281.5384.1851 · Cited by 1,250
Brain-wide pathway for waste clearance captured by contrast-enhanced MRI
Iliff, J. J., Lee, H., Yu, M., Feng, T., Logan, J., Nedergaard, M., & Benveniste, H. (2013) · Journal of Clinical Investigation · doi:10.1172/jci67677 · Cited by 1,148
Self-citationMathiisen, T. M., Lehre, K. P., Danbolt, N. C., & Ottersen, O. (2010) · Glia · doi:10.1002/glia.20990 · Cited by 893
Evidence for bulk flow of brain interstitial fluid: significance for physiology and pathology
Abbott, N. J. (2004) · Neurochemistry International · doi:10.1016/j.neuint.2003.11.006 · Cited by 786
Scherzinger, E., Sittler, A., Schweiger, K., Heiser, V., Lurz, R., Hasenbank, R., Bates, G. P., Lehrach, H. R., & Wanker, E. E. (1999) · Proceedings of the National Academy of Sciences · doi:10.1073/pnas.96.8.4604 · Cited by 707
Delivery of therapeutic agents to the central nervous system: the problems and the possibilities
Begley, D. J. (2004) · Pharmacology & Therapeutics · doi:10.1016/j.pharmthera.2004.08.001 · Cited by 679
Cited by
Sorted by citations
Structural and functional features of central nervous system lymphatic vessels
Louveau, A., Smirnov, I., Keyes, T. J., Eccles, J. D., Rouhani, S. J., Peske, J. D., Derecki, N. C., Castle, D., Mandell, J. W., Lee, K. S., et al. (2015) · Nature · doi:10.1038/nature14432 · Cited by 4,413
The glymphatic system: a beginner's guide
Jessen, N. A., Munk, A. S. F., Lundgaard, I., & Nedergaard, M. (2015) · Neurochemical Research · doi:10.1007/s11064-015-1581-6 · Cited by 2,075
Self-citationClearance systems in the brain—implications for Alzheimer disease
Tarasoff-Conway, J. M., Carare, R. O., Osorio, R. S., Glodzik, L., Butler, T., Fieremans, E., Axel, L., Rusinek, H., Nicholson, C., Zlokovic, B. V., et al. (2015) · Nature Reviews Neurology · doi:10.1038/nrneurol.2015.119 · Cited by 1,678
Verkhratsky, A., & Nedergaard, M. (2018) · Physiological Reviews · doi:10.1152/physrev.00042.2016 · Cited by 1,678
Self-citationImpairment of paravascular clearance pathways in the aging brain
Kress, B. T., Iliff, J. J., Xia, M., Wang, M., Wei, H. S., Zeppenfeld, D., Xie, L., Kang, H., Xu, Q., Liew, J. A., et al. (2014) · Annals of Neurology · doi:10.1002/ana.24271 · Cited by 1,521
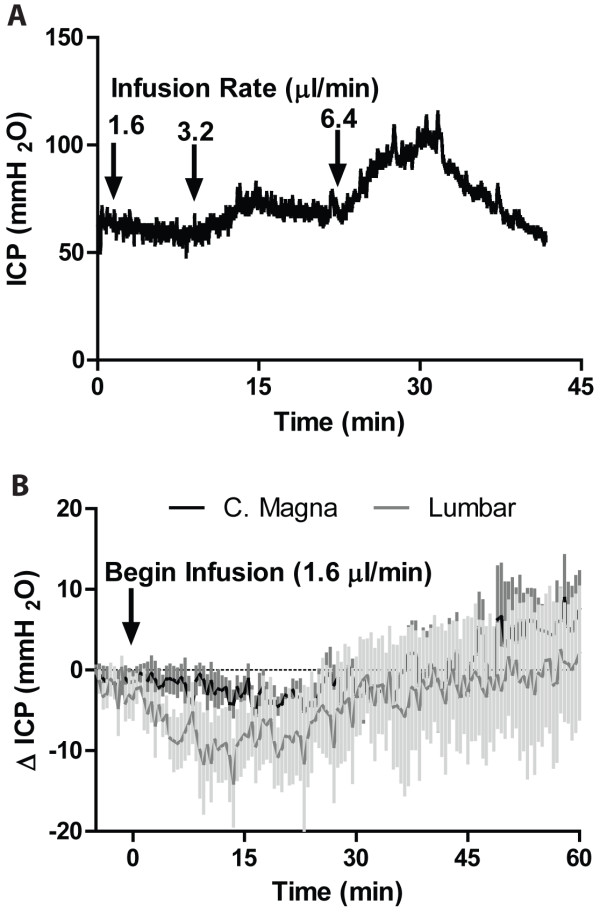
“Additionally, we have observed that at infusion rates that do not change ICP, paravascular CSF tracer flux follows the same patterns observed in the present study.(5,8) Because paravascular CSF recirculation occurs long after the normalization of ICP after the cessation of tracer infusion, the CSF tracer fluxes observ…”
ResultSelf-citationCerebral Arterial Pulsation Drives Paravascular CSF–Interstitial Fluid Exchange in the Murine Brain
Iliff, J. J., Wang, M., Zeppenfeld, D. M., Venkataraman, A., Plog, B. A., Liao, Y., Deane, R., & Nedergaard, M. (2013) · The Journal of Neuroscience · doi:10.1523/jneurosci.1592-13.2013 · Cited by 1,319
“Given that rapid paravascular CSF influx continues long after the normalization of these shifts in ICP, the paravascular CSF fluxes observed in the present and prior studies (Iliff et al., 2012, 2013; Yang et al., 2013) appear to represent physiological fluxes and not artifacts of changes in ICP resulting from CSF tra…”
BackgroundMethodResultInfluentialSelf-citationImpairment of Glymphatic Pathway Function Promotes Tau Pathology after Traumatic Brain Injury
Iliff, J. J., Chen, M. J., Plog, B. A., Zeppenfeld, D. M., Soltero, M., Yang, L., Singh, I., Deane, R., & Nedergaard, M. (2014) · The Journal of Neuroscience · doi:10.1523/jneurosci.3020-14.2014 · Cited by 1,159
Self-citationPerivascular spaces in the brain: anatomy, physiology and pathology
Wardlaw, J. M., Benveniste, H., Nedergaard, M., Zlokovic, B. V., Mestre, H., Lee, H., Doubal, F. N., Brown, R., Ramirez, J., MacIntosh, B. J., et al. (2020) · Nature Reviews Neurology · doi:10.1038/s41582-020-0312-z · Cited by 870
Self-citationA new look at cerebrospinal fluid circulation
Brinker, T., Stopa, E., Morrison, J., & Klinge, P. (2014) · Fluids and Barriers of the CNS · doi:10.1186/2045-8118-11-10 · Cited by 819
The Glymphatic System in Central Nervous System Health and Disease: Past, Present, and Future
Plog, B. A., & Nedergaard, M. (2017) · Annual Review of Pathology Mechanisms of Disease · doi:10.1146/annurev-pathol-051217-111018 · Cited by 800
Self-citationAquaporin-4-dependent glymphatic solute transport in the rodent brain
Mestre, H., Hablitz, L. M., Xavier, A. L., Feng, W., Zou, W., Pu, T., Monai, H., Murlidharan, G., Castellanos Rivera, R. M., Simon, M. J., et al. (2018) · eLife · doi:10.7554/elife.40070 · Cited by 738
Self-citationHistory and progress of hypotheses and clinical trials for Alzheimer’s disease
Liu, P.-P., Xie, Y., Meng, X.-Y., & Kang, J.-S. (2019) · Signal Transduction and Targeted Therapy · doi:10.1038/s41392-019-0063-8 · Cited by 723
Glymphatic MRI in idiopathic normal pressure hydrocephalus
Ringstad, G., Vatnehol, S. A. S., & Eide, P. K. (2017) · Brain · doi:10.1093/brain/awx191 · Cited by 722
Nedergaard, M. (2013) · Science · doi:10.1126/science.1240514 · Cited by 718
Self-citationThe Lymphatic Vasculature in the 21st Century: Novel Functional Roles in Homeostasis and Disease
Oliver, G. C., Kipnis, J., Randolph, G. J., & Harvey, N. L. (2020) · Cell · doi:10.1016/j.cell.2020.06.039 · Cited by 701
Revisiting the Mechanisms of CNS Immune Privilege
Louveau, A., Harris, T. H., & Kipnis, J. (2015) · Trends in Immunology · doi:10.1016/j.it.2015.08.006 · Cited by 682
Impaired glymphatic function and clearance of tau in an Alzheimer’s disease model
Harrison, I. F., Ismail, O., Machhada, A., Colgan, N., Ohene, Y., Nahavandi, P., Ahmed, Z., Fisher, A., Meftah, S., Murray, T. K., et al. (2020) · Brain · doi:10.1093/brain/awaa179 · Cited by 672
From Sewer to Saviour—Targeting the Lymphatic System to Promote Drug Exposure and Activity
Trevaskis, N. L., Kaminskas, L. M., & Porter, C. J. H. (2015) · Nature Reviews Drug Discovery · doi:10.1038/nrd4608 · Cited by 654
Mechanisms of fluid movement into, through and out of the brain: evaluation of the evidence
Hladky, S. B., & Barrand, M. A. (2014) · Fluids and Barriers of the CNS · doi:10.1186/2045-8118-11-26 · Cited by 633
Rasmussen, M. K., Mestre, H., & Nedergaard, M. (2021) · Physiological Reviews · doi:10.1152/physrev.00031.2020 · Cited by 642
Self-citationSuppression of glymphatic fluid transport in a mouse model of Alzheimer's disease
Peng, W., Achariyar, T. M., Li, B., Liao, Y., Mestre, H., Hitomi, E., Regan, S., Kasper, T., Peng, S., Ding, F., et al. (2016) · Neurobiology of Disease · doi:10.1016/j.nbd.2016.05.015 · Cited by 580
Self-citationBrain-wide glymphatic enhancement and clearance in humans assessed with MRI.
Ringstad, G., Valnes, L. M., Dale, A. M., Pripp, A. H., Vatnehol, S.-A. S., Emblem, K. E., Mardal, K.-A., & Eide, P. K. (2018) · JCI Insight · doi:10.1172/jci.insight.121537 · Cited by 533
“Clearance of MRI contrast agents, such as gadobutrol, has previously been proposed to potentially resemble clearance of brain macromolecules with similar properties (14), including amyloid-β (7) and tau (21, 66).”
The Effect of Body Posture on Brain Glymphatic Transport
Lee, H., Xie, L., Yu, M., Kang, H., Feng, T., Deane, R., Logan, J., Nedergaard, M., & Benveniste, H. (2015) · Journal of Neuroscience · doi:10.1523/jneurosci.1625-15.2015 · Cited by 456
Self-citationNeuropsychiatric lupus: new mechanistic insights and future treatment directions
Schwartz, N., Stock, A. D., & Putterman, C. (2019) · Nature Reviews Rheumatology · doi:10.1038/s41584-018-0156-8 · Cited by 446
Perivascular spaces, glymphatic dysfunction, and small vessel disease
Mestre, H., Kostrikov, S., Mehta, R. I., & Nedergaard, M. (2017) · Clinical Science · doi:10.1042/cs20160381 · Cited by 403
Self-citationAlves de Lima, K., Rustenhoven, J., & Kipnis, J. (2020) · Annual Review of Immunology · doi:10.1146/annurev-immunol-102319-103410 · Cited by 348
Simon, M. J., & Iliff, J. J. (2015) · Biochimica et Biophysica Acta (BBA) - Molecular Basis of Disease · doi:10.1016/j.bbadis.2015.10.014 · Cited by 349
Self-citationParenchymal border macrophages regulate the flow dynamics of the cerebrospinal fluid
Drieu, A., Du, S., Storck, S. E., Rustenhoven, J., Papadopoulos, Z., Dykstra, T., Zhong, F., Kim, K., Blackburn, S., Mamuladze, T., et al. (2022) · Nature · doi:10.1038/s41586-022-05397-3 · Cited by 325
The future of stem cell therapies for Parkinson disease
Parmar, M., Grealish, S., & Henchcliffe, C. (2020) · Nature reviews. Neuroscience · doi:10.1038/s41583-019-0257-7 · Cited by 329
Vascular basement membranes as pathways for the passage of fluid into and out of the brain
Morris, A. W. J., Sharp, M. M., Albargothy, N. J., Fernandes, R., Hawkes, C. A., Verma, A., Weller, R. O., & Carare, R. O. (2016) · Acta Neuropathologica · doi:10.1007/s00401-016-1555-z · Cited by 289
Pizzo, M. E., Wolak, D. J., Kumar, N. N., Brunette, E., Brunnquell, C. L., Hannocks, M., Abbott, N. J., Meyerand, M. E., Sorokin, L., Stanimirovic, D. B., et al. (2018) · The Journal of Physiology · doi:10.1113/jp275105 · Cited by 272
The glymphatic hypothesis: the theory and the evidence
Hladky, S. B., & Barrand, M. A. (2022) · Fluids and Barriers of the CNS · doi:10.1186/s12987-021-00282-z · Cited by 283
Lymphatic drainage system of the brain: A novel target for intervention of neurological diseases
Sun, B., Wang, L.-H., Yang, T., Sun, J., Mao, L., Yang, M., Yuan, H., Colvin, R. A., & Yang, X. (2017) · Progress in Neurobiology · doi:10.1016/j.pneurobio.2017.08.007 · Cited by 264
Achariyar, T. M., Li, B., Peng, W., Verghese, P. B., Shi, Y., McConnell, E., Benraiss, A., Kasper, T., Song, W., Takano, T., et al. (2016) · Molecular Neurodegeneration · doi:10.1186/s13024-016-0138-8 · Cited by 256
Self-citationThe glymphatic system: implications for drugs for central nervous system diseases
Lohela, T. J., Lilius, T. O., & Nedergaard, M. (2022) · Nature Reviews Drug Discovery · doi:10.1038/s41573-022-00500-9 · Cited by 254
Self-citationXiong, Y., Mahmood, A., & Chopp, M. (2018) · Chinese Journal of Traumatology · doi:10.1016/j.cjtee.2018.02.003 · Cited by 253
RETINAL VASCULAR CYSTOID MACULAR EDEMA
Spaide, R. F. (2016) · Retina · doi:10.1097/iae.0000000000001158 · Cited by 236
Zhang, L., & Hargens, A. R. (2017) · Physiological Reviews · doi:10.1152/physrev.00017.2016 · Cited by 234
COVID-19 and chronic fatigue syndrome: Is the worst yet to come?
Wostyn, P. (2021) · Medical Hypotheses · doi:10.1016/j.mehy.2020.110469 · Cited by 236
Key roles of aquaporins in tumor biology
Papadopoulos, M. C., & Saadoun, S. (2014) · Biochimica et Biophysica Acta (BBA) - Biomembranes · doi:10.1016/j.bbamem.2014.09.001 · Cited by 222
Drowning stars: reassessing the role of astrocytes in brain edema
Thrane, A. S., Thrane, V. R., & Nedergaard, M. (2014) · Trends in Neurosciences · doi:10.1016/j.tins.2014.08.010 · Cited by 227
Self-citationThe Glymphatic System (En)during Inflammation
Mogensen, F. L., Delle, C., & Nedergaard, M. (2021) · International Journal of Molecular Sciences · doi:10.3390/ijms22147491 · Cited by 222
Self-citationShen, T., Yue, Y., Ba, F., He, T., Tang, X., Hu, X., Pu, J., Huang, C., Lv, W., Zhang, B., et al. (2022) · npj Parkinson s Disease · doi:10.1038/s41531-022-00437-1 · Cited by 216
Mendelsohn, A. R., & Larrick, J. W. (2013) · Rejuvenation Research · doi:10.1089/rej.2013.1530 · Cited by 216
Molecular characterization of perivascular drainage pathways in the murine brain
Hannocks, M.-J., Pizzo, M. E., Huppert, J., Deshpande, T., Abbott, N. J., Thorne, R. G., & Sorokin, L. (2018) · Journal of Cerebral Blood Flow & Metabolism · doi:10.1177/0271678x17749689 · Cited by 201
General Anesthesia Inhibits the Activity of the “Glymphatic System”
Gakuba, C., Gaberel, T., Goursaud, S., Bourges, J., Di Palma, C., Quenault, A., de Lizarrondo, S. M., Vivien, D., & Gauberti, M. (2018) · Theranostics · doi:10.7150/thno.19154 · Cited by 190
Steward, C. E., Venkatraman, V. K., LUI, E. H., Malpas, C. B., Ellis, K. A., Cyarto, E., Vivash, L. E., O'Brien, T. J., Velakoulis, D., Ames, D. J., et al. (2021) · Journal of Neuroimaging · doi:10.1111/jon.12837 · Cited by 184
The Role of Glymphatic System in Alzheimer’s and Parkinson’s Disease Pathogenesis
Buccellato, F. R., D’Anca, M., Serpente, M., Arighi, A., & Galimberti, D. (2022) · Biomedicines · doi:10.3390/biomedicines10092261 · Cited by 190
How Do Meningeal Lymphatic Vessels Drain the CNS?
Raper, D. M. S., Louveau, A., & Kipnis, J. (2016) · Trends in Neurosciences · doi:10.1016/j.tins.2016.07.001 · Cited by 184
Mechanical stress regulates transport in a compliant 3D model of the blood-brain barrier
Partyka, P. P., Godsey, G. A., Galie, J. R., Kosciuk, M. C., Acharya, N. K., Nagele, R. G., & Galie, P. A. (2016) · Biomaterials · doi:10.1016/j.biomaterials.2016.11.012 · Cited by 189
Glymphatic System Function in Relation to Anesthesia and Sleep States
Benveniste, H., Heerdt, P. M., Fontes, M. L., Rothman, D. L., & Volkow, N. D. (2019) · Anesthesia & Analgesia · doi:10.1213/ane.0000000000004069 · Cited by 182
Self-citationInteraction between blood-brain barrier and glymphatic system in solute clearance
Verheggen, I. C. M., van Boxtel, M. P. J., Verhey, F. R. J., Jansen, J. F. A., & Backes, W. H. (2018) · Neuroscience & Biobehavioral Reviews · doi:10.1016/j.neubiorev.2018.03.028 · Cited by 171
Harrison, I. F., Siow, B., Akilo, A. B., Evans, P. G., Ismail, O., Ohene, Y., Nahavandi, P., Thomas, D. L., Lythgoe, M. F., & Wells, J. A. (2018) · eLife · doi:10.7554/elife.34028 · Cited by 170
Bacyinski, A., Xu, M., Wang, W., & Hu, J. (2017) · Frontiers in Neuroanatomy · doi:10.3389/fnana.2017.00101 · Cited by 170
Sundaram, S., Hughes, R. L., Peterson, E., Müller-Oehring, E. M., Brontë-Stewart, H. M., Poston, K. L., Faerman, A., Bhowmick, C., & Schulte, T. (2019) · Neuroscience & Biobehavioral Reviews · doi:10.1016/j.neubiorev.2019.05.016 · Cited by 152
Xia, M., Yang, L., Sun, G., Qi, S., & Li, B. (2017) · Psychopharmacology · doi:10.1007/s00213-016-4473-9 · Cited by 149
Self-citationCerebrospinal Fluid Mechanics and Its Coupling to Cerebrovascular Dynamics
Linninger, A. A., Tangen, K. M., Hsu, C., & Frim, D. M. (2015) · Annual Review of Fluid Mechanics · doi:10.1146/annurev-fluid-122414-034321 · Cited by 152
Norwood, J. N., Zhang, Q., Card, D., Craine, A., Ryan, T. M., & Drew, P. J. (2019) · eLife · doi:10.7554/elife.44278 · Cited by 145
Goulay, R., Romo, L. M., Hol, E. M., & Dijkhuizen, R. M. (2019) · Translational Stroke Research · doi:10.1007/s12975-019-00755-2 · Cited by 144
McKnight, C. D., Trujillo, P., Lopez, A. M., Petersen, K. J., Considine, C. M., Lin, Y., Yan, Y., Kang, H., Donahue, M. J., & Claassen, D. O. (2021) · Parkinsonism & Related Disorders · doi:10.1016/j.parkreldis.2021.06.004 · Cited by 142
A new glaucoma hypothesis: a role of glymphatic system dysfunction
Wostyn, P., Dam, D. V., Audenaert, K., Killer, H. E., Deyn, P. P. D., & Groot, V. D. (2015) · Fluids and Barriers of the CNS · doi:10.1186/s12987-015-0012-z · Cited by 137
Arterial pulsations drive oscillatory flow of CSF but not directional pumping
Kedarasetti, R. T., Drew, P. J., & Costanzo, F. (2020) · Scientific Reports · doi:10.1038/s41598-020-66887-w · Cited by 133
Venkat, P., Chopp, M., Zacharek, A., Cui, C., Zhang, L., Li, Q., Lü, M., Zhang, T., Liu, A., & Chen, J. (2016) · Neurobiology of Aging · doi:10.1016/j.neurobiolaging.2016.11.002 · Cited by 128
Lundgaard, I., Wang, W., Eberhardt, A., Vinitsky, H. S., Reeves, B. C., Peng, S., Lou, N., Hussain, R., & Nedergaard, M. (2018) · Scientific Reports · doi:10.1038/s41598-018-20424-y · Cited by 136
Self-citationAstrocytes and the modulation of sleep
Haydon, P. G. (2017) · Current Opinion in Neurobiology · doi:10.1016/j.conb.2017.02.008 · Cited by 128
Gadolinium Retention and Toxicity—An Update
Ramalho, M., Ramalho, J., Burke, L. M. B., & Semelka, R. C. (2017) · Advances in Chronic Kidney Disease · doi:10.1053/j.ackd.2017.03.004 · Cited by 115
Unravelling the regulation of insulin transport across the brain endothelial cell
Gray, S. M., Aylor, K. W., & Barrett, E. J. (2017) · Diabetologia · doi:10.1007/s00125-017-4285-4 · Cited by 109
Meningeal Lymphatics: From Anatomy to Central Nervous System Immune Surveillance
Papadopoulos, Z., Herz, J., & Kipnis, J. (2020) · The Journal of Immunology · doi:10.4049/jimmunol.1900838 · Cited by 114
Impaired brain glymphatic flow in experimental hepatic encephalopathy
Hadjihambi, A., Harrison, I. F., Costas‐Rodríguez, M., Vanhaecke, F., Arias, N., Gallego‐Durán, R., Mastitskaya, S., Hosford, P. S., Damink, S. W. M. O., Davies, N. A., et al. (2018) · Journal of Hepatology · doi:10.1016/j.jhep.2018.08.021 · Cited by 105
Glymphatic Cerebrospinal Fluid and Solute Transport Quantified by MRI and PET Imaging
Benveniste, H., Lee, H., Ozturk, B., Chen, X., Koundal, S., Vaska, P., Tannenbaum, A., & Volkow, N. D. (2020) · Neuroscience · doi:10.1016/j.neuroscience.2020.11.014 · Cited by 106
Self-citationThe glymphatic system and meningeal lymphatics of the brain: new understanding of brain clearance
Yankova, G., Bogomyakova, O. B., & Тулупов, А. А. (2021) · Reviews in the Neurosciences · doi:10.1515/revneuro-2020-0106 · Cited by 110
Lee, S. H., Yoo, R., Choi, S. H., Oh, S., Ji, S., Lee, J., Huh, K. Y., Lee, J. Y., Hwang, I., Kang, K. M., et al. (2021) · Radiology · doi:10.1148/radiol.2021203784 · Cited by 109
Radford, R. A. W., Morsch, M., Rayner, S. L., Cole, N. J., Pountney, D. L., & Chung, R. S. (2015) · Frontiers in Cellular Neuroscience · doi:10.3389/fncel.2015.00414 · Cited by 105
Hoxworth, J. M., Trentman, T. L., Kotsenas, A. L., Thielen, K. R., Nelson, K. D., & Dodick, D. W. (2012) · American Journal of Roentgenology · doi:10.2214/ajr.11.8238 · Cited by 102
Plog, B. A., Mestre, H., Olveda, G. E., Sweeney, A. M., Kenney, H. M., Cove, A., Dholakia, K. Y., Tithof, J., Nevins, T. D., Lundgaard, I., et al. (2018) · JCI Insight · doi:10.1172/jci.insight.120922 · Cited by 102
Self-citationA clinical primer for the glymphatic system
Carlstrom, L. P., Eltanahy, A. M., Perry, A., Rabinstein, A. A., Elder, B. D., Morris, J. M., Meyer, F. B., Graffeo, C. S., Lundgaard, I., & Burns, T. C. (2021) · Brain · doi:10.1093/brain/awab428 · Cited by 103
Overview of Traumatic Brain Injury: An Immunological Context
Nizamutdinov, D., & Shapiro, L. A. (2017) · Brain Sciences · doi:10.3390/brainsci7010011 · Cited by 104
Intrathecal Use of Gadobutrol for Glymphatic MR Imaging: Prospective Safety Study of 100 Patients
Edeklev, C. S., Halvorsen, M., Løvland, G., Vatnehol, S. A. S., Gjertsen, Ø., Nedregaard, B., Sletteberg, R., Ringstad, G. A., & Eide, P. K. (2019) · American Journal of Neuroradiology · doi:10.3174/ajnr.a6136 · Cited by 100
The diabetic brain and cognition
Riederer, P., Korczyn, A. D., Ali, S. S., Bajenaru, O. A., Choi, M. S., Chopp, M., Dobrota, V. Đ., Grünblatt, E., Jellinger, K. A., Kamal, M. A., et al. (2017) · Journal of Neural Transmission · doi:10.1007/s00702-017-1763-2 · Cited by 98
Christensen, J., Wright, D. K., Yamakawa, G. R., Shultz, S. R., & Mychasiuk, R. (2020) · Scientific Reports · doi:10.1038/s41598-020-63022-7 · Cited by 96
Lu, M., Chen, Y.-T., Chiang, M., Wang, Y., Hsiao, P.-Y., Huang, Y.-J., Lin, C.-T., Cheng, C., Liang, C.-L., & Lai, Y. (2017) · Frontiers in Cellular and Infection Microbiology · doi:10.3389/fcimb.2017.00103 · Cited by 101
Stock, A. D., Gelb, S., Pasternak, O., Ben‐Zvi, A., & Putterman, C. (2017) · Autoimmunity Reviews · doi:10.1016/j.autrev.2017.04.008 · Cited by 93
Imaging the effect of the circadian light–dark cycle on the glymphatic system in awake rats
Cai, X., Qiao, J., Kulkarni, P. P., Harding, I. C., Ebong, E. E., & Ferris, C. F. (2019) · Proceedings of the National Academy of Sciences · doi:10.1073/pnas.1914017117 · Cited by 88
Open questions for Alzheimer’s disease immunotherapy
Golde, T. E. (2014) · Alzheimer s Research & Therapy · doi:10.1186/alzrt233 · Cited by 87
Matsumae, M., Sato, O., Hirayama, A., Hayashi, N., TAKIZAWA, K., Atsumi, H., & Sorimachi, T. (2016) · Neurologia medico-chirurgica · doi:10.2176/nmc.ra.2016-0020 · Cited by 84
Dengue Virus Infection of Blood–Brain Barrier Cells: Consequences of Severe Disease
Calderón-Peláez, M.-A., Velandia-Romero, M. L., Bastidas-Legarda, L. Y., Beltrán, E. O., Camacho-Ortega, S. J., & Castellanos, J. E. (2019) · Frontiers in Microbiology · doi:10.3389/fmicb.2019.01435 · Cited by 84
Exploring the role of microglia in cortical spreading depression in neurological disease
Shibata, M., & Suzuki, N. (2017) · Journal of Cerebral Blood Flow & Metabolism · doi:10.1177/0271678x17690537 · Cited by 81
Pistollato, F., Cano, S. S., Elío, I., Vergara, M. M., Giampieri, F., & Battino, M. A. (2016) · Advances in Nutrition · doi:10.3945/an.115.011775 · Cited by 85
Yamamoto, N., Fujii, Y., Kasahara, R., Tanida, M., Ohora, K., Ono, Y., Suzuki, K., & Sobue, K. (2016) · Glia · doi:10.1002/glia.22974 · Cited by 80
Fiore, N. T., & Austin, P. J. (2016) · Brain Behavior and Immunity · doi:10.1016/j.bbi.2016.04.012 · Cited by 80
Szczygielski, J., Kopańska, M., Wysocka, A., & Oertel, J. (2021) · Frontiers in Neurology · doi:10.3389/fneur.2021.767470 · Cited by 79
Intracranial pressure elevation alters CSF clearance pathways
Vinje, V., Eklund, A., Mardal, K., Rognes, M. E., & Støverud, K.-H. (2020) · Fluids and Barriers of the CNS · doi:10.1186/s12987-020-00189-1 · Cited by 78
Wostyn, P., Killer, H. E., & Deyn, P. P. D. (2017) · Clinical and Experimental Ophthalmology · doi:10.1111/ceo.12915 · Cited by 77
Sleep as a Therapeutic Target in the Aging Brain
Bah, T. M., Goodman, J. R., & Iliff, J. J. (2019) · Neurotherapeutics · doi:10.1007/s13311-019-00769-6 · Cited by 76
Self-citationNose-to-brain/spinal cord delivery kinetics of liposomes with different surface properties
Kurano, T., Kanazawa, T., Ooba, A., Masuyama, Y., Maruhana, N., Yamada, M., Iioka, S., Ibaraki, H., Kosuge, Y., Kondo, H., et al. (2022) · Journal of Controlled Release · doi:10.1016/j.jconrel.2022.03.017 · Cited by 73
Intrathecal Contrast-Enhanced Magnetic Resonance Imaging–Related Brain Signal Changes
Öner, A. Y., Asfuroğlu, B. B., Aykol, Ş., & Talı, E. T. (2016) · Investigative Radiology · doi:10.1097/rli.0000000000000327 · Cited by 72
Gelb, S., Stock, A. D., Anzi, S., Putterman, C., & Ben‐Zvi, A. (2018) · Journal of Autoimmunity · doi:10.1016/j.jaut.2018.03.001 · Cited by 73
Functional hyperemia drives fluid exchange in the paravascular space
Kedarasetti, R. T., Turner, K. L., Echagarruga, C., Gluckman, B. J., Drew, P. J., & Costanzo, F. (2020) · Fluids and Barriers of the CNS · doi:10.1186/s12987-020-00214-3 · Cited by 72
Volume Transmission in the Brain: Beyond the Synapse
Taber, K. H., & Hurley, R. A. (2014) · Journal of Neuropsychiatry · doi:10.1176/appi.neuropsych.13110351 · Cited by 75
Paravascular Pathways in the Eye: Is There an ‘Ocular Glymphatic System'?
Denniston, A. K., & Keane, P. A. (2015) · Investigative Ophthalmology & Visual Science · doi:10.1167/iovs.15-17243 · Cited by 73
Metadata
- Authors
- Yang, L., Kress, B. T., Weber, H. J., Thiyagarajan, M., Wang, B., Deane, R., Benveniste, H., Iliff, J. J., & Nedergaard, M.
- Affiliations
- Hebei Medical University (CN)
- University of Rochester Medicine (US)
- Stony Brook University (US)
- Oregon Health & Science University (US)
- Corresponding author
- Iliff, Jeffrey J
- Nedergaard, Maiken
- Venue
- Journal of Translational Medicine
- Published
- 2013-05-01
- Volume
- 11
- Issue
- 1
- Pages
- 107-107
- ISSN
- 1479-5876 (ISSN-L)
- PMC
- PMC3665671
- OpenAlex
- W2166233935
- Cited by
- 317
- References
- 40
- Citations by year
- 2026: 13 · 2025: 20 · 2024: 13 · 2023: 23 · 2022: 39 · 2021: 24 · 2020: 26 · 2019: 27 · 2018: 26 · 2017: 38 · 2016: 24 · 2015: 25 · 2014: 14 · 2013: 4
- FWCI
- 10.96
- Type
- journal article
- Language
- en
- Open access
- gold
- doi.org
- Licence
- cc-by
- Locations
- Journal of Translational Medicine (publishedVersion, cc-by)
- Europe PMC (PubMed Central) (publishedVersion, cc-by)
- PubMed Central (publishedVersion, cc-by)
- PubMed (publishedVersion)
- Funders
- U.S. Department of Defense
- American Heart Association
- National Institutes of Health
- National Institute of Neurological Disorders and Stroke (R01NS078304, R01NS078167, R01NS075177)
- Topics
- Health Sciences › Medicine › Clinical Neurology › Cerebrospinal fluid and hydrocephalus
- Life Sciences › Neuroscience › Neurology › Barrier Structure and Function Studies
- Life Sciences › Neuroscience › Cellular and Molecular Neuroscience › Alzheimer's disease research and treatments
- Keywords
- glymphatic system, intrathecal infusion, interstitial fluid exchange, amyloid-beta clearance, Alzheimer's disease, neurodegenerative diseases, dynamic contrast-enhanced MRI
- MeSH terms
- Animals, Brain, Cerebrospinal Fluid, Female, Injections, Spinal, Intracranial Pressure, Lumbar Vertebrae, Male, Mice, Inbred C57BL, Molecular Weight, Molecular Probes, Rats, Sprague-Dawley, Extracellular Fluid
About these checks
Registry, retraction, Cites and statistics results are computed, not judged, with one exception: a printed reference that no index lists is read once by a model before it counts as a citation error. Claims are extracted by a model and kept only when their quote appears verbatim in the text; each cited source is then checked, with a model’s help, for whether it says what the claim relies on. Those verdicts can be wrong — read the claim’s quote and the cited source before relying on one.
Statistics and arithmetic are recomputed, not judged.
Confidence bands are shown only for fields calibrated on our annotated test set. None is calibrated yet, so no band is shown.
What counts as a claim ›How we measure confidence ›How we check this ›
Are you an author, or do you see a problem with this page? Request a review
