

mixOmics: An R package for ‘omics feature selection and multiple data integration
Open accessPublished version of a preprint
The DOI matches its Crossref record; 58 of the 58 references it cites were found in a registry or an index.
Abstract
The advent of high throughput technologies has led to a wealth of publicly available 'omics data coming from different sources, such as transcriptomics, proteomics, metabolomics. Combining such large-scale biological data sets can lead to the discovery of important biological insights, provided that relevant information can be extracted in a holistic manner. Current statistical approaches have been focusing on identifying small subsets of molecules (a 'molecular signature') to explain or predict biological conditions, but mainly for a single type of 'omics. In addition, commonly used methods are univariate and consider each biological feature independently. We introduce mixOmics, an R package dedicated to the multivariate analysis of biological data sets with a specific focus on data exploration, dimension reduction and visualisation. By adopting a systems biology approach, the toolkit provides a wide range of methods that statistically integrate several data sets at once to probe relationships between heterogeneous 'omics data sets. Our recent methods extend Projection to Latent Structure (PLS) models for discriminant analysis, for data integration across multiple 'omics data or across independent studies, and for the identification of molecular signatures. We illustrate our latest mixOmics integrative frameworks for the multivariate analyses of 'omics data available from the package.
Overview
The claims and statistics of this paper haven’t been checked yet.
Free: it reads the open-access text and checks the first 5 claims that cite a source we can check. Create a free account to check every claim.
Integrity signals
Registry
Cites
Statistics
Figures



Verification
Claims the paper makes
The claims and statistics of this paper haven’t been checked yet.
Free: it reads the open-access text and checks the first 5 claims that cite a source we can check. Create a free account to check every claim.
Self-check
Percentages, sums and reported differences re-computed from the paper’s own numbers.
The self-check needs the paper’s full text.
Citations
Cites
R: A Language and Environment for Statistical Computing
R Core Team (2025) · doi:10.32614/r.manuals · Cited by 352,181
Regression shrinkage and selection via the lasso
Tibshirani, R. (1996) · Journal of the Royal Statistical Society Series B: Statistical Methodology · doi:10.1111/j.2517-6161.1996.tb02080.x · Cited by 51,482 · cited 1×
“Feature selection is performed via l1 regularisation (LASSO, [27]), which is implemented into each method’s statistical criterion to be optimised.”
MethodRegularization Paths for Generalized Linear Models via Coordinate Descent
Friedman, J., Hastie, T., & Tibshirani, R. (2010) · Journal of Statistical Software · doi:10.18637/jss.v033.i01 · Cited by 19,927 · cited 1×
“glmnet, [38], PMA, [39]), mixOmics uses soft-thresholding to improve usability by replacing the l(1) parameter by the number keepX of features to select on each dimension.”
MethodEnterotypes of the human gut microbiome
MetaHIT Consortium (additional members), Arumugam, M., Raes, J., Pelletier, E., Le Paslier, D., Yamada, T., Mende, D. R., Fernandes, G. R., Tap, J., Bruls, T., et al. (2011) · Nature · doi:10.1038/nature09944 · Cited by 7,548
Partial least squares for discrimination
Barker, M., & Rayens, W. (2003) · Journal of Chemometrics · doi:10.1002/cem.785 · Cited by 2,841
Khan, J., Wei, J. S., Ringnér, M., Saal, L. H., Ladanyi, M., Westermann, F., Berthold, F., Schwab, M., Antonescu, C. R., Peterson, C., et al. (2001) · Nature Medicine · doi:10.1038/89044 · Cited by 2,644 · cited 2×
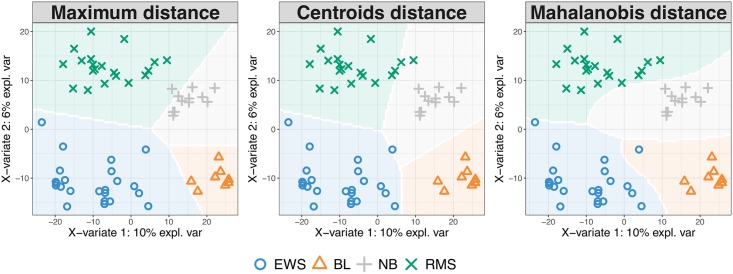
“The study investigates Small Round Blue Cell Tumors (SRBCT, [35]) of 63 tumour samples with the expression levels of 2,308 genes.”
BackgroundMethodLê Cao, K.-A., Boitard, S., & Besse, P. (2011) · BMC Bioinformatics · doi:10.1186/1471-2105-12-253 · Cited by 1,007 · cited 3×
“In single ‘omics analyses this distance achieves best accuracy when the predicted values are close to 0 or 1 [10].”
BackgroundMethodInfluentialPlankton networks driving carbon export in the oligotrophic ocean
Guidi, L., Chaffron, S., Bittner, L., Eveillard, D., Larhlimi, A., Roux, S., Darzi, Y., Audic, S., Berline, L., Brum, J. R., et al. (2016) · Nature · doi:10.1038/nature16942 · Cited by 870 · cited 1×
“(2016), Table 3 and factomineR Husson et al. (2017)). However, very few methods propose feature selection, including sparse CCA (pma package Witten et al. (2013)), sparse PLS (spls package, Chung et al.”
MethodTumor classification by partial least squares using microarray gene expression data
Nguyen, D. V., & Rocke, D. M. (2002) · Bioinformatics · doi:10.1093/bioinformatics/18.1.39 · Cited by 816 · cited 1×
“The assessment is data-driven and similar to the process detailed in Rohart et al. (2016), where one-sided t-tests assess whether there is a gain in performance when adding components to the model.”
MethodPath Models with Latent Variables: The NIPALS Approach
WOLD, H. (1975) · Quantitative Sociology · doi:10.1016/b978-0-12-103950-9.50017-4 · Cited by 802 · cited 1×
“Unsupervised analyses methods include Principal Component Analysis—based on NonLinear Iterative Partial Least Squares for missing values [18], Independent Component Analysis [19], Partial Least Squares regression—PLS, also known as Projection to Latent Structures [20], multi-group PLS [21], regularised Canonical Corre…”
Method
Research works printed but not linked: 3
- A Singh, 2016, DIABLO-an integrative, multi-omics, multivariate method for multi-group classification, bioRxiv, 067611
- F Rohart, 2017, MINT: A multivariate integrative approach to identify a reproducible biomarker signature across multiple experiments and platforms, BMC Bioinformatics, 18
- H Wold, 1966, Estimation of principal components and related models by iterative least squares, J Multivar Anal, 391
Cited by
Items 201–300 of 1,013
Ingham, A. C., Kielsen, K., Mordhorst, H., Ifversen, M., Aarestrup, F. M., Müller, K., & Pamp, S. J. (2021) · Microbiome · doi:10.1186/s40168-021-01100-2 · Cited by 105
“For each body site, we performed sparse partial least squares (sPLS) regression by using the function spls() in the package mixOmics [53].”
Multi-Omics Integrative Approach of Extracellular Vesicles: A Future Challenging Milestone
Shaba, E., Vantaggiato, L., Governini, L., Haxhiu, A., Sebastiani, G., Fignani, D., Grieco, G. E., Bergantini, L., Bini, L., & Landi, C. (2022) · Proteomes · doi:10.3390/proteomes10020012 · Cited by 94
“of statistical and annotation tools, essential for the interpretation of data [128,129].”
BackgroundMulti-omics data integration methods and their applications in psychiatric disorders
Sathyanarayanan, A., Mueller, T. T., Moni, M. A., Schueler, K., Baune, B. T., Lió, P., Mehta, D., Baune, B. T., Dierssen, M., Ebert, B., et al. (2023) · European Neuropsychopharmacology · doi:10.1016/j.euroneuro.2023.01.001 · Cited by 111
Multi-omics tools for studying microbial biofilms: current perspectives and future directions
Seneviratne, C. J., Suriyanarayanan, T., Widyarman, A. S., Lee, L. S., Lau, M., Ching, J., Delaney, C., & Ramage, G. (2020) · Critical Reviews in Microbiology · doi:10.1080/1040841x.2020.1828817 · Cited by 98
“…mixOmics is another R-based software package that facilitates the exploration and integration of biological datasets with a particular focus on variable selection (Rohart et al. 2017). mixOmics can analyze and integrate omics data such as transcriptomics, metabolomics, proteomics, and metagenomics.”
BackgroundMethodQuintanal-Villalonga, A., Taniguchi, H., Zhan, Y. A., Hasan, M. M., Chavan, S. S., Meng, F., Uddin, F., Allaj, V., Manoj, P., Shah, N. S., et al. (2021) · Journal of Hematology & Oncology · doi:10.1186/s13045-021-01186-z · Cited by 89
“Differential methylation analysis Differentially methylated CpGs (DMCs) were identified using DSS R package [22, 23] on the basis of dispersion shrinkage followed by Wald statistical test for beta-binomial distributions.”
MethodRitzel, R. M., Li, Y., Jiao, Y., Lei, Z., Doran, S. J., He, J., Shahror, R. A., Henry, R. J., Khan, R., Tan, C., et al. (2023) · Science Advances · doi:10.1126/sciadv.add1101 · Cited by 89
Edger, P. P., Iorizzo, M., Bassil, N. V., Benevenuto, J., Ferrão, L. F. V., Giongo, L., Hummer, K. E., Lawas, L. M. F., Leisner, C. P., Li, C., et al. (2022) · Horticulture Research · doi:10.1093/hr/uhac083 · Cited by 91
“The recent emergence of ‘multi-omics’ data analysis and integration tools, such as MixOmics [102], MetaboAnalyst [103] and OmicsAnalyzer [104], have been crucial in facilitating data integration from post-analysis approaches, synthesizing individual ‘omics’ analyses, to merging ‘multiomics’ data sets for simultaneous…”
MethodMcEvoy, C. M., Murphy, J. M., Zhang, L., Clotet‐Freixas, S., Mathews, J. A., An, J., Karimzadeh, M., Pouyabahar, D., Su, S., Zaslaver, O., et al. (2022) · Nature Communications · doi:10.1038/s41467-022-35297-z · Cited by 95
“Sex differences in proximal tubular cells were identi fi ed using sparse partial least squares discriminant analysis (sPLS-DA) in mixOmics 115 .”
Lewińska, M., Santos‐Laso, Á., Arretxe, E., Alonso, C., Zhuravleva, E., Jiménez-Agüero, R., Eizaguirre, E., Pareja, M. J., Romero‐Gómez, M., Arrese, M. A., et al. (2021) · EBioMedicine · doi:10.1016/j.ebiom.2021.103661 · Cited by 97
“Multivariate analyses were performed with package mixOmics [27] or Metaboanalyst 4.0.”
InfluentialAdvances in Ultra-High-Resolution Mass Spectrometry for Pharmaceutical Analysis
Deschamps, E., Calabrese, V., Schmitz, I., Hubert‐Roux, M., Castagnos, D., & Afonso, C. (2023) · Molecules · doi:10.3390/molecules28052061 · Cited by 100
“In addition, recent integrative multi-block approaches, namely DIABLO and MINT [150] within the mixOmics package [151], enable data integration from different omics platforms and levels.”
MethodDayton, T. L., Alcala, N., Moonen, L., den Hartigh, L., Geurts, V., Mangiante, L., Lap, L. M. V., Dost, A. F. M., Beumer, J., Levy, S., et al. (2023) · Cancer Cell · doi:10.1016/j.ccell.2023.11.007 · Cited by 93
Raza, A., Salehi, H., Bashir, S., Tabassum, J., Jamla, M., Charagh, S., Barmukh, R., Mir, R. A., Bhat, B. A., Javed, M. A., et al. (2024) · Plant Cell Reports · doi:10.1007/s00299-024-03153-7 · Cited by 101
Barberio, B., Facchin, S., Patuzzi, I., Ford, A. C., Massimi, D., Valle, G., Sattin, E., Simionati, B., Bertazzo, E., Zingone, F., et al. (2022) · Gut Microbes · doi:10.1080/19490976.2022.2028366 · Cited by 93
Biological insights through omics data integration
Noor, E., Cherkaoui, S., & Sauer, U. (2019) · Current Opinion in Systems Biology · doi:10.1016/j.coisb.2019.03.007 · Cited by 83
Big data, integrative omics and network biology
Tolani, P., Gupta, S., Yadav, K., Aggarwal, S., & Yadav, A. K. (2021) · Advances in protein chemistry and structural biology · doi:10.1016/bs.apcsb.2021.03.006 · Cited by 108
Mechanical biofilm disruption causes microbial and immunological shifts in periodontitis patients
Johnston, W., Rosier, B. T., Artacho, A., Paterson, M., Piela, K., Delaney, C., Brown, J. L., Ramage, G., Mira, A., & Culshaw, S. (2021) · Scientific Reports · doi:10.1038/s41598-021-89002-z · Cited by 80
Untargeted metabolomics yields insight into ALS disease mechanisms
Goutman, S. A., Boss, J., Guo, K., Alakwaa, F. M., Patterson, A., Kim, S., Savelieff, M. G., Hur, J., & Feldman, E. L. (2020) · Journal of Neurology, Neurosurgery & Psychiatry · doi:10.1136/jnnp-2020-323611 · Cited by 83
“18 Score plots illustrate differences between case versus control groups.”
Hanson, A., Mulè, M. P., Ruffieux, H., Mescia, F., Bergamaschi, L., Pelly, V. S., Turner, L., Kotagiri, P., Göttgens, B., Hess, C., et al. (2024) · Nature Immunology · doi:10.1038/s41590-024-01754-8 · Cited by 86
Multi-omics integration analysis: Tools and applications in environmental toxicology
Shi, C., Cheng, L., Yu, Y., Chen, S., Dai, Y., Yang, J., Zhang, H., Chen, J., & Geng, N. (2024) · Environmental Pollution · doi:10.1016/j.envpol.2024.124675 · Cited by 91
Amin, A., Zaman, W., & Park, S. (2025) · Genes · doi:10.3390/genes16070809 · Cited by 98
“The mixOmics R package offers a comprehensive toolkit for multivariate analysis, encompassing canonical correlation analysis (CCA) and partial least squares (PLS), supporting the supervised and unsupervised integration of heterogeneous data [70].”
Chu, S. H., Huang, M., Kelly, R. S., Benedetti, E., Siddiqui, J., Zeleznik, O. A., Pereira, A., Herrington, D. M., Wheelock, C. E., Krumsiek, J., et al. (2019) · Metabolites · doi:10.3390/metabo9060117 · Cited by 88
“Computational frameworks such as Mixomics [132] provide access to a multitude of multivariate methods but do not include knowledge-based methods and require statistical and computational knowledge.”
BackgroundMetabolomic investigations in cerebrospinal fluid of Parkinson's disease
Willkommen, D., Lucio, M., Moritz, F., Forcisi, S., Kanawati, B., Smirnov, K. S., Schroeter, M., Sigaroudi, A., Schmitt‐Kopplin, P., & Michalke, B. (2018) · PLoS ONE · doi:10.1371/journal.pone.0208752 · Cited by 86
Design of synthetic microbial consortia for gut microbiota modulation
Vázquez-Castellanos, J. F., Biclot, A., Vrancken, G., Huys, G. R. B., & Raes, J. (2019) · Current Opinion in Pharmacology · doi:10.1016/j.coph.2019.07.005 · Cited by 87
Smits, M. M., Fluitman, K. S., Herrema, H., Davids, M., Kramer, M. H. H., Groen, A. K., Belzer, C., de Vos, W. M., Cahen, D. L., Nieuwdorp, M., et al. (2021) · Diabetes & Metabolism · doi:10.1016/j.diabet.2021.101223 · Cited by 75
Translocated microbiome composition determines immunological outcome in treated HIV infection
Nganou‐Makamdop, K., Talla, A., Sharma, A., Darko, S. W., Ransier, A., Laboune, F., Chipman, J. G., Beilman, G. J., Hoskuldsson, T., Fourati, S., et al. (2021) · Cell · doi:10.1016/j.cell.2021.05.023 · Cited by 89
Glycine promotes longevity in Caenorhabditis elegans in a methionine cycle-dependent fashion
Liu, Y. J., Janssens, G. E., McIntyre, R. L., Molenaars, M., Kamble, R., Gao, A. W., Jongejan, A., Weeghel, M. V., MacInnes, A. W., & Houtkooper, R. H. (2019) · PLOS Genetics · doi:10.1371/journal.pgen.1007633 · Cited by 82
“RNA-seq samples were compared using principal component analysis (PCA) and Partial least squares discriminant analysis (PLS-DA) using mixomics (55).”
MethodIdentification of key pathways and metabolic fingerprints of longevity in C. elegans
Gao, A. W., Smith, R. L., van Weeghel, M., Kamble, R., Janssens, G. E., & Houtkooper, R. H. (2018) · Experimental Gerontology · doi:10.1016/j.exger.2018.10.003 · Cited by 92
Big data: Historic advances and emerging trends in biomedical research
Cremin, C. J., Dash, S., & Huang, X. (2022) · Current Research in Biotechnology · doi:10.1016/j.crbiot.2022.02.004 · Cited by 104
den Abbeele, P. V., Ghyselinck, J., Marzorati, M., Koch, A.-M., Lambert, W., Michiels, J., & Chalvon‐Demersay, T. (2022) · Microorganisms · doi:10.3390/microorganisms10040762 · Cited by 86
“Regarding compositional data, proportional phylogenetic data was used as input. rCCA was executed using the mixOmics package with the shrinkage method for estimation of penalisation parameters (version 6.16.3, Rohart et al., 2017) in R (https://www.r-project.org/, accessed on 13 March 2022) [36].”
MethodInfluentialKetamine exerts its sustained antidepressant effects via cell-type-specific regulation of Kcnq2
Lopez, J. P., Lücken, M. D., Brivio, E., Karamihalev, S., Kos, A., De Donno, C., Benjamin, A., Yang, H., Dick, A. L. W., Stoffel, R., et al. (2022) · Neuron · doi:10.1016/j.neuron.2022.05.001 · Cited by 79
“The ketamine response score was developed using PLS-DA, as implemented in the mixOmics package in R (v. 6.12.2) (Rohart et al., 2017).”
MethodInfluentialJacquemont, L., Tilly, G., Yap, M., Doan-Ngoc, T.-M., Danger, R., Guérif, P., Delbos, F., Martinet, B., Giral, M., Foucher, Y., et al. (2020) · Journal of the American Society of Nephrology · doi:10.1681/asn.2019080847 · Cited by 78
Meale, S. J., Popova, M., Saro, C., Martin, C., Bernard, A., Lagrée, M., Yáñez-Ruíz, D. R., Boudra, H., Duval, S. M., & Morgavi, D. (2021) · Scientific Reports · doi:10.1038/s41598-021-82084-9 · Cited by 102
Balle, C., Konstantinus, I. N., Jaumdally, S. Z., Havyarimana, E., Lennard, K. S., Esra, R. T., Barnabas, S. L., Happel, A., Moodie, Z., Gill, K., et al. (2020) · Nature Communications · doi:10.1038/s41467-020-19382-9 · Cited by 87
A dysbiotic microbiome promotes head and neck squamous cell carcinoma
Frank, D. N., Qiu, Y., Cao, Y. Q., Zhang, S., Lu, L., Kofonow, J. M., Robertson, C. E., Liu, Y., Wang, H., Levens, C. L., et al. (2022) · Oncogene · doi:10.1038/s41388-021-02137-1 · Cited by 86
“We confirmed these results using three complementary approaches: sparse partial least squares discriminant analysis (sPLS-DA [33, 34]), logistic regression with lasso (glmnet [35]), and random forest classification [36, 37].”
MethodResultMetzler-Zebeli, B. U., Siegerstetter, S.-C., Magowan, E. A., Lawlor, P. G., O’Connell, N. E., & Zebeli, Q. (2019) · Frontiers in Microbiology · doi:10.3389/fmicb.2019.01576 · Cited by 86
“Additionally, sPLS and relevance network analysis were performed using “mixOmics” (Lê Cao et al., 2016; Rohart et al., 2017) to integrate data of OTUs (0.”
MethodBarber, C., Mego, M., Sabater, C., Vallejo, F., Bendezu, R. A., Masihy, M., Guarner, F., Espín, J. C., Margollés, A., & Azpiroz, F. (2021) · Nutrients · doi:10.3390/nu13082638 · Cited by 86
“Moreover, multi-omic data integration using the DIABLO biomarker discovery pipeline [33] was used to determine characteristic fermentation profiles.”
MethodThe canine oral microbiome: variation in bacterial populations across different niches
Ruparell, A., Inui, T., Staunton, R. H., Wallis, C. V., Deusch, O., & Holcombe, L. J. (2020) · BMC Microbiology · doi:10.1186/s12866-020-1704-3 · Cited by 89
Metzler-Zebeli, B. U., Siegerstetter, S.-C., Magowan, E. A., Lawlor, P. G., Petri, R. M., O’Connell, N. E., & Zebeli, Q. (2019) · mSystems · doi:10.1128/msystems.00261-18 · Cited by 97
“Additionally, sPLS and relevance network analyses were performed using mixOmics (13, 36) to integrate data of OTUs (0.”
MethodNetwork-Based Approaches for Multi-omics Integration
Zhou, G., Li, S., & Xia, J. (2020) · Methods in molecular biology · doi:10.1007/978-1-0716-0239-3_23 · Cited by 87
Toward collaborative open data science in metabolomics using Jupyter Notebooks and cloud computing
Mendez, K. M., Pritchard, L., Reinke, S. N., & Broadhurst, D. (2019) · Metabolomics · doi:10.1007/s11306-019-1588-0 · Cited by 84
Integrative Network Fusion: A Multi-Omics Approach in Molecular Profiling
Chierici, M., Bussola, N., Marcolini, A., Francescatto, M., Zandonà, A., Trastulla, L., Agostinelli, C., Jurman, G., & Furlanello, C. (2020) · Frontiers in Oncology · doi:10.3389/fonc.2020.01065 · Cited by 89
Faecal microbial transfer and complex carbohydrates mediate protection against COPD
Budden, K. F., Shukla, S. D., Bowerman, K. L., Vaughan, A., Gellatly, S. L., Wood, D., Lachner, N., Idrees, S., Rehman, S. F., Faiz, A., et al. (2024) · Gut · doi:10.1136/gutjnl-2023-330521 · Cited by 83
Bacterial–Fungal Interactions in the Kelp Endomicrobiota Drive Autoinducer-2 Quorum Sensing
Tourneroche, A., Lami, R., Hubas, C., Blanchet, É., Vallet, M., Escoubeyrou, K., Paris, A., & Prado, S. (2019) · Frontiers in Microbiology · doi:10.3389/fmicb.2019.01693 · Cited by 74
“Multivariate analyses were done using the R library mixOmics (Rohart et al., 2017).”
MethodLED Illumination for High-Quality High-Yield Crop Growth in Protected Cropping Environments
Rahman, M. M., Field, D. L., Ahmed, S. M., Hasan, M. T., Basher, M. K., & Alameh, K. (2021) · Plants · doi:10.3390/plants10112470 · Cited by 86
From ‘Omics to Multi-omics Technologies: the Discovery of Novel Causal Mediators
Mohammadi‐Shemirani, P., Sood, T., & Paré, G. (2023) · Current Atherosclerosis Reports · doi:10.1007/s11883-022-01078-8 · Cited by 82
Wang, Q., Wang, K., Wu, W., Lv, L., Bian, X., Yang, L., Wang, Q., Li, Y., Ye, J., Fang, D., et al. (2020) · Applied Microbiology and Biotechnology · doi:10.1007/s00253-020-10621-z · Cited by 76
“The analysis was conducted using mixOmics R package (Rohart et al. 2017).”
MethodSimon, B. D., Ozyoruk, K. B., Gelikman, D. G., Harmon, S. A., & Türkbey, B. (2024) · Diagnostic and Interventional Radiology · doi:10.4274/dir.2024.242631 · Cited by 73
Jha, M. K., Lee, Y., Russell, K. A., Yang, F., Dastgheyb, R. M., Deme, P., Ament, X. H., Chen, W., Liu, Y., Guan, Y., et al. (2020) · Glia · doi:10.1002/glia.23710 · Cited by 73
Vertical and horizontal integration of multi-omics data with miodin
Ulfenborg, B. (2019) · BMC Bioinformatics · doi:10.1186/s12859-019-3224-4 · Cited by 73
“The mixOmics package [37] provides both un-supervised and supervised methods based on Partial Least Squares and Canonical Correlation Analysis, with generalizations to multi-block data.”
MethodVaginal Microbiota and Cytokine Levels Predict Preterm Delivery in Asian Women
Kumar, M., Murugesan, S., Singh, P., Saadaoui, M., Elhag, D. A., Terranegra, A., Kabeer, B. S. A., Marr, A. K., Kino, T., Brummaier, T., et al. (2021) · Frontiers in Cellular and Infection Microbiology · doi:10.3389/fcimb.2021.639665 · Cited by 83
“For TB and PTB, sCCA was performed separately using the sgcca package in R and displayed in a correlation circle plot [36].”
MethodPodlesny, D., Arze, C., Dörner, E., Verma, S., Dutta, S., Walter, J., & Fricke, W. F. (2022) · Microbiome · doi:10.1186/s40168-022-01251-w · Cited by 73
Song, K., Guo, S., Gong, Y., Lv, D., Zhang, Y., Wan, Z., Li, T., Zhu, W., Wang, H., Yu, Y., et al. (2022) · Atmospheric chemistry and physics · doi:10.5194/acp-22-9827-2022 · Cited by 73
Khanna, S., Domingo-Fernández, D., Iyappan, A., Emon, M. A., Hofmann-Apitius, M., & Fröhlich, H. (2018) · Scientific Reports · doi:10.1038/s41598-018-29433-3 · Cited by 71
“We here tested two different sparse GCCA implementations, one provided in R-package “mixOmics” 102 and the other one provided in R-package “PMA” 18 .”
MethodKupritz, J., Angelova, A. G., Nutman, T. B., & Gazzinelli-Guimarães, P. H. (2021) · mBio · doi:10.1128/mbio.02890-21 · Cited by 84
“Finally, taxonomic correlation analysis based on sparse partial least square regression was performed with the R package mixOmics (67) to determine taxa consistently correlated with helminth infection across samples; briefly, a binary abundance matrix was created to represent the presence or absence of a helminth spec…”
MethodGut microbiome and atrial fibrillation—results from a large population-based study
Palmu, J., Börschel, C. S., Ortega‐Alonso, A., Markó, L., Inouye, M., Jousilahti, P., Salido, R. A., Sanders, K., Brennan, C., Humphrey, G., et al. (2023) · EBioMedicine · doi:10.1016/j.ebiom.2023.104583 · Cited by 79
Fulcher, J. M., Markillie, L. M., Mitchell, H. D., Williams, S., Engbrecht, K. M., Degnan, D. J., Bramer, L., Moore, R., Chrisler, W., Cantlon-Bruce, J., et al. (2024) · Nature Communications · doi:10.1038/s41467-024-54099-z · Cited by 90
“Sparse partial least squares discriminant analysis (spls-DA) was utilized based on previously described algorithm 56 .”
Zagorščak, M., Abdelhakim, L. O. A., Rodriguez‐Granados, N. Y., Široká, J., Ghatak, A., Bleker, C., Blejec, A., Zrimec, J., Novák, O., Pěnčík, A., et al. (2025) · PLANT PHYSIOLOGY · doi:10.1093/plphys/kiaf126 · Cited by 78
“Most broadly used are the mixOmics package (Rohart et al. 2017; Singh et al. 2019), integrating datasets based on correlations, and the pathway visualization tool PaintOmics (Liu et al. 2022).”
InfluentialAdvancing precision oncology with AI-powered genomic analysis
Srivastava, R. (2025) · Frontiers in Pharmacology · doi:10.3389/fphar.2025.1591696 · Cited by 84
Comprehensive analysis of oncogenic determinants across tumor types via multi-omics integration
Ubaid, S., Kushwaha, R., Kashif, M., & Singh, V. K. (2025) · Cancer Genetics · doi:10.1016/j.cancergen.2025.08.010 · Cited by 85
Martin, O. C. B., Olier, M., Ellero‐Simatos, S., Naud, N., Dupuy, J., Laurence Therese, H. U. C., Taché, S., Graillot, V., Levêque, M., Bézirard, V., et al. (2019) · Microbiome · doi:10.1186/s40168-019-0685-7 · Cited by 76
“Both of these supervised multiblock approaches (two or three datasets), for which generic recommended frameworks were applied [36, 37], are able to maximise common or correlated information into a single exploratory analysis.”
BackgroundMethodTeo, E., Ravi, S., Barardo, D., Kim, H.-S., Fong, S., Cazenave-Gassiot, A., Tan, T. Y., Ching, J., Kovalik, J.-P., Wenk, M. R., et al. (2019) · eLife · doi:10.7554/elife.50069 · Cited by 72
“0) R package (Rohart et al., 2017) was used to create the heatmap (Figure 5— figure supplement 2) using the principal components (PCA) loadings, after scaling and centering, of the raw abundances of each metabolite.”
MethodpmartR : Quality Control and Statistics for Mass Spectrometry-Based Biological Data
Stratton, K. G., Webb‐Robertson, B., McCue, L. A., Stanfill, B., Claborne, D. M., Godinez, I., Johansen, T., Thompson, A. M., Burnum-Johnson, K., Waters, K. M., et al. (2019) · Journal of Proteome Research · doi:10.1021/acs.jproteome.8b00760 · Cited by 77
“Several R packages are available for statistical analysis of proteomics data 11,12 and have excellent functionality for statistics but minimal QC. 12,13 Other packages support individualized analyses of single samples or biomolecules but rely on the user to add the functionality to statistically…”
MethodMachine Learning-Based Presymptomatic Detection of Rice Sheath Blight Using Spectral Profiles
Conrad, A. O., Li, W., Lee, D.-Y., Wang, G., RODRIGUEZ‐SAONA, L. E., & Bonello, P. (2020) · Plant Phenomics · doi:10.34133/2020/8954085 · Cited by 81
“Finally, sparse partial least squares discriminant analysis (sPLS-DA) (package: “mixOmics”) [41] was run to confirm the identities of important spectral bands across analyses and experiments.”
MethodVoß, H., Schlumbohm, S., Barwikowski, P., Wurlitzer, M., Dottermusch, M., Neumann, P., Schlüter, H., Neumann, J. E., & Krisp, C. (2022) · Nature Communications · doi:10.1038/s41467-022-31007-x · Cited by 81
The effects of multifactorial stress combination on rice and maize
Sinha, R., Peláez‐Vico, M. Á., Shostak, B., Nguyen, T. T., Pascual, L. S., Ogden, A., Lyu, Z., Zandalinas, S. I., Joshi, T., Fritschi, F., et al. (2023) · PLANT PHYSIOLOGY · doi:10.1093/plphys/kiad557 · Cited by 71
Methods for multi-omic data integration in cancer research
Lemus, E. H., & Ochoa, S. (2024) · Frontiers in Genetics · doi:10.3389/fgene.2024.1425456 · Cited by 78
Integrating bioinformatics approaches for a comprehensive interpretation of metabolomics datasets
Barupal, D. K., Fan, S., & Fiehn, O. (2018) · Current Opinion in Biotechnology · doi:10.1016/j.copbio.2018.01.010 · Cited by 81
Predictive Modeling for Metabolomics Data
Ghosh, T., Zhang, W., Ghosh, D., & Kechris, K. J. (2020) · Methods in molecular biology · doi:10.1007/978-1-0716-0239-3_16 · Cited by 80
Characterization of the Vaginal DNA Virome in Health and Dysbiosis
Jakobsen, R. R., Haahr, T., Humaidan, P., Jensen, J. S., Kot, W., Castro-Mejía, J. L., Deng, L., Leser, T. D., & Nielsen, D. S. (2020) · Viruses · doi:10.3390/v12101143 · Cited by 82
“Associations between the bacterial and viral community were performed using the mixOmics [41] R package using CSS-normalized operational taxonomic unit (OTU)-tables as input.”
MethodAyelo, P. M., Yusuf, A. A., Pirk, C. W. W., Chailleux, A., Mohamed, S. A., & Delétré, E. (2021) · Pest Management Science · doi:10.1002/ps.6568 · Cited by 79
Applications of Omics Technology for Livestock Selection and Improvement
Chakraborty, D., Sharma, N., Kour, S., Sodhi, S. S., Gupta, M. K., Lee, S., & Son, Y. (2022) · Frontiers in Genetics · doi:10.3389/fgene.2022.774113 · Cited by 76
Simpson, J. B., Walker, M. E., Sekela, J. J., Ivey, S. M., Jariwala, P. B., Storch, C. M., Kowalewski, M. E., Graboski, A. L., Lietzan, A. D., Walton, W. G., et al. (2024) · Cell Host & Microbe · doi:10.1016/j.chom.2024.04.018 · Cited by 78
Gut microbiota contributes to high-altitude hypoxia acclimatization of human populations
Su, Q., Zhuang, D., Li, Y., Chen, Y., Wang, X.-Y., Ge, M., Xue, T.-Y., Zhang, Q.-Y., Liu, X., Yin, F.-Q., et al. (2024) · Genome biology · doi:10.1186/s13059-024-03373-w · Cited by 76
“18.1) [61].”
InfluentialVrieling, F., Alisjahbana, B., Sahiratmadja, E., van Crevel, R., Harms, A. C., Hankemeier, T., Ottenhoff, T. H. M., & Joosten, S. A. (2019) · Scientific Reports · doi:10.1038/s41598-019-54983-5 · Cited by 76
Kalogiouri, N. P., Manousi, N., Rosenberg, E., Zachariadis, G. A., Paraskevopoulou, A., & Samanidou, V. (2021) · Food Chemistry · doi:10.1016/j.foodchem.2021.130331 · Cited by 70
Huet, S., Romdhane, S., Breuil, M., Bru, D., Mounier, A., Spor, A., & Philippot, L. (2023) · Microbiome · doi:10.1186/s40168-023-01480-7 · Cited by 74
Genetic heterogeneity: Challenges, impacts, and methods through an associative lens
Woodward, A., Urbanowicz, R. J., Naj, A. C., & Moore, J. H. (2022) · Genetic Epidemiology · doi:10.1002/gepi.22497 · Cited by 76
“Others have developed integration methods targeted to cancer research and beyond, with various methods and packages available for application to “big data” (Dong & Srivastava, 2013; Karczewski & Snyder, 2018; Rohart et al., 2017).”
MethodDisease-specific loss of microbial cross-feeding interactions in the human gut
Marcelino, V. R., Welsh, C., Diener, C., Gulliver, E. L., Rutten, E. L., Young, R. B., Giles, E. M., Gibbons, S. M., Greening, C., & Forster, S. C. (2023) · Nature Communications · doi:10.1038/s41467-023-42112-w · Cited by 80
“To better understand how the modelling framework compare to more traditional composition-based analyses, we visualized the community beta diversity using a PCA plot of CLR-normalized species abundances with mixOmics 64 , using the balanced dataset from He and colleagues 33 described above.”
Kiros, T. G. G., Luise, D., Derakhshani, H., Petri, R. M., Trevisi, P., d'Inca, R., Auclair, E., & Kessel, A. G. V. (2019) · PLoS ONE · doi:10.1371/journal.pone.0219557 · Cited by 84
“Biostatistics on OTUs were performed using phyloSeq [26], Vegan [27] and mixOmix [28] packages in R software (v.”
MethodCo-occurring microorganisms regulate the succession of cyanobacterial harmful algal blooms
Wang, K., Mou, X., Cao, H., Struewing, I. T., Allen, J., & Lu, J. (2021) · Environmental Pollution · doi:10.1016/j.envpol.2021.117682 · Cited by 74
“The sparse partial least square (sPLS) analysis was further performed to assess whether the gene transcripts within the selected module could explain the biomass variation of a cyanobacterial taxon using R package mixOmics (Rohart et al., 2017).”
MethodPLSDA-batch: a multivariate framework to correct for batch effects in microbiome data
Wang, Y., & Cao, K. L. (2023) · Briefings in Bioinformatics · doi:10.1093/bib/bbac622 · Cited by 77
“Both parameters can be chosen simultaneously using repeated cross-validation by evaluating the classification error rate on a grid of number of variables to select on each component [34].”
MethodInfluentialLi, Y., Kong, F., Li, S., Wang, J., Hu, J., Chen, S., Chen, Q., Li, Y., Ha, X., & Sun, W. (2023) · Journal of Hazardous Materials · doi:10.1016/j.jhazmat.2023.131706 · Cited by 69
Grammar of protein domain architectures
Yu, L., Tanwar, D. K., Penha, E. D. S., Wolf, Y. I., Koonin, E. V., & Basu, M. K. (2019) · Proceedings of the National Academy of Sciences · doi:10.1073/pnas.1814684116 · Cited by 69
“We used the splsda method from the R package mixOmics (78) and performed feature selection after variable tuning.”
MethodThe dental calculus metabolome in modern and historic samples
Velsko, I. M., Overmyer, K. A., Speller, C., Klaus, L., Collins, M. J., Loe, L., Frantz, L. A. F., Sankaranarayanan, K., Lewis, C. M., Martinez, J. B. R., et al. (2017) · Metabolomics · doi:10.1007/s11306-017-1270-3 · Cited by 67
“Partial Least Squares Discriminant Analysis (PLS-DA) was performed using the R package mixOmics (Rohart et al. 2017) in default settings.”
MethodSathyanarayanan, A., Gupta, R., Thompson, E. W., Nyholt, D. R., Bauer, D. C., & Nagaraj, S. H. (2020) · Briefings in Bioinformatics · doi:10.1093/bib/bbz121 · Cited by 70
“The integration is performed at sample level, and commonly used tools include SNF [23], BCC [24], iClusterPlus [25] and mixOmics [26].”
MethodProteomic and Metaproteomic Approaches to Understand Host–Microbe Interactions
Starr, A. E., Deeke, S. A., Li, L., Zhang, X., Daoud, R., Ryan, J., Ning, Z., Cheng, K., Nguyen, L. V. H., Abou-Samra, E., et al. (2017) · Analytical Chemistry · doi:10.1021/acs.analchem.7b04340 · Cited by 73
Pötgens, S. A., Thibaut, M. M., Joudiou, N., Sboarina, M., Neyrinck, A. M., Cani, P. D., Claus, S. P., Delzenne, N. M., & Bindels, L. B. (2021) · Journal of Cachexia Sarcopenia and Muscle · doi:10.1002/jcsm.12684 · Cited by 75
“scaling to unit variance was performed using the pca function of the mixOmics package.(41) Overlay of CT and C26 average spectra was generated using an in-house script using the plotrix,(42) colorRamps,(43) and autoimage(44) R packages.”
MethodZhang, Y., Zhu, X. M., Wang, N., Liu, X., Wang, L., & Ning, K. (2025) · Trends in Food Science & Technology · doi:10.1016/j.tifs.2025.104891 · Cited by 77
Celis Ramírez, A. M., Amézquita, A., Cardona Jaramillo, J. E. C., Matiz-Cerón, L. F., Andrade-Martínez, J. S., Triana, S., Mantilla, M. J., Restrepo, S., Barrios, A. F. G., & Cock, H. D. (2020) · Frontiers in Cellular and Infection Microbiology · doi:10.3389/fcimb.2020.00338 · Cited by 61
“All analyses were conducted on the package mixOmics (Rohart et al., 2017), as implemented in R1 (details of the code are given in S4 File).”
BackgroundMethodMining chicken ileal microbiota for immunomodulatory microorganisms
Liu, Y., Feng, Y., Yang, X., Lv, Z., Li, P., Zhang, M., Wei, F., Jin, X., Hu, Y., Guo, Y., et al. (2023) · The ISME Journal · doi:10.1038/s41396-023-01387-z · Cited by 69
“8 [82] to unravel specific correlations between immune index and microorganisms in all samples.”
BackgroundCurrent Bioinformatics Tools in Precision Oncology
Wolde, T., Bhardwaj, V., & Pandey, V. (2025) · MedComm · doi:10.1002/mco2.70243 · Cited by 78
Lee, B., Mahmud, I., Pokhrel, R., Murad, R., Yuan, M., Stapleton, S. L., Bettegowda, C., Jallo, G. I., Eberhart, C. G., Garrett, T. J., et al. (2022) · Acta Neuropathologica Communications · doi:10.1186/s40478-022-01326-7 · Cited by 73
“and metabolome Given that the transcriptome, lipidome, and metabolome are integrated and interrelated biological systems that modulate phenotype, we next performed a multivariate analysis to integrate the molecular changes characterizing the CSF of MB patients using the data integration analysis for biomarker discover…”
MethodTognetti, M., Sklodowski, K., Müller, S., Kamber, D., Muntel, J., Bruderer, R., & Reiter, L. (2022) · Journal of Proteome Research · doi:10.1021/acs.jproteome.2c00122 · Cited by 70
Bridging preclinical and clinical gut microbiota research using the ex vivo SIFR® technology
den Abbeele, P. V., Deyaert, S., Thabuis, C., Perreau, C., Bajic, D., Wintergerst, E., Joossens, M., Firrman, J., Walsh, D. M., & Baudot, A. (2023) · Frontiers in Microbiology · doi:10.3389/fmicb.2023.1131662 · Cited by 75
Chemometric-Guided Approaches for Profiling and Authenticating Botanical Materials
Abraham, E. J., & Kellogg, J. J. (2021) · Frontiers in Nutrition · doi:10.3389/fnut.2021.780228 · Cited by 64
Microbial exposure and human health
Sharma, A., & Gilbert, J. A. (2018) · Current Opinion in Microbiology · doi:10.1016/j.mib.2018.08.003 · Cited by 72
Correia, P. M. P., Westergaard, J. C., da Silva, A. B., Roitsch, T. G., Carmo‐Silva, E., & da Silva, J. M. (2022) · Journal of Experimental Botany · doi:10.1093/jxb/erac160 · Cited by 65
“A partial least squares discriminant analysis (PLS-DA) was performed to classify and discriminate plants into treatments (WW38 and WD38) and genotypes for each treatment, and to identify the key variables that drive such discrimination (MixOmics R package, Rohart et al. , 2017).”
Vujanović, D., Losapio, G., Milić, S., & Milić, D. (2022) · Frontiers in Plant Science · doi:10.3389/fpls.2022.875824 · Cited by 67
“We performed sparse partial least squares discriminant analysis (splsda function in mixOmics package; Rohart et al., 2017), which classifies plots depending on whole soil conditions and selects relevant variables of putative influence.”
MethodFeng, P., Yang, J., Zhao, S., Ling, Z., Han, R., Wu, Y., Salama, E., Kakade, A., Khan, A., Jin, W., et al. (2022) · npj Biofilms and Microbiomes · doi:10.1038/s41522-022-00326-8 · Cited by 72
Metaproteomic and Metabolomic Approaches for Characterizing the Gut Microbiome
Peters, D. L., Wang, W., Zhang, X., Ning, Z., Mayne, J., & Figeys, D. (2019) · PROTEOMICS · doi:10.1002/pmic.201800363 · Cited by 68
Metadata
- Authors
- Rohart, F., Gautier, B., Singh, A., & Lê Cao, K.-A.
- Affiliations
- Translational Research Institute (AU)
- University of British Columbia (CA)
- Venue
- PLOS Computational Biology
- Publisher
- Public Library of Science (PLoS)
- Published
- 2017-11-03
- Volume
- 13
- Issue
- 11
- Pages
- e1005752
- ISSN
- 1553-734X (ISSN-L)
- 1553-7358
- PMC
- PMC5687754
- OpenAlex
- W2950985821
- Cited by
- 4,056
- References
- 57
- Citations by year
- 2026: 629 · 2025: 612 · 2024: 600 · 2023: 523 · 2022: 496 · 2021: 489 · 2020: 350 · 2019: 241 · 2018: 95 · 2017: 14
- FWCI
- 78.13
- Type
- journal article
- Language
- en
- Update notices
- new_version (2017-11-15)
- Open access
- gold
- doi.org
- Licence
- Locations
- PLoS Computational Biology (publishedVersion, cc-by)
- bioRxiv (Cold Spring Harbor Laboratory) (acceptedVersion, cc-by-nc-nd)
- PubMed Central (publishedVersion, cc-by)
- PubMed (publishedVersion)
- Minerva Access (University of Melbourne) (submittedVersion, cc-by)
- RePEc: Research Papers in Economics (submittedVersion)
- DOAJ (DOAJ: Directory of Open Access Journals) (submittedVersion, cc-by-sa)
- Figshare (submittedVersion, cc-by)
- Funders
- National Health and Medical Research Council (APP1087415)
- Australian Cancer Research Foundation (ACRF) for the Diamantina Individualised Oncology Care Centre
- Topics
- Life Sciences › Biochemistry, Genetics and Molecular Biology › Molecular Biology › Bioinformatics and Genomic Networks
- Life Sciences › Biochemistry, Genetics and Molecular Biology › Molecular Biology › Metabolomics and Mass Spectrometry Studies
- Life Sciences › Biochemistry, Genetics and Molecular Biology › Molecular Biology › Gene expression and cancer classification
- Keywords
- R package, multi-omics integration, feature selection, multivariate analysis, dimensionality reduction, partial least squares regression, discriminant analysis, molecular signatures, systems biology, transcriptomics, proteomics, metabolomics, exploratory data analysis
- MeSH terms
- Data Interpretation, Statistical, Humans, Neoplasms, Software, Computational Biology, Genomics, Systems Biology, Metabolomics
About these checks
Registry, retraction, Cites and statistics results are computed, not judged, with one exception: a printed reference that no index lists is read once by a model before it counts as a citation error. Claims are extracted by a model and kept only when their quote appears verbatim in the text; each cited source is then checked, with a model’s help, for whether it says what the claim relies on. Those verdicts can be wrong — read the claim’s quote and the cited source before relying on one.
Statistics and arithmetic are recomputed, not judged.
Confidence bands are shown only for fields calibrated on our annotated test set. None is calibrated yet, so no band is shown.
What counts as a claim ›How we measure confidence ›How we check this ›
Are you an author, or do you see a problem with this page? Request a review
Data sources
Bibliographic data: Semantic Scholar, OpenAlex, Crossref.
Contains information from the Semantic Scholar Academic Graph Datasets, made available under the ODC Attribution License (ODC-BY 1.0).
Semantic Scholar’s data is described in: Kinney, R., et al. (2023). The Semantic Scholar Open Data Platform. arXiv:2301.10140.
