

mixOmics: An R package for ‘omics feature selection and multiple data integration
Open accessPublished version of a preprint
The DOI matches its Crossref record; 58 of the 58 references it cites were found in a registry or an index.
Abstract
The advent of high throughput technologies has led to a wealth of publicly available 'omics data coming from different sources, such as transcriptomics, proteomics, metabolomics. Combining such large-scale biological data sets can lead to the discovery of important biological insights, provided that relevant information can be extracted in a holistic manner. Current statistical approaches have been focusing on identifying small subsets of molecules (a 'molecular signature') to explain or predict biological conditions, but mainly for a single type of 'omics. In addition, commonly used methods are univariate and consider each biological feature independently. We introduce mixOmics, an R package dedicated to the multivariate analysis of biological data sets with a specific focus on data exploration, dimension reduction and visualisation. By adopting a systems biology approach, the toolkit provides a wide range of methods that statistically integrate several data sets at once to probe relationships between heterogeneous 'omics data sets. Our recent methods extend Projection to Latent Structure (PLS) models for discriminant analysis, for data integration across multiple 'omics data or across independent studies, and for the identification of molecular signatures. We illustrate our latest mixOmics integrative frameworks for the multivariate analyses of 'omics data available from the package.
Overview
The claims and statistics of this paper haven’t been checked yet.
Free: it reads the open-access text and checks the first 5 claims that cite a source we can check. Create a free account to check every claim.
Integrity signals
Registry
Cites
Statistics
Figures



Verification
Claims the paper makes
The claims and statistics of this paper haven’t been checked yet.
Free: it reads the open-access text and checks the first 5 claims that cite a source we can check. Create a free account to check every claim.
Self-check
Percentages, sums and reported differences re-computed from the paper’s own numbers.
The self-check needs the paper’s full text.
Citations
Cites
R: A Language and Environment for Statistical Computing
R Core Team (2025) · doi:10.32614/r.manuals · Cited by 352,181
Regression shrinkage and selection via the lasso
Tibshirani, R. (1996) · Journal of the Royal Statistical Society Series B: Statistical Methodology · doi:10.1111/j.2517-6161.1996.tb02080.x · Cited by 51,482 · cited 1×
“Feature selection is performed via l1 regularisation (LASSO, [27]), which is implemented into each method’s statistical criterion to be optimised.”
MethodRegularization Paths for Generalized Linear Models via Coordinate Descent
Friedman, J., Hastie, T., & Tibshirani, R. (2010) · Journal of Statistical Software · doi:10.18637/jss.v033.i01 · Cited by 19,927 · cited 1×
“glmnet, [38], PMA, [39]), mixOmics uses soft-thresholding to improve usability by replacing the l(1) parameter by the number keepX of features to select on each dimension.”
MethodEnterotypes of the human gut microbiome
MetaHIT Consortium (additional members), Arumugam, M., Raes, J., Pelletier, E., Le Paslier, D., Yamada, T., Mende, D. R., Fernandes, G. R., Tap, J., Bruls, T., et al. (2011) · Nature · doi:10.1038/nature09944 · Cited by 7,548
Partial least squares for discrimination
Barker, M., & Rayens, W. (2003) · Journal of Chemometrics · doi:10.1002/cem.785 · Cited by 2,841
Khan, J., Wei, J. S., Ringnér, M., Saal, L. H., Ladanyi, M., Westermann, F., Berthold, F., Schwab, M., Antonescu, C. R., Peterson, C., et al. (2001) · Nature Medicine · doi:10.1038/89044 · Cited by 2,644 · cited 2×
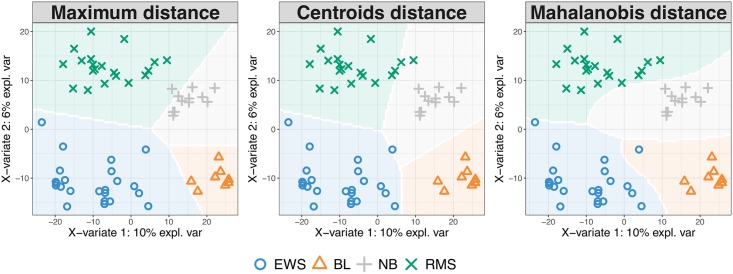
“The study investigates Small Round Blue Cell Tumors (SRBCT, [35]) of 63 tumour samples with the expression levels of 2,308 genes.”
BackgroundMethodLê Cao, K.-A., Boitard, S., & Besse, P. (2011) · BMC Bioinformatics · doi:10.1186/1471-2105-12-253 · Cited by 1,007 · cited 3×
“In single ‘omics analyses this distance achieves best accuracy when the predicted values are close to 0 or 1 [10].”
BackgroundMethodInfluentialPlankton networks driving carbon export in the oligotrophic ocean
Guidi, L., Chaffron, S., Bittner, L., Eveillard, D., Larhlimi, A., Roux, S., Darzi, Y., Audic, S., Berline, L., Brum, J. R., et al. (2016) · Nature · doi:10.1038/nature16942 · Cited by 870 · cited 1×
“(2016), Table 3 and factomineR Husson et al. (2017)). However, very few methods propose feature selection, including sparse CCA (pma package Witten et al. (2013)), sparse PLS (spls package, Chung et al.”
MethodTumor classification by partial least squares using microarray gene expression data
Nguyen, D. V., & Rocke, D. M. (2002) · Bioinformatics · doi:10.1093/bioinformatics/18.1.39 · Cited by 816 · cited 1×
“The assessment is data-driven and similar to the process detailed in Rohart et al. (2016), where one-sided t-tests assess whether there is a gain in performance when adding components to the model.”
MethodPath Models with Latent Variables: The NIPALS Approach
WOLD, H. (1975) · Quantitative Sociology · doi:10.1016/b978-0-12-103950-9.50017-4 · Cited by 802 · cited 1×
“Unsupervised analyses methods include Principal Component Analysis—based on NonLinear Iterative Partial Least Squares for missing values [18], Independent Component Analysis [19], Partial Least Squares regression—PLS, also known as Projection to Latent Structures [20], multi-group PLS [21], regularised Canonical Corre…”
Method
Research works printed but not linked: 3
- A Singh, 2016, DIABLO-an integrative, multi-omics, multivariate method for multi-group classification, bioRxiv, 067611
- F Rohart, 2017, MINT: A multivariate integrative approach to identify a reproducible biomarker signature across multiple experiments and platforms, BMC Bioinformatics, 18
- H Wold, 1966, Estimation of principal components and related models by iterative least squares, J Multivar Anal, 391
Cited by
Items 401–500 of 1,013
Aitken, E. H., Damelang, T., Ortega-Pajares, A., Alemu, A., Hasang, W., Dini, S., Unger, H. W., Ome‐Kaius, M., Nielsen, M. A., Salanti, A., et al. (2021) · eLife · doi:10.7554/elife.65776 · Cited by 50
“The PLSDA method was implemented via the PLS package (Mevik and Wehrens, 2007), and some visualizations of the results of the PLSDA method were carried out using the mixOmics package (Rohart et al., 2017).”
MethodZhang, X., Monnoye, M., Mariadassou, M., Béguet-Crespel, F., Lapaque, N., Heberden, C., & Douard, V. (2021) · Frontiers in Immunology · doi:10.3389/fimmu.2021.742584 · Cited by 54
“Pro-inflammatory cytokine gene expression levels (TNFa, IL13, Il22, and IFNg) and normalized bacterial abundance (52) were integrated and analyzed using Data Integration Analysis for Biomarker discovery using a Latent cOmponents (DIABLO) method implemented in R mixOmics package (53).”
MethodMulti-element analysis of tyre rubber for metal tracers
O'Loughlin, D. P., Haugen, M. J., Day, J., Brown, A. S., Braysher, E. C., Molden, N., Willis, A. E., MacFarlane, M., & Boies, A. (2023) · Environment International · doi:10.1016/j.envint.2023.108047 · Cited by 56
Integrative approaches to enhance reproductive resilience of crops for climate-proof agriculture
COST, R. (2024) · Plant Stress · doi:10.1016/j.stress.2024.100704 · Cited by 59
IntLIM: integration using linear models of metabolomics and gene expression data
Siddiqui, J., Baskin, E., Liu, M., Cantemir-Stone, C. Z., Zhang, B., Bonneville, R., McElroy, J. P., Coombes, K. R., & Mathé, E. A. (2018) · BMC Bioinformatics · doi:10.1186/s12859-018-2085-6 · Cited by 58
Vrieling, F., Kostidis, S., Spaink, H. P., Haks, M. C., Mayboroda, O. A., Ottenhoff, T. H. M., & Joosten, S. A. (2020) · Scientific Reports · doi:10.1038/s41598-020-62911-1 · Cited by 58
Kulasinghe, A., Monkman, J. H., Shah, E. T., Matigian, N., Adams, M. N., & O'Byrne, K. J. (2022) · Frontiers in Oncology · doi:10.3389/fonc.2021.798296 · Cited by 51
Review of multi-omics data resources and integrative analysis for human brain disorders
Dong, X., Liu, C., & Dozmorov, M. (2021) · Briefings in Functional Genomics · doi:10.1093/bfgp/elab024 · Cited by 47
Kotova, A. V., Lobov, A. A., Dombrovskaya, Y. A., Sannikova, V. Y., Ryumina, N. A., Klausen, P., Shavarda, A. L., Malashicheva, A., & Enukashvily, N. I. (2021) · Biomedicines · doi:10.3390/biomedicines9111606 · Cited by 53
“Finally, we performed ordination of samples by principal component analysis and classification of samples by sparse partial least squares discriminant analysis in the package “MixOmics” [29].”
MethodThe hitchhikers’ guide to RNA sequencing and functional analysis
Chen, J.-W., Shrestha, L., Green, G. A., Leier, A., & Marquez‐Lago, T. T. (2023) · Briefings in Bioinformatics · doi:10.1093/bib/bbac529 · Cited by 56
Bajic, D., Wiens, F., Wintergerst, E., Deyaert, S., Baudot, A., & den Abbeele, P. V. (2023) · Nutrients · doi:10.3390/nu15071701 · Cited by 48
“org; accessed on 26 December 2022) [47].”
Siegerstetter, S.-C., Petri, R. M., Magowan, E. A., Lawlor, P. G., Zebeli, Q., O’Connell, N. E., & Metzler-Zebeli, B. U. (2018) · Frontiers in Microbiology · doi:10.3389/fmicb.2018.02698 · Cited by 48
“3) in R studio (Rohart et al., 2017) to integrate data of relative bacterial abundances at 16 and 29 dph with results for RFI, performance traits (TFI and TBWG between 9 and 14 dph and between 9 and 30 dph, respectively), and nutrient retention.”
MethodAn Integrated Global Analysis of Compartmentalized HRAS Signaling
Santra, T., Herrero, A., Rodríguez, J., von Kriegsheim, A., Iglesias-Martinez, L. F., Schwarzl, T., Higgins, D. G., Aye, T., Heck, A. J. R., Calvo, F., et al. (2019) · Cell Reports · doi:10.1016/j.celrep.2019.02.038 · Cited by 49
Uarrota, V. G., Fuentealba, C., Hernández, I., Defilippi-Bruzzone, B., Meneses, C., Campos-Vargas, R., Lurie, S., Hertog, M., Carpentier, S., Poblete-Echeverría, C., et al. (2019) · Food Chemistry · doi:10.1016/j.foodchem.2019.03.090 · Cited by 47
Quick microbial molecular phenotyping by differential shotgun proteomics
Gouveia, D., Grenga, L., Pible, O., & Armengaud, J. (2020) · Environmental Microbiology · doi:10.1111/1462-2920.14975 · Cited by 48
Winkelmüller, T. M., Entila, F. D., Anver, S., Piasecka, A., Song, B., Dahms, E., Sakakibara, H., Gan, X., Kułak, K., Sawikowska, A., et al. (2021) · The Plant Cell · doi:10.1093/plcell/koab073 · Cited by 51
Lyu, Z., Ghoshdastidar, S., Rekha, K. R., Suresh, D., Mao, J., Bivens, N. J., Kannan, R., Joshi, T., Rosenfeld, C. S., & Upendran, A. (2021) · Scientific Reports · doi:10.1038/s41598-021-85919-7 · Cited by 48
Van den Abbeele, P., Deyaert, S., Albers, R., Baudot, A., & Mercenier, A. (2023) · Nutrients · doi:10.3390/nu15092090 · Cited by 46
“org, accessed on 23 November 2022) [37].”
Stewart, D. B., Wright, J., Fowler, M., McLimans, C. J., Tokarev, V., Amaniera, I., Baker, O. R., Wong, H. T., Brabec, J. L., Drucker, R., et al. (2019) · mSphere · doi:10.1128/msphere.00454-19 · Cited by 48
“Partial least-squares discriminant analysis (PLS-DA) and complementary receiver operating characteristic (ROC) curve plotting was performed considering CPM-normalized KO metagenome and metatranscriptome data using the mixOmics R package (36).”
MethodYan, T., Shi, L. S., Liu, T., Zhang, X., Yang, M., Peng, W., Sun, X., Yan, L. L., Dai, X., & Yang, X. (2022) · Food Research International · doi:10.1016/j.foodres.2022.112179 · Cited by 50
Ten quick tips for avoiding pitfalls in multi-omics data integration analyses
Chicco, D., Cumbo, F., & Angione, C. (2023) · PLoS Computational Biology · doi:10.1371/journal.pcbi.1011224 · Cited by 53
“Examples of effective multi-omics integration tools are mixOmics [3] in R and INTEGRATE [4] in Python.”
BackgroundMethodA conserved complex lipid signature marks human muscle aging and responds to short-term exercise
Janssens, G. E., Molenaars, M., Herzog, K., Grevendonk, L., Remie, C. M. E., Vervaart, M. A. T., Elfrink, H. L., Wever, E. J. M., Schomakers, B. V., Denis, S. W., et al. (2024) · Nature Aging · doi:10.1038/s43587-024-00595-2 · Cited by 48
Ahmad, F., & Muhmood, T. (2024) · Colloids and Surfaces B Biointerfaces · doi:10.1016/j.colsurfb.2024.114041 · Cited by 47
Wu, W., Zhang, L., Xia, B., Tang, S., Liu, L., Xie, J., & Zhang, H. (2020) · Microorganisms · doi:10.3390/microorganisms8010111 · Cited by 45
Hermann, S., Brandes, F., Kirchner, B., Buschmann, D., Borrmann, M., Klein, M., Kotschote, S., von Bonin, M., Reithmair, M., Kaufmann, I., et al. (2020) · Journal of Cellular and Molecular Medicine · doi:10.1111/jcmm.15837 · Cited by 52
Muñoz–Redondo, J. M., Bertoldi, D., Tonon, A., Ziller, L., Camin, F., & Moreno‐Rojas, J. M. (2021) · Food Control · doi:10.1016/j.foodcont.2021.107961 · Cited by 47
Clinical protein science in translational medicine targeting malignant melanoma
Gil, J., Betancourt, L. H., Pla, I., Sanchez, A., Appelqvist, R., Miliotis, T., Kuras, M., Oskolas, H., Kim, Y., Horvath, Z., et al. (2019) · Cell Biology and Toxicology · doi:10.1007/s10565-019-09468-6 · Cited by 45
“Examples of such methods are Multiview Nonnegative Matrix Factorization Algorithm (Ray et al. 2017), Joint Non-negative Matrix Factorization (Zhang et al. 2012; Zhang et al. 2011) and mixOmics R package (Rohart et al. 2017).”
MethodAlisoltani, A., Manhanzva, M. T., Potgieter, M. G., Balle, C., Bell, L., Ross, E. J., Iranzadeh, A., du Plessis, M., Radzey, N., McDonald, Z., et al. (2020) · Microbiome · doi:10.1186/s40168-020-00932-8 · Cited by 57
“The effects of BV, STIs and chemokine and pro-inflammatory cytokine profiles on the metaproteome 5 were investigated by PCA using the mixOmics R package [37].”
MethodPANOMICS at the interface of root–soil microbiome and BNI
Ghatak, A., Chaturvedi, P., Waldherr, S., Subbarao, G. V., & Weckwerth, W. (2022) · Trends in Plant Science · doi:10.1016/j.tplants.2022.08.016 · Cited by 49
Pathobionts from chemically disrupted gut microbiota induce insulin-dependent diabetes in mice
Yang, X., Wang, Z., Niu, J., Zhai, R., Xue, X., Wu, G. G., Fang, Y., Meng, G., Yuan, H., Zhao, L., et al. (2023) · Microbiome · doi:10.1186/s40168-023-01507-z · Cited by 51
Multi-omics integration and epilepsy: Towards a better understanding of biological mechanisms
Chong, D., Jones, N. C., Schittenhelm, R. B., Anderson, A., & Casillas-Espinosa, P. M. (2023) · Progress in Neurobiology · doi:10.1016/j.pneurobio.2023.102480 · Cited by 52
Gupta, S. K., Maclean, P. H., Ganesh, S., Shu, D., Buddle, B. M., Wedlock, D. N., & Heiser, A. (2018) · Journal of Dairy Science · doi:10.3168/jds.2018-14785 · Cited by 52
Gontijo, L. M., Cascone, P., Giorgini, M., Michelozzi, M., Rodrigues, H. S., Spiezia, G., Iodice, L., & Guerrieri, E. (2019) · Journal of Pest Science · doi:10.1007/s10340-019-01091-y · Cited by 45
Rosenfeld, C. S. (2019) · Frontiers in Nutrition · doi:10.3389/fnut.2019.00142 · Cited by 51
Muñoz–Redondo, J. M., Ruiz‐Moreno, M. J., Puertas, B., Cantos‐Villar, E., & Moreno‐Rojas, J. M. (2019) · Talanta · doi:10.1016/j.talanta.2019.120483 · Cited by 46
Discrimination of honey and syrup-based adulteration by mineral element chemometrics profiling
Liu, T., Kang, M., Wang, W., Qiao, N., Qiu, S., Yi, S., Huang, X., & Luo, L. (2020) · Food Chemistry · doi:10.1016/j.foodchem.2020.128455 · Cited by 46
An acetate‐yielding diet imprints an immune and anti‐microbial programme against enteric infection
Yap, Y. A., McLeod, K. H., McKenzie, C. I., Gavin, P. G., Dávalos-Salas, M., Richards, J. L., Moore, R. J., Lockett, T. J., Clarke, J. M., Eng, V. V., et al. (2021) · Clinical & Translational Immunology · doi:10.1002/cti2.1233 · Cited by 48
DIABLO: from multi-omics assays to biomarker discovery, an integrative approach
Singh, A., Shannon, C. P., Gautier, B., Rohart, F., Vacher, M., Tebbutt, S. J., & Lê Cao, K.-A. (2016) · bioRxiv (Cold Spring Harbor Laboratory) · doi:10.1101/067611 · Cited by 45
Self-citationDill‐McFarland, K. A., Altman, M. C., Esnault, S. J., Jarjour, N. N., Busse, W. W., & Rosenkranz, M. A. (2023) · Journal of Allergy and Clinical Immunology · doi:10.1016/j.jaci.2023.07.025 · Cited by 48
Andreani, N. A., Sharma, A., Dahmen, B., Specht, H. E., Mannig, N., Ruan, V., Keller, L., Baines, J. F., Herpertz‐Dahlmann, B., Dempfle, A., et al. (2024) · Gut Microbes · doi:10.1080/19490976.2024.2304158 · Cited by 51
Synthetic augmentation of cancer cell line multi-omic datasets using unsupervised deep learning
Cai, Z., Apolinário, S., Baião, A. R., Pacini, C., Sousa, M. D., Vinga, S., Reddel, R. R., Robinson, P. J., Garnett, M. J., Zhong, Q., et al. (2024) · Nature Communications · doi:10.1038/s41467-024-54771-4 · Cited by 53
“…multi-omics integration methods (Supplementary Data 6, see Methods), but due to constraints such as the number of omics supported, type of data distribution, and limitations in design and implementation, we were narrowed to three state-of-the-art methods: MOFA 10,14 , MOVE 32 , and mixOmics 35,36 .”
Podany, A., Rauchut, J., Wu, T., Kawasawa, Y. I., Wright, J., Lamendella, R., Soybel, D. I., & Kelleher, S. L. (2019) · Molecular Nutrition & Food Research · doi:10.1002/mnfr.201800947 · Cited by 43
Weissman, J., Laljani, R. M. R., Fagan, W. F., & Johnson, P. L. F. (2019) · The ISME Journal · doi:10.1038/s41396-019-0411-2 · Cited by 47
Ruczizka, U., Metzler-Zebeli, B. U., Unterweger, C., Mann, E., Schwarz, L., Knecht, C., & Hennig‐Pauka, I. (2019) · Animals · doi:10.3390/ani10010017 · Cited by 45
“0; [26]) to integrate data of families (>0.”
BackgroundDissection of the domestication‐shaped genetic architecture of lettuce primary metabolism
Zhang, W., Alseekh, S., Zhu, X., Zhang, Q., Fernie, A. R., Kuang, H., & Wen, W. (2020) · The Plant Journal · doi:10.1111/tpj.14950 · Cited by 44
Kim, A. R., Choi, K. S., Kim, S. K., Kim, K., Kang, H. J., Kim, S., Chowdhury, T., Yu, H. J., Lee, C. E., Lee, J. H., et al. (2021) · Cancer Immunology Immunotherapy · doi:10.1007/s00262-020-02836-w · Cited by 44
Lumacaftor/ivacaftor changes the lung microbiome and metabolome in cystic fibrosis patients
Neerincx, A. H., Whiteson, K., Phan, J. L., Brinkman, P., Abdel‐Aziz, M. I., Weersink, E. J. M., Altenburg, J., Majoor, C. J., der Zee, A. H. M., & Bos, L. D. J. (2021) · ERJ Open Research · doi:10.1183/23120541.00731-2020 · Cited by 52
“The most important changes in metabolomics data were identified using sparse partial least square discriminant analysis (sPLS-DA) via the mixOmics package [24, 25] after principal components analysis was used for outlier detection.”
Acetaminophen metabolism revisited using non-targeted analyses: Implications for human biomonitoring
David, A., Chaker, J., Léger, T., Al-Salhi, R., Dalgaard, M., Styrishave, B., Bury, D., Koch, H. M., Jégou, B., & Kristensen, D. M. (2021) · Environment International · doi:10.1016/j.envint.2021.106388 · Cited by 47
Schulz, E., Tohge, T., Winkler, J. B., Albert, A., Schäffner, A. R., Fernie, A. R., Zuther, E., & Hincha, D. K. (2021) · Plant and Cell Physiology · doi:10.1093/pcp/pcab013 · Cited by 54
STATegra: Multi-Omics Data Integration – A Conceptual Scheme With a Bioinformatics Pipeline
Planell, N., Lagani, V., Sebastián-León, P., van der Kloet, F. M., Ewing, E., Karathanasis, N., Urdangarin, A., Arozarena, I., Jagodic, M., Tsamardinos, I., et al. (2021) · Frontiers in Genetics · doi:10.3389/fgene.2021.620453 · Cited by 51
Transcriptomics and Other Omics Approaches to Investigate Effects of Xenobiotics on the Placenta
Rosenfeld, C. S. (2021) · Frontiers in Cell and Developmental Biology · doi:10.3389/fcell.2021.723656 · Cited by 43
timeOmics: an R package for longitudinal multi-omics data integration
Bodein, A., Scott‐Boyer, M., Périn, O., Cao, K. L., & Droit, A. (2021) · Bioinformatics · doi:10.1093/bioinformatics/btab664 · Cited by 43
Greenbaum, J., Xu, L., Su, K., Gong, R., Shen, H., Shen, J., Xiao, H., & Deng, H. (2022) · Frontiers in Cellular and Infection Microbiology · doi:10.3389/fcimb.2022.853499 · Cited by 48
Omics-based ecosurveillance for the assessment of ecosystem function, health, and resilience
Beale, D. J., Jones, O. A. H., Bose, U., Broadbent, J. A., Walsh, T. K., van de Kamp, J., & Bissett, A. (2022) · Emerging Topics in Life Sciences · doi:10.1042/etls20210261 · Cited by 46
Fawaz, A., Ferraresi, A., & Isidoro, C. (2023) · Journal of Personalized Medicine · doi:10.3390/jpm13111590 · Cited by 54
“PLS-DA might have an over fi tt ing issue too, like other data mining techniques, so it needs thorough validation, frequently performed through cross-validation [26].”
BackgroundCell-cycle-linked growth reprogramming encodes developmental time into leaf morphogenesis
Li, X., Jenke, H., Strauss, S., Bazakos, C., Mosca, G., Lymbouridou, R., Kierzkowski, D., Neumann, U., Naik, P., Huijser, P., et al. (2024) · Current Biology · doi:10.1016/j.cub.2023.12.050 · Cited by 45
Conde‐Pérez, K., Aja‐Macaya, P., Buetas, E., Trigo‐Tasende, N., Nasser‐Ali, M., Rumbo‐Feal, S., Nión, P., Arribas, E. M., Estévez, L. S., Otero‐Alén, B., et al. (2024) · Molecular Oncology · doi:10.1002/1878-0261.13604 · Cited by 48
“To elucidate the associations of oral bacteria in tumors a multivariate analysis (sPLS-canonical) from the MIXOMICS R package was applied using the normalized dataset of all bacterial counts from the tissue sample and a subset of the oral-associated bacteria present in the samples [66].”
MethodPathIntegrate: Multivariate modelling approaches for pathway-based multi-omics data integration
Wieder, C., Cooke, J., Frainay, C., Poupin, N., Bowler, R. P., Jourdan, F., Kechris, K. J., Lai, R., & Ebbels, T. M. D. (2024) · PLoS Computational Biology · doi:10.1371/journal.pcbi.1011814 · Cited by 50
Borah, K., Das, H. S., Seth, S., Mallick, K., Rahaman, Z., & Mallik, S. (2024) · Functional & Integrative Genomics · doi:10.1007/s10142-024-01415-x · Cited by 55
Madrid-Gambín, F., Föcking, M., Sabherwal, S., Heurich, M., English, J. A., O’Gorman, A., Suvitaival, T., Ahonen, L. L., Cannon, M. D., Lewis, G., et al. (2019) · Biological Psychiatry · doi:10.1016/j.biopsych.2019.01.018 · Cited by 49
“Regularized canonical correlation analysis was performed on all individuals as an integrative multivariate approach to assess correlations between both lipidomics and proteomics data using the mixOmics R package v 5.2.0 (40).”
InfluentialMetatranscriptomic Analysis of Sub-Acute Ruminal Acidosis in Beef Cattle
Ogunade, I. M., Pech-Cervantes, A. A., & Schweickart, H. (2019) · Animals · doi:10.3390/ani9050232 · Cited by 48
“Partial least squares discriminant analysis (PLS-DA) was performed on the CPM normalized KEGG metatranscriptomic data and bacterial relative abundance data using the mixOmics R package [19].”
MethodJorge, T. F., Tohge, T., Wendenburg, R., Ramalho, J. C., Lidon, F. C., Ribeiro-Barros, A. I., Fernie, A. R., & António, C. (2019) · Environmental and Experimental Botany · doi:10.1016/j.envexpbot.2019.103808 · Cited by 44
Microbial diversity and activity assessment in a 100-year-old lead mine
Gallego, S., Esbrí, J. M., Campos, J. A., Peco, J. D., Martin-Laurent, F. A., & Higueras, P. (2020) · Journal of Hazardous Materials · doi:10.1016/j.jhazmat.2020.124618 · Cited by 48
Vandewalle, V., Essaghir, A., Bollaert, E., Lenglez, S., Graux, C., Schoemans, H. M., Saussoy, P., Michaux, L., Valk, P. J. M., Demoulin, J., et al. (2020) · Journal of Cellular and Molecular Medicine · doi:10.1111/jcmm.16110 · Cited by 44
CSF SERPINA3 Levels Are Elevated in Patients With Progressive MS
Fissolo, N., Matute-Blanch, C., Osman, M., Costa, C., Pinteac, R., Miró, B., Sanchez, A., Brito, V., Dujmovic, I., Voortman, M., et al. (2021) · Neurology Neuroimmunology & Neuroinflammation · doi:10.1212/nxi.0000000000000941 · Cited by 40
“In this regard, omics integration analyses have been developed to analyze large amounts of biological data to identify molecular signatures across multiple data sets.(19)”
Multi-omics subtyping pipeline for chronic obstructive pulmonary disease
Gillenwater, L. A., Helmi, S., Stene, E., Pratte, K., Zhuang, Y., Schuyler, R. P., Lange, L. A., Castaldi, P. J., Hersh, C. P., Banaei‐Kashani, F., et al. (2021) · PLoS ONE · doi:10.1371/journal.pone.0255337 · Cited by 47
“Of the parallel methods, mixOmics [18] is the most similar system to the one used in this study, and provides a number of methods to integrate -omics, including PCA, PLS, and CCA.”
MethodCharacterising Alzheimer's disease through integrative NMR- and LC-MS-based metabolomics
Nielsen, J. E., Maltesen, R. G., Havelund, J. F., Færgeman, N. J., Gotfredsen, C. H., Vestergård, K., Kristensen, S. R., & Pedersen, S. (2021) · Metabolism Open · doi:10.1016/j.metop.2021.100125 · Cited by 46
Artificial selection of stable rhizosphere microbiota leads to heritable plant phenotype changes
Jacquiod, S., Spor, A., Wei, S., Munkager, V., Bru, D., Sørensen, S. J., Salon, C., Philippot, L., & Blouin, M. (2021) · Ecology Letters · doi:10.1111/ele.13916 · Cited by 51
Alterations in the Gut Fungal Community in a Mouse Model of Huntington’s Disease
Kong, G., Cao, K. L., & Hannan, A. J. (2022) · Microbiology Spectrum · doi:10.1128/spectrum.02192-21 · Cited by 46
“To identify the associations between the gut bacteriome and mycobiome that were altered in HD, CLR-transformed fungal and bacterial data sets were integrated using the DIABLO framework from the mixOmics package in a supervised analysis (94, 98).”
MethodFurber, M., Young, G. R., Holt, G. S., Pyle, S., Davison, G., Roberts, M. G., Roberts, J., Howatson, G., & Smith, D. (2022) · mSystems · doi:10.1128/msystems.00129-22 · Cited by 53
“Phyloseq (66), mixOmics (67) and ggplot2 (33) packages were used to visualize data.”
MethodKobak, D., Lomond, J., & Sanchez, B. (2018) · arXiv (Cornell University) · doi:10.48550/arxiv.1805.10939 · Cited by 56
“We used the liver.toxicity dataset [BWG07] from the R package mixOmics [RGSLC17] to demonstrate the phenomenon.”
MethodMetabolic Fate of Dietary Glucosinolates and Their Metabolites: A Role for the Microbiome
Bouranis, J. A., Beaver, L. M., & Ho, E. (2021) · Frontiers in Nutrition · doi:10.3389/fnut.2021.748433 · Cited by 46
Network-based integration of multi-omics data for clinical outcome prediction in neuroblastoma
Wang, C., Lue, W., Kaalia, R., Kumar, P., & Rajapakse, J. C. (2022) · Scientific Reports · doi:10.1038/s41598-022-19019-5 · Cited by 50
Multi‐omic and spatial dissection of immunotherapy response groups in non‐small cell lung cancer
Monkman, J. H., Kim, H., Mayer, A. T., Mehdi, A. M., Matigian, N., Cumberbatch, M., Bhagat, M., Ladwa, R., Mueller, S. N., Adams, M. N., et al. (2023) · Immunology · doi:10.1111/imm.13646 · Cited by 45
“The most predictive or discriminative signatures classifying ICI response were developed using sparse partial least squares-discriminant analysis (sPLS-DA) [28].”
MethodZhang, Y., Zheng, T., Ma, D., Shi, P., Zhang, H., Li, J., & Sun, Z. (2023) · mSystems · doi:10.1128/msystems.00331-23 · Cited by 46
Phylogenomics reveals the evolutionary origins of lichenization in chlorophyte algae
Puginier, C., Libourel, C., Juergen, O., Škaloud, P., Haon, M., Grisel, S., Petersen, M., Berrin, J., Delaux, P., Grande, F. D., et al. (2024) · Nature Communications · doi:10.1038/s41467-024-48787-z · Cited by 48
Wanichthanarak, K., Jeamsripong, S., Pornputtapong, N., & Khoomrung, S. (2019) · Computational and Structural Biotechnology Journal · doi:10.1016/j.csbj.2019.04.009 · Cited by 42
“The mixOmics package [34] was applied for PLS-DA and multilevel-based PLS-DA.”
Characterisation and functional predictions of canine long non-coding RNAs
Béguec, C. L., Wucher, V., Lagoutte, L., Cadieu, É., Botherel, N., Hédan, B., Brito, C. D., Guillory, A.-S., André, C., Derrien, T., et al. (2018) · Scientific Reports · doi:10.1038/s41598-018-31770-2 · Cited by 48
Mangeot-Peter, L., Tschaplinski, T. J., Engle, N. L., Veneault‐Fourrey, C., Martin, F. M., & Deveau, A. (2020) · Phytobiomes Journal · doi:10.1094/pbiomes-08-19-0042-r · Cited by 42
Li, Y., Yang, X., Zhang, J., Jiang, T., Zhang, Z., Wang, Z., Gong, M., Zhao, L., & Zhang, C. (2021) · mBio · doi:10.1128/mbio.03601-20 · Cited by 48
“2) package (52) in R to identify the discriminative ASVs between different groups (NCR and KDR, NCH and KDH, and KDR and KDH).”
BackgroundHildebrandt, A., Kirchner, B., Meidert, A. S., Brandes, F., Lindemann, A., Doose, G., Doege, A., Weidenhagen, R., Reithmair, M., Schelling, G., et al. (2021) · Frontiers in Cell and Developmental Biology · doi:10.3389/fcell.2021.729061 · Cited by 49
Gubert, C., Love, C. J., Kodikara, S., Mei Liew, J. J., Renoir, T., Lê Cao, K.-A., & Hannan, A. J. (2022) · iScience · doi:10.1016/j.isci.2021.103687 · Cited by 41
Sisay, B., Subramanian, S., Weldon, C. W., Krüger, K., Torto, B., & Tamiru, A. (2022) · Pest Management Science · doi:10.1002/ps.7255 · Cited by 45
Li, Z., Xian, H., Ye, R., Zhong, Y., Liang, B., Huang, Y., Dai, M., Guo, J. Z., Tang, S., Ren, X., et al. (2024) · The Science of The Total Environment · doi:10.1016/j.scitotenv.2024.172876 · Cited by 41
Bachem, A., Clarke, M. V., Kong, G., Tarasova, I., Dryburgh, L., Kosack, L., Lee, A. R., Newland, L. G. M., Wagner, T., Bawden, E., et al. (2025) · Immunity · doi:10.1016/j.immuni.2025.10.004 · Cited by 51
Consistency and overfitting of multi-omics methods on experimental data
McCabe, S. D., Lin, D.-Y., & Love, M. I. (2020) · Briefings in Bioinformatics · doi:10.1093/bib/bbz070 · Cited by 42
Anderegg, J., Hund, A., Karisto, P., & Mikaberidze, A. (2019) · Frontiers in Plant Science · doi:10.3389/fpls.2019.01355 · Cited by 45
Introducing PIONEER: a project to harness big data in prostate cancer research
Omar, M. I., Roobol, M. J., Ribal, M. J., Abbott, T., Agapow, P., Araujo, S., Asiimwe, A., Auffray, C., Balaur, I., Beyer, K., et al. (2020) · Nature Reviews Urology · doi:10.1038/s41585-020-0324-x · Cited by 44
Ng, L. T., Ng, L. F., Tang, R. M. Y., Barardo, D., Halliwell, B. B., Moore, P. K., & Gruber, J. (2020) · npj Aging and Mechanisms of Disease · doi:10.1038/s41514-020-0044-8 · Cited by 48
Kritikou, A. S., Aalizadeh, R., Damalas, D. Ε., Barla, I., Baessmann, C., & Τhomaidis, Ν. S. (2021) · Food Chemistry · doi:10.1016/j.foodchem.2021.131057 · Cited by 43
Macandog, A. D. G., Catozzi, C., Capone, M., Nabinejad, A., Nanaware, P. P., Liu, S., Vinjamuri, S., Stunnenberg, J. A., Galiè, S., Jodice, M. G., et al. (2024) · Cell Host & Microbe · doi:10.1016/j.chom.2024.10.006 · Cited by 40
“94 Briefly, an offset of 1 was added to the raw counts, low-frequency OTUs with an overall abundance of 0.01% were filtered out, and outlier samples with library size greater than 2x10 5 were removed.”
InfluentialYamauchi, M., Ono, A., Amioka, K., Fujii, Y., Nakahara, H., Teraoka, Y., Uchikawa, S., Fujino, H., Nakahara, T., Murakami, E., et al. (2023) · Communications Medicine · doi:10.1038/s43856-023-00390-x · Cited by 45
“Data integration across different omics sources was performed using the mixOmics platform 22,23 .”
BackgroundMethodRönn, T., Perfilyev, A., Oskolkov, N., & Ling, C. (2024) · Scientific Reports · doi:10.1038/s41598-024-64846-3 · Cited by 44
“There are several possible Machine Learning methods for Omics integration to choose from, e.g. the linear Partial Least Squares (PLS) 17 via the Data Integration Analysis for Biomarker discovery using Latent cOmponents (DIABLO) algorithm 18 or O2PLS 19 , as well as the non-linear Bayesian Networks…”
MethodTillett, B. J., Dwiyanto, J., Secombe, K. R., George, T., Zhang, V., Anderson, D., Duggan, E., Giri, R., Loo, D., Stoll, T., et al. (2025) · Nature Communications · doi:10.1038/s41467-025-58319-y · Cited by 48
“23.2) 73 .”
InfluentialMulti-omics based and AI-driven drug repositioning for epigenetic therapy in female malignancies
Salvati, A., Melone, V., Giordano, A., Lamberti, J., Palumbo, D., Palo, L., Rea, D., Memoli, D., Simonis, V., Alexandrova, E., et al. (2025) · Journal of Translational Medicine · doi:10.1186/s12967-025-06856-x · Cited by 45
Multi-Omics Insights into Functional Alterations of the Liver in Insulin-Deficient Diabetes Mellitus
Backman, M., Flenkenthaler, F., Blutke, A., Dahlhoff, M., Ländström, E., Renner, S., Philippou‐Massier, J., Krebs, S., Rathkolb, B., Prehn, C. P., et al. (2018) · Molecular Metabolism · doi:10.1016/j.molmet.2019.05.011 · Cited by 47
Dynamic transcriptomic changes of goat abomasal mucosa in response to Haemonchus contortus infection
Aboshady, H. M., Mandonnet, N., Félicité, Y., Hira, J., Fourcot, A., Barbier, C., Johansson, A. M., Jonas, E., & Bambou, J. (2020) · Veterinary Research · doi:10.1186/s13567-020-00768-y · Cited by 41
Junges, A. H., Almança, M. A. K., Fajardo, T. V. M., & Ducati, J. R. (2020) · Tropical Plant Pathology · doi:10.1007/s40858-020-00387-0 · Cited by 40
Cai, Z., Zhang, J., He, Y., Xia, L., Dong, X., Chen, G., Zhou, Y., Hu, X., Zhong, S., Wang, Y., et al. (2021) · ESMO Open · doi:10.1016/j.esmoop.2020.100021 · Cited by 41
Lee, C.-T., Li, R., Zhu, L., Tribble, G. D., Zheng, W. J., Ferguson, B., Maddipati, K. R., Angelov, N., & Dyke, T. E. V. (2021) · Frontiers in Immunology · doi:10.3389/fimmu.2021.691216 · Cited by 43
“The lipid mediator levels, SPM receptor gene expression levels and bacterial abundance were first normalized to zero mean and unit variance, and then integrated and analyzed using Data Integration Analysis for Biomarker discovery using a Latent cOmponents (DIABLO) method implemented in R mixOmics package (28).”
Method
Metadata
- Authors
- Rohart, F., Gautier, B., Singh, A., & Lê Cao, K.-A.
- Affiliations
- Translational Research Institute (AU)
- University of British Columbia (CA)
- Venue
- PLOS Computational Biology
- Publisher
- Public Library of Science (PLoS)
- Published
- 2017-11-03
- Volume
- 13
- Issue
- 11
- Pages
- e1005752
- ISSN
- 1553-734X (ISSN-L)
- 1553-7358
- PMC
- PMC5687754
- OpenAlex
- W2950985821
- Cited by
- 4,056
- References
- 57
- Citations by year
- 2026: 629 · 2025: 612 · 2024: 600 · 2023: 523 · 2022: 496 · 2021: 489 · 2020: 350 · 2019: 241 · 2018: 95 · 2017: 14
- FWCI
- 78.13
- Type
- journal article
- Language
- en
- Update notices
- new_version (2017-11-15)
- Open access
- gold
- doi.org
- Licence
- Locations
- PLoS Computational Biology (publishedVersion, cc-by)
- bioRxiv (Cold Spring Harbor Laboratory) (acceptedVersion, cc-by-nc-nd)
- PubMed Central (publishedVersion, cc-by)
- PubMed (publishedVersion)
- Minerva Access (University of Melbourne) (submittedVersion, cc-by)
- RePEc: Research Papers in Economics (submittedVersion)
- DOAJ (DOAJ: Directory of Open Access Journals) (submittedVersion, cc-by-sa)
- Figshare (submittedVersion, cc-by)
- Funders
- National Health and Medical Research Council (APP1087415)
- Australian Cancer Research Foundation (ACRF) for the Diamantina Individualised Oncology Care Centre
- Topics
- Life Sciences › Biochemistry, Genetics and Molecular Biology › Molecular Biology › Bioinformatics and Genomic Networks
- Life Sciences › Biochemistry, Genetics and Molecular Biology › Molecular Biology › Metabolomics and Mass Spectrometry Studies
- Life Sciences › Biochemistry, Genetics and Molecular Biology › Molecular Biology › Gene expression and cancer classification
- Keywords
- R package, multi-omics integration, feature selection, multivariate analysis, dimensionality reduction, partial least squares regression, discriminant analysis, molecular signatures, systems biology, transcriptomics, proteomics, metabolomics, exploratory data analysis
- MeSH terms
- Data Interpretation, Statistical, Humans, Neoplasms, Software, Computational Biology, Genomics, Systems Biology, Metabolomics
About these checks
Registry, retraction, Cites and statistics results are computed, not judged, with one exception: a printed reference that no index lists is read once by a model before it counts as a citation error. Claims are extracted by a model and kept only when their quote appears verbatim in the text; each cited source is then checked, with a model’s help, for whether it says what the claim relies on. Those verdicts can be wrong — read the claim’s quote and the cited source before relying on one.
Statistics and arithmetic are recomputed, not judged.
Confidence bands are shown only for fields calibrated on our annotated test set. None is calibrated yet, so no band is shown.
What counts as a claim ›How we measure confidence ›How we check this ›
Are you an author, or do you see a problem with this page? Request a review
Data sources
Bibliographic data: Semantic Scholar, OpenAlex, Crossref.
Contains information from the Semantic Scholar Academic Graph Datasets, made available under the ODC Attribution License (ODC-BY 1.0).
Semantic Scholar’s data is described in: Kinney, R., et al. (2023). The Semantic Scholar Open Data Platform. arXiv:2301.10140.
