

mixOmics: An R package for ‘omics feature selection and multiple data integration
Open accessPublished version of a preprint
The DOI matches its Crossref record; 58 of the 58 references it cites were found in a registry or an index.
Abstract
The advent of high throughput technologies has led to a wealth of publicly available 'omics data coming from different sources, such as transcriptomics, proteomics, metabolomics. Combining such large-scale biological data sets can lead to the discovery of important biological insights, provided that relevant information can be extracted in a holistic manner. Current statistical approaches have been focusing on identifying small subsets of molecules (a 'molecular signature') to explain or predict biological conditions, but mainly for a single type of 'omics. In addition, commonly used methods are univariate and consider each biological feature independently. We introduce mixOmics, an R package dedicated to the multivariate analysis of biological data sets with a specific focus on data exploration, dimension reduction and visualisation. By adopting a systems biology approach, the toolkit provides a wide range of methods that statistically integrate several data sets at once to probe relationships between heterogeneous 'omics data sets. Our recent methods extend Projection to Latent Structure (PLS) models for discriminant analysis, for data integration across multiple 'omics data or across independent studies, and for the identification of molecular signatures. We illustrate our latest mixOmics integrative frameworks for the multivariate analyses of 'omics data available from the package.
Overview
The claims and statistics of this paper haven’t been checked yet.
Free: it reads the open-access text and checks the first 5 claims that cite a source we can check. Create a free account to check every claim.
Integrity signals
Registry
Cites
Statistics
Figures



Verification
Claims the paper makes
The claims and statistics of this paper haven’t been checked yet.
Free: it reads the open-access text and checks the first 5 claims that cite a source we can check. Create a free account to check every claim.
Self-check
Percentages, sums and reported differences re-computed from the paper’s own numbers.
The self-check needs the paper’s full text.
Citations
Cites
R: A Language and Environment for Statistical Computing
R Core Team (2025) · doi:10.32614/r.manuals · Cited by 352,181
Regression shrinkage and selection via the lasso
Tibshirani, R. (1996) · Journal of the Royal Statistical Society Series B: Statistical Methodology · doi:10.1111/j.2517-6161.1996.tb02080.x · Cited by 51,482 · cited 1×
“Feature selection is performed via l1 regularisation (LASSO, [27]), which is implemented into each method’s statistical criterion to be optimised.”
MethodRegularization Paths for Generalized Linear Models via Coordinate Descent
Friedman, J., Hastie, T., & Tibshirani, R. (2010) · Journal of Statistical Software · doi:10.18637/jss.v033.i01 · Cited by 19,927 · cited 1×
“glmnet, [38], PMA, [39]), mixOmics uses soft-thresholding to improve usability by replacing the l(1) parameter by the number keepX of features to select on each dimension.”
MethodEnterotypes of the human gut microbiome
MetaHIT Consortium (additional members), Arumugam, M., Raes, J., Pelletier, E., Le Paslier, D., Yamada, T., Mende, D. R., Fernandes, G. R., Tap, J., Bruls, T., et al. (2011) · Nature · doi:10.1038/nature09944 · Cited by 7,548
Partial least squares for discrimination
Barker, M., & Rayens, W. (2003) · Journal of Chemometrics · doi:10.1002/cem.785 · Cited by 2,841
Khan, J., Wei, J. S., Ringnér, M., Saal, L. H., Ladanyi, M., Westermann, F., Berthold, F., Schwab, M., Antonescu, C. R., Peterson, C., et al. (2001) · Nature Medicine · doi:10.1038/89044 · Cited by 2,644 · cited 2×
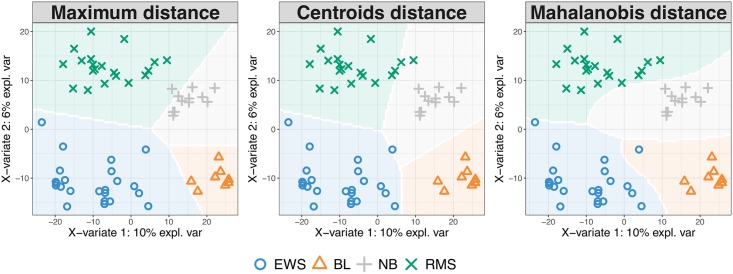
“The study investigates Small Round Blue Cell Tumors (SRBCT, [35]) of 63 tumour samples with the expression levels of 2,308 genes.”
BackgroundMethodLê Cao, K.-A., Boitard, S., & Besse, P. (2011) · BMC Bioinformatics · doi:10.1186/1471-2105-12-253 · Cited by 1,007 · cited 3×
“In single ‘omics analyses this distance achieves best accuracy when the predicted values are close to 0 or 1 [10].”
BackgroundMethodInfluentialPlankton networks driving carbon export in the oligotrophic ocean
Guidi, L., Chaffron, S., Bittner, L., Eveillard, D., Larhlimi, A., Roux, S., Darzi, Y., Audic, S., Berline, L., Brum, J. R., et al. (2016) · Nature · doi:10.1038/nature16942 · Cited by 870 · cited 1×
“(2016), Table 3 and factomineR Husson et al. (2017)). However, very few methods propose feature selection, including sparse CCA (pma package Witten et al. (2013)), sparse PLS (spls package, Chung et al.”
MethodTumor classification by partial least squares using microarray gene expression data
Nguyen, D. V., & Rocke, D. M. (2002) · Bioinformatics · doi:10.1093/bioinformatics/18.1.39 · Cited by 816 · cited 1×
“The assessment is data-driven and similar to the process detailed in Rohart et al. (2016), where one-sided t-tests assess whether there is a gain in performance when adding components to the model.”
MethodPath Models with Latent Variables: The NIPALS Approach
WOLD, H. (1975) · Quantitative Sociology · doi:10.1016/b978-0-12-103950-9.50017-4 · Cited by 802 · cited 1×
“Unsupervised analyses methods include Principal Component Analysis—based on NonLinear Iterative Partial Least Squares for missing values [18], Independent Component Analysis [19], Partial Least Squares regression—PLS, also known as Projection to Latent Structures [20], multi-group PLS [21], regularised Canonical Corre…”
Method
Research works printed but not linked: 3
- A Singh, 2016, DIABLO-an integrative, multi-omics, multivariate method for multi-group classification, bioRxiv, 067611
- F Rohart, 2017, MINT: A multivariate integrative approach to identify a reproducible biomarker signature across multiple experiments and platforms, BMC Bioinformatics, 18
- H Wold, 1966, Estimation of principal components and related models by iterative least squares, J Multivar Anal, 391
Cited by
Items 801–900 of 1,013
Reimer, J. J., Shaaban, B., Drummen, N., Ambady, S. S., Genzel, F., Poschet, G., Wiese‐Klinkenberg, A., Usadel, B., & Wormit, A. (2022) · Antioxidants · doi:10.3390/antiox11040671 · Cited by 33
“genes and mass features (see table 1), using the “mixOmics”-package [68].”
MethodSkin microbiome alters attractiveness to Anopheles mosquitoes
Showering, A., Martinez, J., Benavente, E. D., Gezan, S. A., Jones, R. G., Oke, C. E., Tytheridge, S. J., Pretorius, E., Scott, D. A. V., Allen, R. L., et al. (2022) · BMC Microbiology · doi:10.1186/s12866-022-02502-4 · Cited by 31
Metabolic Profiling at COVID-19 Onset Shows Disease Severity and Sex-Specific Dysregulation
Ceballos, F. C., Virseda-Berdices, A., Resino, S., Ryan, P., Martínez-González, Ó., Pérez-García, F., Martín-Vicente, M., Brochado-Kith, Ó., Blancas, R., Bartolomé-Sánchez, S., et al. (2022) · Frontiers in Immunology · doi:10.3389/fimmu.2022.925558 · Cited by 27
Szeitz, B., Megyesfalvi, Z., Woldmar, N., Valkó, Z., Solta, A., Bárány, N., Paku, S., László, V., Kiss, H., Bugyik, E., et al. (2022) · Clinical and Translational Medicine · doi:10.1002/ctm2.1060 · Cited by 31
Janker, L., Schuster, D., Bortel, P., Hagn, G., Meier, S. M., Mohr, T. T., Mader, J. C., Slany, A., Bileck, A., Brunmair, J., et al. (2023) · Journal of Crohn s and Colitis · doi:10.1093/ecco-jcc/jjad052 · Cited by 28
“…integrated in R using N-integration discriminant analysis with DIABLO [Data Integration Analysis for Biomarker discovery, R-package mixOmics 6.18.0, 42] and an own-developed method using Gaussian Graphs Models Selection [R-package GGMselect 0.1-12.4, CIT2] for analytes reduction via sub-network…”
MethodInfluentialSerum lipid mediator profiles in COVID-19 patients and lung disease severity: a pilot study
Irún, P., Gracia, R., Piazuelo, E., Pardo, J., Morte-Romea, E., Paño, J. R., Bozá, J., Carrera‐Lasfuentes, P., Higuera, G. A., & Lanas, Á. (2023) · Scientific Reports · doi:10.1038/s41598-023-33682-2 · Cited by 29
Casto‐Rebollo, C., Argente, M. J., García, M. L., Pena, R. N., Blasco, A., & Ibáñez‐Escriche, N. (2023) · Microbiome · doi:10.1186/s40168-023-01580-4 · Cited by 33
“The PLSDA models were computed on the mixOmics package in R [29].”
MethodComputational systems biology approaches for Parkinson’s disease
Glaab, E. (2017) · Cell and Tissue Research · doi:10.1007/s00441-017-2734-5 · Cited by 28
Multiomics Data Integration in Time Series Experiments
Tarazona, S., Balzano‐Nogueira, L., & Conesa, A. (2018) · Comprehensive analytical chemistry · doi:10.1016/bs.coac.2018.06.005 · Cited by 29
Blood-based systems biology biomarkers for next-generation clinical trials in Alzheimer’s disease
Hampel, H. J., Vergallo, A., Afshar, M., Akman-Anderson, L., Arenas, J., Benda, N., Batrla, R., Broich, K., Caraci, F., Cuello, A. C., et al. (2019) · Dialogues in Clinical Neuroscience · doi:10.31887/dcns.2019.21.2/hhampel · Cited by 28
Butler, M. C., Long, C. N., Kinkade, J. A., Green, M. T., Martin, R. E., Marshall, B. L., Willemse, T. E., Schenk, A. K., Mao, J., & Rosenfeld, C. S. (2020) · Journal of Neuroendocrinology · doi:10.1111/jne.12847 · Cited by 28
A comparison of high-throughput plasma NMR protocols for comparative untargeted metabolomics
Bliziotis, N. G., Engelke, U. F. H., Aspers, R. L. E. G., Engel, J., Deinum, J., Timmers, H. J. L. M., Wevers, R. A., & Kluijtmans, L. A. J. (2020) · Metabolomics · doi:10.1007/s11306-020-01686-y · Cited by 28
Bedu-Ferrari, C., Biscarrat, P., Pepke, F., Vati, S., Chaudemanche, C., Castelli, F., Chollet, C., Rué, O., Hennequet-Antier, C., Langella, P., et al. (2024) · mSystems · doi:10.1128/msystems.01401-23 · Cited by 24
“22.0 (Text S1) (47).”
InfluentialGodbole, S., Voß, H., Gocke, A., Schlumbohm, S., Schumann, Y., Peng, B., Mynarek, M., Rutkowski, S., Dottermusch, M., Dorostkar, M. M., et al. (2024) · Nature Communications · doi:10.1038/s41467-024-50554-z · Cited by 28
“Integration of proteome and DNA methylome data DIABLO from mixOmics (Version 6.19.4) 31 was used for integration of proteome and methylome data to correlate the two data types.”
MethodInfluentialThibaut, M. M., Roumain, M., Piron, E., Gillard, J., Loriot, A. E., Neyrinck, A. M., Rodriguez, J., Massart, I. S., Thissen, J., Huot, J. R., et al. (2025) · Gut Microbes · doi:10.1080/19490976.2025.2449586 · Cited by 30
Marangon, E., Rädecker, N., Li, J., Terzin, M., Buerger, P., Webster, N. S., Bourne, D. G., & Laffy, P. W. (2025) · Microbiome · doi:10.1186/s40168-024-02006-5 · Cited by 28
“…and host gene expression data were integrated using DIABLO (Data Integration Analysis for Biomarker discovery using Latent components) in ‘mixOmics’ [57], following data normalization (micro-biome: centered log-ratio transformation; transcriptomics: normalized variance stabilized counts).”
InfluentialComputational Metagenomics: State of the Art
Pita-Galeana, M. A., Ruhle, M., López-Vázquez, L., de Anda‐Jáuregui, G., & Lemus, E. H. (2025) · International Journal of Molecular Sciences · doi:10.3390/ijms26189206 · Cited by 35
“This unsupervised approach employs linear models to explain the greatest variability in the data and handles missing values, enabling the integration of partially overlapping datasets. mixOmics [164] includes supervised and unsupervised multivariate analyses.”
Amaral, J., Correia, B., António, C., Rodrigues, A. M., Gómez‐Cadenas, ., Valledor, L., Hancock, R. D., Alves, A., & Pinto, G. (2019) · Frontiers in Plant Science · doi:10.3389/fpls.2019.00509 · Cited by 26
Bonfatti, V., Turner, S.-A., Kuhn‐Sherlock, B., Luke, T. D. W., Ho, P. N., Phyn, C. V. C., & Pryce, J. E. (2019) · Journal of Dairy Science · doi:10.3168/jds.2018-15988 · Cited by 26
“, 2011), implemented in the R package mixOmics (Rohart et al., 2017).”
MethodWang, N., Guo, Y., Li, G., Xia, Y., Ma, M., Zang, J., Ma, Y., Yin, X., Han, W., Lv, J., et al. (2019) · Microbes and Environments · doi:10.1264/jsme2.me18091 · Cited by 26
“As described by Guidi et al. (16), the correlations of OTUs with seven out of nine geochemical parameters were assessed using the sparse partial least square (sPLS) (39) as implemented in the R package mixOmics (35).”
Hassan, S., Lethin, J., Blomberg, R., Mousavi, H., & Aronsson, H. (2019) · Computational Biology and Chemistry · doi:10.1016/j.compbiolchem.2019.107131 · Cited by 27
Qi, Y., Wang, H., Chen, X., Wei, G., Tao, S., & Fan, M. (2021) · Journal of Agricultural and Food Chemistry · doi:10.1021/acs.jafc.0c07599 · Cited by 26
Zhou, J., Chen, B., Albornoz, K., & Beckles, D. M. (2021) · Scientia Horticulturae · doi:10.1016/j.scienta.2021.110090 · Cited by 26
Rodrigues, A. M., Jorge, T. F., Osorio, S., Pott, D. M., Lidon, F. C., DaMatta, F. M., Marques, I., Ribeiro-Barros, A. I., Ramalho, J. C., & António, C. (2021) · Metabolites · doi:10.3390/metabo11070427 · Cited by 31
“Plots performed in R software [48,49] using the “mixOmics” package [51].”
MethodAyelo, P. M., Mohamed, S. A., Chailleux, A., Yusuf, A. A., Pirk, C. W. W., & Delétré, E. (2021) · Journal of Pest Science · doi:10.1007/s10340-021-01424-w · Cited by 28
Baboyan, V. G., Basilakos, A., Yourganov, G., Rorden, C., Bonilha, L., Fridriksson, J., & Hickok, G. S. (2021) · Human Brain Mapping · doi:10.1002/hbm.25647 · Cited by 27
“sPLS-R was implemented using the “mixomics” package in R, dedicated to the multivariate analysis of biological “omics” datasets (Rohart et al., 2017).”
MethodA Distinctive NAFLD Signature in Adipose Tissue from Women with Severe Obesity
Osorio-Conles, Ó., Vega‐Beyhart, A., Ibarzábal, A., Balibrea, J. M., Graupera, I., Rimola, J., Vidal, J., & de Hollanda, A. (2021) · International Journal of Molecular Sciences · doi:10.3390/ijms221910541 · Cited by 34
“1, Vienna, Austria) software environment [59] were used to perform the analyses.”
MethodDemirel, H. C., Arici, M. K., & Tunçbağ, N. (2021) · Molecular Omics · doi:10.1039/d1mo00158b · Cited by 30
Integrative omics analysis identifies biomarkers of idiopathic pulmonary fibrosis
Zheng, P., Sun, S., Wang, J., Cheng, Z. J., Lei, K. C., Xue, M., Zhang, T., Huang, H., Zhang, X. D., & Sun, B. (2022) · Cellular and Molecular Life Sciences · doi:10.1007/s00018-021-04094-0 · Cited by 31
Advances, obstacles, and opportunities for machine learning in proteomics
Desaire, H., Go, E. P., & Hua, D. (2022) · Cell Reports Physical Science · doi:10.1016/j.xcrp.2022.101069 · Cited by 32
Zhu, B., Gao, H., Yang, F. W., Li, Y., Yang, Q., Liao, Y., Guo, H., Xu, K., Tang, Z., Gao, N., et al. (2023) · Foods · doi:10.3390/foods12051059 · Cited by 27
“Partial least squares discriminant analysis (PLS-DA) was performed using the mixOmics package [19].”
MethodA DNA tumor virus globally reprograms host 3D genome architecture to achieve immortal growth
Wang, C., Liu, X., Liang, J., Narita, Y., Ding, W., Li, D., Zhang, L., Wang, H., Leong, M. M., Hou, I., et al. (2023) · Nature Communications · doi:10.1038/s41467-023-37347-6 · Cited by 29
Goßner, M. M., Perret‐Gentil, A., Britt, E., Queloz, V., Glauser, G., Ladd, T. R., Roe, A. D., Cleary, M., Liziniewicz, M., Nielsen, L. R., et al. (2023) · New Phytologist · doi:10.1111/nph.19068 · Cited by 29
Yeruva, L., Mulakala, B. K., Rajasundaram, D., González, S., Cabrera‐Rubio, R., Martínez‐Costa, C., & Collado, M. C. (2023) · Clinical Nutrition · doi:10.1016/j.clnu.2023.10.011 · Cited by 33
Oppong, A. E., Coelewij, L., Robertson, G., Martin‐Gutierrez, L., Waddington, K. E., Dönnes, P., Nytrová, P., Farrell, R. A., Pineda‐Torra, I., & Jury, E. C. (2024) · iScience · doi:10.1016/j.isci.2024.109225 · Cited by 27
“This analysis was performed using the R package mixOmics 77 using the metabolomic data for the following comparisons: DC vs. HC; RRMS vs. HC; SPMS vs. HC; SPMS vs. RRMS; RRMS vs. DC and SPMS vs. DC.”
Cohen, N. R., Krinos, A. I., Kellogg, R. M., Chmiel, R. J., Moran, D. M., McIlvin, M. R., Lopez, P., Barth, A. J., Stone, J. P., Alanis, B. A., et al. (2024) · Nature Communications · doi:10.1038/s41467-024-51583-4 · Cited by 26
Senesi, N., Manzari, P., Consiglio, A., & Pascale, O. D. (2018) · Journal of Analytical Atomic Spectrometry · doi:10.1039/c8ja00224j · Cited by 28
Li, N., Zhu, C., Liu, C., Zhang, X., Ding, J., Zandi, P., & Li, H. (2019) · Environmental Pollution · doi:10.1016/j.envpol.2019.113116 · Cited by 28
Bowerman, K. L., Varelias, A., Lachner, N., Kuns, R. D., Hill, G. R., & Hugenholtz, P. (2020) · Gut Microbes · doi:10.1080/19490976.2019.1705729 · Cited by 27
Peršurić, Ž., Martinović, L. S., Zengin, G., Šarolić, M., & Pavelić, S. K. (2020) · LWT · doi:10.1016/j.lwt.2020.109225 · Cited by 26
Kaur, S., Kinkade, J. A., Green, M. T., Martin, R. E., Willemse, T. E., Bivens, N. J., Schenk, A. K., Helferich, W. G., Trainor, B. C., Fass, J., et al. (2020) · Hormones and Behavior · doi:10.1016/j.yhbeh.2020.104890 · Cited by 27
“8 Integrative Correlation Analyses miR/small RNA changes that overlapped in the female (6 altogether) and male (40 altogether) group comparisons were correlated with behavioral and metabolic results by using mixOmics R package (Rohart et al., 2017) with an r value set to 0.”
MethodInfluentialShi, S., Kumar, S., Young, S., Maclean, P., & Jáuregui, R. (2023) · Journal of Sustainable Agriculture and Environment · doi:10.1002/sae2.12075 · Cited by 27
From dysbiosis to neuropathologies: Toxic effects of glyphosate in zebrafish
Bellot, M., Carrillo, M. P., Bedrossiantz, J., Zheng, J., Mandal, R., Wishart, D. S., Gómez‐Canela, C., Vila‐Costa, M., Prats, E., Piña, B., et al. (2023) · Ecotoxicology and Environmental Safety · doi:10.1016/j.ecoenv.2023.115888 · Cited by 29
The road forward to incorporate seawater microbes in predictive reef monitoring
Terzin, M., Laffy, P. W., Robbins, S. J., Yeoh, Y. K., Frade, P. R., Glasl, B., Webster, N. S., & Bourne, D. G. (2024) · Environmental Microbiome · doi:10.1186/s40793-023-00543-4 · Cited by 28
“To successfully integrate these large and complex datasets, novel computational approaches such as multi-omics data integration [70], ecological niche modelling [71, 72], network analysis [72, 73], multivariate statistics and supervised learning needed to be applied, and these modelling and data…”
MethodMulti-omics integration identifies regulatory factors underlying bovine subclinical mastitis
Wang, M., Yang, N., Laterrière, M., Gagné, D., Omonijo, F. A., & Ibeagha-Awemu, E. M. (2024) · Journal of Animal Science and Biotechnology/Journal of animal science and biotechnology · doi:10.1186/s40104-024-00996-8 · Cited by 27
“…signatures that discriminate the SM (SAP and SCP) and HC groups, we used the DIABLO (Data Integration Analysis for Biomarker discovery using a Latent component method for Omics studies) method implemented in the R package, mixOmics version 6.22.0 [44], to integrate the four omics datasets.”
MethodInfluentialKhan, M., Nizamani, M. M., Asif, M. U., Kamran, A., He, G., Li, X., Yang, S., & Xie, X. (2025) · Journal of Environmental Management · doi:10.1016/j.jenvman.2024.123969 · Cited by 28
Perepletchikova, D. A., Kuchur, P. D., Basovich, L., Khvorova, I., Lobov, A. A., Azarkina, K., Aksenov, N., Божкова, С. А., Karelkin, V. V., & Malashicheva, A. (2025) · Cell Communication and Signaling · doi:10.1186/s12964-025-02096-0 · Cited by 30
Multi-omics-based insights into tomato adaptation to multifactorial stress combination
Pascual, L. S., Serna, E., Ghani, A., Lyu, Z., Immadi, M. S., Joshi, T., Verma, M. K., Rambla, J. L., Gómez‐Cadenas, ., Mittler, R., et al. (2025) · PLANT PHYSIOLOGY · doi:10.1093/plphys/kiaf519 · Cited by 32
“21; Rohart et al. 2017) R package was employed to associate transcriptomic data with metabolomic, hormonal, and physiological changes of tomato plants exposed to MFSC.”
Cao, Z., Kamlage, B., Wagner-Golbs, A., Maisha, M. P., Sun, J., Schnackenberg, L. K., Pence, L. M., Schmitt, T. C., Daniels, J. R., Rogstad, S., et al. (2019) · Journal of Proteome Research · doi:10.1021/acs.jproteome.8b00903 · Cited by 25
Multi-Omic Regulation of the PAM50 Gene Signature in Breast Cancer Molecular Subtypes
Ochoa, S., de Anda‐Jáuregui, G., & Lemus, E. H. (2020) · Frontiers in Oncology · doi:10.3389/fonc.2020.00845 · Cited by 26
“Alternative methods like A–JIVE (59) and sPLS (60) would have also exciting outcomes in this settings.”
MethodUcuz, İ., Arı, A., Özcan, Ö., Topaktas, O., Sarraf, M., & Dogan, O. (2020) · Journal of Child Sexual Abuse · doi:10.1080/10538712.2020.1841350 · Cited by 27
“Experts working in the field can cope with many difficulties such as prediction of risk groups, treatment selection, diagnosis, side effect formation faster and create individual-specific algorithms by using matrices such as machine learning (Bzdok & Meyer-Lindenberg, 2018; Rohart et al., 2017).”
MethodFracchia, F., Mangeot-Peter, L., Jacquot, L., Martin, F. M., Veneault‐Fourrey, C., & Deveau, A. (2021) · Applied and Environmental Microbiology · doi:10.1128/aem.02541-20 · Cited by 25
Medicago sativa and Medicago truncatula Show Contrasting Root Metabolic Responses to Drought
Echeverría, A., Larrainzar, E., Li, W., Watanabe, Y., Sato, M., Tran, C. D., Moler, J. A., Hirai, M. Y., Sawada, Y., Tran, L. P., et al. (2021) · Frontiers in Plant Science · doi:10.3389/fpls.2021.652143 · Cited by 25
West, P. T., Peters, S. L., Olm, M. R., Yu, F. B., Gause, H., Lou, Y. C., Firek, B., Baker, R. W., Johnson, A. D., Morowitz, M. J., et al. (2021) · Microbiome · doi:10.1186/s40168-021-01085-y · Cited by 29
Linking genotype to phenotype in multi-omics data of small sample
Guo, X., Song, Y., Liu, S., Gao, M., Yang, Q., & Shang, X. (2021) · BMC Genomics · doi:10.1186/s12864-021-07867-w · Cited by 27
Rebaza-Cardenas, T. D., Silva-Cajaleón, K., Sabater, C., Delgado, S., Villanueva, N. D. M., & Ruas‐Madiedo, P. (2021) · Probiotics and Antimicrobial Proteins · doi:10.1007/s12602-021-09836-x · Cited by 29
Gołębiewski, M., Łoś-Rycharska, E., Sikora, M., Grzybowski, T., Gorzkiewicz, M., & Krogulska, A. (2021) · Nutrients · doi:10.3390/nu13103600 · Cited by 25
Boulghobra, D., Dubois, M., Alpha‐Bazin, B., Coste, F., Olmos, M., Gayrard, S., Bornard, I., Meyer, G., Gaillard, J., Armengaud, J., et al. (2021) · Basic Research in Cardiology · doi:10.1007/s00395-021-00906-3 · Cited by 29
“The mixOmics package for R (https://www.bioconductor.org/packages/release/bioc/html/mixOmics.html) was used for the PLS-DA and sPLS-DA analyses [65].”
Wortelboer, K., Bakker, G. J., Winkelmeijer, M., van Riel, N. A. W., Levin, E., Nieuwdorp, M., Herrema, H., & Davids, M. (2022) · Microbiological Research · doi:10.1016/j.micres.2022.126972 · Cited by 26
“Compositional shifts were visualized using inter-individual variance corrected multilevel PCA (Rohart et al., 2017).”
MethodInfluentialForensic analysis of cigarette ash using ATR-FTIR spectroscopy and chemometric methods
Sharma, A., & Sharma, V. (2022) · Microchemical Journal · doi:10.1016/j.microc.2022.107406 · Cited by 25
Bogovič, P., Kastrin, A., Lotrič‐Furlan, S., Ogrinc, K., Avšič‐Županc, T., Korva, M., Knap, N., Rus, K. R., Strle, K., & Strle, F. (2022) · Emerging Microbes & Infections · doi:10.1080/22221751.2022.2086070 · Cited by 25
“combined with discriminant analysis (sPLSDA) [15].”
Foucault, P., Gallet, A., Duval, C., Marie, B., & Duperron, S. (2022) · Aquatic Toxicology · doi:10.1016/j.aquatox.2022.106329 · Cited by 38
Integrative Multi-omics Analysis of Childhood Aggressive Behavior
Hagenbeek, F. A., van Dongen, J., Pool, R., Roetman, P. J., Harms, A. C., Hottenga, J., Kluft, C., Colins, O. F., van Beijsterveldt, C. E. M., Fanos, V., et al. (2022) · Behavior Genetics · doi:10.1007/s10519-022-10126-7 · Cited by 28
“The full design matrix optimizes correlations among the omics blocks, while the null design matrix optimizes the discrimination between samples (Rohart et al. 2017; Singh et al. 2019; Duruflé et al. 2020).”
MethodMultimodal Learning for Multi-omics: A Survey
Tabakhi, S., Suvon, M. N. I., Ahadian, P., & Lu, H. (2023) · World Scientific Annual Review of Artificial Intelligence · doi:10.1142/s2811032322500047 · Cited by 31
Altered transcriptome-proteome coupling indicates aberrant proteostasis in Parkinson’s disease
Dick, F., Tysnes, O., Alves, G. W., Nido, G. S., & Tzoulis, C. (2023) · iScience · doi:10.1016/j.isci.2023.105925 · Cited by 26
Zheng, R., Xiang, X., Shi, Y., Qiu, A., Luo, X., Xie, J., Russell, R., & Zhang, D. (2023) · Frontiers in Microbiology · doi:10.3389/fmicb.2023.1295869 · Cited by 27
Newman, N. K., Macovsky, M. S., Rodrigues, R. R., Bruce, A. M., Pederson, J. W., Padiadpu, J., Shan, J., Williams, J., Patil, S. S., Dzutsev, A., et al. (2024) · Nature Protocols · doi:10.1038/s41596-024-00960-w · Cited by 28
“Additional R packages (e.g., MixOmics 28 , MOFA+ 29,30 and iClusterPlus 31,32 ) also use sophisticated statistical methods to combine multiple -omics data measured from the same patients.”
NAD+ deficiency primes defense metabolism via 1O2-escalated jasmonate biosynthesis in plants
Hong, Y., Yu, Z., Zhou, Q., Chen, C., Hao, Y., Wang, Z., Zhu, J., Guo, H., & Huang, A. C. (2024) · Nature Communications · doi:10.1038/s41467-024-51114-1 · Cited by 27
“Principal component analysis (PCA) in multivariate statistic process and partial least squares-discriminant analysis (PLS-DA) were performed to compare the metabolic pro fi les among all samples using R packages mixOmics 55 .”
Potential Metabolomic Linkage in Blood between Parkinson’s Disease and Traumatic Brain Injury
Fiandaca, M. S., Gross, T. J., Johnson, T. M., Hu, M. T., Evetts, S. G., Wade‐Martins, R., Merchant‐Borna, K., Bazarian, J. J., Cheema, A. K., Mapstone, M. E., et al. (2018) · Metabolites · doi:10.3390/metabo8030050 · Cited by 26
Fernández, O., Urrutia, M., Berton, T., Bernillon, S., Deborde, C., Jacob, D. J., Maucourt, M. M., Maury, P., Duruflé, H., Gibon, Y., et al. (2019) · Metabolomics · doi:10.1007/s11306-019-1515-4 · Cited by 44
Cano-Sancho, G., Alexandre-Gouabau, M. C., Moyon, T., Royer, A., Guitton, Y., Billard, H., Darmaun, D., Rozé, J., Boquien, C., Bizec, B. L., et al. (2019) · Environmental Research · doi:10.1016/j.envres.2019.109018 · Cited by 25
Tan, S. C., Chong, C. W., Yap, I. K. S., Thong, K. L., & Teh, C. S. J. (2020) · Scientific Reports · doi:10.1038/s41598-020-65891-4 · Cited by 27
Whole-blood transcriptome profiling reveals signatures of metformin and its therapeutic response
Briviba, M., Ansone, L., Silamiķelis, I., Rovīte, V., Elbere, I., Silamiķele, L., Kalniņa, I., Frīdmanis, D., Sokolovska, J., Konrāde, I., et al. (2020) · PLoS ONE · doi:10.1371/journal.pone.0237400 · Cited by 27
“PLS-DA was applied to understand whether patients could be clustered based on their gene expression profiles before the administration of metformin.”
MethodInfluentialCardona, L., Cao, K. L., Puig‐Castellví, F., Bureau, C., Madigou, C., Mazéas, L., & Chapleur, O. (2020) · Journal of Proteome Research · doi:10.1021/acs.jproteome.0c00251 · Cited by 25
Testing the specificity of environmental risk factors for developmental outcomes
Bignardi, G., Dalmaijer, E. S., & Astle, D. E. (2021) · Child Development · doi:10.1111/cdev.13719 · Cited by 28
Sparse Reduced-Rank Regression for Exploratory Visualisation of Paired Multivariate Data
Kobak, D., Bernaerts, Y., Weis, M. A., Scala, F., Tolias, A. S., & Berens, P. (2021) · Journal of the Royal Statistical Society Series C: Applied Statistics · doi:10.1111/rssc.12494 · Cited by 24
“…non-sparse) CCA and PLS have been applied to biological datasets in order to integrate multi-omics data (González et al., 2008, 2009, 2012; Lê Cao et al., 2008, 2009), with the recent mixOmics package for R providing a convenient implementation for several of these methods (Rohart et al., 2017).”
MethodUntargeted metabolomic profiling in children identifies novel pathways in asthma and atopy
Lejeune, S., Kaushik, A., Parsons, E. S., Chinthrajah, R. S., Snyder, M. P., Desai, M., Manohar, M., Prunicki, M. M., Contrepois, K., Gosset, P., et al. (2023) · Journal of Allergy and Clinical Immunology · doi:10.1016/j.jaci.2023.09.040 · Cited by 28
Auer, E. E., Lazuka, A., Huguenin-Bizot, B., Jehmlich, N., Dejean, S., Lombard, V., Henrissat, B., O’Donohue, M. J., & Hernandez‐Raquet, G. (2023) · ISME Communications · doi:10.1038/s43705-023-00339-0 · Cited by 29
Precision nutrition: Is tailor‑made dietary intervention a reality yet? (Review)
Petre, M. L., Tsichla, H., Pertesi, A. N. K., Mpoulioglou, O. E., Kouvela, M., Vamvakaris, I. N., Gkiozos, I., Syrigos, K. N., & Anagnostopoulos, A. K. (2025) · Biomedical Reports · doi:10.3892/br.2025.1964 · Cited by 27
“…ated by the aforementioned procedures was achieved using artificial intelligence based models, for instance, machine learning tools based on multivariate techniques, such as the mixOmics framework (46) and deep‑learning approaches including large language models, convolutional neural networks.”
An integrated transcriptomic and proteomic map of the mouse hippocampus at synaptic resolution
Kaulich, E., Waselenchuk, Q., Fürst, N., Desch, K., Mosbacher, J., Ciirdaeva, E., Juengling, M., Ray, R., Nassim-Assir, B., Tushev, G., et al. (2025) · Nature Communications · doi:10.1038/s41467-025-63119-5 · Cited by 30
Idkowiak, J., Dehairs, J., Schwarzerová, J., Olešová, D., Truong, J. X. M., Kvasnička, A., Eftychiou, M., Cools, R., Spotbeen, X., Jirásko, R., et al. (2025) · Nature Communications · doi:10.1038/s41467-025-63751-1 · Cited by 35
“For (O)PLS, R provides two Bioconductor packages – mixO-mics (PLS) 92 and ropls ((O)PLS) 108 .”
InfluentialAnsermino, C., Pavlović, R., Braccia, C., Drago, D., Anelli, C., & Andolfo, A. (2026) · Biomarker Research · doi:10.1186/s40364-025-00889-6 · Cited by 27
“MixOmics [178] is a widely used R package for omics data supporting different frameworks: single-omics analysis (pca, spca, plsda, splsda), two-omics (pls, spls) and multiple-omics analysis (P-integration and N-integration).”
Usefulness of milk mid-infrared spectroscopy for predicting lameness score in dairy cows
Bonfatti, V., Ho, P. N., & Pryce, J. E. (2019) · Journal of Dairy Science · doi:10.3168/jds.2019-17551 · Cited by 24
A role for the immune system in advanced laryngeal cancer
Tagliabue, M., Maffini, F. A., Fumagalli, C., Gandini, S., Lepanto, D., Corso, F., Cacciola, S., Ranghiero, A., Rappa, A., Vacirca, D., et al. (2020) · Scientific Reports · doi:10.1038/s41598-020-73747-0 · Cited by 24
Metabolomics of primary cutaneous melanoma and matched adjacent extratumoral microenvironment
Taylor, N. J., Gaynanova, I., Eschrich, S. A., Welsh, E. A., Garrett, T. J., Beecher, C., Sharma, R., Koomen, J. M., Smalley, K. S. M., Messina, J. L., et al. (2020) · PLoS ONE · doi:10.1371/journal.pone.0240849 · Cited by 26
Henriet, C., Balliau, T., Aimé, D., Signor, C. L., Kreplak, J., Zivy, M., Gallardo, K., & Vernoud, V. (2021) · Journal of Experimental Botany · doi:10.1093/jxb/eraa571 · Cited by 27
Metabolomic fingerprinting of pig seminal plasma identifies in vivo fertility biomarkers
Mateo‐Otero, Y., Fernández-López, P., Delgado‐Bermúdez, A., Nolis, P., Roca, J., Miró, J., Barranco, I., & Yeste, M. (2021) · Journal of Animal Science and Biotechnology/Journal of animal science and biotechnology · doi:10.1186/s40104-021-00636-5 · Cited by 24
Reyer, H., Oster, M., Ponsuksili, S., Trakooljul, N., Omotoso, A. O., Iqbal, M. A., Muráni, E., Sommerfeld, V., Rodehutscord, M., & Wimmers, K. (2021) · BMC Genomics · doi:10.1186/s12864-021-07814-9 · Cited by 25
Niimi, J., Deveau, A., & Splivallo, R. (2021) · LWT · doi:10.1016/j.lwt.2021.112125 · Cited by 26
Reyrolle, M., Ghislain, M., Bru, N., Vallverdu, G. S., Pigot, T., Desauziers, V., & Béchec, M. L. (2021) · Food Chemistry · doi:10.1016/j.foodchem.2021.130801 · Cited by 24
Iqbal, N., & Kumar, P. (2022) · Computers in Biology and Medicine · doi:10.1016/j.compbiomed.2022.105684 · Cited by 30
“[3].”
Lipidomic profiling of Indonesian coffee to determine its geographical origin by LC–MS/MS
Aurum, F. S., Imaizumi, T., Thammawong, M., Suhandy, D., Praseptiangga, D., Tsuta, M., NAGATA, M., & Nakano, K. (2022) · European Food Research and Technology · doi:10.1007/s00217-022-04098-5 · Cited by 24
Fréville, M., Estienne, A., Ramé, C., Lefort, G., Chahnamian, M., Staub, C., Venturi, É., Lemarchand, J., Maximin, E., Hondelatte, A., et al. (2022) · Frontiers in Physiology · doi:10.3389/fphys.2022.974688 · Cited by 29
“Finally, sparse partial least-squares discriminant analysis (sPLS-DA) was computed on the centered log ratio (CLR)-transformed data using the mixOmics package (Lê Cao et al., 2016; Rohart et al., 2017).”
MethodSalomon, J., Qiu, H., Feng, D., Owens, J., Khailova, L. S., Lujan, S. M. O., Iguidbashian, J., Chhonker, Y. S., Murry, D. J., Riethoven, J.-J. M., et al. (2022) · Disease Models & Mechanisms · doi:10.1242/dmm.049742 · Cited by 28
“Canonical correlation analyses were performed using the R package mixOmics (version 6.14.1) (Rohart et al., 2017) to explore correlation between microbiome and plasma biomarkers and/or stool metabolites.”
InfluentialSelf-citationHuman antibody profiling technologies for autoimmune disease
Carlton, L. H., McGregor, R., & Moreland, N. J. (2023) · Immunologic Research · doi:10.1007/s12026-023-09362-8 · Cited by 28
“These include principal component analysis (PCA) to visualise large amounts of data from multiple groups, as well as partial-least-squares discriminant analysis (PLS-DA) to identify hits that drive the discrimination between groups [44].”
MethodMarchante, M., Buigues, A., Ramírez-Martín, N., Martínez, J., Pellicer, N., Pellicer, A., & Herraiz, S. (2023) · American Journal of Obstetrics and Gynecology · doi:10.1016/j.ajog.2023.01.018 · Cited by 25
Effect of Tea Saponins on Rumen Microbiota and Rumen Function in Qinchuan Beef Cattle
Qu, X., Raza, S. H. A., Zhao, Y., Deng, J., Ma, J., Wang, J., Alkhorayef, N., Alkhalil, S. S., Pant, S. D., Lei, H., et al. (2023) · Microorganisms · doi:10.3390/microorganisms11020374 · Cited by 28
Selig, M., Azizi, S., Walz, K., Lauer, J. C., Rolauffs, B., & Hart, M. L. (2023) · Frontiers in Immunology · doi:10.3389/fimmu.2023.1102912 · Cited by 26
“The CIM and PLS-DA analyses of the morphology and gene expression data were performed with the “mixOmics” (79, 80) package in “R”.”
MethodAdams, B., Yusuf, A. A., Torto, B., & Khamis, F. M. (2023) · Frontiers in Plant Science · doi:10.3389/fpls.2023.1014865 · Cited by 25
“With the aid of the function ‘perf’ sPLSDA parameters (R2X, R2Y and Q2) and ‘leave-one-group-out’ crossvalidation method, the sPLS-DA model was validated (Rohart et al., 2017).”
MethodEffects of Perfluorooctanoic Acid on Gut Microbiota and Microbial Metabolites in C57BL/6J Mice
Gao, B., Chen, L., Xu, W., Shan, J., Shen, W., & Gao, N. (2023) · Metabolites · doi:10.3390/metabo13060707 · Cited by 28
“MixOmics was used for the integrative analysis of gut microbiota and fecal metabolites—this is an integrative framework for the multivariate analysis of omics data [31].”
Method
Metadata
- Authors
- Rohart, F., Gautier, B., Singh, A., & Lê Cao, K.-A.
- Affiliations
- Translational Research Institute (AU)
- University of British Columbia (CA)
- Venue
- PLOS Computational Biology
- Publisher
- Public Library of Science (PLoS)
- Published
- 2017-11-03
- Volume
- 13
- Issue
- 11
- Pages
- e1005752
- ISSN
- 1553-734X (ISSN-L)
- 1553-7358
- PMC
- PMC5687754
- OpenAlex
- W2950985821
- Cited by
- 4,056
- References
- 57
- Citations by year
- 2026: 629 · 2025: 612 · 2024: 600 · 2023: 523 · 2022: 496 · 2021: 489 · 2020: 350 · 2019: 241 · 2018: 95 · 2017: 14
- FWCI
- 78.13
- Type
- journal article
- Language
- en
- Update notices
- new_version (2017-11-15)
- Open access
- gold
- doi.org
- Licence
- Locations
- PLoS Computational Biology (publishedVersion, cc-by)
- bioRxiv (Cold Spring Harbor Laboratory) (acceptedVersion, cc-by-nc-nd)
- PubMed Central (publishedVersion, cc-by)
- PubMed (publishedVersion)
- Minerva Access (University of Melbourne) (submittedVersion, cc-by)
- RePEc: Research Papers in Economics (submittedVersion)
- DOAJ (DOAJ: Directory of Open Access Journals) (submittedVersion, cc-by-sa)
- Figshare (submittedVersion, cc-by)
- Funders
- National Health and Medical Research Council (APP1087415)
- Australian Cancer Research Foundation (ACRF) for the Diamantina Individualised Oncology Care Centre
- Topics
- Life Sciences › Biochemistry, Genetics and Molecular Biology › Molecular Biology › Bioinformatics and Genomic Networks
- Life Sciences › Biochemistry, Genetics and Molecular Biology › Molecular Biology › Metabolomics and Mass Spectrometry Studies
- Life Sciences › Biochemistry, Genetics and Molecular Biology › Molecular Biology › Gene expression and cancer classification
- Keywords
- R package, multi-omics integration, feature selection, multivariate analysis, dimensionality reduction, partial least squares regression, discriminant analysis, molecular signatures, systems biology, transcriptomics, proteomics, metabolomics, exploratory data analysis
- MeSH terms
- Data Interpretation, Statistical, Humans, Neoplasms, Software, Computational Biology, Genomics, Systems Biology, Metabolomics
About these checks
Registry, retraction, Cites and statistics results are computed, not judged, with one exception: a printed reference that no index lists is read once by a model before it counts as a citation error. Claims are extracted by a model and kept only when their quote appears verbatim in the text; each cited source is then checked, with a model’s help, for whether it says what the claim relies on. Those verdicts can be wrong — read the claim’s quote and the cited source before relying on one.
Statistics and arithmetic are recomputed, not judged.
Confidence bands are shown only for fields calibrated on our annotated test set. None is calibrated yet, so no band is shown.
What counts as a claim ›How we measure confidence ›How we check this ›
Are you an author, or do you see a problem with this page? Request a review
Data sources
Bibliographic data: Semantic Scholar, OpenAlex, Crossref.
Contains information from the Semantic Scholar Academic Graph Datasets, made available under the ODC Attribution License (ODC-BY 1.0).
Semantic Scholar’s data is described in: Kinney, R., et al. (2023). The Semantic Scholar Open Data Platform. arXiv:2301.10140.
