

mixOmics: An R package for ‘omics feature selection and multiple data integration
Open accessPublished version of a preprint
The DOI matches its Crossref record; 58 of the 58 references it cites were found in a registry or an index.
Abstract
The advent of high throughput technologies has led to a wealth of publicly available 'omics data coming from different sources, such as transcriptomics, proteomics, metabolomics. Combining such large-scale biological data sets can lead to the discovery of important biological insights, provided that relevant information can be extracted in a holistic manner. Current statistical approaches have been focusing on identifying small subsets of molecules (a 'molecular signature') to explain or predict biological conditions, but mainly for a single type of 'omics. In addition, commonly used methods are univariate and consider each biological feature independently. We introduce mixOmics, an R package dedicated to the multivariate analysis of biological data sets with a specific focus on data exploration, dimension reduction and visualisation. By adopting a systems biology approach, the toolkit provides a wide range of methods that statistically integrate several data sets at once to probe relationships between heterogeneous 'omics data sets. Our recent methods extend Projection to Latent Structure (PLS) models for discriminant analysis, for data integration across multiple 'omics data or across independent studies, and for the identification of molecular signatures. We illustrate our latest mixOmics integrative frameworks for the multivariate analyses of 'omics data available from the package.
Overview
The claims and statistics of this paper haven’t been checked yet.
Free: it reads the open-access text and checks the first 5 claims that cite a source we can check. Create a free account to check every claim.
Integrity signals
Registry
Cites
Statistics
Figures



Verification
Claims the paper makes
The claims and statistics of this paper haven’t been checked yet.
Free: it reads the open-access text and checks the first 5 claims that cite a source we can check. Create a free account to check every claim.
Self-check
Percentages, sums and reported differences re-computed from the paper’s own numbers.
The self-check needs the paper’s full text.
Citations
Cites
R: A Language and Environment for Statistical Computing
R Core Team (2025) · doi:10.32614/r.manuals · Cited by 352,181
Regression shrinkage and selection via the lasso
Tibshirani, R. (1996) · Journal of the Royal Statistical Society Series B: Statistical Methodology · doi:10.1111/j.2517-6161.1996.tb02080.x · Cited by 51,482 · cited 1×
“Feature selection is performed via l1 regularisation (LASSO, [27]), which is implemented into each method’s statistical criterion to be optimised.”
MethodRegularization Paths for Generalized Linear Models via Coordinate Descent
Friedman, J., Hastie, T., & Tibshirani, R. (2010) · Journal of Statistical Software · doi:10.18637/jss.v033.i01 · Cited by 19,927 · cited 1×
“glmnet, [38], PMA, [39]), mixOmics uses soft-thresholding to improve usability by replacing the l(1) parameter by the number keepX of features to select on each dimension.”
MethodEnterotypes of the human gut microbiome
MetaHIT Consortium (additional members), Arumugam, M., Raes, J., Pelletier, E., Le Paslier, D., Yamada, T., Mende, D. R., Fernandes, G. R., Tap, J., Bruls, T., et al. (2011) · Nature · doi:10.1038/nature09944 · Cited by 7,548
Partial least squares for discrimination
Barker, M., & Rayens, W. (2003) · Journal of Chemometrics · doi:10.1002/cem.785 · Cited by 2,841
Khan, J., Wei, J. S., Ringnér, M., Saal, L. H., Ladanyi, M., Westermann, F., Berthold, F., Schwab, M., Antonescu, C. R., Peterson, C., et al. (2001) · Nature Medicine · doi:10.1038/89044 · Cited by 2,644 · cited 2×
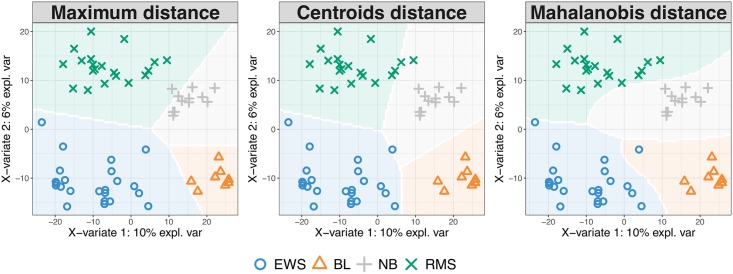
“The study investigates Small Round Blue Cell Tumors (SRBCT, [35]) of 63 tumour samples with the expression levels of 2,308 genes.”
BackgroundMethodLê Cao, K.-A., Boitard, S., & Besse, P. (2011) · BMC Bioinformatics · doi:10.1186/1471-2105-12-253 · Cited by 1,007 · cited 3×
“In single ‘omics analyses this distance achieves best accuracy when the predicted values are close to 0 or 1 [10].”
BackgroundMethodInfluentialPlankton networks driving carbon export in the oligotrophic ocean
Guidi, L., Chaffron, S., Bittner, L., Eveillard, D., Larhlimi, A., Roux, S., Darzi, Y., Audic, S., Berline, L., Brum, J. R., et al. (2016) · Nature · doi:10.1038/nature16942 · Cited by 870 · cited 1×
“(2016), Table 3 and factomineR Husson et al. (2017)). However, very few methods propose feature selection, including sparse CCA (pma package Witten et al. (2013)), sparse PLS (spls package, Chung et al.”
MethodTumor classification by partial least squares using microarray gene expression data
Nguyen, D. V., & Rocke, D. M. (2002) · Bioinformatics · doi:10.1093/bioinformatics/18.1.39 · Cited by 816 · cited 1×
“The assessment is data-driven and similar to the process detailed in Rohart et al. (2016), where one-sided t-tests assess whether there is a gain in performance when adding components to the model.”
MethodPath Models with Latent Variables: The NIPALS Approach
WOLD, H. (1975) · Quantitative Sociology · doi:10.1016/b978-0-12-103950-9.50017-4 · Cited by 802 · cited 1×
“Unsupervised analyses methods include Principal Component Analysis—based on NonLinear Iterative Partial Least Squares for missing values [18], Independent Component Analysis [19], Partial Least Squares regression—PLS, also known as Projection to Latent Structures [20], multi-group PLS [21], regularised Canonical Corre…”
Method
Research works printed but not linked: 3
- A Singh, 2016, DIABLO-an integrative, multi-omics, multivariate method for multi-group classification, bioRxiv, 067611
- F Rohart, 2017, MINT: A multivariate integrative approach to identify a reproducible biomarker signature across multiple experiments and platforms, BMC Bioinformatics, 18
- H Wold, 1966, Estimation of principal components and related models by iterative least squares, J Multivar Anal, 391
Cited by
Items 701–800 of 1,013
Meroño, T., Peron, G., Gargari, G., González‐Domínguez, R., Miñarro, A., Vegas, E., Hidalgo‐Liberona, N., Bo’, C. D., Bernardi, S., Kroon, P. A., et al. (2022) · Food Research International · doi:10.1016/j.foodres.2022.111632 · Cited by 32
Sun, Y. J., Zhang, X., Jin, C., Yue, K., Sheng, D., Zhang, T., Dou, X., Liu, J., Jing, H., Zhang, L., et al. (2023) · Journal of Translational Medicine · doi:10.1186/s12967-023-04054-1 · Cited by 37
Ferrarezi, J. A., Defant, H., de Souza, L. F., de Azevedo, J. L., Hungría, M., & Quecine, M. C. (2023) · Frontiers in Plant Science · doi:10.3389/fpls.2023.1172839 · Cited by 35
“, 2017) in mixOmics (Rohart et al., 2017) was used to identify multi-omics signature discriminating the rhizospheric microbial communities under treatments NS + Ab-V5, NS 10 + Ab-V5 and IS + Ab-V5.”
MethodLi, K., & Wang, C. (2023) · European Journal of Agronomy · doi:10.1016/j.eja.2023.126929 · Cited by 32
Aurum, F. S., Zaman, M. Z., Purwanto, E., Praseptiangga, D., & Nakano, K. (2023) · Food Bioscience · doi:10.1016/j.fbio.2023.103122 · Cited by 32
Jamieson, P. E., Smart, E. B., Bouranis, J. A., Choi, J., Danczak, R., Wong, C. P., Paraiso, I. L., Maier, C. S., Ho, E., Sharpton, T. J., et al. (2024) · Gut Microbes · doi:10.1080/19490976.2024.2315633 · Cited by 35
Clift, C. L., Blaser, M. C., Gerrits, W., Turner, M. E., Sonawane, A. R., Pham, T., Andresen, J. L., Fenton, O. S., Grolman, J. M., Campedelli, A., et al. (2024) · Science Advances · doi:10.1126/sciadv.adj9793 · Cited by 34
Alberge, J., Mussard, E., Al-Ayoubi, C., Lencina, C., Marrauld, C., Cauquil, L., Achard, C. S., Mateos, I., Alassane‐Kpembi, I., Oswald, I. P., et al. (2024) · Gut Microbes · doi:10.1080/19490976.2024.2430424 · Cited by 33
Multi-Omics Integration in Nephrology: Advances, Challenges, and Future Directions
Saliba, A., Du, Y., Feng, T., & Garmire, L. X. (2024) · Seminars in Nephrology · doi:10.1016/j.semnephrol.2025.151584 · Cited by 37
“On the other hand, correlation-based methods such as mixOmics 60 implement both canonical correlation analysis and partial least squares to maximize the covariance between different data modalities and mitigate sensitivity to outliers.”
Gut microbiota and tuberculosis
Liu, Y., Yang, L., Meskini, M., Goel, A., Opperman, M., Shyamal, S. S., Manaithiya, A., Xiao, M., Ni, R., An, Y., et al. (2025) · iMeta · doi:10.1002/imt2.70054 · Cited by 43
Metabolomics and metabolites in cancer diagnosis and treatment
Cai, M., Liu, H., Shao, C., Li, T., Jin, J., Liang, Y., Wang, J., Cao, J., Yang, B. K., He, Q., et al. (2025) · Molecular Biomedicine · doi:10.1186/s43556-025-00362-8 · Cited by 34
“Tools including MetaboAnalyst, MetExplore, PaintOmics, OmicsNet [168], MixOmics [169], and Cytoscape can construct metabolic networks and integrate additional omics layers.”
Lemmel, F., Maunoury‐Danger, F., Fanesi, A., Leyval, C., & Cébron, A. (2018) · Microbial Ecology · doi:10.1007/s00248-018-1297-7 · Cited by 35
An Integrative Multi-Omics Workflow to Address Multifactorial Toxicology Experiments
González‐Ruiz, V., Schvartz, D., Sandström, J., Pezzatti, J., Jeanneret, F., Tonoli, D., Boccard, J., Monnet‐Tschudi, F., Sanchez, J., & Rudaz, S. L. (2019) · Metabolites · doi:10.3390/metabo9040079 · Cited by 30
Angelova, A. G., Ellis, G. A., Wijesekera, H. W., & Vora, G. J. (2019) · Frontiers in Microbiology · doi:10.3389/fmicb.2019.02738 · Cited by 30
“, 2018); differential analysis between samples: “MixOmics” and “metagenomeSeq” (González et al., 2012; Paulson et al., 2013; Rohart et al., 2017).”
BackgroundAdyari, B., Izabel‐Shen, D., Li, S., Zhang, L., Rashid, A., Sun, Q., Hu, A., Chen, N., & Yu, C. (2020) · The Science of The Total Environment · doi:10.1016/j.scitotenv.2020.137767 · Cited by 30
Poirier, S., Dejean, S., Midoux, C., Cao, K. L., & Chapleur, O. (2020) · Bioresource Technology · doi:10.1016/j.biortech.2020.123952 · Cited by 35
Hisert, K. B., Birkland, T. P., Schoenfelt, K. Q., Long, M. E., Grogan, B., Carter, S., Liles, W. C., McKone, E. F., Becker, L., Manicone, A. M., et al. (2020) · Frontiers in Pharmacology · doi:10.3389/fphar.2020.01219 · Cited by 34
“Since each subject was assessed twice (day 0, day 7), we used a multilevel decomposition for repeated measures as implemented by the “ mixOmics ” package in R statistical environment (Rohart et al., 2017).”
Chan, H. W., Yang, B., Wong, W., Blakeley, P., Seah, I. Y. J., Tan, Q. S. W., Wang, H., Bhargava, M., Lin, H. A., Chai, C., et al. (2020) · Journal of Clinical Medicine · doi:10.3390/jcm9092920 · Cited by 31
“The mixOmics implementation [33,34] of the Sparse Projection to Latent Structures Discriminant Analysis (sPLS-DA) algorithm was used to identify differential miRNA expression between good, partial, and poor responders.”
MethodSaladié, M., Caparros-Martin, J. A., Agudelo‐Romero, P., Wark, P. A. B., Stick, S. M., & O’Gara, F. (2020) · Frontiers in Microbiology · doi:10.3389/fmicb.2020.572504 · Cited by 32
Wei, J., Zhao, L., Du, Y., Tian, Y., Ni, P., Ni, R., Wang, Y., Ma, X., Hu, X., & Li, T. (2021) · Psychiatry Research · doi:10.1016/j.psychres.2021.113880 · Cited by 32
Koch, F., Albrecht, D., Görs, S., & Kuhla, B. (2021) · Scientific Reports · doi:10.1038/s41598-021-92053-x · Cited by 35
Remie, C. M. E., Janssens, G. E., Bilet, L., van Weeghel, M., Duvivier, B. M. F. M., de Wit‐Verheggen, V. H. W., Connell, N. J., Jörgensen, J. A., Schomakers, B. V., Schrauwen‐Hinderling, V. B., et al. (2021) · Diabetologia · doi:10.1007/s00125-021-05558-5 · Cited by 33
Contribution of fruit microbiome to raspberry volatile organic compounds emission
Sangiorgio, D., Cellini, A., Spinelli, F., Pastore, C., Farneti, B., Savioli, S., Rodríguez‐Estrada, M. T., & Donati, I. (2021) · Postharvest Biology and Technology · doi:10.1016/j.postharvbio.2021.111742 · Cited by 30
Beaumont, M., Lencina, C., Painteaux, L., Viémon-Desplanque, J., Phornlaphat, O., Lambert, W., & Chalvon‐Demersay, T. (2021) · Amino Acids · doi:10.1007/s00726-021-03082-9 · Cited by 35
Mathematical-based microbiome analytics for clinical translation
Narayana, J. K., Aogáin, M. M., Goh, W. W. B., Xia, K., Tsaneva-Atanasova, K. T., & Chotirmall, S. H. (2021) · Computational and Structural Biotechnology Journal · doi:10.1016/j.csbj.2021.11.029 · Cited by 32
“DIABLO is a supervised multi-omics integration strategy developed as part of the mixOmics framework [30] .”
MethodVarotto, S., Krugman, T., Cigliano, R. A., Kashkush, K., Kondić‐Špika, A., Aravanopoulos, F. A., Pradillo, M., Consiglio, F., Aversano, R., Pečinka, A., et al. (2022) · Theoretical and Applied Genetics · doi:10.1007/s00122-022-04122-y · Cited by 34
Companys, J., Calderón-Pérez, L., Pla‐Pagà, L., Llauradó, E., Sandoval-Ramírez, B. A., Gosalbes, M. J., Arregui, A., Barandiaran, M., Caimari, A., Bas-Prior, J. M. D., et al. (2022) · European Journal of Nutrition · doi:10.1007/s00394-022-02904-0 · Cited by 35
“The associations between dietary nutrients or clinical variables and microbiota composition, at ASV level, was evaluated using sparse partial least square (sPLS), a multivariant method implemented in ‘mixOmics’ R package [34].”
MethodInteractions among the mycobiome, bacteriome, inflammation, and diet in people living with HIV
Gosalbes, M. J., Jiménez‐Hernández, N., Moreno, E., Artacho, A., Pons, X., Ruíz-Pérez, S., Navia, B., Estrada, V., Manzano, M., Talavera-Rodríguez, A., et al. (2022) · Gut Microbes · doi:10.1080/19490976.2022.2089002 · Cited by 31
“To assess potential interactions between compositional data and clinical or diet features, we use mixOmics package in R.(54) We compute pairwise associations between features based on sparse Partial Least Square (sPLS) models that are very flexible models allowing large number of quantitative variables to be associate…”
MethodLung microbial-host interface through the lens of multi-omics
Singh, S., Natalini, J. G., & Segal, L. N. (2022) · Mucosal Immunology · doi:10.1038/s41385-022-00541-8 · Cited by 32
Lokesh, J., Ghislain, M., Reyrolle, M., Béchec, M. L., Pigot, T., Terrier, F., Roy, J., Panserat, S., & Ricaud, K. (2021) · Aquaculture · doi:10.1016/j.aquaculture.2022.738699 · Cited by 35
Intestinal Flora Disruption and Novel Biomarkers Associated With Nasopharyngeal Carcinoma
Jiang, H., Li, J., Zhang, B., Huang, R., Zhang, J., Chen, Z., Shang, X., Li, X., & Nie, X. (2019) · Frontiers in Oncology · doi:10.3389/fonc.2019.01346 · Cited by 34
Malta, M. R., Fassio, L. D. O., Liska, G. R., Carvalho, G. R., Pereira, A. A., Botelho, C. E., Ferraz, V. P., Silva, A. D., Pedrosa, A. W., Alvaro, L. N., et al. (2020) · Food Research International · doi:10.1016/j.foodres.2020.109219 · Cited by 30
Gouveia, D., Pible, O., Culotta, K., Jouffret, V., Geffard, O., Chaumot, A., Esposti, D. D., & Armengaud, J. (2020) · npj Biofilms and Microbiomes · doi:10.1038/s41522-020-0133-2 · Cited by 30
Conley, T. E., Slater, R., Moss, S., Bulmer, D. C., Negro, J. D. L. R., Ijaz, U. Z., Pritchard, D. M., Parkes, M., & Probert, C. S. (2024) · EBioMedicine · doi:10.1016/j.ebiom.2024.105282 · Cited by 34
Azeem, I., Wang, Q., Adeel, M., Shakoor, N., Zain, M., Khan, A., Li, Y., Azeem, K., Nadeem, M. A., Zhu, G., et al. (2024) · Journal of Hazardous Materials · doi:10.1016/j.jhazmat.2024.136062 · Cited by 30
Ordóñez-Díaz, J. L., Pereira‐Caro, G., Ludwig, I. A., Muñoz–Redondo, J. M., Ruiz‐Moreno, M. J., Crozier, A., & Moreno‐Rojas, J. M. (2018) · Journal of Chromatography A · doi:10.1016/j.chroma.2018.09.016 · Cited by 29
Metzler-Zebeli, B. U., Siegerstetter, S.-C., Magowan, E. A., Lawlor, P. G., O’Connell, N. E., & Zebeli, Q. (2019) · Metabolites · doi:10.3390/metabo9020038 · Cited by 30
Capsaicin alleviates lipid metabolism disorder in high beef fat-fed mice
Li, W., Yang, H., & Lu, Y. (2019) · Journal of Functional Foods · doi:10.1016/j.jff.2019.103444 · Cited by 29
Ndika, J., Seemab, U., Poon, W.-L., Fortino, V., El-Nezami, H. S., Karisola, P., & Alenius, H. T. (2019) · Nanotoxicology · doi:10.1080/17435390.2019.1661040 · Cited by 30
“Interdependencies between THP-1 transcriptome (mRNA/lncRNA) and miRnome (miRNA/isomir) were detected via regularized canonical correlation analysis between the transcriptome and miRnome datasets using the R-based mixOmics package (Rohart et al. 2017).”
MethodLongitudinal metabolic and gut bacterial profiling of pregnant women with previous bariatric surgery
West, K., Kanu, C., Maric, T., McDonald, J. A. K., Nicholson, J. K., Li, J. V., Johnson, M. R., Holmes, E. C., & Savvidou, M. D. (2020) · Gut · doi:10.1136/gutjnl-2019-319620 · Cited by 33
“25 This is a multi-block latent variable-based approach which aims to identify concordance between multiple data sets.”
An application of compositional data analysis to multiomic time-series data
Sisk-Hackworth, L., & Kelley, S. T. (2020) · NAR Genomics and Bioinformatics · doi:10.1093/nargab/lqaa079 · Cited by 29
“transformed and the clr-transformed datasets using the mixOmics DIABLO framework, an integrative, multivariate method for multiomics classification (25).”
MethodVelasco-Galilea, M., Guivernau, M., Piles, M., Viñas, M., Rafel, O., Sánchez, A., Ramayo‐Caldas, Y., González-Rodríguez, O., & Sánchez, J. P. (2020) · Animal Microbiome · doi:10.1186/s42523-020-00059-z · Cited by 32
“This approach was implemented through the R package “mixOmics” [57].”
MethodRahi, S., Mobli, H., Jamshidi, B., Azizi, A., & Sharifi, M. (2020) · Postharvest Biology and Technology · doi:10.1016/j.postharvbio.2020.111413 · Cited by 31
Biomarkers associated with cheese quality uncovered by integrative multi-omic analysis
Afshari, R., Pillidge, C. J., Dias, D. A., Osborn, A. M., & Gill, H. (2020) · Food Control · doi:10.1016/j.foodcont.2020.107752 · Cited by 32
Yap, P. S. X., Chong, C. W., Kamar, A. A., Yap, I. K. S., Choo, Y. M., Lai, N. M., & Teh, C. S. J. (2021) · Scientific Reports · doi:10.1038/s41598-020-80278-1 · Cited by 36
Peltanová, B., Liskova, M., Gumulec, J., Raudenská, M., Polanska, H. H., Vaculovič, T., Kalfeřt, D., Grega, M., Plzák, J., Betka, J., et al. (2021) · International Journal of Molecular Sciences · doi:10.3390/ijms22041912 · Cited by 29
Dhariwal, A., Junges, R., Chen, T., & Petersen, F. C. (2021) · NAR Genomics and Bioinformatics · doi:10.1093/nargab/lqab018 · Cited by 34
“They 15 are implemented primarily based on the R mixOmics package [64].”
MethodSharma, A., Chauhan, R., Kumar, R., Mankotia, P., Verma, R., & Sharma, V. (2021) · Spectrochimica Acta Part A Molecular and Biomolecular Spectroscopy · doi:10.1016/j.saa.2021.119803 · Cited by 31
Plasma Metabolomics of Intermediate and Neovascular Age-Related Macular Degeneration Patients
Mitchell, S. L., Ma, C., Scott, W. K., Agarwal, A., Pericak‐Vance, M. A., Haines, J. L., Jones, D. P., Uppal, K., & Brantley, M. A. (2021) · Cells · doi:10.3390/cells10113141 · Cited by 37
“Following data preprocessing and filtering, partial least-squares discriminant analysis (PLS-DA) was performed with the R package mixOmics [34] to identify discriminating metabolites.”
MethodScheithauer, T. P. M., Davids, M., Winkelmeijer, M., Verdoes, X., Aydin, Ö., de Brauw, M., van de Laar, A. W. J. M., Meijnikman, A. S., Gerdes, V. E. A., van Raalte, D. H., et al. (2022) · Gut Microbes · doi:10.1080/19490976.2022.2031696 · Cited by 29
Epigenetic basis of oncogenic-Kras-mediated epithelial-cellular proliferation and plasticity
Murthy, P. K. L., Xi, R., Mendoza, D. A., Everitt, J. I., Koçak, D. D., Kobayashi, Y., Bözec, A., Vicent, S., Ding, S., Crawford, G. E., et al. (2022) · Developmental Cell · doi:10.1016/j.devcel.2022.01.006 · Cited by 31
Floc'H, N. L., Achard, C. S., Eugenio, F. A., Apper, E., Combes, S., & Quesnel, H. (2022) · Journal of Animal Science · doi:10.1093/jas/skac209 · Cited by 34
Facchin, S., Calgaro, M., Pandolfo, M., Caldart, F., Ghisa, M., Greco, E., Sattin, E., Valle, G., Dellon, E. S., Vitulo, N., et al. (2022) · Alimentary Pharmacology & Therapeutics · doi:10.1111/apt.17091 · Cited by 30
Shah, A., Kang, S., Talley, N. J., Do, A., Walker, M. M., Shanahan, E. R., Koloski, N. A., Jones, M., Keely, S., Morrison, M., et al. (2022) · Gut Microbes · doi:10.1080/19490976.2022.2132078 · Cited by 31
Sørensen, L., Schaufelberger, S., Igartua, A., Størseth, T. R., & Øverjordet, I. B. (2022) · The Science of The Total Environment · doi:10.1016/j.scitotenv.2022.161056 · Cited by 29
Brinkmann, I., Schweizer, M., Singer, D., Quinchard, S., Barras, C., Bernhard, J. M., & Filipsson, H. L. (2023) · Journal of Eukaryotic Microbiology · doi:10.1111/jeu.12975 · Cited by 31
“Sparse Partial Least Squares (sPLS) regression model (mixOmics v. 6.12.2; Lê Cao et al., 2008; Rohart et al., 2017) was performed and visualized with the cim function to assess correlations between taxa and recorded environmental conditions (correlation of r < −0.5 or r > 0.5 to at least one tested…”
MethodInfluentialSelig, M., Poehlman, L., Lang, N. C., Voelker, M., Rolauffs, B., & Hart, M. L. (2024) · Frontiers in Immunology · doi:10.3389/fimmu.2023.1336393 · Cited by 36
“The CIM and PLS-DA analyses were performed with the “ mixOmics ” (46) package in “ R ” .”
MethodFernandes, J., Chandler, J. D., Lili, L. N., Uppal, K., Hu, X. Y., Li, H., Go, Y., & Jones, D. P. (2019) · Frontiers in Genetics · doi:10.3389/fgene.2019.00676 · Cited by 31
“To identify differentially expressed genes contributing most to separation by Mn treatment groups categorically, PLS-DA (partial least-square discriminant analysis) was performed using MetaboAnalyst (Xia and Wishart, 2016) and PLS-DA function in R package mixOmics (Rohart et al., 2017).”
MethodLong-term simulated microgravity alters gut microbiota and metabolome in mice
Lu, Y., Zhang, R., Li, X., Gao, C., Hu, X., Hussain, S., Zhang, L., Wang, M., Ma, X., Pan, Q., et al. (2023) · Frontiers in Microbiology · doi:10.3389/fmicb.2023.1100747 · Cited by 29
“Statistical analyses were performed using the statistical software (Rohart et al., 2017).”
Methodde Voorde, D. V., Díaz-Muñoz, C., Hernandez, C. E., Weckx, S., & Vuyst, L. D. (2023) · Frontiers in Microbiology · doi:10.3389/fmicb.2023.1232323 · Cited by 30
“Finally, correlations between the microorganisms and metabolites identified throughout the CFPs performed were assessed by constructing correlation matrices with the mixOmics package (version 6.14.1; Rohart et al., 2017).”
MethodInfluentialSen, M. K., Bhattacharya, S., Bharati, R., Hamouzová, K., & Soukup, J. (2023) · Frontiers in Plant Science · doi:10.3389/fpls.2023.1280118 · Cited by 31
Bouranis, J. A., Beaver, L. M., Wong, C. P., Choi, J., Hamer, S., Davis, E. W., Brown, K., Jiang, D., Sharpton, T. J., Stevens, J. F., et al. (2023) · Molecular Nutrition & Food Research · doi:10.1002/mnfr.202300286 · Cited by 30
Valdés‐Hernández, J., Folch, J. M., Crespo‐Piazuelo, D., Passols, M., Sebastià, C., Criado‐Mesas, L., Castelló, A., Sánchez, A., & Ramayo‐Caldas, Y. (2024) · Genetics Selection Evolution · doi:10.1186/s12711-024-00882-x · Cited by 35
“A better understanding of biological mechanisms that underlie complex traits requires integrative approaches via gene networks [10], as well as the identification of the main regulators driving gene-by-gene interactions [11].”
BackgroundEffective data visualization strategies in untargeted metabolomics
Mildau, K., Ehlers, H., Meisenburg, M., Pup, E. D., Koetsier, R. A., Ortega, L. R. T., Jonge, N. D., Singh, K. S., Ferreira, D., Othibeng, K., et al. (2025) · Natural Product Reports · doi:10.1039/d4np00039k · Cited by 33
β-hydroxybutyrate is a metabolic regulator of proteostasis in the aged and Alzheimer disease brain
Madhavan, S. S., Diaz, S. R., Peralta, S., Nomura, M., King, C. D., Ceyhan, K. E., Lin, A., Bhaumik, D., Foulger, A., Shah, S., et al. (2024) · Cell chemical biology · doi:10.1016/j.chembiol.2024.11.001 · Cited by 30
Aya, V., Pardo-Rodriguez, D., Vega, L. C., Cala, M. P., & Ramírez, J. D. (2025) · Scientific Reports · doi:10.1038/s41598-025-98973-2 · Cited by 30
“Methods such as mixOmics 74 offer powerful techniques for dimension reduction and feature selection, which may enhance the integration of multi-omics datasets.”
Systematic analysis of the cerebrospinal fluid proteome of fibromyalgia patients
Khoonsari, P. E., Musunri, S., Herman, S., Svensson, C. I., Tanum, L., Gordh, T., & Kultima, K. (2018) · Journal of Proteomics · doi:10.1016/j.jprot.2018.04.014 · Cited by 37
Insights into respiratory disease through bioinformatics
Hurgobin, B., de Jong, E., & Bosco, A. (2018) · Respirology · doi:10.1111/resp.13401 · Cited by 30
Cádiz‐Gurrea, M. D. L. L., Zengin, G., Kayacık, O., Lobine, D., Mahomoodally, M. F., Leyva‐Jiménez, F. J., & Segura‐Carretero, A. (2019) · Journal of the Science of Food and Agriculture · doi:10.1002/jsfa.9875 · Cited by 30
Daniels, J. R., Cao, Z., Maisha, M. P., Schnackenberg, L. K., Sun, J., Pence, L. M., Schmitt, T. C., Kamlage, B., Rogstad, S., Beger, R. D., et al. (2019) · Journal of Proteome Research · doi:10.1021/acs.jproteome.9b00320 · Cited by 29
Wei, J., Gao, H., Yang, Y., Liu, H., Yu, H., Chen, Z., & Dong, B. (2020) · Animal Microbiome · doi:10.1186/s42523-020-00048-2 · Cited by 28
“Metabolic pathways that discriminated between seasons and habitats were identified using sparse partial least squares discriminant analysis (sPLSDA) implemented in the mixOmics R package [68].”
MethodEffect of milk replacer allowance on calf faecal bacterial community profiles and fermentation
Kumar, S., Khan, M. A., Beijer, E., Liu, J., Lowe, K. K., Young, W., Mills, D. A., & Moon, C. D. (2021) · Animal Microbiome · doi:10.1186/s42523-021-00088-2 · Cited by 33
“using the MixOmics R package [45] to correlate microbiome community structures with parameters associated with calf growth and performance [18], and faecal SCFA data.”
MethodDurán-Soria, S., Pott, D. M., Will, F., Mesa‐Marín, J., Lewandowski, M., Celejewska, K., Masny, A., Żurawicz, E., Jennings, N., Sønsteby, A., et al. (2021) · Metabolites · doi:10.3390/metabo11080490 · Cited by 28
“Indeed, sPLS-DA is a supervised method, which focuses on class separation and additionally allows variable selection [37].”
MethodDysregulation of Human Somatic piRNA Expression in Parkinson’s Disease Subtypes and Stages
Zhang, T., & Wong, G. (2022) · International Journal of Molecular Sciences · doi:10.3390/ijms23052469 · Cited by 29
“We used package mixOmics [101] to complete the processes mentioned above.”
MethodCurtis, B. J., Niemuth, N. J., Bennett, E. A., Schmoldt, A., Mueller, O., Mohaimani, A. A., Laudadio, E. D., Shen, Y. J., White, J. C., Hamers, R. J., et al. (2022) · Nature Nanotechnology · doi:10.1038/s41565-022-01096-2 · Cited by 29
Tiwari, M., Singh, B. P., Min, D., & Jagadish, S. V. K. (2022) · Frontiers in Plant Science · doi:10.3389/fpls.2022.813985 · Cited by 33
Velsko, I. M., Semerau, L., Inskip, S. A., Collado, M. I. G., Ziesemer, K. A., Ruber, M. S., Enrich, L. B. D. L., García, J. M., Valle, D. G., Ruiz, C. P., et al. (2022) · PNAS Nexus · doi:10.1093/pnasnexus/pgac148 · Cited by 31
“A PCA was calculated in R on an unfiltered CLR-transformed species table using the package mixOmics (96).”
Nguyen, N., Pawłowska, J., Angeles, I. B., Zajączkowski, M., & Pawlowski, J. W. (2022) · Geobiology · doi:10.1111/gbi.12530 · Cited by 31
“Finally, sparse partial least squares (sPLS) regression, available in the mixOmics package (Le Cao et al., 2008; Rohart et al., 2017), was used for the multivariate analysis of the combined foraminiferal datasets at ASVs level to identify ASVs that were more predictive of the observed environmental…”
MethodInterplay between Cruciferous Vegetables and the Gut Microbiome: A Multi-Omic Approach
Bouranis, J. A., Beaver, L. M., Jiang, D., Choi, J., Wong, C. P., Davis, E. W., Williams, D. E., Sharpton, T. J., Stevens, J. F., & Ho, E. (2022) · Nutrients · doi:10.3390/nu15010042 · Cited by 32
So, D., Yao, C. K., Gill, P. A., Thwaites, P. A., Ardalan, Z. S., McSweeney, C. S., Denman, S. E., Chrimes, A. F., Muir, J. G., Berean, K. J., et al. (2023) · Alimentary Pharmacology & Therapeutics · doi:10.1111/apt.17629 · Cited by 29
Fonseca, P. A. D. S., Lam, S., Chen, Y., Waters, S. M., Guan, L. L., & Cánovas, Á. (2023) · Scientific Reports · doi:10.1038/s41598-023-43097-8 · Cited by 37
Yeoh, Y. K., Chen, Z., Hui, M., Wong, M. C. S., Ho, W. C. S., Chin, M. L., Ng, S. C., Chan, F. K. L., & Chan, P. K. S. (2019) · PeerJ · doi:10.7717/peerj.6172 · Cited by 29
Early genistein exposure of California mice and effects on the gut microbiota–brain axis
Marshall, B. L., Liu, Y., Farrington, M. J., Mao, J., Helferich, W. G., Schenk, A. K., Bivens, N. J., Sarma, S. J., Lei, Z., Sumner, L. W., et al. (2019) · Journal of Endocrinology · doi:10.1530/joe-19-0214 · Cited by 31
“To correlate the gut microbiota changes with gut metabolome and behavioral results, we used the mixOmics R package (Rohart et al. 2017).”
Hajjar, I. M., Liu, C., Jones, D. P., & Uppal, K. (2020) · Alzheimer s & Dementia Diagnosis Assessment & Disease Monitoring · doi:10.1002/dad2.12064 · Cited by 30
“MetaboliteannotationandidentificationwasperformedusingMS/MS, comparison with in-house library of confirmed metabolites, and using xMSannotator 33 with the Human Metabolome Database 34 (HMDB).”
MethodUwimana, B., Zorrilla-Fontanesi, Y., van Wesemael, J., Mduma, H., Brown, A., Carpentier, S., & Swennen, R. L. (2020) · Agronomy · doi:10.3390/agronomy11010004 · Cited by 28
“Principle components analysis (PCA) was used as a blind multivariate analysis to maximize explained variance by creating artificial variables (components) which are linear combinations of the predictor variables (early plant growth parameters) by using the mixOmics R-package [50].”
MethodLappa, D., Meijnikman, A. S., Krautkramer, K. A., Olsson, L. M., Aydin, Ö., van Rijswijk, A.-S., Acherman, Y. I. Z., de Brauw, M. L., Tremaroli, V., Olofsson, L. E., et al. (2023) · PLoS ONE · doi:10.1371/journal.pone.0279335 · Cited by 28
“5033) through the package of mixOmics [55] (version6.”
MethodMichiels, J., Truffin, D., Majdeddin, M., Poucke, M. V., Liefferinge, E. V., Noten, N. V., Vandaele, M., Kerschaver, C. V., Degroote, J., Peelman, L. J., et al. (2023) · Porcine Health Management · doi:10.1186/s40813-023-00305-1 · Cited by 29
Baghdadi, M., Nespital, T., Monzó, C., Deelen, J., Grönke, S., & Partridge, L. (2024) · Molecular Metabolism · doi:10.1016/j.molmet.2024.101902 · Cited by 29
“22.0 [80].”
InfluentialSha, H., Lü, J., Chen, J., & Xiong, J. (2024) · npj Biofilms and Microbiomes · doi:10.1038/s41522-024-00509-5 · Cited by 29
“Amultivariatedimensionreductiondiscriminantanalysis,DIABLOwas usedtoidentifybiologicallyrelevantandhighlycorrelatedsignatures fromvariousOMICsdatausingpackage “ mixOmics ” 68 .”
A comprehensive multi-omics analysis reveals unique signatures to predict Alzheimer’s disease
Vacher, M. A., Cánovas, R., Laws, S. M., & Doecke, J. D. (2024) · Frontiers in Bioinformatics · doi:10.3389/fbinf.2024.1390607 · Cited by 30
“As further elaborated in Singh et al. (2019), the weightings de fi ned in the design matrix plays an important role in the model ’ s abilities and functions.”
BackgroundMethodInfluentialInteraction of plant-derived metabolites and rhizobiome functions enhances drought stress tolerance
Kazarina, A., Sarkar, S., Adams, B., Vogt, B., Rodela, L., Pogranichniy, S., Powell, S., Wiechman, H., Heeren, L., Reese, N., et al. (2025) · Genome biology · doi:10.1186/s13059-025-03778-1 · Cited by 32
“We used the DIABLO framework (Data Integration Analysis for Biomarker discovery using Latent cOmponents) from the mixOmics R package to identify key correlations between host metagenomic datasets [197–200].”
Bourdon, C., Lelijveld, N., Thompson, D. S., Dalvi, P. S., Gonzales, G. B., Wang, D., Alipour, M., Wine, E., Chimwezi, E., Wells, J. C. K., et al. (2019) · EBioMedicine · doi:10.1016/j.ebiom.2019.06.041 · Cited by 31
“Metabolites and proteins were analysed if above the limit of detection (LOD) in 80% of samples in at least one experimental group; and the remaining concentrations below the LODwere set to half the LOD [17].”
BackgroundMethodGosselt, H. R., Muller, I. B., Jansen, G., van Weeghel, M., Vaz, F. M., Hazes, J. M. W., Heil, S. G., & de Jonge, R. (2020) · Journal of Personalized Medicine · doi:10.3390/jpm10040271 · Cited by 35
Similarity-driven multi-view embeddings from high-dimensional biomedical data
Avants, B., Tustison, N. J., & Stone, J. R. (2021) · Nature Computational Science · doi:10.1038/s43588-021-00029-8 · Cited by 29
Na, H. S., Kim, S., Kim, S., Yu, Y., Kim, S. Y., Kim, H., Lee, J. Y., Lee, J., & Chung, J. (2021) · Journal of Oral Microbiology · doi:10.1080/20002297.2021.1902707 · Cited by 27
“Correlations between the relative abundance of microbes and metabolites were analyzed by sparse partial least squares (sPLS) regression analysis using the mixOmics package for R [21].”
MethodBories, P., Rikardsen, A. H., Leonards, P. E. G., Fisk, A. T., Tartu, S., Vogel, E. F., Bytingsvik, J., & Blévin, P. (2021) · Ecology and Evolution · doi:10.1002/ece3.7523 · Cited by 31
“We first performed a partial least-squares discriminant analysis (PLS-DA) on the lipidome using the "mix.omics" R package (Rohart et al., 2017) and tested for potential species clustering using the MANOVA Pillai's trace test from the "car" R package (Fox & Weisberg, 2019).”
MethodCrisóstomo, L., Videira, R. A., Jarak, I., Starčević, K., Mašek, T., Rato, L., Raposo, J. F., Batterham, R. L., Oliveira, P. F., & Alves, M. G. (2021) · Molecular Nutrition & Food Research · doi:10.1002/mnfr.202100680 · Cited by 30
Wang, X., Jin, M., Cheng, X., Hu, X., Zhao, M., Yuan, Y., Sun, P., Jiao, L., Tocher, D. R., & Zhou, Q. (2022) · Aquaculture · doi:10.1016/j.aquaculture.2022.737903 · Cited by 27
Rocher, F., Alouane, T., Philippe, G., Martin‐Magniette, M., Label, P., Langin, T., & Bonhomme, L. (2022) · International Journal of Molecular Sciences · doi:10.3390/ijms23031914 · Cited by 41
Yu, S., Liu, C., Hou, Y., Li, J., Guo, Z., Chen, X., Zhang, L., Peng, S., Hong, S., Xu, L., et al. (2022) · Oncogene · doi:10.1038/s41388-022-02254-5 · Cited by 29
“PLS-DA was performed using R package mixOmics [50].”
Method
Metadata
- Authors
- Rohart, F., Gautier, B., Singh, A., & Lê Cao, K.-A.
- Affiliations
- Translational Research Institute (AU)
- University of British Columbia (CA)
- Venue
- PLOS Computational Biology
- Publisher
- Public Library of Science (PLoS)
- Published
- 2017-11-03
- Volume
- 13
- Issue
- 11
- Pages
- e1005752
- ISSN
- 1553-734X (ISSN-L)
- 1553-7358
- PMC
- PMC5687754
- OpenAlex
- W2950985821
- Cited by
- 4,056
- References
- 57
- Citations by year
- 2026: 629 · 2025: 612 · 2024: 600 · 2023: 523 · 2022: 496 · 2021: 489 · 2020: 350 · 2019: 241 · 2018: 95 · 2017: 14
- FWCI
- 78.13
- Type
- journal article
- Language
- en
- Update notices
- new_version (2017-11-15)
- Open access
- gold
- doi.org
- Licence
- Locations
- PLoS Computational Biology (publishedVersion, cc-by)
- bioRxiv (Cold Spring Harbor Laboratory) (acceptedVersion, cc-by-nc-nd)
- PubMed Central (publishedVersion, cc-by)
- PubMed (publishedVersion)
- Minerva Access (University of Melbourne) (submittedVersion, cc-by)
- RePEc: Research Papers in Economics (submittedVersion)
- DOAJ (DOAJ: Directory of Open Access Journals) (submittedVersion, cc-by-sa)
- Figshare (submittedVersion, cc-by)
- Funders
- National Health and Medical Research Council (APP1087415)
- Australian Cancer Research Foundation (ACRF) for the Diamantina Individualised Oncology Care Centre
- Topics
- Life Sciences › Biochemistry, Genetics and Molecular Biology › Molecular Biology › Bioinformatics and Genomic Networks
- Life Sciences › Biochemistry, Genetics and Molecular Biology › Molecular Biology › Metabolomics and Mass Spectrometry Studies
- Life Sciences › Biochemistry, Genetics and Molecular Biology › Molecular Biology › Gene expression and cancer classification
- Keywords
- R package, multi-omics integration, feature selection, multivariate analysis, dimensionality reduction, partial least squares regression, discriminant analysis, molecular signatures, systems biology, transcriptomics, proteomics, metabolomics, exploratory data analysis
- MeSH terms
- Data Interpretation, Statistical, Humans, Neoplasms, Software, Computational Biology, Genomics, Systems Biology, Metabolomics
About these checks
Registry, retraction, Cites and statistics results are computed, not judged, with one exception: a printed reference that no index lists is read once by a model before it counts as a citation error. Claims are extracted by a model and kept only when their quote appears verbatim in the text; each cited source is then checked, with a model’s help, for whether it says what the claim relies on. Those verdicts can be wrong — read the claim’s quote and the cited source before relying on one.
Statistics and arithmetic are recomputed, not judged.
Confidence bands are shown only for fields calibrated on our annotated test set. None is calibrated yet, so no band is shown.
What counts as a claim ›How we measure confidence ›How we check this ›
Are you an author, or do you see a problem with this page? Request a review
Data sources
Bibliographic data: Semantic Scholar, OpenAlex, Crossref.
Contains information from the Semantic Scholar Academic Graph Datasets, made available under the ODC Attribution License (ODC-BY 1.0).
Semantic Scholar’s data is described in: Kinney, R., et al. (2023). The Semantic Scholar Open Data Platform. arXiv:2301.10140.
