

mixOmics: An R package for ‘omics feature selection and multiple data integration
Open accessPublished version of a preprint
The DOI matches its Crossref record; 58 of the 58 references it cites were found in a registry or an index.
Abstract
The advent of high throughput technologies has led to a wealth of publicly available 'omics data coming from different sources, such as transcriptomics, proteomics, metabolomics. Combining such large-scale biological data sets can lead to the discovery of important biological insights, provided that relevant information can be extracted in a holistic manner. Current statistical approaches have been focusing on identifying small subsets of molecules (a 'molecular signature') to explain or predict biological conditions, but mainly for a single type of 'omics. In addition, commonly used methods are univariate and consider each biological feature independently. We introduce mixOmics, an R package dedicated to the multivariate analysis of biological data sets with a specific focus on data exploration, dimension reduction and visualisation. By adopting a systems biology approach, the toolkit provides a wide range of methods that statistically integrate several data sets at once to probe relationships between heterogeneous 'omics data sets. Our recent methods extend Projection to Latent Structure (PLS) models for discriminant analysis, for data integration across multiple 'omics data or across independent studies, and for the identification of molecular signatures. We illustrate our latest mixOmics integrative frameworks for the multivariate analyses of 'omics data available from the package.
Overview
The claims and statistics of this paper haven’t been checked yet.
Free: it reads the open-access text and checks the first 5 claims that cite a source we can check. Create a free account to check every claim.
Integrity signals
Registry
Cites
Statistics
Figures



Verification
Claims the paper makes
The claims and statistics of this paper haven’t been checked yet.
Free: it reads the open-access text and checks the first 5 claims that cite a source we can check. Create a free account to check every claim.
Self-check
Percentages, sums and reported differences re-computed from the paper’s own numbers.
The self-check needs the paper’s full text.
Citations
Cites
R: A Language and Environment for Statistical Computing
R Core Team (2025) · doi:10.32614/r.manuals · Cited by 352,181
Regression shrinkage and selection via the lasso
Tibshirani, R. (1996) · Journal of the Royal Statistical Society Series B: Statistical Methodology · doi:10.1111/j.2517-6161.1996.tb02080.x · Cited by 51,482 · cited 1×
“Feature selection is performed via l1 regularisation (LASSO, [27]), which is implemented into each method’s statistical criterion to be optimised.”
MethodRegularization Paths for Generalized Linear Models via Coordinate Descent
Friedman, J., Hastie, T., & Tibshirani, R. (2010) · Journal of Statistical Software · doi:10.18637/jss.v033.i01 · Cited by 19,927 · cited 1×
“glmnet, [38], PMA, [39]), mixOmics uses soft-thresholding to improve usability by replacing the l(1) parameter by the number keepX of features to select on each dimension.”
MethodEnterotypes of the human gut microbiome
MetaHIT Consortium (additional members), Arumugam, M., Raes, J., Pelletier, E., Le Paslier, D., Yamada, T., Mende, D. R., Fernandes, G. R., Tap, J., Bruls, T., et al. (2011) · Nature · doi:10.1038/nature09944 · Cited by 7,548
Partial least squares for discrimination
Barker, M., & Rayens, W. (2003) · Journal of Chemometrics · doi:10.1002/cem.785 · Cited by 2,841
Khan, J., Wei, J. S., Ringnér, M., Saal, L. H., Ladanyi, M., Westermann, F., Berthold, F., Schwab, M., Antonescu, C. R., Peterson, C., et al. (2001) · Nature Medicine · doi:10.1038/89044 · Cited by 2,644 · cited 2×
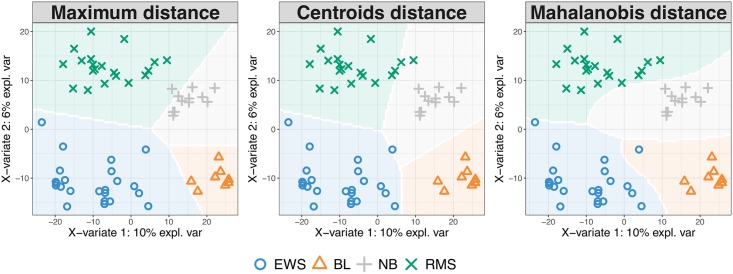
“The study investigates Small Round Blue Cell Tumors (SRBCT, [35]) of 63 tumour samples with the expression levels of 2,308 genes.”
BackgroundMethodLê Cao, K.-A., Boitard, S., & Besse, P. (2011) · BMC Bioinformatics · doi:10.1186/1471-2105-12-253 · Cited by 1,007 · cited 3×
“In single ‘omics analyses this distance achieves best accuracy when the predicted values are close to 0 or 1 [10].”
BackgroundMethodInfluentialPlankton networks driving carbon export in the oligotrophic ocean
Guidi, L., Chaffron, S., Bittner, L., Eveillard, D., Larhlimi, A., Roux, S., Darzi, Y., Audic, S., Berline, L., Brum, J. R., et al. (2016) · Nature · doi:10.1038/nature16942 · Cited by 870 · cited 1×
“(2016), Table 3 and factomineR Husson et al. (2017)). However, very few methods propose feature selection, including sparse CCA (pma package Witten et al. (2013)), sparse PLS (spls package, Chung et al.”
MethodTumor classification by partial least squares using microarray gene expression data
Nguyen, D. V., & Rocke, D. M. (2002) · Bioinformatics · doi:10.1093/bioinformatics/18.1.39 · Cited by 816 · cited 1×
“The assessment is data-driven and similar to the process detailed in Rohart et al. (2016), where one-sided t-tests assess whether there is a gain in performance when adding components to the model.”
MethodPath Models with Latent Variables: The NIPALS Approach
WOLD, H. (1975) · Quantitative Sociology · doi:10.1016/b978-0-12-103950-9.50017-4 · Cited by 802 · cited 1×
“Unsupervised analyses methods include Principal Component Analysis—based on NonLinear Iterative Partial Least Squares for missing values [18], Independent Component Analysis [19], Partial Least Squares regression—PLS, also known as Projection to Latent Structures [20], multi-group PLS [21], regularised Canonical Corre…”
Method
Research works printed but not linked: 3
- A Singh, 2016, DIABLO-an integrative, multi-omics, multivariate method for multi-group classification, bioRxiv, 067611
- F Rohart, 2017, MINT: A multivariate integrative approach to identify a reproducible biomarker signature across multiple experiments and platforms, BMC Bioinformatics, 18
- H Wold, 1966, Estimation of principal components and related models by iterative least squares, J Multivar Anal, 391
Cited by
Items 601–700 of 1,013
A High-Fat Diet Disrupts Nerve Lipids and Mitochondrial Function in Murine Models of Neuropathy
Rumora, A. E., Guo, K., Hinder, L. M., O’Brien, P. D., Hayes, J. M., Hur, J., & Feldman, E. L. (2022) · Frontiers in Physiology · doi:10.3389/fphys.2022.921942 · Cited by 35
Multi-omics profiling reveals rhythmic liver function shaped by meal timing
Huang, R., Chen, J., Zhou, M., Xin, H., Lam, S. M., Jiang, X., Li, J., Deng, F., Shui, G., Zhang, Z., et al. (2023) · Nature Communications · doi:10.1038/s41467-023-41759-9 · Cited by 41
Koopman, J. P. R., Houlder, E. L., Janse, J. J., Casacuberta-Partal, M., Lamers, O. A. C., Sijtsma, J. C., de Dood, C. J., Hilt, S. T., Ozir‐Fazalalikhan, A., Kuiper, V. P., et al. (2023) · EBioMedicine · doi:10.1016/j.ebiom.2023.104832 · Cited by 34
Deek, R. A., Ma, S., Lewis, J., & Li, H. (2024) · eLife · doi:10.7554/elife.88956 · Cited by 44
“Implementation of multiomics CCA and other multivariate techniques are available through the mixOmics package in R ( Rohart et al., 2017 ).”
MethodIonescu, R.-B., Nicaise, A. M., Reisz, J. A., Williams, E. C., Prasad, P., Willis, C. M., Simões-Abade, M. B. C., Sbarro, L., Dzieciatkowska, M., Stephenson, D., et al. (2024) · Cell Stem Cell · doi:10.1016/j.stem.2024.09.014 · Cited by 34
Plant-pathogen interactions: making the case for multi-omics analysis of complex pathosystems
Balotf, S., Wilson, R., Hemmati, R., Eshaghi, M., Wilson, C. R., & Mur, L. A. J. (2025) · Stress Biology · doi:10.1007/s44154-025-00260-7 · Cited by 36
“One notable example of this is the R package mixOm-ics (Rohart et al. 2017) which employs various statistical techniques to analyse and correlate data from different omics layers, making it particularly useful for studying complex biological systems like plant-pathogen interactions.”
Multi‐Omics Signatures of Periodontitis and Periodontal Therapy on the Oral and Gut Microbiome
Baima, G., Dabdoub, S. M., Thumbigere‐Math, V., Ribaldone, D. G., Caviglia, G. P., Tenori, L., Fantato, L., Vignoli, A., Romandini, M., Ferrocino, I., et al. (2025) · Journal of Periodontal Research · doi:10.1111/jre.70055 · Cited by 36
“We used the mixOmics [58] R package (v6.”
Gut microbial-derived indole-3-propionate improves cognitive function in Alzheimer’s disease
Li, L., Jia, M., Yang, C., Zhao, Y., Hu, J., Zhao, Y., Hu, X., Ning, F., Ding, C., Li, Q., et al. (2025) · Science Advances · doi:10.1126/sciadv.adw8410 · Cited by 39
“A multivariate dimension reduction method, DIABLO, was used for multiple omic integration ( 60 , 61 ).”
Vasconi, M., Lopez, A., Galimberti, C., Moreno‐Rojas, J. M., Muñoz–Redondo, J. M., Bellagamba, F., & Moretti, V. M. (2019) · Food Control · doi:10.1016/j.foodcont.2019.03.004 · Cited by 34
Lee, S. C., Tang, M. S., Easton, A. V., Devlin, J. C., Chua, L. L., Cho, I., Moy, F. M., Khang, T. F., Lim, Y. A. L., & Loke, P. (2019) · PLoS Pathogens · doi:10.1371/journal.ppat.1008066 · Cited by 39
“using the withinVariation function from the R mixOmics package [73] and with a one-factor decomposition.”
MethodFunctional colour genes and signals of selection in colour‐polymorphic salamanders
Burgon, J. D., Vieites, D. R., Jacobs, A., Weidt, S. K., Gunter, H. M., Steinfartz, S., Burgess, K. E., Mable, B. K., & Elmer, K. R. (2020) · Molecular Ecology · doi:10.1111/mec.15411 · Cited by 38
Amini, P., Nassiri, S., Malbon, A. J., & Markkanen, E. (2020) · Scientific Reports · doi:10.1038/s41598-020-62354-8 · Cited by 36
HIV Is Associated with Modified Humoral Immune Responses in the Setting of HIV/TB Coinfection
van Woudenbergh, E., Irvine, E. B., Davies, L. R. L., de Kock, M., Hanekom, W. A., Day, C. L., Fortune, S. M., & Alter, G. (2020) · mSphere · doi:10.1128/msphere.00104-20 · Cited by 38
“tuberculosis-specific antibody feature selection, followed by PLS-DA classification using the LASSO-selected features (57, 78).”
MethodHe, Y., Yang, T., Du, Y., Qin, L., Ma, F., Wu, Z., Ling, H., Yang, L., Wang, Z., Zhou, Q., et al. (2020) · Nutrition & Metabolism · doi:10.1186/s12986-020-00456-w · Cited by 36
Bennike, T. B., Fatou, B., Angelidou, A., Diray‐Arce, J., Falsafi, R., Ford, R. L., Gill, E. E., van Haren, S. D., Idoko, O. T., Lee, A. H., et al. (2020) · Frontiers in Immunology · doi:10.3389/fimmu.2020.578505 · Cited by 38
Perry, K. I., Hoekstra, N. C., Culman, S. W., & Gardiner, M. M. (2020) · Urban Ecosystems · doi:10.1007/s11252-020-01069-0 · Cited by 36
“Relevance network analysis was performed in R using the package ‘mixOmics’ (Rohart et al. 2017).”
MethodShannon, C. P., Blimkie, T. M., Ben-Othman, R., Gladish, N., Amenyogbe, N., Drissler, S., Edgar, R. D., Chan, Q. W. T., Krajden, M., Foster, L. J., et al. (2020) · Frontiers in Immunology · doi:10.3389/fimmu.2020.578801 · Cited by 38
Integrative approaches for analysis of mRNA and microRNA high-throughput data
Nazarov, P. V., & Kreis, S. (2021) · Computational and Structural Biotechnology Journal · doi:10.1016/j.csbj.2021.01.029 · Cited by 37
“The method is implemented as a part of a powerful mixOmics R-package, able to integrate results across several omics datasets or derived from different studies [53].”
MethodMach, N., Moroldo, M., Rau, A., Lecardonnel, J., Moyec, L. L., Robert, C., & Barrey, É. (2021) · Frontiers in Molecular Biosciences · doi:10.3389/fmolb.2021.656204 · Cited by 58
“In the case of fecal microbiota, since proportions data have been shown to perform poorly in differential abundance testing and data integration (Rohart et al., 2017), we have instead decided to apply a centered log-ratio (CLR) transformation to the genera count matrix using the mixMC framework of the mixOmics R packa…”
MethodŽibrat, U., Stare, B. G., Knapič, M., Susič, N., Lapajne, J., & Širca, S. (2021) · Remote Sensing · doi:10.3390/rs13101996 · Cited by 35
“Data pre-processing, exploration, and analysis were performed in R [45], using the mixOmics [46], caret [47], and t-SNE [48] packages.”
MethodDoes Organic Farming Increase Raspberry Quality, Aroma and Beneficial Bacterial Biodiversity?
Sangiorgio, D., Cellini, A., Spinelli, F., Farneti, B., Khomenko, I., Muzzi, E., Savioli, S., Pastore, C., Rodríguez‐Estrada, M. T., & Donati, I. (2021) · Microorganisms · doi:10.3390/microorganisms9081617 · Cited by 42
“463), together with the external package “mixOmics” [51], was used for PCA analysis and visualization employed in this work.”
MethodBrands, X., Haak, B. W., Klarenbeek, A. M., Butler, J. M., Uhel, F., Qin, W., Otto, N. A., Jakobs, M. E., Faber, D. R., Lutter, R., et al. (2021) · Genome Medicine · doi:10.1186/s13073-021-00948-1 · Cited by 40
“To build a multi-omics model of monocyte function in CAP, we used data integration analysis for biomarker discovery using latent components (DIABLO) [27], in the R library mixOmics [28].”
MethodWalker, D. I., Juran, B. D., Cheung, A., Schlicht, E. M., Liang, Y., Niedzwiecki, M. M., LaRusso, N. F., Gores, G. J., Jones, D. P., Miller, G. W., et al. (2021) · Hepatology Communications · doi:10.1002/hep4.1871 · Cited by 36
Yu, T. (2022) · PLoS Computational Biology · doi:10.1371/journal.pcbi.1009826 · Cited by 37
“For CCA and PLS, we used the implementation in the Bioconductor package mixOmics [30].”
MethodMethane emissions and rumen metabolite concentrations in cattle fed two different silages
Bica, R., Palarea‐Albaladejo, J., Lima, J., Uhrín, D., Miller, G. A., Bowen, J. M., Pacheco, D., Macrae, A., & Dewhurst, R. J. (2022) · Scientific Reports · doi:10.1038/s41598-022-09108-w · Cited by 37
Zhang, L., Chun, Y., Ho, H.-E., Arditi, Z., Lo, T., Sajja, S., Rose, R., Jones, D., Wang, J., Sicherer, S., et al. (2022) · Journal of Allergy and Clinical Immunology · doi:10.1016/j.jaci.2022.04.026 · Cited by 33
Mass spectrometry-based proteomics identify novel serum osteoarthritis biomarkers
Tardif, G., Paré, F., Gotti, C., Roux‐Dalvai, F., Droit, A., Zhai, G., Sun, G., Fahmi, H., Pelletier, J., & Martel‐Pelletier, J. (2022) · Arthritis Research & Therapy · doi:10.1186/s13075-022-02801-1 · Cited by 34
Effects of Long-Term Storage on the Biobanked Neonatal Dried Blood Spot Metabolome
Ottosson, F. A., Russo, F., Abrahamsson, A., MacSween, N., Courraud, J., Nielsen, Z. K., HOUGAARD, D. M., Cohen, A. S., & Ernst, M. (2023) · Journal of the American Society for Mass Spectrometry · doi:10.1021/jasms.2c00358 · Cited by 40
Alves Costa Silva, C., Piccinno, G., Suissa, D., Bourgin, M., Schreibelt, G., Durand, S., Birebent, R., Fidelle, M., Sow, C., Aprahamian, F., et al. (2024) · Nature Communications · doi:10.1038/s41467-024-45357-1 · Cited by 33
Dipali, S. S., King, C. D., Rose, J., Burdette, J. E., Campisi, J., Schilling, B., & Duncan, F. E. (2023) · Aging · doi:10.18632/aging.205190 · Cited by 53
“Partial least square-discriminant analysis (PLS-DA) of the proteomics data were performed using the package mixOmics in R (version 4.0.2; RStudio, version 1.3.1093) [90].”
MethodInfluentialMapping neurodevelopmental diversity in executive function
Mareva, S., Lead Investigators, Astle, D. E., Baker, K., Gathercole, S. E., Holmes, J., Kievit, R., Manly, T., Team of Researchers and PhD Students, Akarca, D., et al. (2024) · Cortex · doi:10.1016/j.cortex.2023.11.021 · Cited by 45
Pötgens, S. A., Havelange, V., Lecop, S., Li, F., Neyrinck, A. M., Bindels, F., Neveux, N., Demoulin, J., Moors, I., Kerre, T. C. C., et al. (2024) · Haematologica · doi:10.3324/haematol.2023.284138 · Cited by 33
Irvine, E. B., Darrah, P. A., Wang, S., Wang, C., McNamara, R. P., Roederer, M., Seder, R. A., Lauffenburger, D. A., Flynn, J. L., Fortune, S. M., et al. (2024) · iScience · doi:10.1016/j.isci.2024.111128 · Cited by 33
Unraveling aging from transcriptomics
Huang, Y., Zhu, S., Yao, S., Zhai, H., Liu, C., & Han, J. J. (2024) · Trends in Genetics · doi:10.1016/j.tig.2024.09.006 · Cited by 36
Unsupervised discovery of phenotype-specific multi-omics networks
Shi, W. J., Zhuang, Y., Russell, P. H., Hobbs, B. D., Parker, M. M., Castaldi, P. J., Rudra, P., Vestal, B. E., Hersh, C. P., Saba, L. M., et al. (2019) · Bioinformatics · doi:10.1093/bioinformatics/btz226 · Cited by 39
The Many Faces of Gene Regulation in Cancer: A Computational Oncogenomics Outlook
Lemus, E. H., Reyes-Gopar, H., Enríquez, J. E., & Ochoa, S. (2019) · Genes · doi:10.3390/genes10110865 · Cited by 34
The role of changing temperature in microbial metabolic processes during permafrost thaw
Messan, K. S., Jones, R. M., Doherty, S. J., Foley, K. L., Douglas, T. A., & Barbato, R. A. (2020) · PLoS ONE · doi:10.1371/journal.pone.0232169 · Cited by 33
“correlation as distance metric were created from data in both the ESI+ and ESI- mode using the mixOmics library [72] in R.”
MethodJiang, T., Wu, H., Yang, X., Li, Y., Zhang, Z., Chen, F., Zhao, L., & Zhang, C. (2020) · Microorganisms · doi:10.3390/microorganisms8081225 · Cited by 37
“mucosae A1 using “mixOmics” R package [45] in R v3.”
MethodOgunade, I. M., McCoun, M., Idowu, M. D., & PETERS, S. O. (2020) · Journal of Animal Science · doi:10.1093/jas/skaa201 · Cited by 33
An integrated omics approach to investigate summer mortality of New Zealand Greenshell™ mussels
Li, S., Alfaro, A. C., Nguyen, T. V., Young, T., & Lulijwa, R. (2020) · Metabolomics · doi:10.1007/s11306-020-01722-x · Cited by 39
Proteome and Microbiome Mapping of Human Gingival Tissue in Health and Disease
Bao, K., Li, X., Poveda, L., Qi, W., Selevsek, N., Gümüş, P., Emingil, G., Grossmann, J., Diaz, P. I., Hajishengallis, G., et al. (2020) · Frontiers in Cellular and Infection Microbiology · doi:10.3389/fcimb.2020.588155 · Cited by 33
Martínez, G., Jiao, J., Padmanabha, J., Denman, S. E., & McSweeney, C. S. (2020) · Microorganisms · doi:10.3390/microorganisms8101550 · Cited by 33
“Analysis of microbiota diversity and identification of ASVs significantly altered by supplementation or seasons was performed in R following the compositional data analysis using mixOmics [29] and the workflow developed by Gloor et al.”
MethodEisenring, M., Unsicker, S. B., & Lindroth, R. L. (2020) · Functional Ecology · doi:10.1111/1365-2435.13699 · Cited by 33
Structure of the Chemical and Genetic Diversity of the True Lavender over Its Natural Range
Despinasse, Y., Moja, S., Soler, C., Jullien, F., Pasquier, B., Bessière, J., Baudino, S., & Nicolè, F. (2020) · Plants · doi:10.3390/plants9121640 · Cited by 33
Park, S., Lee, J., Yang, S. H., Lee, H., Kim, J. Y., Park, M.-K., Kim, K. H., Moon, J. J., Cho, S., Lee, S., et al. (2021) · Journal of Cellular and Molecular Medicine · doi:10.1111/jcmm.16520 · Cited by 33
Boggio, G. M., Meynadier, A., Daunis‐i‐Estadella, P., & Marie‐Etancelin, C. (2021) · PLoS ONE · doi:10.1371/journal.pone.0254874 · Cited by 37
Miao, G., Zhang, Y., Huo, Z., Zeng, W., Zhu, J., Umans, J. G., Wohlgemuth, G., Pedrosa, D., DeFelice, B. C., Cole, S. A., et al. (2021) · Diabetes Care · doi:10.2337/dc21-0451 · Cited by 36
Multi-omic characterization of the thermal stress phenome in the stony coral Montipora capitata
Pathmanathan, J. S., Williams, A., Stephens, T. G., Su, X., Chiles, E. N., Conetta, D., Putnam, H. M., & Bhattacharya, D. (2021) · PeerJ · doi:10.7717/peerj.12335 · Cited by 38
Asri, M., Verma, R., Mahat, N. A., Nor, N. A. M., Desa, W. N. S. M., & Ismail, D. (2022) · Chemometrics and Intelligent Laboratory Systems · doi:10.1016/j.chemolab.2022.104557 · Cited by 33
Ferrer, V., Paymal, N., Quinton, C., Tomi, F., & Luro, F. (2022) · Plants · doi:10.3390/plants11202747 · Cited by 33
“The results represented a circle of correlation for sweet orange cultivars and a heatmap for sour orange using the “mixOmics” package in R [37].”
MethodShishkova, D. K., Lobov, A. A., Zainullina, B. R., Матвеева, В. Г., Markova, V. E., Sinitskaya, A. V., Velikanova, E. A., Sinitsky, M. Y., Kanonykina, A., Dyleva, Y. A., et al. (2022) · International Journal of Molecular Sciences · doi:10.3390/ijms232314941 · Cited by 38
“Finally, we carried out clusterisation of samples by sparse partial least squares discriminant analysis in the “MixOmics” package [91].”
MethodPhytoplankton size distributions in the western North Atlantic and their seasonal variability
Haëntjens, N., Boss, E., Graff, J. R., Chase, A., & Karp‐Boss, L. (2022) · Limnology and Oceanography · doi:10.1002/lno.12172 · Cited by 34
“The sPLS was computed with the R package mixOmics (Rohart et al. 2017) against the 12 size bins from the biovolume size distribution.”
MethodPhysical activity‐induced alterations of the gut microbiota are BMI dependent
Shah, S., Mu, C., Moossavi, S., Shen‐Tu, G., Schlicht, K., Rohmann, N., Geisler, C., Laudes, M., Franke, A., Züllig, T., et al. (2023) · The FASEB Journal · doi:10.1096/fj.202201571r · Cited by 37
Multi-omic data integration in food science and analysis
Herráiz-Gil, S., de Arriba, M. D. C., Escamez, M. J., & León, C. (2023) · Current Opinion in Food Science · doi:10.1016/j.cofs.2023.101049 · Cited by 39
Roberts, R., Khomenko, I., Eyres, G. T., Bremer, P. J., Silcock, P. J., Betta, E., & Franco Biasioli, A. (2023) · Journal of Mass Spectrometry · doi:10.1002/jms.4959 · Cited by 32
Discordant skeletal muscle gene and protein responses to exercise
Bishop, D. J., Hoffman, N. J., Taylor, D. F., Saner, N. J., Lee, M. J.-C., & Hawley, J. A. (2023) · Trends in Biochemical Sciences · doi:10.1016/j.tibs.2023.08.005 · Cited by 39
Adverse effects of the fungal biopesticide Beauveria bassiana on a predatory social wasp
Cappa, F., Fazi, L. D., Baracchi, D., & Cervo, R. (2023) · The Science of The Total Environment · doi:10.1016/j.scitotenv.2023.168202 · Cited by 32
“…based on chemical composition. we performed a Partial Least Square Discriminant Analysis (PLSDA), as implemented in the “ mixOmics ” R package (Rohart et al., 2017) to check whether the first four principal components were able to capture the differences between groups All statistical…”
Primary Human M2 Macrophage Subtypes Are Distinguishable by Aqueous Metabolite Profiles
Fuchs, A. L., Costello, S. M., Schiller, S. M., Tripet, B., & Copié, V. (2024) · International Journal of Molecular Sciences · doi:10.3390/ijms25042407 · Cited by 38
“Additional PLS-DA validation metrics, including classification error rate (CER) and area under the receiver operating characteristic curve (AUROC) analysis, were obtained using the ‘MixOmics’ package in R [49,51].”
MethodInfluentialNollet, E. E., Schuldt, M., Sequeira, V., Binek, A., Pham, T. V., Schoonvelde, S. A. C., Jansen, M., Schomakers, B. V., van Weeghel, M., Vaz, F. M., et al. (2024) · Circulation Genomic and Precision Medicine · doi:10.1161/circgen.123.004369 · Cited by 36
Pardo‐Hernández, M., García-Pérez, P., Lucini, L., & Rivero, R. M. (2024) · Journal of Experimental Botany · doi:10.1093/jxb/erae372 · Cited by 34
“DEGs, DAMs, ions, and phenotypic parameters were subjected to a multi-omics analysis employing the MixOmic tool (Rohart et al. , 2017).”
InfluentialSalido, R. A., Zhao, H. N., McDonald, D. T., Mannochio-Russo, H., Zuffa, S., Oles, R. E., Aron, A. T., Abiead, Y. E., Farmer, S., González, A., et al. (2025) · Cell · doi:10.1016/j.cell.2025.01.039 · Cited by 39
Integrative systems biology approaches for analyzing microbiome dysbiosis and species interactions
Rehman, S. S. U., Nasar, M. I., Mesquita, C. S., Khodor, S. A., Notebaart, R. A., Ott, S., Mundra, S., Arasardanam, R. P., Muhammad, K., & Alam, M. T. (2025) · Briefings in Bioinformatics · doi:10.1093/bib/bbaf323 · Cited by 36
“Linking microbial shifts to host phenotypes or treatment outcomes MixOmics [228], MOF A [229], MetaboAnal yst [ 230], OmicsNet [231], OpenMS3 [ 232] Integrating across datasets reveals cross-talk mechanisms”
Cheaib, B. A., Boulch, M. L., Mercier, P.-L., & Derôme, N. (2018) · Frontiers in Microbiology · doi:10.3389/fmicb.2018.00869 · Cited by 34
“To test for a correlation between taxonomical and functional composition, a Canonical Correlation Analysis using the CCA (González et al., 2008) and mixOmics (Rohart et al., 2017) packages in R were applied.”
MethodJahagirdar, S., & Saccenti, E. (2020) · Metabolites · doi:10.3390/metabo10040171 · Cited by 34
“Data sets without study ID were derived either from the original publications or from R packages within which they were distributed: BioMark [17], kodama [18], MixOmics [19], and pgmm [20].”
MethodLinks between fecal microbiota and the response to vaccination against influenza A virus in pigs
Borey, M., Blanc, F., Lemonnier, G., Leplat, J. J. J. J., Jardet, D., Rossignol, M., Ravon, L., Billon, Y., Bernard, M., Estellé, J., et al. (2021) · npj Vaccines · doi:10.1038/s41541-021-00351-2 · Cited by 36
A machine learning case–control classifier for schizophrenia based on DNA methylation in blood
Gunasekara, C., Hannon, E. J., MacKay, H., Coarfa, C., McQuillin, A., Clair, D. S., Mill, J. S., & Waterland, R. A. (2021) · Translational Psychiatry · doi:10.1038/s41398-021-01496-3 · Cited by 35
“We used the mixOmics R package [43] for implementation (Supplementary Fig.”
MethodSalas, E., Gorfer, M., Bandian, D., Eichorst, S. A., Schmidt, H., Horak, J., Rittmann, S. K. ‐. R., Schleper, C., Reischl, B., Pribasnig, T., et al. (2023) · The Science of The Total Environment · doi:10.1016/j.scitotenv.2023.167463 · Cited by 33
Lynch, T., Peirano, G., Lloyd, T., Read, R., Carter, J., Chú, Á., Shaman, J. A., Jarvis, J. P., Diamond, E., Ijaz, U. Z., et al. (2019) · Journal of Clinical Microbiology · doi:10.1128/jcm.00300-19 · Cited by 36
“The mixOmics R package was used for the sPLS-DA analysis according to methods outlined elsewhere (39, 40).”
BackgroundMethodHausmann, A., Russo, G., Grossmann, J., Zünd, M., Schwank, G., Aebersold, R. H., Liu, Y., Sellin, M. E., & Hardt, W. (2020) · Cellular Microbiology · doi:10.1111/cmi.13191 · Cited by 34
“, 2019) from the CRAN package mixOmics (Rohart et al., 2017).”
BackgroundMethodWang, Z., Karkossa, I., Großkopf, H., Rolle-Kampczyk, U. E., Hackermüller, J., von Bergen�, M., & Schubert, K. A. (2020) · Toxicology · doi:10.1016/j.tox.2020.152652 · Cited by 34
Current Status of Omics in Biological Quality Elements for Freshwater Biomonitoring
Machuca‐Sepúlveda, J., Miranda, J., Lefin, N., Pedroso, A., Beltrán, J. F., & Farías, J. G. (2023) · Biology · doi:10.3390/biology12070923 · Cited by 38
“Machine learning algorithms have different attributes, so it is crucial to choose an appropriate algorithm for analysis, which is explained in detail in the work by [204].”
Garske, K. M., Kar, A., Comenho, C., Balliu, B., Pan, D. Z., Bhagat, Y. V., Rosenberg, G. M., Koka, A., Das, S. S., Miao, Z., et al. (2023) · Nature Communications · doi:10.1038/s41467-023-39919-y · Cited by 33
Human gut microbiome and metabolite dynamics under simulated microgravity
Ramos-Nascimento, A., Grenga, L., Haange, S., Himmelmann, A., Arndt, F., Ly, Y.-T., Miotello, G., Pible, O., Jehmlich, N., Engelmann, B., et al. (2023) · Gut Microbes · doi:10.1080/19490976.2023.2259033 · Cited by 40
“The plsda function in the mixOmics R package was used to introduce partial least squares discriminant analysis (PLS-DA) as a supervised model to reveal microbiota changes between groups, whilst its sparse version ((s)PLS-DA) was used to select variables that best discriminate between groups.(71) The coseq package(72)…”
MethodBoughattas, I., Vaccari, F., Zhang, L., Bandini, F., Miras‐Moreno, B., Missawi, O., Hattab, S., Mkhinini, M., Lucini, L., Puglisi, E., et al. (2023) · Environmental Pollution · doi:10.1016/j.envpol.2023.123213 · Cited by 31
Exopolysaccharides in microbial interactions: signalling, quorum sensing, and community dynamics
Deo, R., Lakra, U., Ojha, M., Nigam, V. K., & Sharma, S. R. (2024) · Natural Product Research · doi:10.1080/14786419.2024.2405867 · Cited by 36
“It evaluates data from transcriptomics, metabolomics, proteomics, and metagenomics to find significant relationships (Rohart et al. 2017).”
Multi-omics decodes host-specific and environmental microbiome interactions in sepsis
Lu, J., Zhang, W., He, Y., Jiang, M., Liu, Z., Zhang, J., Zheng, L., Zhou, B., Luo, J., He, C., et al. (2025) · Frontiers in Microbiology · doi:10.3389/fmicb.2025.1618177 · Cited by 36
Beauclercq, S. A., Nadal‐Desbarats, L., Hennequet‐Antier, C., Gabriel, I., Tesseraud, S., Calenge, F., Bihan-Duval, É. L., & Mignon-Grasteau, S. (2018) · Scientific Reports · doi:10.1038/s41598-018-24978-9 · Cited by 38
Mucosal-associated invariant T cells and oral microbiome in persistent apical periodontitis
Davanian, H., Gaiser, R. A., Silfverberg, M., Hugerth, L. W., Sobkowiak, M. J., Lu, L., Healy, K., Sandberg, J. K., Näsman, P., Karlsson, J., et al. (2019) · International Journal of Oral Science · doi:10.1038/s41368-019-0049-y · Cited by 33
Expression profile analysis of piwi-interacting RNA in forensically relevant biological fluids
Wang, S., Wang, Z., Tao, R., Wang, M., Liu, J., He, G., Yang, Y., Xie, M., Zou, X., & Hou, Y. (2019) · Forensic Science International Genetics · doi:10.1016/j.fsigen.2019.07.015 · Cited by 32
Metabolomics and adductomics of newborn bloodspots to retrospectively assess the early-life exposome
Petrick, L. M., Uppal, K., & Funk, W. E. (2020) · Current Opinion in Pediatrics · doi:10.1097/mop.0000000000000875 · Cited by 32
“Algorithms have been implemented in web-based, R packages, and other open-source tools such as 3Omics [71], mixOmics [72], xMWAS [73 & ], and omicsade4 [74].”
MethodFeature set optimization in biomarker discovery from genome-scale data
Fortino, V., Scala, G., & Greco, D. (2020) · Bioinformatics · doi:10.1093/bioinformatics/btaa144 · Cited by 33
Virulence of the Pathogen Porphyromonas gingivalis Is Controlled by the CRISPR-Cas Protein Cas3
Solbiati, J., Duran-Pinedo, A. E., Rocha, F. G., Gibson, F. C., & Frias‐Lopez, J. (2020) · mSystems · doi:10.1128/msystems.00852-20 · Cited by 32
“The integration of host-microbe expression profiles was performed using the R package ‘mixOmics’ (96).”
Guggenheim, C., Freimann, R., Mayr, M. J., Beck, K., Wehrli, B., & Bürgmann, H. (2020) · Frontiers in Microbiology · doi:10.3389/fmicb.2020.579427 · Cited by 35
Ayelo, P. M., Yusuf, A. A., Pirk, C. W. W., Mohamed, S. A., Chailleux, A., & Delétré, E. (2021) · Journal of Chemical Ecology · doi:10.1007/s10886-021-01245-2 · Cited by 34
Guardo, M. D., Farneti, B., Khomenko, I., Modica, G., Mosca, A., Distefano, G., Bianco, L., Troggio, M., Sottile, F., Malfa, S. G. L., et al. (2021) · Horticulture Research · doi:10.1038/s41438-021-00465-7 · Cited by 36
Arora, T., Verma, R., Kumar, R., Chauhan, R., Kumar, B., & Sharma, V. (2021) · Microchemical Journal · doi:10.1016/j.microc.2021.106080 · Cited by 31
Asri, M., Fadhilah, N. N., Nor, N. A. M., & Verma, R. (2021) · Microchemical Journal · doi:10.1016/j.microc.2021.106136 · Cited by 31
Aging selectively dampens oscillation of lipid abundance in white and brown adipose tissue
Held, N. M., Buijink, M. R., Elfrink, H. L., Kooijman, S., Janssens, G. E., Luyf, A. C. M., Pras‐Raves, M. L., Vaz, F. M., Michel, S. H., Houtkooper, R. H., et al. (2021) · Scientific Reports · doi:10.1038/s41598-021-85455-4 · Cited by 33
“Subsequent statistical analyses and plotting were done in a R environment using the ggplot2, ropls and mixOmics packages [20–22].”
MethodInter-kingdom relationships in Crohn’s disease explored using a multi-omics approach
Frau, A., Ijaz, U. Z., Slater, R., Jonkers, D. M. A. E., Penders, J., Campbell, B. J., Kenny, J. G., Hall, N., Lenzi, L., Burkitt, M. D., et al. (2021) · Gut Microbes · doi:10.1080/19490976.2021.1930871 · Cited by 34
“In here, a similar multiomics approach was undertaken to explore the underlying biological mechanisms, using an optimized genomic analysis of the fecal mycobiome of patients with IBD(32) and a dedicated tool to integrate datasets.(33) This study investigated the hypothesis that interactions between fungal and bacteria…”
MethodThe Hitchhiker’s Guide to Untargeted Lipidomics Analysis: Practical Guidelines
Smirnov, D., Mazin, P., Osetrova, M., Stekolshchikova, E., & Khrameeva, E. E. (2021) · Metabolites · doi:10.3390/metabo11110713 · Cited by 35
“A PLS-DA model in its standard variant can be constructed and subsequently visualized using plsda and plotIndiv functions from the mixOmics R package [47].”
MethodA vacuolar hexose transport is required for xylem development in the inflorescence stem
Aubry, E., Hoffmann, B., Vilaine, F., Gilard, F., Klemens, P. A. W., Guérard, F., Gakière, B., Neuhaus, H. E., Bellini, C., Dinant, S., et al. (2021) · PLANT PHYSIOLOGY · doi:10.1093/plphys/kiab551 · Cited by 31
Ng, G. Y.-Q., Sheng, D. P. L. K., Bae, H., Kang, S. W., Fann, D. Y., Park, J., Kim, J., Shaik, A. A., Lee, J., Kim, E., et al. (2022) · GeroScience · doi:10.1007/s11357-022-00537-z · Cited by 34
Marino, C., Grimaldi, M., Sommella, E., Ciaglia, T., Santoro, A., Buonocore, M., Salviati, E., Trojsi, F., Polverino, A., Sorrentino, P., et al. (2022) · Metabolites · doi:10.3390/metabo12090837 · Cited by 32
Effects of PB‐TURSO on the transcriptional and metabolic landscape of sporadic ALS fibroblasts
Fels, J. A., Dash, J., Leslie, K. L., Manfredi, G., & Kawamata, H. (2022) · Annals of Clinical and Translational Neurology · doi:10.1002/acn3.51648 · Cited by 37
“Multiomics analysis was done with the mixOmics package.(35) Data visualization was done in R using the ggplot2, pheatmap, corrplot, and venndiagram packages available from CRAN, and in GraphPad Prism version 9.”
MethodBradshaw, A. J., Backman, T. A., Ramírez-Cruz, V., Forrister, D. L., Winter, J. M., Guzmán-Dávalos, L., Furci, G., Stamets, P., & Dentinger, B. T. M. (2022) · Applied and Environmental Microbiology · doi:10.1128/aem.01498-22 · Cited by 29
“Normalized values were then used for PCA and PLS-DA, which were calculated and visualized using the R package mixOmics (91).”
MethodChanges on proteomic and metabolomic profiling of cryopreserved sperm effected by melatonin
Li, C., Ren, C., Chen, Y., Wang, M., Tang, J., Zhang, Y., Wang, Q., & Zhang, Z. (2022) · Journal of Proteomics · doi:10.1016/j.jprot.2022.104791 · Cited by 34
Pötgens, S. A., Lecop, S., Havelange, V., Li, F., Neyrinck, A. M., Neveux, N., Maertens, J. A., Walter, J., Schoemans, H. M., Delzenne, N. M., et al. (2023) · Clinical Nutrition · doi:10.1016/j.clnu.2023.09.021 · Cited by 33
“To integrate the different data collected, we used DIABLO: Data Integration Analysis for Biomarker discovery using Latent cOmponents [37], part of the mixOmics R package [38].”
MethodDifferent bacterial and viral pathogens trigger distinct immune responses in a globally invasive ant
Lester, P. J., Buick, K. H., Baty, J. W., Felden, A., & Haywood, J. A. (2019) · Scientific Reports · doi:10.1038/s41598-019-41843-5 · Cited by 31
Single Layers of Attention Suffice to Predict Protein Contacts
Bhattacharya, N., Thomas, N., Rao, R., Dauparas, J., Koo, P. K., Baker, D., Song, Y. S., & Ovchinnikov, S. (2020) · bioRxiv (Cold Spring Harbor Laboratory) · doi:10.1101/2020.12.21.423882 · Cited by 29
Wang, H., Lin, K., Zhang, Q., Shi, J., Song, X., Wu, J., Zhao, C., & He, K. (2024) · Bioinformatics · doi:10.1093/bioinformatics/btae159 · Cited by 30
“� Block PLSDA is implemented based on Mixomics R Package (Rohart et al .”
Method
Metadata
- Authors
- Rohart, F., Gautier, B., Singh, A., & Lê Cao, K.-A.
- Affiliations
- Translational Research Institute (AU)
- University of British Columbia (CA)
- Venue
- PLOS Computational Biology
- Publisher
- Public Library of Science (PLoS)
- Published
- 2017-11-03
- Volume
- 13
- Issue
- 11
- Pages
- e1005752
- ISSN
- 1553-734X (ISSN-L)
- 1553-7358
- PMC
- PMC5687754
- OpenAlex
- W2950985821
- Cited by
- 4,056
- References
- 57
- Citations by year
- 2026: 629 · 2025: 612 · 2024: 600 · 2023: 523 · 2022: 496 · 2021: 489 · 2020: 350 · 2019: 241 · 2018: 95 · 2017: 14
- FWCI
- 78.13
- Type
- journal article
- Language
- en
- Update notices
- new_version (2017-11-15)
- Open access
- gold
- doi.org
- Licence
- Locations
- PLoS Computational Biology (publishedVersion, cc-by)
- bioRxiv (Cold Spring Harbor Laboratory) (acceptedVersion, cc-by-nc-nd)
- PubMed Central (publishedVersion, cc-by)
- PubMed (publishedVersion)
- Minerva Access (University of Melbourne) (submittedVersion, cc-by)
- RePEc: Research Papers in Economics (submittedVersion)
- DOAJ (DOAJ: Directory of Open Access Journals) (submittedVersion, cc-by-sa)
- Figshare (submittedVersion, cc-by)
- Funders
- National Health and Medical Research Council (APP1087415)
- Australian Cancer Research Foundation (ACRF) for the Diamantina Individualised Oncology Care Centre
- Topics
- Life Sciences › Biochemistry, Genetics and Molecular Biology › Molecular Biology › Bioinformatics and Genomic Networks
- Life Sciences › Biochemistry, Genetics and Molecular Biology › Molecular Biology › Metabolomics and Mass Spectrometry Studies
- Life Sciences › Biochemistry, Genetics and Molecular Biology › Molecular Biology › Gene expression and cancer classification
- Keywords
- R package, multi-omics integration, feature selection, multivariate analysis, dimensionality reduction, partial least squares regression, discriminant analysis, molecular signatures, systems biology, transcriptomics, proteomics, metabolomics, exploratory data analysis
- MeSH terms
- Data Interpretation, Statistical, Humans, Neoplasms, Software, Computational Biology, Genomics, Systems Biology, Metabolomics
About these checks
Registry, retraction, Cites and statistics results are computed, not judged, with one exception: a printed reference that no index lists is read once by a model before it counts as a citation error. Claims are extracted by a model and kept only when their quote appears verbatim in the text; each cited source is then checked, with a model’s help, for whether it says what the claim relies on. Those verdicts can be wrong — read the claim’s quote and the cited source before relying on one.
Statistics and arithmetic are recomputed, not judged.
Confidence bands are shown only for fields calibrated on our annotated test set. None is calibrated yet, so no band is shown.
What counts as a claim ›How we measure confidence ›How we check this ›
Are you an author, or do you see a problem with this page? Request a review
Data sources
Bibliographic data: Semantic Scholar, OpenAlex, Crossref.
Contains information from the Semantic Scholar Academic Graph Datasets, made available under the ODC Attribution License (ODC-BY 1.0).
Semantic Scholar’s data is described in: Kinney, R., et al. (2023). The Semantic Scholar Open Data Platform. arXiv:2301.10140.
