

mixOmics: An R package for ‘omics feature selection and multiple data integration
Open accessPublished version of a preprint
The DOI matches its Crossref record; 58 of the 58 references it cites were found in a registry or an index.
Abstract
The advent of high throughput technologies has led to a wealth of publicly available 'omics data coming from different sources, such as transcriptomics, proteomics, metabolomics. Combining such large-scale biological data sets can lead to the discovery of important biological insights, provided that relevant information can be extracted in a holistic manner. Current statistical approaches have been focusing on identifying small subsets of molecules (a 'molecular signature') to explain or predict biological conditions, but mainly for a single type of 'omics. In addition, commonly used methods are univariate and consider each biological feature independently. We introduce mixOmics, an R package dedicated to the multivariate analysis of biological data sets with a specific focus on data exploration, dimension reduction and visualisation. By adopting a systems biology approach, the toolkit provides a wide range of methods that statistically integrate several data sets at once to probe relationships between heterogeneous 'omics data sets. Our recent methods extend Projection to Latent Structure (PLS) models for discriminant analysis, for data integration across multiple 'omics data or across independent studies, and for the identification of molecular signatures. We illustrate our latest mixOmics integrative frameworks for the multivariate analyses of 'omics data available from the package.
Overview
The claims and statistics of this paper haven’t been checked yet.
Free: it reads the open-access text and checks the first 5 claims that cite a source we can check. Create a free account to check every claim.
Integrity signals
Registry
Cites
Statistics
Figures



Verification
Claims the paper makes
The claims and statistics of this paper haven’t been checked yet.
Free: it reads the open-access text and checks the first 5 claims that cite a source we can check. Create a free account to check every claim.
Self-check
Percentages, sums and reported differences re-computed from the paper’s own numbers.
The self-check needs the paper’s full text.
Citations
Cites
R: A Language and Environment for Statistical Computing
R Core Team (2025) · doi:10.32614/r.manuals · Cited by 352,181
Regression shrinkage and selection via the lasso
Tibshirani, R. (1996) · Journal of the Royal Statistical Society Series B: Statistical Methodology · doi:10.1111/j.2517-6161.1996.tb02080.x · Cited by 51,482 · cited 1×
“Feature selection is performed via l1 regularisation (LASSO, [27]), which is implemented into each method’s statistical criterion to be optimised.”
MethodRegularization Paths for Generalized Linear Models via Coordinate Descent
Friedman, J., Hastie, T., & Tibshirani, R. (2010) · Journal of Statistical Software · doi:10.18637/jss.v033.i01 · Cited by 19,927 · cited 1×
“glmnet, [38], PMA, [39]), mixOmics uses soft-thresholding to improve usability by replacing the l(1) parameter by the number keepX of features to select on each dimension.”
MethodEnterotypes of the human gut microbiome
MetaHIT Consortium (additional members), Arumugam, M., Raes, J., Pelletier, E., Le Paslier, D., Yamada, T., Mende, D. R., Fernandes, G. R., Tap, J., Bruls, T., et al. (2011) · Nature · doi:10.1038/nature09944 · Cited by 7,548
Partial least squares for discrimination
Barker, M., & Rayens, W. (2003) · Journal of Chemometrics · doi:10.1002/cem.785 · Cited by 2,841
Khan, J., Wei, J. S., Ringnér, M., Saal, L. H., Ladanyi, M., Westermann, F., Berthold, F., Schwab, M., Antonescu, C. R., Peterson, C., et al. (2001) · Nature Medicine · doi:10.1038/89044 · Cited by 2,644 · cited 2×
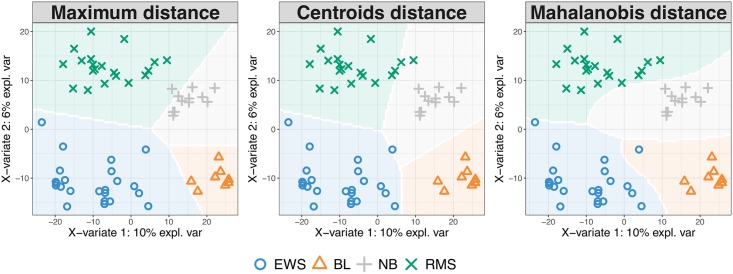
“The study investigates Small Round Blue Cell Tumors (SRBCT, [35]) of 63 tumour samples with the expression levels of 2,308 genes.”
BackgroundMethodLê Cao, K.-A., Boitard, S., & Besse, P. (2011) · BMC Bioinformatics · doi:10.1186/1471-2105-12-253 · Cited by 1,007 · cited 3×
“In single ‘omics analyses this distance achieves best accuracy when the predicted values are close to 0 or 1 [10].”
BackgroundMethodInfluentialPlankton networks driving carbon export in the oligotrophic ocean
Guidi, L., Chaffron, S., Bittner, L., Eveillard, D., Larhlimi, A., Roux, S., Darzi, Y., Audic, S., Berline, L., Brum, J. R., et al. (2016) · Nature · doi:10.1038/nature16942 · Cited by 870 · cited 1×
“(2016), Table 3 and factomineR Husson et al. (2017)). However, very few methods propose feature selection, including sparse CCA (pma package Witten et al. (2013)), sparse PLS (spls package, Chung et al.”
MethodTumor classification by partial least squares using microarray gene expression data
Nguyen, D. V., & Rocke, D. M. (2002) · Bioinformatics · doi:10.1093/bioinformatics/18.1.39 · Cited by 816 · cited 1×
“The assessment is data-driven and similar to the process detailed in Rohart et al. (2016), where one-sided t-tests assess whether there is a gain in performance when adding components to the model.”
MethodPath Models with Latent Variables: The NIPALS Approach
WOLD, H. (1975) · Quantitative Sociology · doi:10.1016/b978-0-12-103950-9.50017-4 · Cited by 802 · cited 1×
“Unsupervised analyses methods include Principal Component Analysis—based on NonLinear Iterative Partial Least Squares for missing values [18], Independent Component Analysis [19], Partial Least Squares regression—PLS, also known as Projection to Latent Structures [20], multi-group PLS [21], regularised Canonical Corre…”
Method
Research works printed but not linked: 3
- A Singh, 2016, DIABLO-an integrative, multi-omics, multivariate method for multi-group classification, bioRxiv, 067611
- F Rohart, 2017, MINT: A multivariate integrative approach to identify a reproducible biomarker signature across multiple experiments and platforms, BMC Bioinformatics, 18
- H Wold, 1966, Estimation of principal components and related models by iterative least squares, J Multivar Anal, 391
Cited by
Items 101–200 of 1,013
Symbionts protect aphids from parasitic wasps by attenuating herbivore-induced plant volatiles
Frago, E., Mala, M., Weldegergis, B. T., Yang, C., McLean, A. H. C., Godfray, H. C. J., Gols, R., & Dicke, M. (2017) · Nature Communications · doi:10.1038/s41467-017-01935-0 · Cited by 161
Beaumont, M., Paës, C., Mussard, E., Knudsen, C., Cauquil, L., Aymard, P., Barilly, C., Gabinaud, B., Zemb, O., Fourré, S., et al. (2020) · Gut Microbes · doi:10.1080/19490976.2020.1747335 · Cited by 167
“PCA was performed with the function pca in the mixOmics package.(62) The heatmap was created using the function heatplot in the made4 package.”
MethodIntegrated microbiota and metabolite profiles link Crohn’s disease to sulfur metabolism
Metwaly, A., Dunkel, A., Waldschmitt, N., Raj, A. C. D., Lagkouvardos, I., Corraliza, A. M., Mayorgas, A., Martinez-Medina, M., Reiter, S., Schloter, M., et al. (2020) · Nature Communications · doi:10.1038/s41467-020-17956-1 · Cited by 149
Incorporating Machine Learning into Established Bioinformatics Frameworks
Auslander, N., Gussow, A. B., & Koonin, E. V. (2021) · International Journal of Molecular Sciences · doi:10.3390/ijms22062903 · Cited by 170
“Several methods have been developed that integrate network information with omics data for biomarker discovery [167,175,178], and some methods incorporated prior knowledge into feature selection algorithms for biomarker discovery, such as diseases associated genes [179,180], evolutionary…”
MethodOmics sciences for systems biology in Alzheimer’s disease: State-of-the-art of the evidence
Hampel, H., Nisticò, R., Seyfried, N. T., Levey, A. I., Modeste, E., Lemercier, P., Baldacci, F., Toschi, N., Garaci, F., Perry, G., et al. (2021) · Ageing Research Reviews · doi:10.1016/j.arr.2021.101346 · Cited by 144
Temporal development of the oral microbiome and prediction of early childhood caries
Dashper, S. G., Mitchell, H. L., Cao, K. L., Carpenter, L. M., Gussy, M. G., Calache, H., Gladman, S. L., Bulach, D., Hoffmann, B., Catmull, D. V., et al. (2019) · Scientific Reports · doi:10.1038/s41598-019-56233-0 · Cited by 172
Muralidharan, J., Moreno‐Indias, I., Bulló, M., Vioqué, J., Corella, D., Castañer, O., Vidal, J., Atzeni, A., Fernández‐García, J. C., Torres‐Collado, L., et al. (2021) · American Journal of Clinical Nutrition · doi:10.1093/ajcn/nqab150 · Cited by 169
“This supervised method from the mixOmics package selects features that can best discriminate the 2 intervention groups at the end of the intervention (25).”
MethodPredicting women with depressive symptoms postpartum with machine learning methods
Andersson, S., Bathula, D. R., Iliadis, S. I., Walter, M., & Skalkidou, A. (2021) · Scientific Reports · doi:10.1038/s41598-021-86368-y · Cited by 135
Advances in “Omics” Approaches for improving toxic metals/metalloids tolerance in plants
Raza, A., Tabassum, J., Zahid, Z., Charagh, S., Bashir, S., Barmukh, R., Khan, R. S. A., Barbosa, F., Zhang, C., Chen, H., et al. (2022) · Frontiers in Plant Science · doi:10.3389/fpls.2021.794373 · Cited by 132
Langenberg, M. C. C., Hoogerwerf, M.-A., Koopman, J. P. R., Janse, J. J., Oosterhoud, J. K.-V., Feijt, C., Jochems, S. P., de Dood, C. J., van Schuijlenburg, R., Ozir‐Fazalalikhan, A., et al. (2020) · Nature Medicine · doi:10.1038/s41591-020-0759-x · Cited by 149
Multi-omic integration of microbiome data for identifying disease-associated modules
Muller, E., Shiryan, I., & Borenstein, E. (2024) · Nature Communications · doi:10.1038/s41467-024-46888-3 · Cited by 119
“We fi rst obtained data from 3 case-control studies that pro fi led both stool shotgun metagenomics and metabolomics, including an IBD cohort (Franzosa et al. 12 ), a CRC cohort (Yachida et al., 2019 11 ), and an end-stage renal disease (ESRD) cohort (Wang et al. 32 ).”
Single-Cell Transcriptomics: Current Methods and Challenges in Data Acquisition and Analysis
Adil, A., Kumar, V., Jan, A. T., & Asger, M. (2021) · Frontiers in Neuroscience · doi:10.3389/fnins.2021.591122 · Cited by 132
“For the fourth category, analytical methods developed for bulk cellular analysis like MOFA (Argelaguet et al., 2018), MINT (Rohart et al., 2017a), mixOmics (Rohart et al., 2017b), and DIABLO (Singh et al., 2019) are being utilized.”
MethodMorabito, A., Simone, G. D., Pastorelli, R., Brunelli, L., & Ferrario, M. (2025) · Journal of Translational Medicine · doi:10.1186/s12967-025-06446-x · Cited by 160
“…R (MixOmics) [12] SNF Correlation R (SNFtool) + MATLAB [15] DIABLO Multivariate methods R (MixOmics) [12] MOFA Multivariate methods R (MixOmics) [12] PLS-DA Multivariate methods R (MixOmics) [12] MCIA Multivariate methods R (omicade4) [16, 17] MOFA Multivariate methods R (MOFA2) [18] MOFA +…”
InfluentialLundmark, A., Hu, Y. O. O., Huss, M., Johannsen, G., Andersson, A. F., & Yucel‐Lindberg, T. (2019) · Frontiers in Cellular and Infection Microbiology · doi:10.3389/fcimb.2019.00216 · Cited by 152
“Correlation Analysis Between Microbiota and Inflammatory Mediator Levels To investigate the correlations between microbiota and various host-mediated inflammatory mediators such as cytokines, a sparse partial least squares discriminant analysis (sPLS-DA) method, implemented in the mixOmics R package (Le Cao et al., 20…”
MethodArıkan, M., & Muth, T. (2023) · Molecular Omics · doi:10.1039/d3mo00089c · Cited by 150
Zhao, L., Dong, Q., Luo, C., Wu, Y., Bu, D., Qi, X., Luo, Y., & Zhao, Y. (2021) · Computational and Structural Biotechnology Journal · doi:10.1016/j.csbj.2021.04.067 · Cited by 127
“However, it raises new computational challenges in the data integration due to the heterogeneous characteristics and distribution of different types of data, the high dimensionality of each level of a molecular dataset, and a limited number of observations [8–10].”
BackgroundRegueira‐Iglesias, A., Balsa‐Castro, C., Blanco‐Pintos, T., & Tomás, I. (2023) · Molecular Oral Microbiology · doi:10.1111/omi.12434 · Cited by 154
Multi ‘omic data integration: A review of concepts, considerations, and approaches
Santiago-Rodríguez, T. M., & Hollister, E. B. (2021) · Seminars in Perinatology · doi:10.1016/j.semperi.2021.151456 · Cited by 155
Xu, J., Wu, P., Chen, Y., Meng, Q., Dawood, H., & Dawood, H. (2019) · BMC Bioinformatics · doi:10.1186/s12859-019-3116-7 · Cited by 121
“There are some other multi-omics integration methods proposed, such as mixOmics [45].”
BackgroundMethodBasile, M., Storch, I., & Mikusiński, G. (2021) · Ecological Indicators · doi:10.1016/j.ecolind.2021.108402 · Cited by 140
Multi-omics strategies for biomarker discovery and application in personalized oncology
Jiang, Z., Zhang, H., Gao, Y., & Sun, Y. (2025) · Molecular Biomedicine · doi:10.1186/s43556-025-00340-0 · Cited by 151
“These methods encompass various matrix factorization approaches for unsupervised dimensionality reduction, including MOFA/MOFA + [116], JIVE [95], partial least squares (PLS) [106], and multiple co-inertia analysis (MCIA) [108].”
Evaluation and comparison of multi-omics data integration methods for cancer subtyping
Duan, R., Gao, L., Gao, Y., Hu, Y., Xu, H., Huang, M., Song, K., Wang, H., Dong, Y., Jiang, C., et al. (2021) · PLOS Computational Biology · doi:10.1371/journal.pcbi.1009224 · Cited by 122
“(2020) [1] multivariate [4,22,27,28,58,59,94] similarity [12,17,23]”
Jorissen, H., Galand, P. E., Bonnard, I., Meiling, S. S., Raviglione, D., Meistertzheim, A., Hédouin, L., Banaigs, B., Payri, C. E., & Nugues, M. M. (2021) · Scientific Reports · doi:10.1038/s41598-021-94096-6 · Cited by 138
Multivariate Analysis of Multiple Datasets: a Practical Guide for Chemical Ecology
Hervé, M. R., Nicolè, F., & Cao, K. L. (2018) · Journal of Chemical Ecology · doi:10.1007/s10886-018-0932-6 · Cited by 142
“The other solution is to apply a prediction matrix on the predicted indicator matrix values in PLSR-DA (Lê Cao et al. (2011) implemented in Rohart et al. (2017)).”
MethodA Conserved Mito-Cytosolic Translational Balance Links Two Longevity Pathways
Molenaars, M., Janssens, G. E., Williams, E. G., Jongejan, A., Lan, J., Rabot, S., Joly, F., Moerland, P. D., Schomakers, B. V., Lezzerini, M., et al. (2020) · Cell Metabolism · doi:10.1016/j.cmet.2020.01.011 · Cited by 124
Camiolo, M. J., Gauthier, M. C., Kaminski, N., Ray, A., & Wenzel, S. E. (2020) · Journal of Allergy and Clinical Immunology · doi:10.1016/j.jaci.2020.05.051 · Cited by 124
“8).(30) Model training was performed using the IMSA data set using all patients including healthy controls, patients with mild to moderate asthma, and patients with severe asthma.”
From Omics to Multi-Omics: A Review of Advantages and Tradeoffs
Hayes, C. N., Nakahara, H., Ono, A., Tsuge, M., & Oka, S. (2024) · Genes · doi:10.3390/genes15121551 · Cited by 119
“MixOmics implements a number of vertical and horizontal multi-omics integration methods as well as offers guidance on how to select the most appropriate approach depending on the goals and limitations of the study [144].”
Large-Scale Automatic Feature Selection for Biomarker Discovery in High-Dimensional OMICs Data
Leclercq, M., Vittrant, B., Martin‐Magniette, M., Scott‐Boyer, M., Périn, O., Bergeron, A., Fradet, Y., & Droit, A. (2019) · Frontiers in Genetics · doi:10.3389/fgene.2019.00452 · Cited by 134
“These signatures, which are measurable indicators for predicting a biological phenomenon, are usually identified using machine learning (Pasolli et al., 2016) or statistical multivariate analysis approaches (Rohart et al., 2017c).”
BackgroundWong Fok Lung, T., Monk, I. R., Acker, K. P., Mu, A., Wang, N., Riquelme, S. A., Pires, S., Noguera, L. P., Dach, F., Gabryszewski, S. J., et al. (2019) · Nature Microbiology · doi:10.1038/s41564-019-0597-0 · Cited by 120
Pedersen, H., Forslund, S. K., Guðmundsdóttir, V., Petersen, A. Ø., Hildebrand, F., Hyötyläinen, T., Nielsen, T., Hansen, T. F., Bork, P., Ehrlich, S. D., et al. (2018) · Nature Protocols · doi:10.1038/s41596-018-0064-z · Cited by 127
Irvine, E. B., O’Neil, A., Darrah, P. A., Shin, S. A., Choudhary, A. K., Li, W., Honnen, W. J., Mehra, S., Kaushal, D., Gideon, H. P., et al. (2021) · Nature Immunology · doi:10.1038/s41590-021-01066-1 · Cited by 124
Automating the design-build-test-learn cycle towards next-generation bacterial cell factories
Gurdo, N., Volke, D. C., McCloskey, D., & Nikel, P. I. (2023) · New Biotechnology · doi:10.1016/j.nbt.2023.01.002 · Cited by 112
Urbanized microbiota in infants, immune constitution, and later risk of atopic diseases
Lehtimäki, J., Thorsen, J., Rasmussen, M. A., Hjelmsø, M., Shah, S., Mortensen, M. S., Trivedi, U., Vestergaard, G., Bønnelykke, K., Chawes, B. L., et al. (2021) · Journal of Allergy and Clinical Immunology · doi:10.1016/j.jaci.2020.12.621 · Cited by 116
Wozniak, J. M., Mills, R. H., Olson, J., Caldera, J. R., Sepich‐Poore, G. D., Carrillo-Terrazas, M., Tsai, C., Vargas, F., Knight, R. D., Dorrestein, P. C., et al. (2020) · Cell · doi:10.1016/j.cell.2020.07.040 · Cited by 133
“Next, we examined the integrated dataset for protein-metabolite relationships using the mixOmics R package (Rohart et al., 2017).”
BackgroundMethodInfluentialIngham, A. C., Kielsen, K., Cilieborg, M. S., Lund, O., Holmes, S., Aarestrup, F. M., Müller, K., & Pamp, S. J. (2019) · Microbiome · doi:10.1186/s40168-019-0745-z · Cited by 128
O’Donnell, S. T., Ross, R. P., & Stanton, C. (2020) · Frontiers in Microbiology · doi:10.3389/fmicb.2019.03084 · Cited by 128
De Paepe, K., Kerckhof, F., Verspreet, J., Courtin, C. M., & Van de Wiele, T. (2017) · Environmental Microbiology · doi:10.1111/1462-2920.13819 · Cited by 115
MiBiOmics: an interactive web application for multi-omics data exploration and integration
Zoppi, J., Guillaume, J.-F., Neunlist, M., & Chaffron, S. (2021) · BMC Bioinformatics · doi:10.1186/s12859-020-03921-8 · Cited by 111
Integrating omics datasets with the OmicsPLS package
el Bouhaddani, S., Uh, H., Jongbloed, G., Hayward, C., Klarić, L., Kiełbasa, S. M., & Houwing‐Duistermaat, J. J. (2018) · BMC Bioinformatics · doi:10.1186/s12859-018-2371-3 · Cited by 114
Restructuring the Gut Microbiota by Intermittent Fasting Lowers Blood Pressure
Shi, H., Zhang, B., Abo‐Hamzy, T., Nelson, J. W., Ambati, C. S. R., Petrosino, J. F., Bryan, R. M., & Durgan, D. J. (2021) · Circulation Research · doi:10.1161/circresaha.120.318155 · Cited by 116
Towards Realizing the Vision of Precision Medicine: AI Based Prediction of Clinical Drug Response
de Jong, J., Cutcutache, I., Page, M., Elmoufti, S., Dilley, C., Fröhlich, H., & Armstrong, M. (2020) · Brain · doi:10.1093/brain/awab108 · Cited by 124
“(i) Sparse multi-block PLS-DA: mixOmics.(61) (ii) Multimodal neural network: Tensorflow 2.”
Holo-omics for deciphering plant-microbiome interactions
Xu, L., Pierroz, G., Wipf, H. M. ‐., Gao, C. D., Taylor, J. W., Lemaux, P. G., & Coleman‐Derr, D. (2021) · Microbiome · doi:10.1186/s40168-021-01014-z · Cited by 118
Discovery of drug-omics associations in type 2 diabetes with generative deep-learning models
Allesøe, R. L., Lundgaard, A. T., Hernández Medina, R., Aguayo-Orozco, A., Johansen, J., Nissen, J. N., Brorsson, C., Mazzoni, G., Niu, L., Biel, J. H., et al. (2023) · Nature Biotechnology · doi:10.1038/s41587-022-01520-x · Cited by 111
Identification of rumen microbial biomarkers linked to methane emission in Holstein dairy cows
Ramayo‐Caldas, Y., Zingaretti, L. M., Popova, M., Estellé, J., Bernard, A., Pons, N., Bellot, P., Mach, N., Rau, A., Roume, H., et al. (2019) · Journal of Animal Breeding and Genetics · doi:10.1111/jbg.12427 · Cited by 135
“…a combination of multivariate analyses was performed using sparse partial least‐squares (sPLS) as implemented in the mixomics r package (Rohart, Gautier, Singh, & Lê Cao, 2017). sPLS is a statistical approach employed to identify a small subset of variables that maximize the covariance…”
Gad, M. A., Hou, L., Li, J., Wu, Y., Rashid, A., Chen, N., & Hu, A. (2020) · The Science of The Total Environment · doi:10.1016/j.scitotenv.2020.141434 · Cited by 111
Kong, G., Ellul, S., Narayana, V. K., Kanojia, K., Tran, H., Li, S., Renoir, T., Cao, K. L., & Hannan, A. J. (2020) · Neurobiology of Disease · doi:10.1016/j.nbd.2020.105199 · Cited by 133
“A design matrix of 0.1 was used to focus primarily on the discrimination between the genotype groups leading to a selection of 30 species, 20 genes and 20 metabolites, as detailed in (Rohart et al., 2017).”
MethodInfluentialPatterns of eukaryotic diversity from the surface to the deep-ocean sediment
Cordier, T., Angeles, I. B., Henry, N., Lejzerowicz, F., Berney, C., Morard, R., Brandt, A., Cambon‐Bonavita, M., Guidi, L., Lombard, F., et al. (2022) · Science Advances · doi:10.1126/sciadv.abj9309 · Cited by 115
Building consensus around the assessment and interpretation of Symbiodiniaceae diversity
Davies, S. W., Gamache, M. H., Howe‐Kerr, L. I., Kriefall, N. G., Baker, A. C., Banaszak, A. T., Bay, L. K., Bellantuono, A. J., Bhattacharya, D., Chan, C. X., et al. (2023) · PeerJ · doi:10.7717/peerj.15023 · Cited by 117
“Then, tools that make use of multivariate statistics to combine these different types of biological data across studies, such as mixOmics (Rohart et al., 2017) or weighted gene coexpression network analysis (WGCNA; Langfelder & Horvath, 2008), can improve our ability to elucidate molecular mechanisms associated with p…”
MethodMalaisé, Y., Menard, S., Cartier, C., Gaultier, E., Lasserre, F., Lencina, C., Harkat, C., Geoffre, N., Lakhal, L., Castan, I., et al. (2017) · Scientific Reports · doi:10.1038/s41598-017-15196-w · Cited by 107
Vitulo, N., Lemos, W. J. F., Calgaro, M., Confalone, M., Felis, G. E., Zapparoli, G., & Nardi, T. (2019) · Frontiers in Microbiology · doi:10.3389/fmicb.2018.03203 · Cited by 120
Riley, C. B., & Gardiner, M. M. (2020) · PLoS ONE · doi:10.1371/journal.pone.0228499 · Cited by 128
Metagenomic assessment of the global diversity and distribution of bacteria and fungi
Bahram, M., Netherway, T., Frioux, C., Ferretti, P., Coelho, L. P., Geisen, S., Bork, P., & Hildebrand, F. (2020) · Environmental Microbiology · doi:10.1111/1462-2920.15314 · Cited by 123
“To test the associations of taxa, we used a sparse partial least squares analysis, as implemented in the mixOmics package (Rohart et al., 2017).”
MethodLi, F., Zhou, Y., Zhang, Y., Yin, J., Qiu, Y., Gao, J., & Zhu, F. (2022) · Briefings in Bioinformatics · doi:10.1093/bib/bbac040 · Cited by 113
High-throughput plant phenotyping: a role for metabolomics?
Hall, R. D., D’Auria, J. C., Ferreira, A. C. S., Gibon, Y., Kruszka, D., Mishra, P., & van de Zedde, H. J. (2022) · Trends in Plant Science · doi:10.1016/j.tplants.2022.02.001 · Cited by 110
Dove, N. C., Taş, N., & Hart, S. C. (2022) · The ISME Journal · doi:10.1038/s41396-022-01232-9 · Cited by 117
Harmonization of quality metrics and power calculation in multi-omic studies
Tarazona, S., Balzano-Nogueira, L., Gómez-Cabrero, D., Schmidt, A., Imhof, A., Hankemeier, T., Tegnér, J., Westerhuis, J. A., & Conesa, A. (2020) · Nature Communications · doi:10.1038/s41467-020-16937-8 · Cited by 105
Integrative omics approaches for biosynthetic pathway discovery in plants
Singh, K. S., van der Hooft, J. J. J., Wees, S. C. M. V., & Medema, M. H. (2022) · Natural Product Reports · doi:10.1039/d2np00032f · Cited by 115
Fletcher, J. R., Erwin, S., Lanzas, C., & Theriot, C. M. (2018) · mSphere · doi:10.1128/msphere.00089-18 · Cited by 106
“difficile transcriptome, we performed a sparse partial least-squares-discriminant analysis (sPLS-DA) as implemented in the mixOmics package (86).”
MethodKhan, N., Cao, T., He, J., Ritzel, R. M., Li, Y., Henry, R. J., Colson, C., Stoica, B. A., Faden, A. I., & Wu, J. (2020) · Brain Behavior and Immunity · doi:10.1016/j.bbi.2020.12.007 · Cited by 113
Healthy aging and muscle function are positively associated with NAD+ abundance in humans
Janssens, G. E., Grevendonk, L., Perez, R. Z., Schomakers, B. V., de Vogel-van den Bosch, J., Geurts, J. M. W., van Weeghel, M., Schrauwen, P., Houtkooper, R. H., & Hoeks, J. (2022) · Nature Aging · doi:10.1038/s43587-022-00174-3 · Cited by 103
Subgingival microbiome in periodontal health, gingivitis and different stages of periodontitis
Iniesta, M., Chamorro, C., Ambrosio, N., Marín, M. J., Sanz, M., & Herrera, D. (2023) · Journal Of Clinical Periodontology · doi:10.1111/jcpe.13793 · Cited by 119
netDx: interpretable patient classification using integrated patient similarity networks
Pai, S., Hui, S., Isserlin, R., Shah, M. A., Kaka, H., & Bader, G. D. (2019) · Molecular Systems Biology · doi:10.15252/msb.20188497 · Cited by 103
Leveraging -omics for asthma endotyping
Tyler, S. R., & Bunyavanich, S. (2019) · Journal of Allergy and Clinical Immunology · doi:10.1016/j.jaci.2019.05.015 · Cited by 117
OmicsAnalyst: a comprehensive web-based platform for visual analytics of multi-omics data
Zhou, G., Ewald, J., & Xia, J. (2021) · Nucleic Acids Research · doi:10.1093/nar/gkab394 · Cited by 106
Fallet, M., Montagnani, C., Petton, B., Dantan, L., de Lorgeril, J., Comarmond, S., Chaparro, C., Toulza, È., Boitard, S., Escoubas, J.-M., et al. (2022) · Microbiome · doi:10.1186/s40168-022-01280-5 · Cited by 126
Zhang, S., Chen, T., Chen, N., Gao, D., Shi, B., Kong, S., West, R. C., Yuan, Y., Zhi, M., Wei, Q., et al. (2019) · Nature Communications · doi:10.1038/s41467-019-08378-9 · Cited by 115
A New Hybrid Seagull Optimization Algorithm for Feature Selection
Jia, H., Xing, Z., & Song, W. (2019) · IEEE Access · doi:10.1109/access.2019.2909945 · Cited by 102
“Furthermore, | R | is the cardinality of the selected subset and | N | is the total number of features in the dataset, α and β are two parameters corresponding to the importance of classification quality and subset length, α ∈ [0 , 1] and β = (1 − α ) adopted from [60].”
BackgroundMethodComputational Oncology in the Multi-Omics Era: State of the Art
de Anda‐Jáuregui, G., & Lemus, E. H. (2020) · Frontiers in Oncology · doi:10.3389/fonc.2020.00423 · Cited by 113
Shah, A. K. P. M., Walter, A., Ottosson, F. A., Russo, F., Navarro-Díaz, M., Boldt, J., Kalinski, J. J., Kontou, E. E., Elofson, J., Polyzois, A., et al. (2024) · Nature Protocols · doi:10.1038/s41596-024-01046-3 · Cited by 116
Disease progression in women with X-linked adrenoleukodystrophy is slow
Huffnagel, I. C., Dijkgraaf, M. G. W., Janssens, G. E., van Weeghel, M., van Geel, B. M., Poll-The, B. T., Kemp, S., & Engelen, M. (2019) · Orphanet Journal of Rare Diseases · doi:10.1186/s13023-019-1008-6 · Cited by 100
“The VIP scores were constructed using partial least squares regression discriminant analysis (PLS-DA) using the R package ‘mixOmics’ [28].”
MethodKostrytsia, A., Papirio, S., Morrison, L., Ijaz, U. Z., Collins, G., Lens, P. N. L., & Esposito, G. (2018) · Bioresource Technology · doi:10.1016/j.biortech.2018.09.044 · Cited by 100
“Sparse Projection to Latent Structure – Discriminant Analysis (sPLS-DA) was performed with the R’s mixOmics package (Rohart et al., 2017).”
BackgroundMethodThe application of artificial neural networks in metabolomics: a historical perspective
Mendez, K. M., Broadhurst, D., & Reinke, S. N. (2019) · Metabolomics · doi:10.1007/s11306-019-1608-0 · Cited by 105
Leclercq, S., Schwarz, M., Delzenne, N. M., Stärkel, P., & de Timary, P. (2021) · Translational Psychiatry · doi:10.1038/s41398-021-01610-5 · Cited by 109
Perspective and Guidelines for Metaproteomics in Microbiome Studies
Zhang, X., & Figeys, D. (2019) · Journal of Proteome Research · doi:10.1021/acs.jproteome.9b00054 · Cited by 111
Zanfardino, M., Franzese, M., Pane, K., Cavaliere, C., Monti, S., Esposito, G., Salvatore, M., & Aiello, M. (2019) · Journal of Translational Medicine · doi:10.1186/s12967-019-2073-2 · Cited by 96
Diagnosis of COVID-19 by exhaled breath analysis using gas chromatography–mass spectrometry
Ibrahim, W., Cordell, R. L., Wilde, M. J., Richardson, M., Carr, L., Dasi, A. S. D., Hargadon, B., Free, R. C., Monks, P. S., Brightling, C. E., et al. (2021) · ERJ Open Research · doi:10.1183/23120541.00139-2021 · Cited by 107
Ding, J., Blencowe, M., Nghiem, T., Ha, S.-M., Chen, Y.-W., Li, G., & Yang, X. (2021) · Nucleic Acids Research · doi:10.1093/nar/gkab405 · Cited by 97
“In terms of approaches, fusion (such as PFA (6), SNF (7), PSDF (8)), Bayesian (e.g. iCluster (9), PSDF (8), BCC (10)), correlation, multivariate (e.g. MFA (11), IntegrOmics (12), MixOmics (13)), pathway and network methods (PARADIGM (14), SNF (7), iOmicsPASS (15), MiBiOmics (16), Lemon-Tree (17), PaintOmics (18), NetI…”
MethodChen, X., Xiong, D., Ye, L., Wang, K., Huang, L., Mei, S., Wu, J., Chen, S., Lai, X., Zheng, L., et al. (2019) · Cancer Cell International · doi:10.1186/s12935-019-0744-y · Cited by 95
Urban ponds as hotspots of antibiotic resistome in the urban environment
Hou, L., Zhang, L., Li, F., Huang, S., Yang, J., Ma, C., Zhang, D., Yu, C., & Hu, A. (2020) · Journal of Hazardous Materials · doi:10.1016/j.jhazmat.2020.124008 · Cited by 99
Statistical challenges in longitudinal microbiome data analysis
Kodikara, S., Ellul, S., & Cao, K. L. (2022) · Briefings in Bioinformatics · doi:10.1093/bib/bbac273 · Cited by 111
“To assess PAM, agglomerative and PCA clustering, we used the ‘stats’ [56], ‘cluster’ [48], ‘mixOmics’ [15] and ‘timeOmics’ [4] R packages, respectively.”
Hyperspectral Canopy Sensing of Wheat Septoria Tritici Blotch Disease
Yu, K., Anderegg, J., Mikaberidze, A., Karisto, P., Mascher, F., McDonald, B. A., Walter, A., & Hund, A. (2018) · Frontiers in Plant Science · doi:10.3389/fpls.2018.01195 · Cited by 103
“PLSDA was implemented using the package “mixOmics” (Rohart et al., 2017).”
MethodMonteverde, E., Gutiérrez, L., Blanco, P., de Vida, F. P., Rosas, J. E., Bonnecarrère, V., Quero, G., & McCouch, S. R. (2019) · G3 Genes Genomes Genetics · doi:10.1534/g3.119.400064 · Cited by 119
Metabolomic assessment of exposure to near-highway ultrafine particles
Walker, D. I., Lane, K., Liu, K., Uppal, K., Patton, A. P., Durant, J. L., Jones, D. P., Brugge, D., & Pennell, K. D. (2018) · Journal of Exposure Science & Environmental Epidemiology · doi:10.1038/s41370-018-0102-5 · Cited by 96
Jin, H., Goossens, P., Juhász, P., Eijgelaar, W. J., Manca, M., Karel, J. M. H., Smirnov, E. N., Sikkink, C. J. J. M., Mees, B., Waring, O. J., et al. (2021) · Clinical and Translational Medicine · doi:10.1002/ctm2.458 · Cited by 115
“23,24 By integrative machine learning 25 we were able to identify a composite disease stage classifier, the performance of which was benchmarked against single-omics derived classifiers using only mRNA expression or protein/peptide abundance and validated in several independent plaque datasets (GEO…”
InfluentialBonicelli, A., Mickleburgh, H. L., Chighine, A., Locci, E., Wescott, D. J., & Procopio, N. (2022) · eLife · doi:10.7554/elife.83658 · Cited by 113
“Furthermore, variable selection ( Singh et al., 2019 ; Rohart et al., 2017 ) would offer the advantage of simplifying experimental procedures and targets those markers that behave consistently with PMI.”
InfluentialArginine and Carnitine Metabolites Are Altered in Diabetic Retinopathy
Sumarriva, K., Uppal, K., Ma, C., Herren, D. J., Wang, Y., Chocron, I. M., Warden, C., Mitchell, S. L., Burgess, L. G., Goodale, M. P., et al. (2019) · Investigative Ophthalmology & Visual Science · doi:10.1167/iovs.19-27321 · Cited by 101
“Metabolic features that discriminate between the comparison groups were identified using the variable importance for projection (VIP) greater than or equal to 2 criterion based on partial least squares discriminant analysis (PLS-DA) implemented in the R package mixOmics.(32) Features with VIP greater than one are gene…”
Larremore, D. B., Fosdick, B. K., Bubar, K. M., Zhang, S., Kissler, S. M., Metcalf, C. J. E., Buckee, C. O., & Grad, Y. H. (2021) · eLife · doi:10.7554/elife.64206 · Cited by 95
Anammox process dosed with biochars for enhanced nitrogen removal: Role of surface functional groups
Xu, J., Wu, X., Zhu, N., Shen, Y., & Yuan, H. (2020) · The Science of The Total Environment · doi:10.1016/j.scitotenv.2020.141367 · Cited by 92
Jones, J. C., Reinke, S. N., Alishum, A., Palmer, D. J., & Christophersen, C. T. (2021) · Scientific Reports · doi:10.1038/s41598-021-93031-z · Cited by 104
Interpretation of network-based integration from multi-omics longitudinal data
Bodein, A., Scott-Boyer, M.-P., Perin, O., Lê Cao, K.-A., & Droit, A. (2022) · Nucleic Acids Research · doi:10.1093/nar/gkab1200 · Cited by 89
TidyMass an object-oriented reproducible analysis framework for LC–MS data
Shen, X., Yan, H., Wang, C., Gao, P., Johnson, C. H., & Snyder, M. P. (2022) · Nature Communications · doi:10.1038/s41467-022-32155-w · Cited by 107
Diet leaves a genetic signature in a keystone member of the gut microbiota
Dapa, T., Ramiro, R. S., Pedro, M. F., Gordo, I., & Xavier, K. B. (2022) · Cell Host & Microbe · doi:10.1016/j.chom.2022.01.002 · Cited by 91
The metaRbolomics Toolbox in Bioconductor and beyond
Stanstrup, J., Broeckling, C. D., Helmus, R., Hoffmann, N., Mathé, E. A., Naake, T., Nicolotti, L., Peters, K., Rainer, J., Salek, R. M., et al. (2019) · Metabolites · doi:10.3390/metabo9100200 · Cited by 102
“Feature/variable selection is performed to find only the most significant metabolite candidates that explain the underlying research question, usually using univariate methods to target only specific metabolites that are interesting to the research question of the study [162] [163] [164] [165] .”
BackgroundShetty, S. A., & Lahti, L. (2019) · Journal of Biosciences · doi:10.1007/s12038-019-9930-2 · Cited by 106
van Bommel, E. J. M., Herrema, H., Davids, M., Kramer, M. H. H., Nieuwdorp, M., & van Raalte, D. H. (2020) · Diabetes & Metabolism · doi:10.1016/j.diabet.2019.11.005 · Cited by 90
Integration of multi-omics technologies for crop improvement: Status and prospects
Zhang, R., Zhang, C., Yu, C., Dong, J., & Hu, J. (2022) · Frontiers in Bioinformatics · doi:10.3389/fbinf.2022.1027457 · Cited by 118
“Software Supported omics platform Core algorithm Availability/URL Reference CARMO Genomics and transcriptomics Database http://bioinfo.sibs.ac.cn/ carmo Wang et al. (2015) DCT Integration of transcriptome data from different tissues Joint correlation non-negative matrix factorization (jcNMF) https://github.com/ ztpub/…”
MethodInterrelation between gut microbiota, SCFA, and fatty acid composition in pigs
Sebastià, C., Folch, J. M., Ballester, M., Estellé, J., Passols, M., Muñoz, M., Casco, J. M. G., Fernández, A. I., Castelló, A., Sánchez, A., et al. (2023) · mSystems · doi:10.1128/msystems.01049-23 · Cited by 105
Metabolomic networks connect host-microbiome processes to human Clostridioides difficile infections
Robinson, J. I., Weir, W. H., Crowley, J. R., Hink, T., Reske, K. A., Kwon, J. H., Burnham, C.-A. D., Dubberke, E. R., Mucha, P. J., & Henderson, J. P. (2019) · Journal of Clinical Investigation · doi:10.1172/jci126905 · Cited by 88
Metaproteomics: A strategy to study the taxonomy and functionality of the gut microbiota
Wang, Y., Zhou, Y., Xiao, X., Zheng, J., & Zhou, H. (2020) · Journal of Proteomics · doi:10.1016/j.jprot.2020.103737 · Cited by 90
Spor, A., Roucou, A., Mounier, A., Bru, D., Breuil, M., Fort, F., Vile, D., Roumet, P., Philippot, L., & Violle, C. (2020) · Scientific Reports · doi:10.1038/s41598-020-69175-9 · Cited by 102
Metadata
- Authors
- Rohart, F., Gautier, B., Singh, A., & Lê Cao, K.-A.
- Affiliations
- Translational Research Institute (AU)
- University of British Columbia (CA)
- Venue
- PLOS Computational Biology
- Publisher
- Public Library of Science (PLoS)
- Published
- 2017-11-03
- Volume
- 13
- Issue
- 11
- Pages
- e1005752
- ISSN
- 1553-734X (ISSN-L)
- 1553-7358
- PMC
- PMC5687754
- OpenAlex
- W2950985821
- Cited by
- 4,056
- References
- 57
- Citations by year
- 2026: 629 · 2025: 612 · 2024: 600 · 2023: 523 · 2022: 496 · 2021: 489 · 2020: 350 · 2019: 241 · 2018: 95 · 2017: 14
- FWCI
- 78.13
- Type
- journal article
- Language
- en
- Update notices
- new_version (2017-11-15)
- Open access
- gold
- doi.org
- Licence
- Locations
- PLoS Computational Biology (publishedVersion, cc-by)
- bioRxiv (Cold Spring Harbor Laboratory) (acceptedVersion, cc-by-nc-nd)
- PubMed Central (publishedVersion, cc-by)
- PubMed (publishedVersion)
- Minerva Access (University of Melbourne) (submittedVersion, cc-by)
- RePEc: Research Papers in Economics (submittedVersion)
- DOAJ (DOAJ: Directory of Open Access Journals) (submittedVersion, cc-by-sa)
- Figshare (submittedVersion, cc-by)
- Funders
- National Health and Medical Research Council (APP1087415)
- Australian Cancer Research Foundation (ACRF) for the Diamantina Individualised Oncology Care Centre
- Topics
- Life Sciences › Biochemistry, Genetics and Molecular Biology › Molecular Biology › Bioinformatics and Genomic Networks
- Life Sciences › Biochemistry, Genetics and Molecular Biology › Molecular Biology › Metabolomics and Mass Spectrometry Studies
- Life Sciences › Biochemistry, Genetics and Molecular Biology › Molecular Biology › Gene expression and cancer classification
- Keywords
- R package, multi-omics integration, feature selection, multivariate analysis, dimensionality reduction, partial least squares regression, discriminant analysis, molecular signatures, systems biology, transcriptomics, proteomics, metabolomics, exploratory data analysis
- MeSH terms
- Data Interpretation, Statistical, Humans, Neoplasms, Software, Computational Biology, Genomics, Systems Biology, Metabolomics
About these checks
Registry, retraction, Cites and statistics results are computed, not judged, with one exception: a printed reference that no index lists is read once by a model before it counts as a citation error. Claims are extracted by a model and kept only when their quote appears verbatim in the text; each cited source is then checked, with a model’s help, for whether it says what the claim relies on. Those verdicts can be wrong — read the claim’s quote and the cited source before relying on one.
Statistics and arithmetic are recomputed, not judged.
Confidence bands are shown only for fields calibrated on our annotated test set. None is calibrated yet, so no band is shown.
What counts as a claim ›How we measure confidence ›How we check this ›
Are you an author, or do you see a problem with this page? Request a review
Data sources
Bibliographic data: Semantic Scholar, OpenAlex, Crossref.
Contains information from the Semantic Scholar Academic Graph Datasets, made available under the ODC Attribution License (ODC-BY 1.0).
Semantic Scholar’s data is described in: Kinney, R., et al. (2023). The Semantic Scholar Open Data Platform. arXiv:2301.10140.
