

Population Structure and Eigenanalysis
Open accessThe DOI matches its Crossref record; 48 of the 49 references it cites were found in a registry or an index.
Abstract
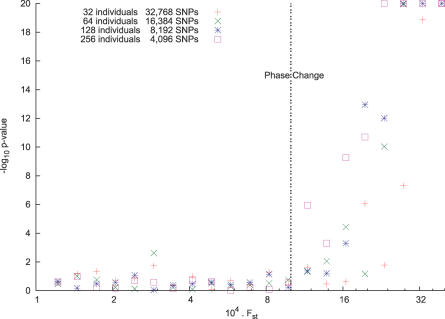
Current methods for inferring population structure from genetic data do not provide formal significance tests for population differentiation. We discuss an approach to studying population structure (principal components analysis) that was first applied to genetic data by Cavalli-Sforza and colleagues. We place the method on a solid statistical footing, using results from modern statistics to develop formal significance tests. We also uncover a general "phase change" phenomenon about the ability to detect structure in genetic data, which emerges from the statistical theory we use, and has an important implication for the ability to discover structure in genetic data: for a fixed but large dataset size, divergence between two populations (as measured, for example, by a statistic like FST) below a threshold is essentially undetectable, but a little above threshold, detection will be easy. This means that we can predict the dataset size needed to detect structure.
Overview
The claims and statistics of this paper haven’t been checked yet.
Free: it reads the open-access text and checks the first 5 claims that cite a source we can check. Create a free account to check every claim.
Integrity signals
Registry
Cites
Statistics
Figures
Verification
Claims the paper makes
The claims and statistics of this paper haven’t been checked yet.
Free: it reads the open-access text and checks the first 5 claims that cite a source we can check. Create a free account to check every claim.
Claims other papers make about this one
Each is checked against this paper’s own text: does it say what the citing paper says it does?
The source backs part of the claim, not all of it — or backs it for a different population, condition or comparison.
In the citing paper
“It is notable that PCA clustering is sensitive to the sample size of different ancestries and also to their amount of genetic drift, which exaggerates principal component distances 207,208,211,212 .”
From Ancient DNA analysis (2021) · cites this paper as [207]
Experimental — accuracy not yet measured
Self-check
Percentages, sums and reported differences re-computed from the paper’s own numbers.
The self-check needs the paper’s full text.
Citations
Cites
Inference of Population Structure Using Multilocus Genotype Data
Pritchard, J. K., Stephens, M., & Donnelly, P. (2000) · Genetics · doi:10.1093/genetics/155.2.945 · Cited by 33,908
Principal components analysis corrects for stratification in genome-wide association studies
Price, A. L., Patterson, N. J., Plenge, R. M., Weinblatt, M. E., Shadick, N. A., & Reich, D. (2006) · Nature Genetics · doi:10.1038/ng1847 · Cited by 10,248 · cited 2×
“A parallel paper [14] explores applications to medical genetics.”
BackgroundSelf-citationFalush, D., Stephens, M., & Pritchard, J. K. (2003) · Genetics · doi:10.1093/genetics/164.4.1567 · Cited by 7,959
The International HapMap Project
†The International HapMap Consortium, Genotyping centres: Baylor College of Medicine and ParAllele BioScience, Gibbs, R. A., Belmont, J. W., Hardenbol, P., Willis, T. D., Yu, F., Chinese HapMap Consortium, Yang, H., Ch'ang, L.-Y., et al. (2003) · Nature · doi:10.1038/nature02168 · Cited by 6,057
A haplotype map of the human genome
The International HapMap Consortium (2005) · Nature · doi:10.1038/nature04226 · Cited by 5,858 · cited 1×
“For instance, in the International Haplotype Map project [ 26 ], markers were chosen about 5,000 bases apart (phase 1), or about 1,000 bases apart (phase 2), and so nearby markers will often be in LD. Mathematically this will induce correlation between nearby columns of our matrix M. The effect of this will be that th…”
BackgroundSpielman, R. S., McGinnis, R. E., & Ewens, W. J. (1993) · PubMed · Cited by 3,651
Searle, S. R., & Searle, S. R. (1971) · Cited by 3,229
The History and Geography of Human Genes: Abridged paperback Edition
Cavalli-Sforza, L. L., Menozzi, P., & Piazza, A. (2018) · Princeton University Press eBooks · doi:10.2307/j.ctv301gjp · Cited by 3,175
Genomic Control for Association Studies
Devlin, B., & Roeder, K. (1999) · Biometrics · doi:10.1111/j.0006-341x.1999.00997.x · Cited by 3,162 · cited 3×
“If e([1]) is the principal eigenvector of the matrix X, this means that the sum of squares”
BackgroundOn the distribution of the largest eigenvalue in principal components analysis
Johnstone, I. M. (2001) · The Annals of Statistics · doi:10.1214/aos/1009210544 · Cited by 1,949 · cited 13×
“> λm, then Johnstone [1] shows that with suitable normalization and for large m and n, the largest eigenvalue λ1 is well approximated by the Tracy-Widom distribution.”
BackgroundMethodInfluential
Research works printed but not linked: 39
- Devlin, 1999, Biometrics, 55, 997
- Menozzi, 1978, Science, 201, 786
- Cavalli-Sforza, 2003, Nat Genet, 33, 266
- Shriver, 2005, Human Genomics, 2, 81
- Capelli, 2006, Ann Hum Genet, 70, 207
- Lovell, 2005, Ann Hum Genet, 69, 275
- Stoneking, 1997, Genome Res, 7, 1061
- Pritchard, 2000, Genetics, 155, 945
- Falush, 2003, Genetics, 164, 1567
- Hoggart, 2004, Am J Hum Genet, 74, 965
- Patterson, 2004, Am J Hum Genet, 74, 979
- Montana, 2004, Am J Hum Genet, 75, 771
- Price, 2006, Nat Genet, 38, 904
- Baik, 2005, Ann Probability, 33, 1643
- Baik, 2006, J Multivariate Anal, 97, 1643
- Nicholson, 2002, JRSS(B), 64, 695
- Bowcock, 1994, Nature, 368, 455
- Johnstone, 2001, Ann Stat, 29, 295
- Tracy, 1994, Commun Math Phys, 159, 151
- El Karoui, 2003, On the largest eigenvalue of Wishart matrices with identity covariance when p/n → ∞
- Soshnikov, 2002, J Stat Physics, 108, 1033
- Altshuler, 2005, Nature, 437, 1299
- Macarthur, 1957, Proc Natl Acad Sci U S A, 43, 293
- Pielou, 1975, Ecological diversity
- Ramachandran, 2005, Proc Natl Acad Sci, 102, 15942
- Gibbs, 2004, Nature, 426, 789
- Smith, 2004, Am J Hum Genet, 74, 1001
- Daly, 2001, Nat Genet, 29, 229
- Patil, 2001, Science, 294, 1719
- Allen, 2003, Am J Hum Genet, 72, 671
- Clayton, 2005, Nat Genet, 37, 1243
- Serre, 2004, Genome Res, 14, 1679
- Spielman, 1993, Am J Hum Genet, 52, 506
- Freedman, 2004, Nat Genet, 36, 388
- Marchini, 2004, Nat Genet, 36, 512
- Helgason, 2005, Nat Genet, 37, 90
- Balding, 1995, Genetica, 96, 3
- Rosenberg, 2006, Ann Hum Gen, 70, 841
- Schaffner, 2005, Genome Res, 15, 1576
Cited by
Items 501–600 of 1,074
Semagn, K., Magorokosho, C., Vivek, B., Makumbi, D., Beyene, Y., Mugo, S., Prasanna, B. M., & Warburton, M. L. (2012) · BMC Genomics · doi:10.1186/1471-2164-13-113 · Cited by 159
“The main challenges in analyzing any genetic dataset are to (a) explore whether a given population is homogeneous or contains genetically distinct subgroups, and (b) identify quantitative evidence that supports the presence of these groups [38].”
BackgroundHistorical genomics of North American maize
van Heerwaarden, J., Hufford, M. B., & Ross‐Ibarra, J. (2012) · Proceedings of the National Academy of Sciences · doi:10.1073/pnas.1209275109 · Cited by 175
“We find 39 significant principal components (PCs) (18), of which the first three clearly relate to historical patterns of differentiation (Fig.”
BackgroundMethodDenisovan Ancestry in East Eurasian and Native American Populations
Qin, P., & Stoneking, M. (2015) · Molecular Biology and Evolution · doi:10.1093/molbev/msv141 · Cited by 158
González-Fortes, G., Jones, E. R., Lightfoot, E., Bonsall, C., Lazar, C., Grandal-d’Anglade, A., Garralda, M. D., Drak, L., Siska, V., Simalcsik, A., et al. (2017) · Current Biology · doi:10.1016/j.cub.2017.05.023 · Cited by 158
“com/DReichLab/EIG ADMIXTOOLS [44] https://github.”
BackgroundMethodInfluentialThe spread of steppe and Iranian-related ancestry in the islands of the western Mediterranean
Fernandes, D. M., Mittnik, A., Olalde, I., Lazaridis, I., Cheronet, O., Rohland, N., Mallick, S., Bernardos, R., Broomandkhoshbacht, N., Carlsson, J., et al. (2020) · Nature Ecology & Evolution · doi:10.1038/s41559-020-1102-0 · Cited by 153
Self-citationPendleton, A. L., Shen, F., Taravella, A. M., Emery, S., Veeramah, K. R., Boyko, A. R., & Kidd, J. M. (2018) · BMC Biology · doi:10.1186/s12915-018-0535-2 · Cited by 156
Genetic Variation in Human DNA Replication Timing
Koren, A., Handsaker, R. E., Kamitaki, N., Karlić, R., Ghosh, S., Polak, P., Eggan, K., & McCarroll, S. A. (2014) · Cell · doi:10.1016/j.cell.2014.10.025 · Cited by 157
“Furthermore, in a principal component analysis (Patterson et al., 2006) of read depth along each of the LCL genomes, the strongest principal component, explaining 40% of the variance, corresponded to our estimate of the S phase replication content of each sample, and the chromosomal loadings of this component followed…”
Principal Component Analysis under Population Genetic Models of Range Expansion and Admixture
Francois, O., Currat, M., Ray, N., Han, E., Excoffier, L., & Novembre, J. (2010) · Molecular Biology and Evolution · doi:10.1093/molbev/msq010 · Cited by 151
“These methods are commonly used computational tools for inferring population genetic structure, and the connection between PCA and admixture estimation methods (which are closely related to AM) has been recently investigated by Patterson et al. (2006).”
BackgroundMethodInfluentialDeagle, B. E., Jones, F. C., Chan, Y. F., Absher, D., Kingsley, D. M., & Reimchen, T. E. (2011) · Proceedings of the Royal Society B Biological Sciences · doi:10.1098/rspb.2011.1552 · Cited by 167
Martiniano, R., Cassidy, L. M., Ó'Maoldúin, R., McLaughlin, R., Silva, N. M., Manco, L., Fidalgo, D., Pereira, T., Coelho, M. J., Serra, M., et al. (2017) · PLOS Genetics · doi:10.1371/journal.pgen.1006852 · Cited by 161
“Smartpca version 10210 from EIGENSOFT [51,52] was used to perform PCA on a subset of West Eurasian populations (604 individuals) from the Human Origins dataset [2], based on approximately 600,000 SNPs (S3 Text, S4 Fig).”
MethodLindo, J., Achilli, A., Perego, U. A., Archer, D., Valdiosera, C., Petzelt, B., Mitchell, J., Worl, R., Dixon, E. J., Fifield, T. E., et al. (2017) · Proceedings of the National Academy of Sciences · doi:10.1073/pnas.1620410114 · Cited by 159
Predicting future from past: The genomic basis of recurrent and rapid stickleback evolution
Kingman, G. A. R., Vyas, D. N., Jones, F. C., Brady, S. D., Chen, H. I., Reid, K., Milhaven, M., Bertino, T. S., Aguirre, W. E., Heins, D. C., et al. (2021) · Science Advances · doi:10.1126/sciadv.abg5285 · Cited by 171
A comparison of individual‐based genetic distance metrics for landscape genetics
Shirk, A. J., Landguth, E. L., & Cushman, S. A. (2017) · Molecular Ecology Resources · doi:10.1111/1755-0998.12684 · Cited by 168
“In landscape genetics of discrete populations separated by strong barriers, these large eigenvectors have been shown to correspond to the major genetic clusters in a population (Patterson et al. 2006; Jombart 2008); however, their meaning in continuous populations under IBD and IBR is less clear.”
BackgroundInfluentialAncient human parallel lineages within North America contributed to a coastal expansion
Scheib, C. L., Li, H., Desai, T., Link, V., Kendall, C., Dewar, G., Griffith, P. W., Mörseburg, A., Johnson, J. R., Potter, A., et al. (2018) · Science · doi:10.1126/science.aar6851 · Cited by 125
Introgressing the Aegilops tauschii genome into wheat as a basis for cereal improvement
Zhou, Y., Bai, S., Li, H., Sun, G., Zhang, D., Ma, F., Zhao, X., Nie, F., Li, J., Chen, L., et al. (2021) · Nature Plants · doi:10.1038/s41477-021-00934-w · Cited by 166
Der Sarkissian, C., Allentoft, M. E., Ávila-Arcos, M. C., Barnett, R., Campos, P. F., Cappellini, E., Ermini, L., Fernández, R., da Fonseca, R., Ginolhac, A., et al. (2015) · Philosophical Transactions of the Royal Society B: Biological Sciences · doi:10.1098/rstb.2013.0387 · Cited by 144
Neafsey, D. E., Schaffner, S. F., Volkman, S. K., Park, D. J., Montgomery, P. G., Milner, D. A., Lukens, A. K., Rosen, D. M., Daniels, R. F., Houde, N., et al. (2008) · Genome biology · doi:10.1186/gb-2008-9-12-r171 · Cited by 152
“Additional data file 8 contains results from principal components analysis of population data using SmartPCA.”
MethodInfluentialSeqArray—a storage-efficient high-performance data format for WGS variant calls
Zheng, X., Gogarten, S. M., Lawrence, M., Stilp, A. M., Conomos, M. P., Weir, B. S., Laurie, C. C., & Levine, D. (2017) · Bioinformatics · doi:10.1093/bioinformatics/btx145 · Cited by 152
Quality Control for Genome-Wide Association Studies
Weale, M. E. (2010) · Methods in Molecular Biology · doi:10.1007/978-1-60327-367-1_19 · Cited by 149
Genomic History of Neolithic to Bronze Age Anatolia, Northern Levant, and Southern Caucasus
Skourtanioti, E., Erdal, Y. S., Frangipane, M., Balossi Restelli, F., Yener, K. A., Pinnock, F., Matthiae, P., Özbal, R., Schoop, U.-D., Guliyev, F., et al. (2020) · Cell · doi:10.1016/j.cell.2020.04.044 · Cited by 151
“The Chalcolithic and Bronze Age populations from Iran (Iran_C from the Seh Gabi site) and the Caucasus (Allentoft et al., 2015; Lazaridis et al., 2016; Wang et al., 2019)— temporally closer to LC-LBA and located between Iran_N/CHG and LC-LBA in the PCA—also occasionally only share more alleles with some of the LC-LBA…”
InfluentialLarge Deviations of the Maximum Eigenvalue for Wishart and Gaussian Random Matrices
Majumdar, S. N., & Vergassola, M. (2009) · Physical Review Letters · doi:10.1103/physrevlett.102.060601 · Cited by 151
A Genomic Resource for the Development, Improvement, and Exploitation of Sorghum for Bioenergy
Brenton, Z. W., Cooper, E., Myers, M. T., Boyles, R. E., Shakoor, N., Zielinski, K. J., Rauh, B. L., Bridges, W. C., Morris, G. P., & Kresovich, S. (2016) · Genetics · doi:10.1534/genetics.115.183947 · Cited by 161
“Principal component analysis was conducted using the EIGENSTRATmethod (Patterson et al. 2006) (version 6.0.1) using the “Smart PCA” Perl command.”
MethodInfluentialFine-Scale Genetic Structure in Finland
Kerminen, S., Havulinna, A. S., Hellenthal, G., Martin, A. R., Sarin, A.-P., Perola, M., Palotie, A., Salomaa, V., Daly, M. J., Ripatti, S., et al. (2017) · G3 Genes|Genomes|Genetics · doi:10.1534/g3.117.300217 · Cited by 146
Genome-wide pharmacogenomic analysis of response to treatment with antipsychotics
McClay, J. L., Adkins, D. E., Åberg, K., Stroup, S., Perkins, D. O., Vladimirov, V. I., Lieberman, J. A., Sullivan, P. F., & van den Oord, E. J. C. G. (2011) · Molecular Psychiatry · doi:10.1038/mp.2009.89 · Cited by 149
Wang, M. L., Zhu, C., Anglin, N. L., Chen, Z., Erpelding, J. E., Murray, S. C., Tuinstra, M. R., Tesso, T., PEDERSON, G. A., & Yu, J. (2009) · Theoretical and Applied Genetics · doi:10.1007/s00122-009-1155-6 · Cited by 150
“…component analysis (PCA) and nonmetric multidimensional scaling (nMDS) were conducted to construct plots of the most significant axes for grouping pattern verification and to obtain axes for further model testing and association mapping (Patterson et al. 2006; Price et al. 2007; Zhu and Yu 2009).”
MethodWang, C., Zhan, X., Liang, L., Abecasis, G. R., & Lin, X. (2015) · The American Journal of Human Genetics · doi:10.1016/j.ajhg.2015.04.018 · Cited by 160
Ancient DNA from Guam and the peopling of the Pacific
Pugach, I., Hübner, A., Hung, H., Meyer, M., Carson, M. T., & Stoneking, M. (2020) · Proceedings of the National Academy of Sciences · doi:10.1073/pnas.2022112118 · Cited by 156
“PCA was performed as described previously (93) with one modification, namely for the analyses which included ancient samples, the principle axes were calculated based on modern samples, and the ancient samples were projected using least-squares projection (which is more appropriate than orthogonal projection for sampl…”
MethodMeleshko, O., Martin, M. D., Korneliussen, T. S., Schröck, C., Lamkowski, P., Schmutz, J., Healey, A. L., Piatkowski, B. T., Shaw, A. J., Weston, D. J., et al. (2021) · Molecular Biology and Evolution · doi:10.1093/molbev/msab063 · Cited by 155
“Following (Patterson et al. 2006), we generated eigenvectors for the covariance matrix in R and performed a Tracy-Widom test to determine the significance of the eigenvalues using the package “AssocTest” (Wang et al.”
MethodAPOL1 Genotype and Race Differences in Incident Albuminuria and Renal Function Decline
Peralta, C. A., Bibbins-Domingo, K., Vittinghoff, E., Lin, F., Fornage, M., Kopp, J. B., & Winkler, C. A. (2016) · Journal of the American Society of Nephrology · doi:10.1681/asn.2015020124 · Cited by 145
Valdiosera, C., Günther, T., Vera-Rodríguez, J. C., Ureña, I., Iriarte, E., Rodríguez-Varela, R., Simões, L. G., Martínez-Sánchez, R. M., Svensson, E. M., Malmström, H., et al. (2018) · Proceedings of the National Academy of Sciences · doi:10.1073/pnas.1717762115 · Cited by 131
“For each ancient individual, a PCAwas conducted together with modern Europeans from the Human Origins panel using smartpca (62).”
MethodMegalithic tombs in western and northern Neolithic Europe were linked to a kindred society
Sánchez-Quinto, F., Malmström, H., Fraser, M., Girdland-Flink, L., Svensson, E. M., Simões, L. G., George, R., Hollfelder, N., Burenhult, G., Noble, G., et al. (2019) · Proceedings of the National Academy of Sciences · doi:10.1073/pnas.1818037116 · Cited by 138
“For each ancient individual, a PCA was conducted together with 203 modern Europeans (70, 71), and ancient individuals were plotted using Procrustes transformation (72).”
MethodThe genetic origin of Huns, Avars, and conquering Hungarians
Maróti, Z., Neparáczki, E., Schütz, O., Maár, K., Varga, G. I. B., Kovács, B., Kalmár, T., Nyerki, E., Nagy, I., Latinovics, D., et al. (2022) · Current Biology · doi:10.1016/j.cub.2022.04.093 · Cited by 166
On the Origin of Tibetans and Their Genetic Basis in Adapting High-Altitude Environments
Wang, B., Zhang, Y.-B., Zhang, F., Lin, H., Wang, X., Wan, N., Ye, Z., Weng, H., Zhang, L., Li, X., et al. (2011) · PLoS ONE · doi:10.1371/journal.pone.0017002 · Cited by 149
“Principle component analyses were performed with the smartPCA software [45].”
MethodGenetic correlation between amyotrophic lateral sclerosis and schizophrenia
McLaughlin, R. L., Schijven, D., van Rheenen, W., van Eijk, K. R., O’Brien, M., Kahn, R. S., Ophoff, R. A., Goris, A., Bradley, D. G., Al-Chalabi, A., et al. (2017) · Nature Communications · doi:10.1038/ncomms14774 · Cited by 145
“Briefly, principal component analysis was carried out for each stratum using smartpca 36 and the three-dimensional space defined by principal components 1–3 was equally subdivided into 1,000 cubes.”
MethodVeeramah, K. R., Rott, A., Groß, M., van Dorp, L., López, S., Kirsanow, K., Sell, C., Blöcher, J., Wegmann, D., Link, V., et al. (2018) · Proceedings of the National Academy of Sciences · doi:10.1073/pnas.1719880115 · Cited by 141
“When analyzing data from the 5-Mb neutralome, each distinct 1kb haplotype from each of the ∼5,000 regions was coded as a distinct biallelic SNP allele and all samples were analyzed simultaneously (38).”
MethodTan, B., Grattapaglia, D., Martins, G. S., Ferreira, K. Z., Sundberg, B., & Ingvarsson, P. K. (2017) · BMC Plant Biology · doi:10.1186/s12870-017-1059-6 · Cited by 164
“Among the available family-based and population based methods we assessed the following programs for imputation accuracy: BEAGLE [26], fastPHASE [27], MENDEL [28], random forest, SVD Impute, k-nearest neighbors [29], BLUP A matrix, Bayesian PCA, NIPALS, Probabilistic PCA [30].”
MethodInfluentialBalancing selection maintains hyper-divergent haplotypes in Caenorhabditis elegans
Lee, D., Zdraljevic, S., Stevens, L., Wang, Y., Tanny, R. E., Crombie, T. A., Cook, D. E., Webster, A. K., Chirakar, R., Baugh, L. R., et al. (2021) · Nature Ecology & Evolution · doi:10.1038/s41559-021-01435-x · Cited by 154
“1.4) 35,81 was used to perform principal component analysis.”
InfluentialEnrichment of statistical power for genome-wide association studies
Li, M., Liu, X., Bradbury, P. J., Yu, J., Zhang, Y., Todhunter, R. J., Buckler, E. S., & Zhang, Z. (2014) · BMC Biology · doi:10.1186/s12915-014-0073-5 · Cited by 172
“The first few principal components may reflect broad patterns of similarity across individuals [15-17].”
BackgroundNeuditschko, M., Khatkar, M. S., & Raadsma, H. W. (2012) · PLoS ONE · doi:10.1371/journal.pone.0048375 · Cited by 157
“correct for population stratification [20,21], whilst in population”
BackgroundThe emergence of whole genome association scans in barley
Waugh, R., Jannink, J., Muehlbauer, G. J., & Ramsay, L. (2009) · Current Opinion in Plant Biology · doi:10.1016/j.pbi.2008.12.007 · Cited by 146
A 5700 year-old human genome and oral microbiome from chewed birch pitch
Jensen, T. Z. T., Niemann, J., Iversen, K. H., Fotakis, A. K., Gopalakrishnan, S., Vågene, Å. J., Pedersen, M. W., Sinding, M.-H. S., Ellegaard, M. R., Allentoft, M. E., et al. (2019) · Nature Communications · doi:10.1038/s41467-019-13549-9 · Cited by 137
A frequent oligogenic involvement in congenital hypothyroidism
de Filippis, T., Gelmini, G., Paraboschi, E., Vigone, M. C., Di Frenna, M., Marelli, F., Bonomi, M., Cassio, A., Larizza, D., Moro, M., et al. (2017) · Human Molecular Genetics · doi:10.1093/hmg/ddx145 · Cited by 145
Universality of covariance matrices
Pillai, N. S., & Yin, J. O. S. (2014) · The Annals of Applied Probability · doi:10.1214/13-aap939 · Cited by 145
“They have manifold applications in various applied fields; see [7, 22, 23, 24] for an extensive account on statistical applications, [21, 29] for applications in economics and [30] in population genetics to name a few.”
BackgroundSaremi, N. F., Supple, M. A., Byrne, A., Cahill, J. A., Coutinho, L. L., Dalén, L., Figueiró, H. V., Johnson, W. E., Milne, H. J., O’Brien, S. J., et al. (2019) · Nature Communications · doi:10.1038/s41467-019-12741-1 · Cited by 137
Wang, K., Goldstein, S., Bleasdale, M., Clist, B., Bostoen, K., Bakwa-Lufu, P., Buck, L. T., Crowther, A., Dème, A., McIntosh, R. J., et al. (2020) · Science Advances · doi:10.1126/sciadv.aaz0183 · Cited by 146
Correction for hidden confounders in the genetic analysis of gene expression
Listgarten, J., Kadie, C., Schadt, E. E., & Heckerman, D. (2010) · Proceedings of the National Academy of Sciences · doi:10.1073/pnas.1002425107 · Cited by 144
“Mixed-effects models are complemented in the association literature by principal components based approaches such as Eigenstrat, SVA, and similar algorithms (11, 15, 17, 22, 23, 25).”
MethodA major locus controls local adaptation and adaptive life history variation in a perennial plant
Wang, J., Ding, J., Tan, B., Robinson, K. M., Michelson, I. H., Johansson, A., Nystedt, B., Scofield, D. G., Nilsson, O., Jansson, S., et al. (2018) · Genome Biology · doi:10.1186/s13059-018-1444-y · Cited by 145
“%) detected by at least two of the three methods (PCAdapt, LFMM, and GEMMA) were clustered in a single genomic region on pseudo-chromosome 10, we performed several further steps to refine the anchoring and orientation of these SNPs within this region.”
MethodInfluentialHigh Loading of Polygenic Risk for ADHD in Children With Comorbid Aggression
Hamshere, M. L., Langley, K., Martin, J., Agha, S. S., Stergiakouli, E., Anney, R. J. L., Buitelaar, J., Faraone, S. V., Lesch, K.-P., Neale, B. M., et al. (2013) · American Journal of Psychiatry · doi:10.1176/appi.ajp.2013.12081129 · Cited by 144
“To allow for population stratification in our data, we conditioned on two covariates (the first two principal components estimated from our GWAS data using the EIGENSTRAT software package, which was designed for this purpose (35, 36).”
MethodWilling, E., Bentzen, P., van Oosterhout, C., Hoffmann, M., Cable, J., Breden, F. J., Weigel, D., & Dreyer, C. (2010) · Molecular Ecology · doi:10.1111/j.1365-294x.2010.04528.x · Cited by 166
“To reduce the impact of small sample sizes, we used individual based clustering methods, which fail to detect population substructure if sample sizes are too small and population differentiation is too weak (Patterson et al. 2006).”
MethodInfluentialHolzinger, E. R., Grady, B. J., Ritchie, M. D., Ribaudo, H. J., Acosta, E. P., Morse, G. D., Gulick, R. M., Robbins, G. K., Clifford, D. B., Daar, E. S., et al. (2012) · Pharmacogenetics and Genomics · doi:10.1097/fpc.0b013e32835a450b · Cited by 143
Zhu, C., & Yu, J. (2009) · Genetics · doi:10.1534/genetics.108.098863 · Cited by 143
“…1999; Devlin et al. 2004) and structured association based on Bayesian clustering (Pritchard et al. 2000; Falush et al. 2003, 2007), principal component analysis (PCA) was recently suggested as a fast and effective way to diagnose population structure (Price et al. 2006; Patterson et al. 2007).”
BackgroundMethodStucki, S., Orozco‐terWengel, P., Forester, B. R., Duruz, S., Colli, L., Masembe, C., Negrini, R., Landguth, E. L., Jones, M. R., Bruford, M. W., et al. (2016) · Molecular Ecology Resources · doi:10.1111/1755-0998.12629 · Cited by 157
“For LFMM, K was determined using the Patterson method (Patterson et al. 2006) as suggested by Frichot et al.”
MethodComplex Patterns of Local Adaptation in Teosinte
Pyhäjärvi, T., Hufford, M. B., Mezmouk, S., & Ross‐Ibarra, J. (2013) · Genome Biology and Evolution · doi:10.1093/gbe/evt109 · Cited by 153
“The number of significant principal components was estimated based on the Tracy-Widom distribution (Patterson et al. 2006).”
BackgroundMethodAssociation mapping of salt tolerance in barley (Hordeum vulgare L.)
Long, N. V., Dolstra, O., Malosetti, M., Kilian, B., Graner, A., Visser, R. G. F., & van der Linden, C. G. (2013) · Theoretical and Applied Genetics · doi:10.1007/s00122-013-2139-0 · Cited by 143
Human Adaptation to Arsenic-Rich Environments
Schlebusch, C. M., Gattepaille, L. M., Engström, K., Vahter, M., Jakobsson, M., & Broberg, K. (2015) · Molecular Biology and Evolution · doi:10.1093/molbev/msv046 · Cited by 137
“Moreover, examination of population structure using principal component analysis (Patterson et al. 2006)”
MethodCornejo, O. E., Yee, M., Domínguez, V., Andrews, M., Sockell, A., Strandberg, E. J., Livingstone, D. S., Stack, C., Romero, A., Umaharan, P., et al. (2018) · Communications Biology · doi:10.1038/s42003-018-0168-6 · Cited by 159
Fall webworm genomes yield insights into rapid adaptation of invasive species
Wu, N., Zhang, S., Li, X., Cao, Y., Liu, X., Wang, Q., Liu, Q., Liu, H., Hu, X., Zhou, X. J., et al. (2018) · Nature Ecology & Evolution · doi:10.1038/s41559-018-0746-5 · Cited by 152
The origins and adaptation of European potatoes reconstructed from historical genomes
Gutaker, R. M., Weiß, C. L., Ellis, D. D., Anglin, N. L., Knapp, S., Alonso, J. L. F., Prat, S., & Burbano, H. A. (2019) · Nature Ecology & Evolution · doi:10.1038/s41559-019-0921-3 · Cited by 155
Harney, É., May, H., Shalem, D., Rohland, N., Mallick, S., Lazaridis, I., Sarig, R., Stewardson, K., Nordenfelt, S., Patterson, N., et al. (2018) · Nature Communications · doi:10.1038/s41467-018-05649-9 · Cited by 136
Self-citationAncestry estimation and control of population stratification for sequence-based association studies
Study, T. F., Wang, C., Zhan, X., Bragg-Gresham, J., Kang, H. M., Stambolian, D., Chew, E. Y., Branham, K. E., Heckenlively, J., Fulton, R., et al. (2014) · Nature Genetics · doi:10.1038/ng.2924 · Cited by 139
“…reference samples were genotyped at higher density or whole-genome sequenced, we would expect our method to perform even better, as this would increase the number of overlapping sites between sequenced samples and the reference panels, making it easier to discern subtle population structure 34,35 .”
INTERSNP: genome-wide interaction analysis guided by a priori information
Herold, C., Steffens, M., Brockschmidt, F. F., Baur, M. P., & Becker, T. (2009) · Bioinformatics · doi:10.1093/bioinformatics/btp596 · Cited by 138
Species Delimitation: A Case Study in a Problematic Ant Taxon
Ross, K. G., Gotzek, D., Ascunce, M. S., & Shoemaker, D. (2009) · Systematic Biology · doi:10.1093/sysbio/syp089 · Cited by 156
“The technique reduces multidimensional allele frequency relationships represented in a matrix of pairwise distances to a few dimensions that explain most of the original distance data (Lessa 1990; Guiller et al. 1998; see also Patterson et al. 2006; Novembre and Stephens 2008).”
MethodChadeau‐Hyam, M., Campanella, G., Jombart, T., Bottolo, L., Portengen, L., Vineis, P., Liquet, B., & Vermeulen, R. C. H. (2013) · Environmental and Molecular Mutagenesis · doi:10.1002/em.21797 · Cited by 134
“Several alternative approaches have been recently proposed: they first estimate the ENT through spectral decomposition of the correlation matrix of predictors, and then define the per-test significance level as the Bonferroni or Sid ak-corrected threshold corresponding to that number of independent tests (a05 a/ENT or…”
MethodPopulation genomics of apricots unravels domestication history and adaptive events
Groppi, A., Liu, S., Cornille, A., Decroocq, S., Bui, Q. T., Tricon, D., Cruaud, C., Arribat, S., Belser, C., Marande, W., et al. (2021) · Nature Communications · doi:10.1038/s41467-021-24283-6 · Cited by 178
Recent ultra-rare inherited variants implicate new autism candidate risk genes
Wilfert, A. B., Turner, T. N., Murali, S. C., Hsieh, P., Sulovari, A., Wang, T., Coe, B. P., Guo, H., Hoekzema, K., Bakken, T. E., et al. (2021) · Nature Genetics · doi:10.1038/s41588-021-00899-8 · Cited by 136
Justice, C. M., Yagnik, G., Kim, Y., Peter, I., Jabs, E. W., Erazo, M., Ye, X., Ainehsazan, E., Shi, L., Cunningham, M. L., et al. (2012) · Nature Genetics · doi:10.1038/ng.2463 · Cited by 140
Genome-Wide Association Study of Tanning Phenotype in a Population of European Ancestry
Nan, H., Kraft, P., Qureshi, A. A., Guo, Q., Chen, C., Hankinson, S. E., Hu, F. B., Thomas, G., Hoover, R. N., Chanock, S., et al. (2009) · Journal of Investigative Dermatology · doi:10.1038/jid.2009.62 · Cited by 138
“05) Tracy-Wisdom tests (Patterson et al., 2006).”
Saccenti, E., & Timmerman, M. E. (2016) · Journal of Proteome Research · doi:10.1021/acs.jproteome.5b01029 · Cited by 126
Population genomics of finless porpoises reveal an incipient cetacean species adapted to freshwater
Zhou, X., Guang, X., Sun, D., Xu, S., Li, M., Seim, I., Jie, W., Yang, L., Zhu, Q., Xu, J., et al. (2018) · Nature Communications · doi:10.1038/s41467-018-03722-x · Cited by 150
A cell atlas of the chick retina based on single-cell transcriptomics
Yamagata, M., Yan, W., & Sanes, J. R. (2021) · eLife · doi:10.7554/elife.63907 · Cited by 141
“Significant PCs were estimated based on the Tracy-Widom theory (Patterson et al., 2006) and used for further analysis.”
MethodWegrzyn, J., Eckert, A. J., Choi, M., Lee, J. M., Stanton, B. J., Sykes, R. W., Davis, M. F., Tsai, C., & Neale, D. B. (2010) · New Phytologist · doi:10.1111/j.1469-8137.2010.03415.x · Cited by 154
“For association analyses, a Q matrix defined by significant principal components, as assessed using the Tracy–Widom distribution (Patterson et al. 2006), was utilized.”
MethodManousaki, D., Dudding, T., Haworth, S., Hsu, Y.-H., Liu, C.-T., Medina-Gómez, C., Voortman, T., van der Velde, N., Melhus, H., Robinson-Cohen, C., et al. (2017) · The American Journal of Human Genetics · doi:10.1016/j.ajhg.2017.06.014 · Cited by 135
Ning, C., Wang, C.-C., Gao, S., Yang, Y., Zhang, X., Wu, X., Zhang, F., Nie, Z., Tang, Y., Robbeets, M., et al. (2019) · Current Biology · doi:10.1016/j.cub.2019.06.044 · Cited by 140
“The Yamnaya_Samara or Afanasievo-related ancestry ranges from 20% to 80% in different Shirenzigou individuals, consistent with the scattered distribution on the East-West cline in the PCA (Figure 2).”
MethodInfluentialRare Genetic Variants of Large Effect Influence Risk of Type 1 Diabetes
Forgetta, V., Manousaki, D., Istomine, R., Ross, S., Tessier, M.-C., Marchand, L., Li, M., Qu, H.-Q., Bradfield, J. P., Grant, S. F. A., et al. (2020) · Diabetes · doi:10.2337/db19-0831 · Cited by 140
“Moreover, using seeds from the 1000 Genomes phase 3 data set, our principal component analysis demonstrated that the outliers removed by EIGENSTRAT lie outside the 1000 Genomes European superpopulation, whereas the inlierslargelyoverlaporareincloseproximitytotheEuropean superpopulation in the Affymetrix, Illumina, and…”
InfluentialWei, R., & Mahmood, A. (2020) · IEEE Access · doi:10.1109/access.2020.3048309 · Cited by 171
“Two widely used models for the analyses of genetic data, PCA and admixture analyses [129] can be cast as latent variable models with linear dependencies.”
MethodAssociation Mapping for Grain Quality in a Diverse Sorghum Collection
Sukumaran, S., Xiang, W., Bean, S. R., Pedersen, J. F., Kresovich, S., Tuinstra, M. R., Tesso, T., Hamblin, M. T., & Yu, J. (2012) · The Plant Genome · doi:10.3835/plantgenome2012.07.0016 · Cited by 138
“Principal component analysis was conducted to construct a plot of the most signii cant axes for grouping pattern variation and to obtain axes for further model testing and association mapping (Patterson et al., 2006; Price et al., 2006; Zhu and Yu, 2009).”
MethodLi, Q., & Yu, K. (2008) · Genetic Epidemiology · doi:10.1002/gepi.20296 · Cited by 137
“, 2001] and principal-component analysis [Zhu et al., 2002; Zhang et al., 2003; Price et al., 2006; Patterson et al., 2006] are three main types of approaches used for correcting for PS in association analyses.”
MethodInfluentialA large-scale candidate gene association study of age at menarche and age at natural menopause
He, C., Kraft, P., Chasman, D. I., Buring, J. E., Chen, C., Hankinson, S. E., Paré, G., Chanock, S., Ridker, P. M., & Hunter, D. J. (2010) · Human Genetics · doi:10.1007/s00439-010-0878-4 · Cited by 137
“To control for potential confounding by population stratification, we adjusted for the top principal components of genetic variation chosen for each study after excluding any admixed individuals clearly not of European ancestry (He et al. 2009; Patterson et al. 2006; Price et al. 2006; Pritchard and Rosenberg 1999).”
Neolithic and medieval virus genomes reveal complex evolution of hepatitis B
Krause‐Kyora, B., Susat, J., Key, F. M., Kühnert, D., Bosse, E., Immel, A., Rinne, C., Kornell, S.-C., Yepes, D., Franzenburg, S., et al. (2018) · eLife · doi:10.7554/elife.36666 · Cited by 153
Association mapping from sequencing reads using k-mers
Rahman, A. H., Hallgrímsdóttir, I. B., Eisen, M. B., & Pachter, L. S. (2018) · eLife · doi:10.7554/elife.32920 · Cited by 152
Genetic ancestry changes in Stone to Bronze Age transition in the East European plain
Saag, L., Vasilyev, S. V., Varul, L., Kosorukova, N. V., Gerasimov, D. V., Oshibkina, S. V., Griffith, S. J., Solnik, A., Saag, L., D’Atanasio, E., et al. (2021) · Science Advances · doi:10.1126/sciadv.abd6535 · Cited by 136
Meyers, K. J., Mares, J. A., Igo, R. P., Truitt, B., Liu, Z., Millen, A. E., Klein, M., Johnson, E. J., Engelman, C. D., Karki, C. K., et al. (2014) · Investigative Opthalmology & Visual Science · doi:10.1167/iovs.13-13216 · Cited by 132
Toward a fine-scale population health monitoring system
Belbin, G. M., Cullina, S., Wenric, S., Soper, E. R., Glicksberg, B. S., Torre, D., Moscati, A., Wojcik, G. L., Shemirani, R., Beckmann, N. D., et al. (2021) · Cell · doi:10.1016/j.cell.2021.03.034 · Cited by 159
Common variants in ACYP2 influence susceptibility to cisplatin-induced hearing loss
Xu, H., Robinson, G. W., Huang, J., Lim, J. Y.-S., Zhang, H., Bass, J. K., Broniscer, A., Chintagumpala, M., Bartels, U. K., Gururangan, S., et al. (2015) · Nature Genetics · doi:10.1038/ng.3217 · Cited by 135
Brazilian urban population genetic structure reveals a high degree of admixture
Giolo, S. R., Soler, J. M. P., Greenway, S. C., Almeida, M., de Andrade, M., Seidman, J. G., Seidman, C. E., Krieger, J. E., & Pereira, A. C. (2011) · European Journal of Human Genetics · doi:10.1038/ejhg.2011.144 · Cited by 146
Zhao, Y., Yang, J. H., Lv, F., Hu, X., Xie, X.-L., Zhang, M., Li, W., Liu, M.-J., Wang, Y., Li, J., et al. (2017) · Molecular Biology and Evolution · doi:10.1093/molbev/msx181 · Cited by 159
“PCA was conducted using the SmartPCA program in the EIGENSOFT v.6.0beta package (Patterson et al. 2006).”
MethodPan, Z., Li, S., Liu, Q., Wang, Z., Zhou, Z., Di, R., Miao, B., Hu, W., Wang, X., Hu, X., et al. (2018) · GigaScience · doi:10.1093/gigascience/giy019 · Cited by 139
Late Pleistocene human genome suggests a local origin for the first farmers of central Anatolia
Feldman, M., Fernández-Domínguez, E., Reynolds, L., Baird, D., Pearson, J., Hershkovitz, I., May, H., Goring-Morris, N., Benz, M., Gresky, J., et al. (2019) · Nature Communications · doi:10.1038/s41467-019-09209-7 · Cited by 134
Borda, V., Alvim, I., Mendes, M., Silva-Carvalho, C., Soares-Souza, G. B., Leal, T. P., Furlan, V., Scliar, M. O., Zamudio, R., Zolini, C., et al. (2020) · Proceedings of the National Academy of Sciences · doi:10.1073/pnas.2013773117 · Cited by 54
“To infer population structure, we used two approaches: 1) principal component analysis in Eigenstrat (74) and genetic clustering on ADMIXTURE software (32) using a linkage disequilibrium pruned dataset and 2) fineSTRUCTURE (33), MIXTURE MODEL (34, 75), and SOURCEFIND (76) for haplotype-based analyses, after phase infe…”
MethodYu, L., Cao, Y., Yang, J. Y. H., & Yang, P. (2022) · Genome biology · doi:10.1186/s13059-022-02622-0 · Cited by 151
“Similarly, SC3 [27] partitions the data by examining the eigenvalue based on the Tracy-Widom test [28, 29].”
MethodOdong, T. L., van Heerwaarden, J., Jansen, J., van Hintum, T. J. L., & van Eeuwijk, F. A. (2011) · Theoretical and Applied Genetics · doi:10.1007/s00122-011-1576-x · Cited by 147
“In recent years, many new methods have been developed especially for studying structure in natural populations using molecular markers, e.g. STRUCTURE (Pritchard et al. 2000a), PCA (Patterson et al. 2006) and PCO-MC (Reeves and Richards 2009).”
MethodGoedbloed, D. J., Megens, H., van Hooft, P., Herrero-Medrano, J. M., Lutz, W., Alexandri, P., Crooijmans, R. P. M. A., Groenen, M. A. M., van Wieren, S. E., Ydenberg, R. C., et al. (2012) · Molecular Ecology · doi:10.1111/j.1365-294x.2012.05670.x · Cited by 135
“To identify genetic clustering in the wild boar data set, we performed principal component analysis (PCA) using the eigenvector method as implemented in EIGENSOFT 3.0 (Patterson et al. 2006; Price et al. 2006).”
MethodInfluentialReconstructing genetic history of Siberian and Northeastern European populations
Wong, E. H. M., Khrunin, A., Nichols, L., Pushkarev, D., Khokhrin, D., Verbenko, D., Evgrafov, O., Knowles, J., Novembre, J., Limborska, S., et al. (2017) · Genome Research · doi:10.1101/gr.202945.115 · Cited by 131
Clarkson, C. S., Miles, A., Harding, N. J., Lucas, E. R., Battey, C. J., Amaya-Romero, J. E., Amaya-Romero, J. E., Diabate, A., Constant, E., Nwakanma, D. C., et al. (2020) · Genome Research · doi:10.1101/gr.262790.120 · Cited by 146
“2018) and PCA (Patterson et al. 2006) to genotypes at biallelic SNPs from euchromatic regions of Chromosome 3 (Fig.”
Emergence of human-adapted Salmonella enterica is linked to the Neolithization process
Key, F. M., Posth, C., Esquivel-Gomez, L. R., Hübler, R., Spyrou, M. A., Neumann, G. U., Furtwängler, A., Sabin, S., Burri, M., Wissgott, A., et al. (2020) · Nature Ecology & Evolution · doi:10.1038/s41559-020-1106-9 · Cited by 133
Fogh, I., Ratti, A., Gellera, C., Lin, K., Tiloca, C., Moskvina, V., Corrado, L., Soraru, G., Cereda, C., Corti, S., et al. (2014) · Human Molecular Genetics · doi:10.1093/hmg/ddt587 · Cited by 135
“Population structure of the individual cohorts was studied by means of principal components analysis (PCA) with EIGENSTRAT software (24,25), and outliers were identified by the projection of the first 10 principal components (Supplementary Material, Methods and Fig.”
MethodDevelopment of a Single Nucleotide Polymorphism Barcode to Genotype Plasmodium vivax Infections
Baniecki, M. L., Faust, A. L., Schaffner, S. F., Park, D. J., Galinsky, K., Daniels, R. F., Hamilton, E., Ferreira, M. U., Karunaweera, N. D., Serre, D., et al. (2015) · PLOS Neglected Tropical Diseases · doi:10.1371/journal.pntd.0003539 · Cited by 86
“We performed PCA with the program SmartPCA in the Eigensoft package [36] on the four populations (Brazil, Sri Lanka, Ethiopia, and French Guiana) together and in pairs.”
MethodGenome-wide association study identifies multiple susceptibility loci for glioma
Kinnersley, B., Labussière, M., Holroyd, A., Stefano, A. L. D., Broderick, P., Vijayakrishnan, J., Mokhtari, K., Delattre, J., Gousias, K., Schramm, J., et al. (2015) · Nature Communications · doi:10.1038/ncomms9559 · Cited by 138
Sunflower Hybrid Breeding: From Markers to Genomic Selection
Dimitrijević, A., & Horn, R. (2018) · Frontiers in Plant Science · doi:10.3389/fpls.2017.02238 · Cited by 149
“Analyses using the software STRUCTURE (Pritchard et al., 2000) and Principle Coordinates (PCO) analyses (Patterson et al., 2006) did not reveal deep genetic divisions within the germplasm (Mandel et al., 2011).”
MethodSurvival of Late Pleistocene Hunter-Gatherer Ancestry in the Iberian Peninsula
Villalba-Mouco, V., van de Loosdrecht, M. S., Posth, C., Mora, R., Martínez-Moreno, J., Rojo-Guerra, M., Salazar-García, D. C., Royo-Guillén, J. I., Kunst, M., Rougier, H., et al. (2019) · Current Biology · doi:10.1016/j.cub.2019.02.006 · Cited by 131
Metadata
- Authors
- Patterson, N., Price, A. L., & Reich, D.
- Affiliations
- Broad Institute (US)
- Corresponding author
- Patterson, Nick
- Venue
- PLoS Genetics
- Publisher
- Public Library of Science (PLoS)
- Published
- 2006
- Volume
- 2
- Issue
- 12
- Pages
- e190
- ISSN
- 1553-7390 (ISSN-L)
- 1553-7404
- PMC
- PMC1713260
- OpenAlex
- W2108169091
- Cited by
- 5,280
- References
- 49
- Citations by year
- 2026: 303 · 2025: 380 · 2024: 430 · 2023: 361 · 2022: 393 · 2021: 405 · 2020: 352 · 2019: 324 · 2018: 313 · 2017: 298 · 2016: 270 · 2015: 250 · 2014: 248 · 2013: 227 · 2012: 212
- FWCI
- 35.78
- Type
- journal article
- Language
- en
- Open access
- gold
- doi.org
- Locations
- PLoS Genetics (publishedVersion, cc-by)
- Europe PMC (PubMed Central) (publishedVersion, cc-by)
- PubMed Central (publishedVersion, cc-by)
- PubMed (publishedVersion)
- Digital Access to Scholarship at Harvard (DASH) (Harvard University) (submittedVersion, cc-by)
- RePEc: Research Papers in Economics (submittedVersion)
- DOAJ (DOAJ: Directory of Open Access Journals) (submittedVersion)
- Funders
- Wellcome Trust
- National Human Genome Research Institute (R01HG006399)
- Topics
- Life Sciences › Biochemistry, Genetics and Molecular Biology › Genetics › Genetic diversity and population structure
- Life Sciences › Biochemistry, Genetics and Molecular Biology › Genetics › Forensic and Genetic Research
- Life Sciences › Biochemistry, Genetics and Molecular Biology › Genetics › Genetic Associations and Epidemiology
- Keywords
- population structure, principal component analysis, significance tests, genetic differentiation, phase transitions, sample size determination, FST, genetic data, eigenvalue analysis
- MeSH terms
- Computer Simulation, Genetic Markers, Genetics, Medical, Genetics, Population, Humans, Models, Genetic, Genetic Variation, Models, Statistical, Principal Component Analysis
About these checks
Registry, retraction, Cites and statistics results are computed, not judged, with one exception: a printed reference that no index lists is read once by a model before it counts as a citation error. Claims are extracted by a model and kept only when their quote appears verbatim in the text; each cited source is then checked, with a model’s help, for whether it says what the claim relies on. Those verdicts can be wrong — read the claim’s quote and the cited source before relying on one.
Statistics and arithmetic are recomputed, not judged.
Confidence bands are shown only for fields calibrated on our annotated test set. None is calibrated yet, so no band is shown.
What counts as a claim ›How we measure confidence ›How we check this ›
Are you an author, or do you see a problem with this page? Request a review
Data sources
Bibliographic data: Semantic Scholar, OpenAlex, Crossref.
Contains information from the Semantic Scholar Academic Graph Datasets, made available under the ODC Attribution License (ODC-BY 1.0).
Semantic Scholar’s data is described in: Kinney, R., et al. (2023). The Semantic Scholar Open Data Platform. arXiv:2301.10140.
