

Population Structure and Eigenanalysis
Open accessThe DOI matches its Crossref record; 48 of the 49 references it cites were found in a registry or an index.
Abstract
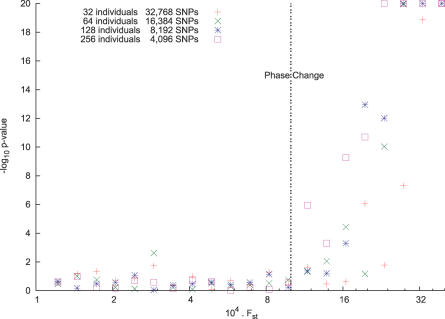
Current methods for inferring population structure from genetic data do not provide formal significance tests for population differentiation. We discuss an approach to studying population structure (principal components analysis) that was first applied to genetic data by Cavalli-Sforza and colleagues. We place the method on a solid statistical footing, using results from modern statistics to develop formal significance tests. We also uncover a general "phase change" phenomenon about the ability to detect structure in genetic data, which emerges from the statistical theory we use, and has an important implication for the ability to discover structure in genetic data: for a fixed but large dataset size, divergence between two populations (as measured, for example, by a statistic like FST) below a threshold is essentially undetectable, but a little above threshold, detection will be easy. This means that we can predict the dataset size needed to detect structure.
Overview
The claims and statistics of this paper haven’t been checked yet.
Free: it reads the open-access text and checks the first 5 claims that cite a source we can check. Create a free account to check every claim.
Integrity signals
Registry
Cites
Statistics
Figures
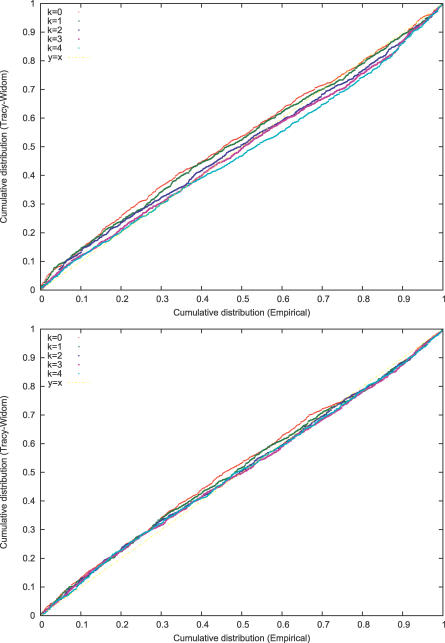
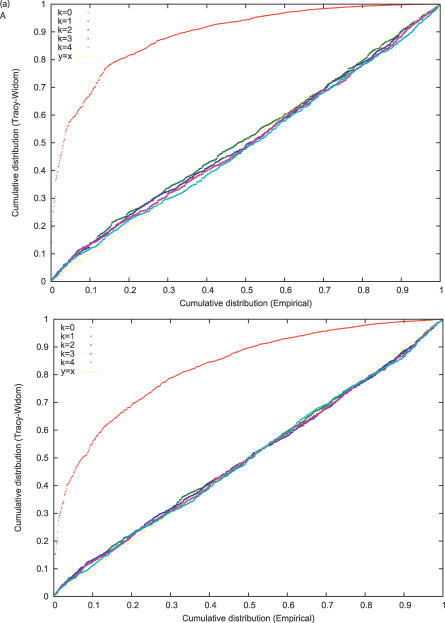
Verification
Claims the paper makes
The claims and statistics of this paper haven’t been checked yet.
Free: it reads the open-access text and checks the first 5 claims that cite a source we can check. Create a free account to check every claim.
Claims other papers make about this one
Each is checked against this paper’s own text: does it say what the citing paper says it does?
The source backs part of the claim, not all of it — or backs it for a different population, condition or comparison.
In the citing paper
“It is notable that PCA clustering is sensitive to the sample size of different ancestries and also to their amount of genetic drift, which exaggerates principal component distances 207,208,211,212 .”
From Ancient DNA analysis (2021) · cites this paper as [207]
Experimental — accuracy not yet measured
Self-check
Percentages, sums and reported differences re-computed from the paper’s own numbers.
The self-check needs the paper’s full text.
Citations
Cites
Inference of Population Structure Using Multilocus Genotype Data
Pritchard, J. K., Stephens, M., & Donnelly, P. (2000) · Genetics · doi:10.1093/genetics/155.2.945 · Cited by 33,908
Principal components analysis corrects for stratification in genome-wide association studies
Price, A. L., Patterson, N. J., Plenge, R. M., Weinblatt, M. E., Shadick, N. A., & Reich, D. (2006) · Nature Genetics · doi:10.1038/ng1847 · Cited by 10,248 · cited 2×
“A parallel paper [14] explores applications to medical genetics.”
BackgroundSelf-citationFalush, D., Stephens, M., & Pritchard, J. K. (2003) · Genetics · doi:10.1093/genetics/164.4.1567 · Cited by 7,959
The International HapMap Project
†The International HapMap Consortium, Genotyping centres: Baylor College of Medicine and ParAllele BioScience, Gibbs, R. A., Belmont, J. W., Hardenbol, P., Willis, T. D., Yu, F., Chinese HapMap Consortium, Yang, H., Ch'ang, L.-Y., et al. (2003) · Nature · doi:10.1038/nature02168 · Cited by 6,057
A haplotype map of the human genome
The International HapMap Consortium (2005) · Nature · doi:10.1038/nature04226 · Cited by 5,858 · cited 1×
“For instance, in the International Haplotype Map project [ 26 ], markers were chosen about 5,000 bases apart (phase 1), or about 1,000 bases apart (phase 2), and so nearby markers will often be in LD. Mathematically this will induce correlation between nearby columns of our matrix M. The effect of this will be that th…”
BackgroundSpielman, R. S., McGinnis, R. E., & Ewens, W. J. (1993) · PubMed · Cited by 3,651
Searle, S. R., & Searle, S. R. (1971) · Cited by 3,229
The History and Geography of Human Genes: Abridged paperback Edition
Cavalli-Sforza, L. L., Menozzi, P., & Piazza, A. (2018) · Princeton University Press eBooks · doi:10.2307/j.ctv301gjp · Cited by 3,175
Genomic Control for Association Studies
Devlin, B., & Roeder, K. (1999) · Biometrics · doi:10.1111/j.0006-341x.1999.00997.x · Cited by 3,162 · cited 3×
“If e([1]) is the principal eigenvector of the matrix X, this means that the sum of squares”
BackgroundOn the distribution of the largest eigenvalue in principal components analysis
Johnstone, I. M. (2001) · The Annals of Statistics · doi:10.1214/aos/1009210544 · Cited by 1,949 · cited 13×
“> λm, then Johnstone [1] shows that with suitable normalization and for large m and n, the largest eigenvalue λ1 is well approximated by the Tracy-Widom distribution.”
BackgroundMethodInfluential
Research works printed but not linked: 39
- Devlin, 1999, Biometrics, 55, 997
- Menozzi, 1978, Science, 201, 786
- Cavalli-Sforza, 2003, Nat Genet, 33, 266
- Shriver, 2005, Human Genomics, 2, 81
- Capelli, 2006, Ann Hum Genet, 70, 207
- Lovell, 2005, Ann Hum Genet, 69, 275
- Stoneking, 1997, Genome Res, 7, 1061
- Pritchard, 2000, Genetics, 155, 945
- Falush, 2003, Genetics, 164, 1567
- Hoggart, 2004, Am J Hum Genet, 74, 965
- Patterson, 2004, Am J Hum Genet, 74, 979
- Montana, 2004, Am J Hum Genet, 75, 771
- Price, 2006, Nat Genet, 38, 904
- Baik, 2005, Ann Probability, 33, 1643
- Baik, 2006, J Multivariate Anal, 97, 1643
- Nicholson, 2002, JRSS(B), 64, 695
- Bowcock, 1994, Nature, 368, 455
- Johnstone, 2001, Ann Stat, 29, 295
- Tracy, 1994, Commun Math Phys, 159, 151
- El Karoui, 2003, On the largest eigenvalue of Wishart matrices with identity covariance when p/n → ∞
- Soshnikov, 2002, J Stat Physics, 108, 1033
- Altshuler, 2005, Nature, 437, 1299
- Macarthur, 1957, Proc Natl Acad Sci U S A, 43, 293
- Pielou, 1975, Ecological diversity
- Ramachandran, 2005, Proc Natl Acad Sci, 102, 15942
- Gibbs, 2004, Nature, 426, 789
- Smith, 2004, Am J Hum Genet, 74, 1001
- Daly, 2001, Nat Genet, 29, 229
- Patil, 2001, Science, 294, 1719
- Allen, 2003, Am J Hum Genet, 72, 671
- Clayton, 2005, Nat Genet, 37, 1243
- Serre, 2004, Genome Res, 14, 1679
- Spielman, 1993, Am J Hum Genet, 52, 506
- Freedman, 2004, Nat Genet, 36, 388
- Marchini, 2004, Nat Genet, 36, 512
- Helgason, 2005, Nat Genet, 37, 90
- Balding, 1995, Genetica, 96, 3
- Rosenberg, 2006, Ann Hum Gen, 70, 841
- Schaffner, 2005, Genome Res, 15, 1576
Cited by
Items 601–700 of 1,074
von Seth, J., Dussex, N., Díez-del-Molino, D., van der Valk, T., Kutschera, V. E., Kierczak, M., Steiner, C. C., Liu, S., Gilbert, M. T. P., Sinding, M.-H. S., et al. (2021) · Nature Communications · doi:10.1038/s41467-021-22386-8 · Cited by 132
Stress habituation, body shape and cardiovascular mortality
Peters, A., & McEwen, B. S. (2015) · Neuroscience & Biobehavioral Reviews · doi:10.1016/j.neubiorev.2015.07.001 · Cited by 129
Zhu, X., Li, S., Cooper, R., & Elston, R. C. (2008) · The American Journal of Human Genetics · doi:10.1016/j.ajhg.2007.10.009 · Cited by 152
“Thus, the method developed by Patterson et al.(46) might be useful to find out how many principal components are necessary.”
MethodFedorova, S. A., Reidla, M., Metspalu, E., Metspalu, M., Rootsi, S., Tambets, K., Trofimova, N., Zhadanov, S. I., Kashani, B. H., Olivieri, A., et al. (2013) · BMC Evolutionary Biology · doi:10.1186/1471-2148-13-127 · Cited by 130
“Because background linkage disequilibrium (LD) can affect both principal component and structure-like analysis [96], we thinned the dataset by removing one SNP of a pair in strong LD (genotypic correlation r(2)>0.”
BackgroundMethodXu, S., & Li, J. (2008) · The American Journal of Human Genetics · doi:10.1016/j.ajhg.2008.08.001 · Cited by 137
Hamaker, E. L., Mulder, J. D., & van IJzendoorn, M. H. (2020) · Developmental Cognitive Neuroscience · doi:10.1016/j.dcn.2020.100867 · Cited by 102
“studying neurons individually (Cunningham and Yu, 2014), and in the field of genetics it is used to study differences in genetic make-up of different populations (Patterson et al., 2006).”
Dennis, J. K., Sealock, J., Straub, P., Lee, Y. A., Hucks, D., Actkins, K. V., Faucon, A. B., Feng, Y. A., Ge, T., Goleva, S. B., et al. (2021) · Genome Medicine · doi:10.1186/s13073-020-00820-8 · Cited by 155
McKown, A. D., Guy, R. D., Quamme, L. K., Klápště, J., Mantia, J. L., Constabel, C. P., El-Kassaby, Y. A., Hamelin, R. C., Zifkin, M., & Azam, M. (2014) · Molecular Ecology · doi:10.1111/mec.12969 · Cited by 132
“Using the P model based on principal component analysis (Patterson et al. 2006), we determined that only the first principal component (PC1) was significant within our population using broken stick modelling.”
MethodLocal Adaptation and Vector-Mediated Population Structure in Plasmodium vivax Malaria
Joy, D. A., Gonzalez-Ceron, L., Carlton, J. M., Gueye, A., Fay, M., McCutchan, T. F., & Su, X.-Z. (2008) · Molecular Biology and Evolution · doi:10.1093/molbev/msn073 · Cited by 133
“The dispersion of samples along a line suggests mixed ancestry (Patterson et al. 2006), and this is confirmed by the central location of admixed f1/f2 individuals along the cline (fig.”
BackgroundEvidence of CNIH3 involvement in opioid dependence
Nelson, E. C., Agrawal, A., Heath, A. C., Bogdan, R., Sherva, R., Zhang, B., Al-Hasani, R., Bruchas, M. R., Chou, Y.-L., Demers, C. H., et al. (2016) · Molecular Psychiatry · doi:10.1038/mp.2015.102 · Cited by 131
Association mapping of stigma and spikelet characteristics in rice (Oryza sativa L.)
Yan, W. G., Li, Y., Agrama, H. A., Luo, D., Gao, F., Lu, X., & Ren, G. (2009) · Molecular Breeding · doi:10.1007/s11032-009-9290-y · Cited by 131
“The PC matrix approach proved to have similar power to capture population structure as STRUCTURE, and provides a formal way of assigning statistical significance to population subdivision (Patterson et al. 2006).”
MethodOptimal estimation and rank detection for sparse spiked covariance matrices
Cai, T., Ma, Z., & Wu, Y. (2014) · Probability Theory and Related Fields · doi:10.1007/s00440-014-0562-z · Cited by 130
“riance matrix model. This covariance structure and its variations have been widely used in signal processing, chemometrics, econometrics, population genetics, and many other fields. See, for instance, [16, 24, 32, 34]. In the high-dimensional setting, various aspects of this model have been studied by several recent pa…”
MethodMelanesian Blond Hair Is Caused by an Amino Acid Change in TYRP1
Kenny, E. E., Timpson, N. J., Sikora, M., Yee, M.-C., Moreno-Estrada, A., Eng, C., Huntsman, S., Burchard, E. G., Stoneking, M., Bustamante, C. D., et al. (2012) · Science · doi:10.1126/science.1217849 · Cited by 129
Asymptotic power of sphericity tests for high-dimensional data
Onatski, A., Moreira, M. J., & Hallin, M. (2013) · The Annals of Statistics · doi:10.1214/13-aos1100 · Cited by 131
“With the important exception of Srivastava (2005), (5.4)–(5.6) are the first results on the asymptotic power of those tests against contiguous alternatives. Srivastava (2005) analyzes the asymptotic power of tests similar to those in Examples 1 and 2.”
BackgroundInfluentialMulti-ancestry fine mapping implicates OAS1 splicing in risk of severe COVID-19
Huffman, J. E., Butler‐Laporte, G., Khan, A., Pairo‐Castineira, E., Drivas, T. G., Peloso, G. M., Nakanishi, T., Initiative, C.-1. H. G., Ganna, A., Verma, A., et al. (2022) · Nature Genetics · doi:10.1038/s41588-021-00996-8 · Cited by 145
Unravelling the Genetic History of Negritos and Indigenous Populations of Southeast Asia
Aghakhanian, F., Yunus, Y., Naidu, R., Jinam, T., Manica, A., Hoh, B. P., & Phipps, M. E. (2015) · Genome Biology and Evolution · doi:10.1093/gbe/evv065 · Cited by 127
“Key words: Negritos, Senoi, Proto-Malay, population genetics, SNPs.”
Patin, É., Siddle, K. J., Laval, G., Quach, H., Harmant, C., Becker, N. S., Froment, A., Regnault, B., Lemée, L., Gravel, S., et al. (2014) · Nature Communications · doi:10.1038/ncomms4163 · Cited by 144
Jinam, T. A., Saitou, N., Nishida, N., Tokunaga, K., Hirai, M., Kawamura, S., Oota, H., Umetsu, K., Kimura, R., Ohashi, J., et al. (2012) · Journal of Human Genetics · doi:10.1038/jhg.2012.114 · Cited by 131
Late Jomon male and female genome sequences from the Funadomari site in Hokkaido, Japan
Kanzawa‐Kiriyama, H., Jinam, T. A., Kawai, Y., Sato, T. K., Hosomichi, K., Tajima, A., Adachi, N., Matsumura, H., Kryukov, K. A., Saitou, N., et al. (2019) · Anthropological Science · doi:10.1537/ase.190415 · Cited by 142
“Finally, we performed PCA using the smartpca program in the EIGENSOFT package (Patterson et al., 2006).”
MethodGenomic regions under selection in the feralization of the dingoes
Zhang, S., Wang, G., Ma, P., Zhang, L., Yin, T., Yan-hu, L., Otecko, N. O., Wang, M., Ma, Y., Wang, L., et al. (2020) · Nature Communications · doi:10.1038/s41467-020-14515-6 · Cited by 136
Thompson, S. D., Sudman, M., Ramos, P. S., Marion, M. C., Ryan, M. H., Tsoras, M., Weiler, T., Wagner, M., Keddache, M. A., Haas, J., et al. (2010) · Arthritis & Rheumatism · doi:10.1002/art.27688 · Cited by 129
“A genome-wide association analysis was computed for each of these 10 PCs to assure that the PCs were not capturing a single or a few potentially important regions.”
MethodGenetic substructure and complex demographic history of South African Bantu speakers
Sengupta, D., Choudhury, A., Fortes-Lima, C., Aron, S., Whitelaw, G., Bostoen, K. A. G., Gunnink, H., Chousou‐Polydouri, N., Delius, P., Tollman, S. M., et al. (2021) · Nature Communications · doi:10.1038/s41467-021-22207-y · Cited by 137
Luca, D., Ringquist, S., Klei, L., Lee, A. B., Gieger, C., Wichmann, H.-E., Schreiber, S., Krawczak, M., Lu, Y., Styche, A., et al. (2008) · The American Journal of Human Genetics · doi:10.1016/j.ajhg.2007.11.003 · Cited by 128
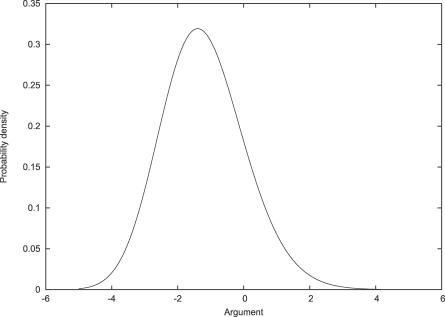
“Hypothesis Test for Population Structure A formal significance test for population structure is based on a theoretical result for the eigenvalue distribution of a null sample covariance matrix.(6,37) For a homogeneous population, the largest eigenvalue, properly normed, approximately follows the Tracy-Widom distributi…”
Martiniano, R., Garrison, E., Jones, E. R., Manica, A., & Durbin, R. (2020) · Genome Biology · doi:10.1186/s13059-020-02160-7 · Cited by 128
Limitations of GCTA as a solution to the missing heritability problem.
Krishna Kumar, S., Feldman, M. W., Rehkopf, D. H., & Tuljapurkar, S. (2016) · Proceedings of the National Academy of Sciences · doi:10.1073/pnas.1520109113 · Cited by 128
“Price and coworkers (23, 24) have shown that principal components are useful for identifying population stratification and when used with reliable methods like association studies, are effective in correcting for population stratification.”
MethodEngelhardt, B. E., & Stephens, M. (2010) · PLoS Genetics · doi:10.1371/journal.pgen.1001117 · Cited by 128
“For PCA we follow the common practice (e.g., as in SmartPCA [13]) of first mean-centering the columns of G and standardizing them to have unit variance before applying PCA.”
BackgroundMethodInfluentialAn Immune Response Network Associated with Blood Lipid Levels
Inouye, M., Silander, K., Hamalainen, E., Salomaa, V., Harald, K., Jousilahti, P., Männistö, S., Eriksson, J. G., Saarela, J., Ripatti, S., et al. (2010) · PLoS Genetics · doi:10.1371/journal.pgen.1001113 · Cited by 125
“All SNPs underwent PCA with the EIGENSOFT software [55]; regression residuals involving the 2 previous SNPs were used as inputs to correct for SNP linkage Table 7.”
MethodZuo, C., & Chen, L. (2021) · Briefings in Bioinformatics · doi:10.1093/bib/bbaa287 · Cited by 134
“…the suitable cluster number K , by the following steps: (i) calculating the eigenvalues of Z T Z , where Z is the z-score matrix of the raw count matrix; (ii) determining k based on the number of eigenvalues that are significantly different from the Tracy-Widom distribution with mean and s.d. [44].”
MethodGill, M., Anderson, R., Hu, H., Bennamoun, M., Petereit, J., Valliyodan, B., Nguyen, H. T., Batley, J., Bayer, P. E., & Edwards, D. (2022) · BMC Plant Biology · doi:10.1186/s12870-022-03559-z · Cited by 133
“FarmCPU allows for the population structure to be controlled by using the first three principal components (PCs) from an automatic principal component analysis (PCA) based on the marker data [29], whilst the significance threshold was defined as 0.05/marker size.”
MethodInfluentialPopulation Genetic Structure of the People of Qatar
Hunter-Zinck, H., Musharoff, S. A., Salit, J., Alali, K., Chouchane, L., Gohar, A., Matthews, R., Butler, M. W., Fuller, J. A., Hackett, N. R., et al. (2010) · The American Journal of Human Genetics · doi:10.1016/j.ajhg.2010.05.018 · Cited by 139
“Principal components analysis (PCA) was performed with the program EIGENSTRAT.(12,13) We ran PCA on the Qatari sample combined with all HGDP samples and plotted all of the samples onto the resulting principal components.”
MethodHybrid selection for sequencing pathogen genomes from clinical samples
Melnikov, A., Galinsky, K. J., Rogov, P., Fennell, T., Tyne, D. V., Russ, C., Daniels, R. F., Barnes, K. G., Bochicchio, J., Ndiaye, D., et al. (2011) · Genome biology · doi:10.1186/gb-2011-12-8-r73 · Cited by 133
“Principal components analysis was performed using Eigensoft software [20] on 8,300 non-singleton SNPs with coverage of at least 10-fold in all strains and consensus quality scores of at least 30.”
MethodWang, C., Zöllner, S., & Rosenberg, N. A. (2012) · PLoS Genetics · doi:10.1371/journal.pgen.1002886 · Cited by 126
“In PCA, samples are projected onto a series of orthogonal axes (principal components or PCs) that are constructed from a linear combination of genotypic values across genetic markers, such that each PC sequentially maximizes the variance among samples projected on it [11,12].”
BackgroundMethodResultInfluentialGenome Scans for Detecting Footprints of Local Adaptation Using a Bayesian Factor Model
Duforet-Frebourg, N., Bazin, É., & Blum, M. G. B. (2014) · Molecular Biology and Evolution · doi:10.1093/molbev/msu182 · Cited by 142
“First, we present results using the factor model with K = 3 factors that is optimal because there are 4 populations in the divergence model (Patterson et al. 2006).”
MethodInfluentialGenomic signals of migration and continuity in Britain before the Anglo-Saxons
Martiniano, R., Caffell, A., Holst, M., Hunter-Mann, K., Montgomery, J., Müldner, G., McLaughlin, R. L., Teasdale, M. D., van Rheenen, W., Veldink, J. H., et al. (2016) · Nature Communications · doi:10.1038/ncomms10326 · Cited by 130
The origin and legacy of the Etruscans through a 2000-year archeogenomic time transect
Posth, C., Zaro, V., Spyrou, M. A., Vai, S., Gnecchi‐Ruscone, G. A., Modi, A., Peltzer, A., Mötsch, A., Nägele, K., Vågene, Å. J., et al. (2021) · Science Advances · doi:10.1126/sciadv.abi7673 · Cited by 134
Genetic structure of a unique admixed population: implications for medical research
Patterson, N., Petersen, D. C., van der Ross, R. E., Sudoyo, H., Glashoff, R. H., Marzuki, S., Reich, D., & Hayes, V. M. (2010) · Human Molecular Genetics · doi:10.1093/hmg/ddp505 · Cited by 125
“The first uses a selected set of populations to compute principal components axes (32).”
MethodSelf-citationDeshmukh, H. A., Colhoun, H. M., Johnson, T., McKeigue, P. M., Betteridge, D. J., Durrington, P. N., Fuller, J. H., Livingstone, S., Charlton-Menys, V., Neil, A., et al. (2012) · Journal of Lipid Research · doi:10.1194/jlr.p021113 · Cited by 125
“After applying all the above exclusions, ancestry outliers were excluded (n=143) by using Ancestry Principal Component analysis[30] on a subset of 100905 SNPs selected by LD”
MethodMissense variant in TREML2 protects against Alzheimer's disease
Benitez, B. A., Jin, S. C., Guerreiro, R., Graham, R., Lord, J., Harold, D., Sims, R., Lambert, J.-C., Gibbs, J. R., Bras, J., et al. (2014) · Neurobiology of Aging · doi:10.1016/j.neurobiolaging.2013.12.010 · Cited by 123
“The imputed data was then analyzed using logistic regression including covariates for country of origin, gender, age, and 3 principal components were obtained with EIGENSTRAT (EIGENSOFT 4.2) (Patterson et al., 2006) software based on individual genotypes for the GERAD study participants.”
MethodInfluentialA Spatial Framework for Understanding Population Structure and Admixture
Bradburd, G. S., Ralph, P. L., & Coop, G. (2016) · PLoS Genetics · doi:10.1371/journal.pgen.1005703 · Cited by 141
“SpaceMix combines the advantages of other methods for inferring and illustrating patterns of population structure, using model-based inference to infer population relationships (like TreeMix [17], and MixMapper [18]), and producing powerful visualizations of genetic structure on a map (like PCA [11] and SPA [73]).”
MethodInfluentialEarly cave art and ancient DNA record the origin of European bison
Soubrier, J., Gower, G., Chen, K., Richards, S. M., Llamas, B., Mitchell, K. J., Ho, S. Y. W., Kosintsev, P. A., Lee, M. S. Y., Baryshnikov, G., et al. (2016) · Nature Communications · doi:10.1038/ncomms13158 · Cited by 140
Hybridization and gene flow in the mega-pest lineage of moth, Helicoverpa
Anderson, C. J., Oakeshott, J. G., Tay, W. T., Gordon, K. H. J., Zwick, A., & Walsh, T. (2018) · Proceedings of the National Academy of Sciences · doi:10.1073/pnas.1718831115 · Cited by 140
Statistical methods for genome-wide association studies
Wang, M. H., Cordell, H. J., & Steen, K. V. (2018) · Seminars in Cancer Biology · doi:10.1016/j.semcancer.2018.04.008 · Cited by 139
SAFE-clustering: Single-cell Aggregated (from Ensemble) clustering for single-cell RNA-seq data
Yang, Y., Huh, R., Culpepper, H. W., Lin, Y., Love, M. I., & Li, Y. (2019) · Bioinformatics · doi:10.1093/bioinformatics/bty793 · Cited by 129
South-to-north migration preceded the advent of intensive farming in the Maya region
Kennett, D. J., Lipson, M., Prufer, K. M., Mora-Marín, D., George, R. J., Rohland, N., Robinson, M., Trask, W. R., Edgar, H. H. J., Hill, E. C., et al. (2022) · Nature Communications · doi:10.1038/s41467-022-29158-y · Cited by 56
Self-citationQuantifying Missing Heritability at Known GWAS Loci
Gusev, A., Bhatia, G., Zaitlen, N., Vilhjalmsson, B. J., Diogo, D., Stahl, E. A., Gregersen, P. K., Worthington, J., Klareskog, L., Raychaudhuri, S., et al. (2013) · PLoS Genetics · doi:10.1371/journal.pgen.1003993 · Cited by 125
“Following the strategy proposed in [60], a new genotype matrix W r is generated where each marker is regressed onto the l markers preceding it and transformed into the residual:”
MethodSelf-citationWen, C. C., Yee, S. W., Liang, X., Hoffmann, T., Kvale, M. N., Banda, Y., Jorgenson, E., Schaefer, C. A., RISCH, N. J., & Giacomini, K. M. (2015) · Clinical Pharmacology & Therapeutics · doi:10.1002/cpt.89 · Cited by 131
“2[25] was used to compute principal components (PC) separately for individuals on the four different arrays using 144,799 high-quality SNPs common to all arrays.”
MethodThe genetic regulatory signature of type 2 diabetes in human skeletal muscle
Scott, L. J., Erdos, M. R., Huyghe, J. R., Welch, R. P., Beck, A. T., Wolford, B. N., Chines, P. S., Didion, J. P., Narisu, N., Stringham, H. M., et al. (2016) · Nature Communications · doi:10.1038/ncomms11764 · Cited by 130
Ancient genomes suggest the eastern Pontic-Caspian steppe as the source of western Iron Age nomads
Krzewińska, M., Kılınç, G. M., Juras, A., Koptekin, D., Chyleński, M., Nikitin, A. G., Shcherbakov, N., Shuteleva, I., Leonova, T., Kraeva, L., et al. (2018) · Science Advances · doi:10.1126/sciadv.aat4457 · Cited by 122
Liu, C., Witonsky, D., Gosling, A. L., Lee, J. H., Ringbauer, H., Hagan, R. W., Patel, N. B., Stahl, R., Novembre, J., Aldenderfer, M. S., et al. (2022) · Nature Communications · doi:10.1038/s41467-022-28827-2 · Cited by 136
“These data were then combined with 7 previously published deeply sequenced aMMD genomes (individuals C1, M63, M344, S10, S35, S40, and S41; excluding M240 for its outlier position in PCA) for subsequent analysis, resulting in a total of 20 individuals with whole genomes sequenced to a depth of 0.1-6.6x.”
InfluentialAncient genomes reveal origin and rapid trans-Eurasian migration of 7th century Avar elites
Gnecchi‐Ruscone, G. A., Szécsényi‐Nagy, A., Koncz, I., Csiky, G., Rácz, Z., Rohrlach, A. B., Brandt, G., Rohland, N., Csáky, V., Cheronet, O., et al. (2022) · Cell · doi:10.1016/j.cell.2022.03.007 · Cited by 139
“0.1 package (Patterson et al., 2006) on the 1240KHO dataset using the lsqproject and the autoshrink options to project the genotypes of the ancient individuals (containing variable amounts of missing data) on top of the principal components calculated on the set of modern populations.”
InfluentialSelf-citationPaths and timings of the peopling of Polynesia inferred from genomic networks
Ioannidis, A. G., Blanco-Portillo, J., Sandoval, K., Hagelberg, E., Barberena-Jonas, C., Hill, A. V. S., Rodríguez-Rodríguez, J. E., Fox, K., Robson, K., Haoa-Cardinali, S., et al. (2021) · Nature · doi:10.1038/s41586-021-03902-8 · Cited by 124
The female protective effect against autism spectrum disorder
Wigdor, E. M., Weiner, D. J., Grove, J., Fu, J. M., Thompson, W. K., Carey, C. E., Baya, N., van der Merwe, C., Walters, R. K., Satterstrom, F. K., et al. (2021) · doi:10.1101/2021.03.29.21253866 · Cited by 124
Comparing Spatial Maps of Human Population-Genetic Variation Using Procrustes Analysis
Wang, C., Szpiech, Z. A., Degnan, J. H., Jakobsson, M., Pemberton, T. J., Hardy, J. A., Singleton, A. B., & Rosenberg, N. A. (2010) · Statistical Applications in Genetics and Molecular Biology · doi:10.2202/1544-6115.1493 · Cited by 124
“Introduction Multivariate analysis techniques such as principal components analysis (PCA) and multidimensional scaling (MDS) are often used with population-genetic data to produce “statistical maps” of sampled individuals or populations (Menozzi et al., 1978; Zhivotovsky et al., 2003; Patterson et al., 2006; Novembre…”
The female protective effect against autism spectrum disorder
Wigdor, E. M., Weiner, D. J., Grove, J., Fu, J. M., Thompson, W. K., Carey, C. E., Baya, N., van der Merwe, C., Walters, R. K., Satterstrom, F. K., et al. (2022) · Cell Genomics · doi:10.1016/j.xgen.2022.100134 · Cited by 124
Pasaniuc, B., Zaitlen, N., Lettre, G., Chen, G. K., Tandon, A., Kao, W. H. L., Ruczinski, I., Fornage, M., Siscovick, D. S., Zhu, X., et al. (2011) · PLoS Genetics · doi:10.1371/journal.pgen.1001371 · Cited by 127
“99% correlated to the top eigenvector of a principal components analysis run using CEU and YRI from HapMap3 to compute principal components [18,20].”
MethodSelf-citationKotsakiozi, P., Richardson, J. B., Pichler, V., Favia, G., Martins, A. J., Urbanelli, S., Armbruster, P., & Caccone, A. (2017) · Ecology and Evolution · doi:10.1002/ece3.3514 · Cited by 156
Genomic insights into the early peopling of the Caribbean
Nägele, K., Posth, C., Iraeta Orbegozo, M., Chinique de Armas, Y., Hernández Godoy, S. T., González Herrera, U. M., Nieves-Colón, M. A., Sandoval-Velasco, M., Mylopotamitaki, D., Radzeviciute, R., et al. (2020) · Science · doi:10.1126/science.aba8697 · Cited by 75
Signatures of founder effects, admixture, and selection in the Ashkenazi Jewish population
Bray, S. M., Mulle, J. G., Dodd, A. F., Pulver, A. E., Wooding, S., & Warren, S. T. (2010) · Proceedings of the National Academy of Sciences · doi:10.1073/pnas.1004381107 · Cited by 118
Wang, H., Xu, X., Vieira, F. G., Xiao, Y., Li, Z., Wang, J., Nielsen, R., & Chu, C. (2016) · Molecular Plant · doi:10.1016/j.molp.2016.04.018 · Cited by 133
“We excluded sites with MAF less than 5% by using ‘‘-minmaf 0.05,’’ and we also disabled normalization as suggested in Patterson et al. (2006) by applying ‘‘-norm 0.’’”
InfluentialNait Saada, J., Kalantzis, G., Shyr, D., Cooper, F., Robinson, M., Gusev, A., & Palamara, P. F. (2020) · Nature Communications · doi:10.1038/s41467-020-19588-x · Cited by 125
Building pan-genome infrastructures for crop plants and their use in association genetics
Jayakodi, M., Schreiber, M., Stein, N., & Mascher, M. (2021) · DNA Research · doi:10.1093/dnares/dsaa030 · Cited by 133
Ancient genomic time transect from the Central Asian Steppe unravels the history of the Scythians
Gnecchi-Ruscone, G. A., Khussainova, E., Kahbatkyzy, N., Musralina, L., Spyrou, M. A., Bianco, R. A., Radzeviciute, R., Martins, N. F. G., Freund, C., Iksan, O., et al. (2021) · Science Advances · doi:10.1126/sciadv.abe4414 · Cited by 112
Fluctuations of the Extreme Eigenvalues of Finite Rank Deformations of Random Matrices
Benaych-Georges, F., Guionnet, A., & Maïda, M. (2011) · Electronic Journal of Probability · doi:10.1214/ejp.v16-929 · Cited by 123
“This phenomenon was made precise in [9], where a sharp phase transition, known as the BBP transition [34, 27, 38, 29], was exhibited for finite rank perturbations of a complex Gaussian Wishart matrix.”
BackgroundEuropean Cattle Genetic Diversity Consortium, Upadhyay, M. R., Crooijmans, R., Chen, W., Lenstra, J. A., Goderie, C. R. J., MacHugh, D. E., Park, S. D. E., Magee, D. A., Matassino, D., et al. (2017) · Heredity · doi:10.1038/hdy.2016.79 · Cited by 119
Malomane, D. K., Reimer, C., Weigend, S., Weigend, A., Sharifi, A. R., & Simianer, H. (2018) · BMC Genomics · doi:10.1186/s12864-017-4416-9 · Cited by 116
Polygenic Scores for Height in Admixed Populations
Bitarello, B. D., & Mathieson, I. (2020) · G3 Genes|Genomes|Genetics · doi:10.1534/g3.120.401658 · Cited by 125
Qian, J., Tanigawa, Y., Du, W., Aguirre, M., Chang, C. C., Tibshirani, R. J., Rivas, M. A., & Hastie, T. J. (2020) · PLoS Genetics · doi:10.1371/journal.pgen.1009141 · Cited by 144
“Among the others, one major source is the so-called population stratification (Patterson et al., 2006).”
Haber, M., Doumet-Serhal, C., Scheib, C., Xue, Y., Danecek, P., Mezzavilla, M., Youhanna, S., Martiniano, R., Prado-Martinez, J., Szpak, M., et al. (2017) · The American Journal of Human Genetics · doi:10.1016/j.ajhg.2017.06.013 · Cited by 117
Correlation and Causation in the Study of Personality
Lee, J. J. (2012) · European Journal of Personality · doi:10.1002/per.1863 · Cited by 117
“partialing out all loci in the genome, then, we are in effect partialing out the ancestral events confounding the gene and the trait (Kang et al., 2010; Patterson et al., 2006).”
BackgroundGakuhari, T., Nakagome, S., Rasmussen, S., Allentoft, M. E., Sato, T., Korneliussen, T., Chuinneagáin, B. N., Matsumae, H., Koganebuchi, K., Schmidt, R., et al. (2020) · Communications Biology · doi:10.1038/s42003-020-01162-2 · Cited by 117
“As a fi rst assessment of the genetic af fi nities of the study individuals we carried out PCA, as previously described 29,33,86 .”
MethodInfluentialAncient DNA sheds light on the genetic origins of early Iron Age Philistines
Feldman, M., Master, D. M., Bianco, R. A., Burri, M., Stockhammer, P. W., Mittnik, A., Aja, A. J., Jeong, C., & Krause, J. (2019) · Science Advances · doi:10.1126/sciadv.aax0061 · Cited by 120
Non-crossover gene conversions show strong GC bias and unexpected clustering in humans
Williams, A. L., Genovese, G., Dyer, T. D., Altemose, N., Truax, K., Jun, G., Patterson, N. J., Myers, S., Curran, J. E., Duggirala, R., et al. (2015) · eLife · doi:10.7554/elife.04637 · Cited by 138
“Next we examined the principal components analysis (PCA) plots [48] generated using (a) the genotype”
MethodSelf-citationMbarek, H., Steinberg, S., Nyholt, D. R., Gordon, S. D., Miller, M., McRae, A. F., Hottenga, J., Day, F. R., Willemsen, G. A. H. M., de Geus, E. J. C., et al. (2016) · The American Journal of Human Genetics · doi:10.1016/j.ajhg.2016.03.008 · Cited by 126
“Principal components (PCs) of genetic ancestry were inferred via EIGENSOFT.(34) The first”
MethodHe, J., Meng, S., Zhao, T., Xing, G., Yang, S., Li, Y., Guan, R., Lu, J., Wang, Y., Xia, Q., et al. (2017) · Theoretical and Applied Genetics · doi:10.1007/s00122-017-2962-9 · Cited by 138
“Since the marker-based genetic relationship matrix used for correction of the population structure bias in the previous methods (Patterson et al. 2006; Price et al. 2006; VanRaden 2008) is suitable for the bi-allelic SNPs but not for the proposed multi-allelic SNPLDBs, here, we suggest a more flexible genetic similari…”
MethodGenetic Architecture and Selection of Chinese Cattle Revealed by Whole Genome Resequencing
Mei, C., Wang, H., Liao, Q., Wang, L., Cheng, G., Wang, H., Zhao, C., Zhao, S., Song, J., Guang, X., et al. (2018) · Molecular Biology and Evolution · doi:10.1093/molbev/msx322 · Cited by 120
“Principle component analysis was carried out using the smartPCA program of the EIGENSOFT (Patterson et al. 2006) package.”
MethodChang, D., Gao, F., Slavney, A., Ma, L., Waldman, Y. Y., Sams, A. J., Billing-Ross, P., Madar, A., Spritz, R., & Keinan, A. (2014) · PLoS ONE · doi:10.1371/journal.pone.0113684 · Cited by 123
“This was performed by principal component analysis (PCA) using EIGENSOFT [48], after pruning for linkage disequilibrium (LD) and removing large LD blocks [50].”
BackgroundMethodInfluentialMalmström, H., Günther, T., Svensson, E. M., Juras, A., Fraser, M., Munters, A. R., Pospieszny, Ł., Tõrv, M., Lindström, J., Götherström, A., et al. (2019) · Proceedings of the Royal Society B: Biological Sciences · doi:10.1098/rspb.2019.1528 · Cited by 108
“(b) Exploratory analyses To investigate the genomic ancestry of the 11 individuals from this study in context with other ancient individuals, we projected them onto the PC1–PC2 space of 60 modernday Western Eurasian populations (figure 1a) [40] together with 272 relevant prehistoric individuals who have been previousl…”
Phylogenomics of the genusPopulusreveals extensive interspecific gene flow and balancing selection
Wang, M., Zhang, L., Zhang, Z., Li, M., Wang, D., Zhang, X., Xi, Z., Keefover‐Ring, K., Smart, L. B., DiFazio, S. P., et al. (2019) · New Phytologist · doi:10.1111/nph.16215 · Cited by 149
“A principal component analysis was performed on these SNVs using the SMARTPCA program in EIGENSOFT (Patterson et al., 2006).”
MethodSpatiotemporal landscape genetics: Investigating ecology and evolution through space and time
Fenderson, L. E., Kovach, A. I., & Llamas, B. (2020) · Molecular Ecology · doi:10.1111/mec.15315 · Cited by 113
Young inversion with multiple linked QTLs under selection in a hybrid zone
Lee, C.-R., Wang, B., Mojica, J. P., Mandáková, T., Prasad, K. V. S. K., Goicoechea, J. L., Perera, N., Hellsten, U., Hundley, H. N., Johnson, J., et al. (2017) · Nature Ecology & Evolution · doi:10.1038/s41559-017-0119 · Cited by 119
Ancient Biomolecules and Evolutionary Inference
Cappellini, E., Prohaska, A., Racimo, F., Welker, F., Pedersen, M. W., Allentoft, M. E., de Barros Damgaard, P., Gutenbrunner, P., Dunne, J., Hammann, S., et al. (2018) · Annual Review of Biochemistry · doi:10.1146/annurev-biochem-062917-012002 · Cited by 118
“These analyses often include exploratory approaches, such as principal-component analysis (94) and latent class modeling (95), as well as more parameter-rich demographic estimation methods (e.g., 96, 97) ( Figure 2 a ).”
MethodBourret, V., Dionne, M., Kent, M., Lien, S., & Bernatchez, L. (2013) · Evolution · doi:10.1111/evo.12139 · Cited by 132
“To confirm the regional classification proposed by Dionne et al. (2008), a principal component analysis on individual genotypes was carried out using the SmartPCA program implemented in the EIGENSOFT package (Patterson et al. 2006) and fitted using R (R core development team).”
MethodCormier, F., Gouis, J. L., Dubreuil, P., Lafarge, S., & Praud, S. (2014) · Theoretical and Applied Genetics · doi:10.1007/s00122-014-2407-7 · Cited by 118
Rutkowski, R., Krofel, M., Giannatos, G., Ćirović, D., Männil, P., Volokh, A. M., Lanszki, J., Heltai, M., Szabó, L., Banea, O. C., et al. (2015) · PLoS ONE · doi:10.1371/journal.pone.0141236 · Cited by 120
“This multivariate descriptive method is not dependent on any model assumption and can thus provide a useful validation of the Bayesian clustering output [82–84].”
MethodFast and flexible estimation of effective migration surfaces
Marcus, J. H., Ha, W., Barber, R. F., & Novembre, J. (2021) · eLife · doi:10.7554/elife.61927 · Cited by 120
Extensive pedigrees reveal the social organization of a Neolithic community
Rivollat, M., Rohrlach, A. B., Ringbauer, H., Childebayeva, A., Mendisco, F., Barquera, R., Szolek, A., Le Roy, M., Colleran, H., Tuke, J., et al. (2023) · Nature · doi:10.1038/s41586-023-06350-8 · Cited by 116
“On this dataset, we performed principal component analysis using smartpca (v.10210; EIGENSOFT) 67 (Supplementary Note 10 and Extended Data Fig.”
The genetic origin of the Indo-Europeans
Lazaridis, I., Patterson, N. J., Anthony, D. W., Vyazov, L. A., Fournier, R., Ringbauer, H., Olalde, Í., Khokhlov, A. A., Kitov, E. P., Shishlina, N., et al. (2025) · Nature · doi:10.1038/s41586-024-08531-5 · Cited by 144
Self-citationPaterson, A. D., Waggott, D., Boright, A. P., Hosseini, S. M., Shen, E., Sylvestre, M.-P., Wong, I., Bharaj, B., Cleary, P. A., Lachin, J. M., et al. (2010) · Diabetes · doi:10.2337/db09-0653 · Cited by 117
“To reduce the possibility of population stratification, we limited the analysis to individuals who self-identified as white and excluded individuals who were determined to be admixed between Caucasian and other ethnic groups through population genetic approaches (37), seeding with genotype data from the three major po…”
MethodPopulation structure and linkage disequilibrium unravelled in tetraploid potato
D’hoop, B. B., Paulo, M., Kowitwanich, K., Sengers, M., Visser, R. G. F., van Eck, H. J., & van Eeuwijk, F. A. (2010) · Theoretical and Applied Genetics · doi:10.1007/s00122-010-1379-5 · Cited by 127
“0 (Patterson et al. 2006; Price 2006) was engaged to perform a principal component analysis (PCA) with a selected set of 229 polymorphic AFLPs (a subset of the previously introduced total mapped set, where we excluded the monomorphic markers using presence/ absence information) using presence/absence data and mapping…”
MethodInfluentialHuman genome diversity: frequently asked questions
Barbujani, G., & Colonna, V. (2010) · Trends in Genetics · doi:10.1016/j.tig.2010.04.002 · Cited by 131
Xu, W., Cohen‐Woods, S., Chen, Q., Noor, A., Knight, J., Hosang, G. M., Parikh, S. V., Luca, V. D., Tozzi, F., Muglia, P., et al. (2014) · BMC Medical Genetics · doi:10.1186/1471-2350-15-2 · Cited by 132
“Principal component analysis was conducted with EIGENSTRAT [20] on the discovery cohort with SNPs selected after QC filtering.”
MethodInfluentialVariable kinship patterns in Neolithic Anatolia revealed by ancient genomes
Yaka, R., Mapelli, I., Kaptan, D., Doğu, A., Chyleński, M., Erdal, Ö. D., Koptekin, D., Vural, K. B., Bayliss, A., Mazzucato, C., et al. (2021) · Current Biology · doi:10.1016/j.cub.2021.03.050 · Cited by 111
Slavov, G. T., Nipper, R. W., Robson, P. R. H., Farrar, K., Allison, G. G., Bosch, M., Brown, J. C., Donnison, I. S., & Jensen, E. F. (2013) · New Phytologist · doi:10.1111/nph.12621 · Cited by 127
“Four of the 142 sequenced genotypes were identified as outliers along four different and highly significant axes of variation (P 10 5 from tests based on the Tracy– Widom distribution) based on the default settings of the smartpca program within the EIGENSOFT package (Patterson et al., 2006).”
MethodInfluentialMolineros, J. E., Maiti, A. K., Sun, C., Looger, L. L., Han, S., Kim-Howard, X., Glenn, S. B., Adler, A., Kelly, J. A., Niewold, T. B., et al. (2013) · PLoS Genetics · doi:10.1371/journal.pgen.1003222 · Cited by 128
“Using ancestral informative markers (AIMs), we performed principal components analysis (PCA) using EIGENSOFT [58] (EIGEN-SOFT see Web Resources) and STRUCTURE [59] (STRUC-TURE see Web Resources) to identify outliers, hidden population structure and estimate individual ancestry proportions…”
Afghan Hindu Kush: Where Eurasian Sub-Continent Gene Flows Converge
Di Cristofaro, J., Pennarun, E., Mazières, S., Myres, N. M., Lin, A. A., Temori, S. A., Metspalu, M., Metspalu, E., Witzel, M., King, R. J., et al. (2013) · PLoS ONE · doi:10.1371/journal.pone.0076748 · Cited by 100
Ancient genomics reveals tripartite origins of Japanese populations
Cooke, N. P., Mattiangeli, V., Cassidy, L. M., Okazaki, K., Stokes, C. A., Onbe, S., Hatakeyama, S., Machida, K., Kasai, K., Tomioka, N., et al. (2021) · Science Advances · doi:10.1126/sciadv.abh2419 · Cited by 114
Correcting for Population Structure and Kinship Using the Linear Mixed Model: Theory and Extensions
Hoffman, G. E. (2013) · PLoS ONE · doi:10.1371/journal.pone.0075707 · Cited by 142
“Population structure is a low dimensional process embedded in a high dimensional space so that a relatively small number of principal components represent the underlying population genetics [2,27,30].”
InfluentialGenome-wide ancestry of 17th-century enslaved Africans from the Caribbean
Schroeder, H., Ávila-Arcos, M. C., Malaspinas, A.-S., Poznik, G. D., Sandoval-Velasco, M., Carpenter, M. L., Moreno-Mayar, J. V., Sikora, M., Johnson, P. L. F., Allentoft, M. E., et al. (2015) · Proceedings of the National Academy of Sciences · doi:10.1073/pnas.1421784112 · Cited by 119
“0) (83, 84) to perform principal components analysis (PCA).”
MethodPark, D. J., Lukens, A. K., Neafsey, D. E., Schaffner, S. F., Chang, H., Valim, C., Ribacke, U., Tyne, D. V., Galinsky, K. J., Galligan, M. M., et al. (2012) · Proceedings of the National Academy of Sciences · doi:10.1073/pnas.1210585109 · Cited by 124
Genetic subdivision and candidate genes under selection in North American grey wolves
Schweizer, R. M., vonHoldt, B. M., Harrigan, R., Knowles, J. C., Musiani, M., Coltman, D., Novembre, J., & Wayne, R. K. (2016) · Molecular Ecology · doi:10.1111/mec.13364 · Cited by 107
“There was high congruence between the STRUCTURE subpopulation assignments and their pattern of clustering by PCA.”
MethodInfluential
Metadata
- Authors
- Patterson, N., Price, A. L., & Reich, D.
- Affiliations
- Broad Institute (US)
- Corresponding author
- Patterson, Nick
- Venue
- PLoS Genetics
- Publisher
- Public Library of Science (PLoS)
- Published
- 2006
- Volume
- 2
- Issue
- 12
- Pages
- e190
- ISSN
- 1553-7390 (ISSN-L)
- 1553-7404
- PMC
- PMC1713260
- OpenAlex
- W2108169091
- Cited by
- 5,280
- References
- 49
- Citations by year
- 2026: 303 · 2025: 380 · 2024: 430 · 2023: 361 · 2022: 393 · 2021: 405 · 2020: 352 · 2019: 324 · 2018: 313 · 2017: 298 · 2016: 270 · 2015: 250 · 2014: 248 · 2013: 227 · 2012: 212
- FWCI
- 35.78
- Type
- journal article
- Language
- en
- Open access
- gold
- doi.org
- Locations
- PLoS Genetics (publishedVersion, cc-by)
- Europe PMC (PubMed Central) (publishedVersion, cc-by)
- PubMed Central (publishedVersion, cc-by)
- PubMed (publishedVersion)
- Digital Access to Scholarship at Harvard (DASH) (Harvard University) (submittedVersion, cc-by)
- RePEc: Research Papers in Economics (submittedVersion)
- DOAJ (DOAJ: Directory of Open Access Journals) (submittedVersion)
- Funders
- Wellcome Trust
- National Human Genome Research Institute (R01HG006399)
- Topics
- Life Sciences › Biochemistry, Genetics and Molecular Biology › Genetics › Genetic diversity and population structure
- Life Sciences › Biochemistry, Genetics and Molecular Biology › Genetics › Forensic and Genetic Research
- Life Sciences › Biochemistry, Genetics and Molecular Biology › Genetics › Genetic Associations and Epidemiology
- Keywords
- population structure, principal component analysis, significance tests, genetic differentiation, phase transitions, sample size determination, FST, genetic data, eigenvalue analysis
- MeSH terms
- Computer Simulation, Genetic Markers, Genetics, Medical, Genetics, Population, Humans, Models, Genetic, Genetic Variation, Models, Statistical, Principal Component Analysis
About these checks
Registry, retraction, Cites and statistics results are computed, not judged, with one exception: a printed reference that no index lists is read once by a model before it counts as a citation error. Claims are extracted by a model and kept only when their quote appears verbatim in the text; each cited source is then checked, with a model’s help, for whether it says what the claim relies on. Those verdicts can be wrong — read the claim’s quote and the cited source before relying on one.
Statistics and arithmetic are recomputed, not judged.
Confidence bands are shown only for fields calibrated on our annotated test set. None is calibrated yet, so no band is shown.
What counts as a claim ›How we measure confidence ›How we check this ›
Are you an author, or do you see a problem with this page? Request a review
Data sources
Bibliographic data: Semantic Scholar, OpenAlex, Crossref.
Contains information from the Semantic Scholar Academic Graph Datasets, made available under the ODC Attribution License (ODC-BY 1.0).
Semantic Scholar’s data is described in: Kinney, R., et al. (2023). The Semantic Scholar Open Data Platform. arXiv:2301.10140.
