

Population Structure and Eigenanalysis
Open accessThe DOI matches its Crossref record; 48 of the 49 references it cites were found in a registry or an index.
Abstract
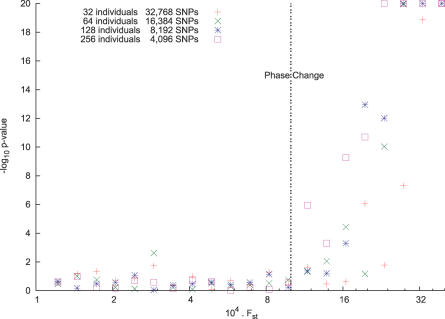
Current methods for inferring population structure from genetic data do not provide formal significance tests for population differentiation. We discuss an approach to studying population structure (principal components analysis) that was first applied to genetic data by Cavalli-Sforza and colleagues. We place the method on a solid statistical footing, using results from modern statistics to develop formal significance tests. We also uncover a general "phase change" phenomenon about the ability to detect structure in genetic data, which emerges from the statistical theory we use, and has an important implication for the ability to discover structure in genetic data: for a fixed but large dataset size, divergence between two populations (as measured, for example, by a statistic like FST) below a threshold is essentially undetectable, but a little above threshold, detection will be easy. This means that we can predict the dataset size needed to detect structure.
Overview
The claims and statistics of this paper haven’t been checked yet.
Free: it reads the open-access text and checks the first 5 claims that cite a source we can check. Create a free account to check every claim.
Integrity signals
Registry
Cites
Statistics
Figures
Verification
Claims the paper makes
The claims and statistics of this paper haven’t been checked yet.
Free: it reads the open-access text and checks the first 5 claims that cite a source we can check. Create a free account to check every claim.
Claims other papers make about this one
Each is checked against this paper’s own text: does it say what the citing paper says it does?
The source backs part of the claim, not all of it — or backs it for a different population, condition or comparison.
In the citing paper
“It is notable that PCA clustering is sensitive to the sample size of different ancestries and also to their amount of genetic drift, which exaggerates principal component distances 207,208,211,212 .”
From Ancient DNA analysis (2021) · cites this paper as [207]
Experimental — accuracy not yet measured
Self-check
Percentages, sums and reported differences re-computed from the paper’s own numbers.
The self-check needs the paper’s full text.
Citations
Cites
Inference of Population Structure Using Multilocus Genotype Data
Pritchard, J. K., Stephens, M., & Donnelly, P. (2000) · Genetics · doi:10.1093/genetics/155.2.945 · Cited by 33,908
Principal components analysis corrects for stratification in genome-wide association studies
Price, A. L., Patterson, N. J., Plenge, R. M., Weinblatt, M. E., Shadick, N. A., & Reich, D. (2006) · Nature Genetics · doi:10.1038/ng1847 · Cited by 10,248 · cited 2×
“A parallel paper [14] explores applications to medical genetics.”
BackgroundSelf-citationFalush, D., Stephens, M., & Pritchard, J. K. (2003) · Genetics · doi:10.1093/genetics/164.4.1567 · Cited by 7,959
The International HapMap Project
†The International HapMap Consortium, Genotyping centres: Baylor College of Medicine and ParAllele BioScience, Gibbs, R. A., Belmont, J. W., Hardenbol, P., Willis, T. D., Yu, F., Chinese HapMap Consortium, Yang, H., Ch'ang, L.-Y., et al. (2003) · Nature · doi:10.1038/nature02168 · Cited by 6,057
A haplotype map of the human genome
The International HapMap Consortium (2005) · Nature · doi:10.1038/nature04226 · Cited by 5,858 · cited 1×
“For instance, in the International Haplotype Map project [ 26 ], markers were chosen about 5,000 bases apart (phase 1), or about 1,000 bases apart (phase 2), and so nearby markers will often be in LD. Mathematically this will induce correlation between nearby columns of our matrix M. The effect of this will be that th…”
BackgroundSpielman, R. S., McGinnis, R. E., & Ewens, W. J. (1993) · PubMed · Cited by 3,651
Searle, S. R., & Searle, S. R. (1971) · Cited by 3,229
The History and Geography of Human Genes: Abridged paperback Edition
Cavalli-Sforza, L. L., Menozzi, P., & Piazza, A. (2018) · Princeton University Press eBooks · doi:10.2307/j.ctv301gjp · Cited by 3,175
Genomic Control for Association Studies
Devlin, B., & Roeder, K. (1999) · Biometrics · doi:10.1111/j.0006-341x.1999.00997.x · Cited by 3,162 · cited 3×
“If e([1]) is the principal eigenvector of the matrix X, this means that the sum of squares”
BackgroundOn the distribution of the largest eigenvalue in principal components analysis
Johnstone, I. M. (2001) · The Annals of Statistics · doi:10.1214/aos/1009210544 · Cited by 1,949 · cited 13×
“> λm, then Johnstone [1] shows that with suitable normalization and for large m and n, the largest eigenvalue λ1 is well approximated by the Tracy-Widom distribution.”
BackgroundMethodInfluential
Research works printed but not linked: 39
- Devlin, 1999, Biometrics, 55, 997
- Menozzi, 1978, Science, 201, 786
- Cavalli-Sforza, 2003, Nat Genet, 33, 266
- Shriver, 2005, Human Genomics, 2, 81
- Capelli, 2006, Ann Hum Genet, 70, 207
- Lovell, 2005, Ann Hum Genet, 69, 275
- Stoneking, 1997, Genome Res, 7, 1061
- Pritchard, 2000, Genetics, 155, 945
- Falush, 2003, Genetics, 164, 1567
- Hoggart, 2004, Am J Hum Genet, 74, 965
- Patterson, 2004, Am J Hum Genet, 74, 979
- Montana, 2004, Am J Hum Genet, 75, 771
- Price, 2006, Nat Genet, 38, 904
- Baik, 2005, Ann Probability, 33, 1643
- Baik, 2006, J Multivariate Anal, 97, 1643
- Nicholson, 2002, JRSS(B), 64, 695
- Bowcock, 1994, Nature, 368, 455
- Johnstone, 2001, Ann Stat, 29, 295
- Tracy, 1994, Commun Math Phys, 159, 151
- El Karoui, 2003, On the largest eigenvalue of Wishart matrices with identity covariance when p/n → ∞
- Soshnikov, 2002, J Stat Physics, 108, 1033
- Altshuler, 2005, Nature, 437, 1299
- Macarthur, 1957, Proc Natl Acad Sci U S A, 43, 293
- Pielou, 1975, Ecological diversity
- Ramachandran, 2005, Proc Natl Acad Sci, 102, 15942
- Gibbs, 2004, Nature, 426, 789
- Smith, 2004, Am J Hum Genet, 74, 1001
- Daly, 2001, Nat Genet, 29, 229
- Patil, 2001, Science, 294, 1719
- Allen, 2003, Am J Hum Genet, 72, 671
- Clayton, 2005, Nat Genet, 37, 1243
- Serre, 2004, Genome Res, 14, 1679
- Spielman, 1993, Am J Hum Genet, 52, 506
- Freedman, 2004, Nat Genet, 36, 388
- Marchini, 2004, Nat Genet, 36, 512
- Helgason, 2005, Nat Genet, 37, 90
- Balding, 1995, Genetica, 96, 3
- Rosenberg, 2006, Ann Hum Gen, 70, 841
- Schaffner, 2005, Genome Res, 15, 1576
Cited by
Items 401–500 of 1,074
Org, E., Eyheramendy, S., Juhanson, P., Gieger, C., Lichtner, P., Klopp, N., Veldre, G., Döring, A., Viigimaa, M., Sõber, S., et al. (2009) · Human Molecular Genetics · doi:10.1093/hmg/ddp135 · Cited by 188
“The distribution of log10(P) of association tests is shown before (black dots) and after (green dots) correction for population stratification performed by principal component analysis using the EIGENSOFT software (21).”
MethodUsing association mapping to dissect the genetic basis of complex traits in plants
Hall, D., Tegstrom, C., & Ingvarsson, P. K. (2010) · Briefings in Functional Genomics · doi:10.1093/bfgp/elp048 · Cited by 187
Multiple migrations to the Philippines during the last 50,000 years
Larena, M., Sanchez-Quinto, F., Sjödin, P., McKenna, J., Ebeo, C., Reyes, R., Casel, O., Huang, J.-Y., Hagada, K. P., Guilay, D., et al. (2021) · Proceedings of the National Academy of Sciences · doi:10.1073/pnas.2026132118 · Cited by 186
“1 (41, 42), and an FST-based neighbor-joining tree was plotted using MEGA7 (43).”
Complex Patterns of Admixture across the Indonesian Archipelago
Hudjashov, G., Karafet, T. M., Lawson, D. J., Downey, S., Savina, O., Sudoyo, H., Lansing, J. S., Hammer, M. F., & Cox, M. P. (2017) · Molecular Biology and Evolution · doi:10.1093/molbev/msx196 · Cited by 191
“PCA was performed with the smartpca function of EIGENSOFT v. 3.0 (Patterson et al. 2006) with no outlier removal step.”
InfluentialRandom matrix theory in statistics: A review
Paul, D., & Aue, A. (2014) · Journal of Statistical Planning and Inference · doi:10.1016/j.jspi.2013.09.005 · Cited by 184
“Patterson et al. (2006) used the phase transition behavior to explain the nature of difficulties of inferring the population structure from genetic data.”
MethodKushniarevich, A., Utevska, O., Chuhryaeva, M., Agdzhoyan, A., Dibirova, K., Uktveryte, I., Möls, M., Mulahasanovic, L., Pshenichnov, A., Frolova, S., et al. (2015) · PLOS ONE · doi:10.1371/journal.pone.0135820 · Cited by 190
“PCA was performed for the autosomal dataset using the smartpca program of the EIGENSOFT package [71]; sets of Illumina-Affymetrix cross-platform SNPs (around 57k of LD-pruned SNPs), encompassing available Balto-Slavic populations, were used.”
MethodVijay, N., Bossu, C. M., Poelstra, J. W., Weissensteiner, M. H., Suh, A., Kryukov, A. P., & Wolf, J. B. W. (2016) · Nature Communications · doi:10.1038/ncomms13195 · Cited by 187
A unified genealogy of modern and ancient genomes
Wohns, A. W., Wong, Y., Jeffery, B., Akbari, A., Mallick, S., Pinhasi, R., Patterson, N., Reich, D., Kelleher, J., & McVean, G. (2022) · Science · doi:10.1126/science.abi8264 · Cited by 179
Self-citationGalwey, N. W. (2009) · Genetic Epidemiology · doi:10.1002/gepi.20408 · Cited by 187
Landscape of genomic diversity and trait discovery in soybean
Valliyodan, B., Qiu, D., Patil, G., Zeng, P., Huang, J., Dai, L., Chen, C., Li, Y., Joshi, T., Song, L., et al. (2016) · Scientific Reports · doi:10.1038/srep23598 · Cited by 184
Neafsey, D. E., Barker, B. M., Sharpton, T. J., Stajich, J. E., Park, D. J., Whiston, E., Hung, C.-Y., McMahan, C., White, J., Sykes, S., et al. (2010) · Genome Research · doi:10.1101/gr.103911.109 · Cited by 180
“We performed a principal components (PC) analysis of the SNP data using SMARTPCA (Patterson et al. 2006).”
MethodInfluentialCarmi, S., Hui, K. Y., Kochav, E., Liu, X., Xue, J., Grady, F., Guha, S., Upadhyay, K., Ben-Avraham, D., Mukherjee, S., et al. (2014) · Nature Communications · doi:10.1038/ncomms5835 · Cited by 188
Pierron, D., Razafindrazaka, H., Pagani, L., Ricaut, F.-X., Antao, T., Capredon, M., Sambo, C., Radimilahy, C., Rakotoarisoa, J.-A., Blench, R. M., et al. (2014) · Proceedings of the National Academy of Sciences · doi:10.1073/pnas.1321860111 · Cited by 190
“Several approaches to estimate admixture dates have been developed on the basis of exponential decay of admixture-induced linkage disequilibrium (LD) as a function of genetic distance (40, 43).”
BackgroundMethodInfluentialImproved ancestry inference using weights from external reference panels
Chen, C.-Y., Pollack, S., Hunter, D. J., Hirschhorn, J. N., Kraft, P., & Price, A. L. (2013) · Bioinformatics · doi:10.1093/bioinformatics/btt144 · Cited by 197
Self-citationGROUP investigators, Børglum, A. D., Demontis, D., Grove, J., Pallesen, J., Hollegaard, M. V., Pedersen, C. B., Hedemand, A., Mattheisen, M., Uitterlinden, A., et al. (2014) · Molecular Psychiatry · doi:10.1038/mp.2013.2 · Cited by 186
Extensive Farming in Estonia Started through a Sex-Biased Migration from the Steppe
Saag, L., Varul, L., Scheib, C. L., Stenderup, J., Allentoft, M. E., Saag, L., Pagani, L., Reidla, M., Tambets, K., Metspalu, E., et al. (2017) · Current Biology · doi:10.1016/j.cub.2017.06.022 · Cited by 187
A female Viking warrior confirmed by genomics
Hedenstierna‐Jonson, C., Kjellström, A., Zachrisson, T., Krzewińska, M., Sobrado, V., Price, N., Günther, T., Jakobsson, M., Götherström, A., & Storå, J. (2017) · American Journal of Physical Anthropology · doi:10.1002/ajpa.23308 · Cited by 166
“The principal component analyses (PCA) was undertaken using EIGENSOFT v.6.0.1 (Patterson et al., 2006).”
MethodInfluentialThe origin of domestication genes in goats
Zheng, Z., Wang, X., Li, M., Li, Y., Yang, Z., Wang, X., Pan, X., Gong, M., Zhang, Y., Guo, Y., et al. (2020) · Science Advances · doi:10.1126/sciadv.aaz5216 · Cited by 184
The evolutionary history of dogs in the Americas
Ní Leathlobhair, M., Perri, A. R., Irving-Pease, E. K., Witt, K. E., Linderholm, A., Haile, J., Lebrasseur, O., Ameen, C., Blick, J., Boyko, A. R., et al. (2018) · Science · doi:10.1126/science.aao4776 · Cited by 184
Genome-wide association study identifies multiple susceptibility loci for multiple myeloma
Mitchell, J. S., Li, N., Weinhold, N., Försti, A., Ali, M., van Duin, M., Thorleifsson, G., Johnson, D. C., Chen, B., Halvarsson, B.-M., et al. (2016) · Nature Communications · doi:10.1038/ncomms12050 · Cited by 180
Lv, F.-H., Cao, Y.-H., Liu, G.-J., Luo, L.-Y., Lu, R., Liu, M.-J., Li, W.-R., Zhou, P., Wang, X.-H., Shen, M., et al. (2022) · Molecular Biology and Evolution · doi:10.1093/molbev/msab353 · Cited by 182
“PCA was performed using the smartpca function built in the EIGENSOFT v.6.0.1 (Patterson et al. 2006) with default settings.”
InfluentialWu, W., Liu, X., Wang, M., Meyer, R. S., Luo, X., Ndjiondjop, M.-N., Tan, L., Zhang, J., Wu, J., Cai, H., et al. (2017) · Nature Plants · doi:10.1038/nplants.2017.64 · Cited by 182
Boyko, A. R., Boyko, R. H., Boyko, C. M., Parker, H. G., Castelhano, M., Corey, L., Degenhardt, J. D., Auton, A., Hedimbi, M., Kityo, R., et al. (2009) · Proceedings of the National Academy of Sciences · doi:10.1073/pnas.0902129106 · Cited by 182
“0 (22) and clustering analysis with STRUCTURE v2.”
BackgroundMethodInfluentialXu, J., Mo, Z., Ye, D., Wang, M., Liu, F., Jin, G., Xu, C., Wang, X., Shao, Q., Chen, Z., et al. (2012) · Nature Genetics · doi:10.1038/ng.2424 · Cited by 180
Hypothesis Testing for Automated Community Detection in Networks
Bickel, P. J., & Sarkar, P. (2016) · Journal of the Royal Statistical Society Series B: Statistical Methodology · doi:10.1111/rssb.12117 · Cited by 173
“For genetic data, Patterson et al. (2006) showed how to combine principal components analysis with random-matrix theory to discover whether the data have cluster structure.”
MethodGenome-wide association study of ancestry-specific TB risk in the South African Coloured population
Chimusa, E. R., Zaitlen, N., Daya, M., Moller, M., van Helden, P. D., Mulder, N. J., Price, A. L., & Hoal, E. G. (2014) · Human Molecular Genetics · doi:10.1093/hmg/ddt462 · Cited by 180
“To evaluate the extent of substructure in the SAC (separating cases and controls as distinct groups) and examine whether stratification can be accounted for in the GWAS, the smartpca programme in the EIGENSOFT package (52,53) was applied to the merged data of the 888 SAC samples (also case-only and control-only) and i…”
MethodSelf-citationMiller, J. M., Cullingham, C. I., & Peery, R. M. (2020) · Heredity · doi:10.1038/s41437-020-0348-2 · Cited by 171
“…et al. 2009); and LEA (Frichot and François 2015)), phylogenetic approaches (Yang and Rannala 2012) and principal components analyses (PCA; Patterson et al. 2006; Reich et al. 2008), to F-statistics (Weir and Cockerham 1984) and analysis of molecular variance (AMOVA; Excoffier et al.…”
BackgroundMethodInfluentialPopulation Genomics of Inversion Polymorphisms in Drosophila melanogaster
Corbett-Detig, R. B., & Hartl, D. L. (2012) · PLoS Genetics · doi:10.1371/journal.pgen.1003056 · Cited by 179
“Principle component analysis, as described in [25] and following the method of [45], within the Rwandan samples suggests that inversions are responsible for the majority of genetic structure in this population (Figure 5).”
MethodGelernter, J., Sherva, R., Koesterer, R., Almasy, L., Zhao, H., Kranzler, H. R., & Farrer, L. (2014) · Molecular Psychiatry · doi:10.1038/mp.2013.99 · Cited by 181
Slavov, G. T., DiFazio, S. P., Martin, J., Schackwitz, W., Muchero, W., Rodgers‐Melnick, E., Lipphardt, M. F., Pennacchio, C. P., Hellsten, U., Pennacchio, L. A., et al. (2012) · New Phytologist · doi:10.1111/j.1469-8137.2012.04258.x · Cited by 175
“0 of the EIGENSOFT package (Patterson et al., 2006) after removing one SNP from each pair of loci located within 10 kb of one another and linked at r ‡ 0.”
BackgroundMethodPopulation Turnover in Remote Oceania Shortly after Initial Settlement
Lipson, M., Skoglund, P., Spriggs, M., Valentin, F., Bedford, S., Shing, R., Buckley, H., Phillip, I., Ward, G. K., Mallick, S., et al. (2018) · Current Biology · doi:10.1016/j.cub.2018.02.051 · Cited by 173
Self-citationAncient West African foragers in the context of African population history
Lipson, M., Ribot, I., Mallick, S., Rohland, N., Olalde, I., Adamski, N., Broomandkhoshbacht, N., Lawson, A. M., López, S., Oppenheimer, J., et al. (2020) · Nature · doi:10.1038/s41586-020-1929-1 · Cited by 175
Self-citationThe Anglo-Saxon migration and the formation of the early English gene pool
Gretzinger, J., Sayer, D., Justeau, P., Altena, E., Pala, M., Dulias, K., Edwards, C. J., Jodoin, S., Lacher, L., Sabin, S., et al. (2022) · Nature · doi:10.1038/s41586-022-05247-2 · Cited by 177
Self-citationUsing Genotyping-By-Sequencing (GBS) for Genomic Discovery in Cultivated Oat
Huang, Y.-F., Poland, J. A., Wight, C. P., Jackson, E. W., & Tinker, N. A. (2014) · PLoS ONE · doi:10.1371/journal.pone.0102448 · Cited by 172
“Since this dependency is also reflected in LD (see next section), it was likely to distort the Eigenvector/Eigenvalues and to bias the interpretation of population structure [29].”
BackgroundMethodMeta-analysis identifies seven susceptibility loci involved in the atopic march
Marenholz, I., Esparza-Gordillo, J., Rüschendorf, F., Bauerfeind, A., Strachan, D. P., Spycher, B. D., Baurecht, H., Margaritte-Jeannin, P., Sääf, A., Kerkhof, M., et al. (2015) · Nature Communications · doi:10.1038/ncomms9804 · Cited by 178
Structural variation in the pangenome of wild and domesticated barley
Jayakodi, M., Lu, Q., Pidon, H., Rabanus‐Wallace, M. T., Bayer, M., Lux, T. M., Guo, Y., Jaegle, B., Badea, A., Bekele, W. A., et al. (2024) · Nature · doi:10.1038/s41586-024-08187-1 · Cited by 209
Linkage Disequilibrium and Demographic History of Wild and Domestic Canids
Gray, M. M., Granka, J. M., Bustamante, C. D., Sutter, N. B., Boyko, A. R., Zhu, L., Ostrander, E. A., & Wayne, R. K. (2009) · Genetics · doi:10.1534/genetics.108.098830 · Cited by 172
“Twstats (Patterson et al. 2006) in Eigenstrat was used to determine the number of significant principal components.”
MethodBrisbin, A., Bryc, K., Byrnes, J., Zakharia, F., Omberg, L., Degenhardt, J., Reynolds, A., Ostrer, H., Mezey, J. G., & Bustamante, C. D. (2012) · Human Biology · doi:10.1353/hub.2012.a493568 · Cited by 176
Rivollat, M., Jeong, C., Schiffels, S., Küçükkalıpçı, İ., Pemonge, M.-H., Rohrlach, A. B., Alt, K. W., Binder, D., Friederich, S., Ghesquière, E., et al. (2020) · Science Advances · doi:10.1126/sciadv.aaz5344 · Cited by 173
Genome‐wide significant association between alcohol dependence and a variant in the ADH gene cluster
Frank, J., Cichon, S., Treutlein, J., Ridinger, M., Mattheisen, M., Hoffmann, P., Herms, S., Wodarz, N., Soyka, M., Zill, P., et al. (2012) · Addiction Biology · doi:10.1111/j.1369-1600.2011.00395.x · Cited by 176
Use of race, ethnicity, and ancestry data in health research
Lu, C., Ahmed, R., Lamri, A., & Anand, S. S. (2022) · PLOS Global Public Health · doi:10.1371/journal.pgph.0001060 · Cited by 158
“Among the most commonly used methods are: i) Principal component analysis (PCA) [74], a multi-dimensional scaling method implemented in multiple software [75, 78, 79]; and ii) model-based clustering approaches [76, 80] used to characterize and visualize genetic ancestry.”
MethodGenome-wide association study (GWAS) of resistance to head smut in maize
Wang, M., Yan, J., Zhao, J., Song, W., Zhang, X., Xiao, Y., & Zheng, Y. (2012) · Plant Science · doi:10.1016/j.plantsci.2012.08.004 · Cited by 173
Global population divergence and admixture of the brown rat ( Rattus norvegicus )
Puckett, E. E., Park, J., Combs, M. A., Blum, M. J., Bryant, J. E., Caccone, A., Costa, F., Deinum, E. E., Esther, A., Himsworth, C. G., et al. (2016) · Proceedings of the Royal Society B Biological Sciences · doi:10.1098/rspb.2016.1762 · Cited by 178
Gonder, M. K., Locatelli, S., Ghobrial, L., Mitchell, M. W., Kujawski, J. T., Lankester, F. J., Stewart, C.-B., & Tishkoff, S. A. (2011) · Proceedings of the National Academy of Sciences · doi:10.1073/pnas.1015422108 · Cited by 165
“The EIGENSOFT software package (27) was used for PCA”
MethodThe Caucasus as an Asymmetric Semipermeable Barrier to Ancient Human Migrations
Yunusbayev, B., Metspalu, M., Jarve, M., Kutuev, I., Rootsi, S., Metspalu, E., Behar, D. M., Varendi, K., Sahakyan, H., Khusainova, R., et al. (2012) · Molecular Biology and Evolution · doi:10.1093/molbev/msr221 · Cited by 176
“PCA and FST Since the PCA method (Patterson et al. 2006) assumes that markers are unlinked, we thinned our marker set for this analysis with PLINK software 1.05 (Purcell et al. 2007) according to the same parameters used for genetic clustering analysis in order to mitigate background LD.”
BackgroundMethodInfluentialA review of UMAP in population genetics
Diaz-Papkovich, A., Anderson-Trocmé, L., & Gravel, S. (2021) · Journal of Human Genetics · doi:10.1038/s10038-020-00851-4 · Cited by 167
Genome-wide analysis correlates Ayurveda Prakriti
Govindaraj, P., Nizamuddin, S., Sharath, A., Jyothi, V., Rotti, H., Raval, R., Nayak, J., Bhat, B. K., Prasanna, B. V., Shintre, P., et al. (2015) · Scientific Reports · doi:10.1038/srep15786 · Cited by 172
Multiscale causal networks identify VGF as a key regulator of Alzheimer’s disease
Beckmann, N. D., Lin, W.-J., Wang, M., Cohain, A. T., Charney, A. W., Wang, P., Ma, W., Wang, Y.-C., Jiang, C., Audrain, M., et al. (2020) · Nature Communications · doi:10.1038/s41467-020-17405-z · Cited by 172
Genome-wide Association Study Identifies New Susceptibility Loci for Posttraumatic Stress Disorder
Xie, P., Kranzler, H. R., Yang, C., Zhao, H., Farrer, L. A., & Gelernter, J. (2013) · Biological Psychiatry · doi:10.1016/j.biopsych.2013.04.013 · Cited by 168
“Principal components analysis was conducted using the Eigensoft package (22,23) to identify population groups of the GWAS subjects.”
MethodDerived variants at six genes explain nearly half of size reduction in dog breeds
Rimbault, M., Beale, H. C., Schoenebeck, J. J., Hoopes, B. C., Allen, J. J., Kilroy-Glynn, P., Wayne, R. K., Sutter, N. B., & Ostrander, E. A. (2013) · Genome Research · doi:10.1101/gr.157339.113 · Cited by 170
“Twenty principal components were calculated on the CanMap data set using SmartPCA from the Eigensoft package (Patterson et al. 2006; Price et al. 2006).”
MethodThe Milieu Intérieur Consortium, Scepanovic, P., Hodel, F., Mondot, S., Partula, V., Byrd, A., Hammer, C., Alanio, C., Bergstedt, J., Patin, E., et al. (2019) · Microbiome · doi:10.1186/s40168-019-0747-x · Cited by 171
MYH9 and APOL1 are both associated with sickle cell disease nephropathy
Ashley‐Koch, A. E., Okocha, E. C., Garrett, M. E., Soldano, K., De Castro, L. M., Jonassaint, J. C., Orringer, E. P., Eckman, J. R., & Telen, M. J. (2011) · British Journal of Haematology · doi:10.1111/j.1365-2141.2011.08832.x · Cited by 160
De Wit, P., & Palumbi, S. R. (2013) · Molecular Ecology · doi:10.1111/mec.12081 · Cited by 162
Genetic history from the Middle Neolithic to present on the Mediterranean island of Sardinia
Marcus, J. H., Posth, C., Ringbauer, H., Lai, L., Skeates, R., Sidore, C., Beckett, J., Furtwängler, A., Olivieri, A., Chiang, C. W. K., et al. (2020) · Nature Communications · doi:10.1038/s41467-020-14523-6 · Cited by 152
Self-citationAuton, A., Bryc, K., Boyko, A. R., Lohmueller, K. E., Novembre, J., Reynolds, A., Indap, A., Wright, M. H., Degenhardt, J. D., Gutenkunst, R. N., et al. (2009) · Genome Research · doi:10.1101/gr.088898.108 · Cited by 166
Ancestry and demography and descendants of Iron Age nomads of the Eurasian Steppe
Unterländer, M., Palstra, F., Lazaridis, I., Pilipenko, A., Hofmanová, Z., Groß, M., Sell, C., Blöcher, J., Kirsanow, K., Rohland, N., et al. (2017) · Nature Communications · doi:10.1038/ncomms14615 · Cited by 171
Self-citationArchaic human ancestry in East Asia
Skoglund, P., & Jakobsson, M. (2011) · Proceedings of the National Academy of Sciences · doi:10.1073/pnas.1108181108 · Cited by 165
“However, both the PCA results (Fig.”
BackgroundMethodInfluentialPopulation Structure in a Comprehensive Genomic Data Set on Human Microsatellite Variation
Pemberton, T. J., DeGiorgio, M., & Rosenberg, N. A. (2013) · G3 Genes|Genomes|Genetics · doi:10.1534/g3.113.005728 · Cited by 168
“Patterson, N., A. L. Price, and D. Reich, 2006 Population structure and eigenanalysis.”
Metspalu, M., Romero, I. G., Yunusbayev, B., Chaubey, G., Mallick, C. B., Hudjashov, G., Nelis, M., Mägi, R., Metspalu, E., Remm, M., et al. (2011) · The American Journal of Human Genetics · doi:10.1016/j.ajhg.2011.11.010 · Cited by 167
Malagasy Genetic Ancestry Comes from an Historical Malay Trading Post in Southeast Borneo
Brucato, N., Kusuma, P., Cox, M. P., Pierron, D., Purnomo, G. A., Adelaar, A., Kivisild, T., Letellier, T., Sudoyo, H., & Ricaut, F.-X. (2016) · Molecular Biology and Evolution · doi:10.1093/molbev/msw117 · Cited by 170
A continuum of admixture in the Western Hemisphere revealed by the African Diaspora genome
Mathias, R. A., Taub, M. A., Gignoux, C. R., Fu, W., Musharoff, S., O'Connor, T. D., Vergara, C., Torgerson, D. G., Pino-Yanes, M., Shringarpure, S. S., et al. (2016) · Nature Communications · doi:10.1038/ncomms12522 · Cited by 167
GAUTIER, M., & NAVES, M. (2011) · Molecular Ecology · doi:10.1111/j.1365-294x.2011.05163.x · Cited by 164
“As suggested by Patterson et al. (2006), we performed LD correction by replacing individual SNP values with the residuals from a multivariate regression without intercept on the two preceding SNPs on the map, providing they were <200 kb apart.”
MethodThe promise of discovering population-specific disease-associated genes in South Asia
Nakatsuka, N., Moorjani, P., Rai, N., Sarkar, B., Tandon, A., Patterson, N., Bhavani, G. S., Girisha, K. M., Mustak, M. S., Srinivasan, S., et al. (2017) · Nature Genetics · doi:10.1038/ng.3917 · Cited by 170
Self-citationAssessing the Effect of Sequencing Depth and Sample Size in Population Genetics Inferences
Fumagalli, M. (2013) · PLoS ONE · doi:10.1371/journal.pone.0079667 · Cited by 164
“The PCA is ultimately based on a covariance matrix of individual genotypes [40].”
Guintivano, J., Sullivan, P. F., Stuebe, A. M., Penders, T., Thorp, J., Rubinow, D. R., & Meltzer-Brody, S. (2018) · Psychological Medicine · doi:10.1017/s0033291717002641 · Cited by 159
“Principal components (PC) 1 and 2 are a standard metric to estimate genetic ancestry (Patterson et al. 2006; Price et al. 2006) and showed similar distribution of cases and controls (Fig.”
Evaluation of chromatin accessibility in prefrontal cortex of individuals with schizophrenia
Bryois, J., Garrett, M. E., Song, L., Safi, A., Giusti-Rodriguez, P., Johnson, G. D., Shieh, A. W., Buil, A., Fullard, J. F., Roussos, P., et al. (2018) · Nature Communications · doi:10.1038/s41467-018-05379-y · Cited by 167
Bellenguez, C., Charbonnier, C., Grenier-Boley, B., Quenez, O., Le Guennec, K., Nicolas, G., Chauhan, G., Wallon, D., Rousseau, S., Richard, A. C., et al. (2017) · Neurobiology of Aging · doi:10.1016/j.neurobiolaging.2017.07.001 · Cited by 166
“Evidence of non- European ancestry was assessed through a principal component analysis (PCA) performed on the 1000G Phase 3 individuals (1000 Genomes Project Consortium et al., 2015) with the smartpca program from the EIGENSOFT software (Patterson et al., 2006).”
MethodTwo loci control tuberculin skin test reactivity in an area hyperendemic for tuberculosis
Cobat, A., Gallant, C. J., Simkin, L., Black, G. F., Stanley, K., Hughes, J., Doherty, T. M., Hanekom, W. A., Eley, B., Jaïs, J.-P., et al. (2009) · Journal of Experimental Medicine · doi:10.1084/jem.20090892 · Cited by 162
“We performed a principal component analysis of the 5,567 autosomal SNPs in the 186 genotyped founders of our sample as implemented in the SMARTPCA software ( Patterson et al., 2006 ).”
MethodCurrent status of genome-wide association studies in cancer
Chung, C. C., & Chanock, S. J. (2011) · Human Genetics · doi:10.1007/s00439-011-1030-9 · Cited by 164
“…in unrelated subjects, methods have evolved to address differences in the background population substructure of cases and controls and deter- mine when it is suitable to adjust for the differences, as opposed to removing outlier subjects (Patterson et al. 2006; Price et al. 2006; Yu et al. 2008).”
MethodGenomic analysis of 6,000-year-old cultivated grain illuminates the domestication history of barley
Mascher, M., Schuenemann, V. J., Davidovich, U., Marom, N., Himmelbach, A., Hübner, S., Korol, A., David, M., Reiter, E., Riehl, S., et al. (2016) · Nature Genetics · doi:10.1038/ng.3611 · Cited by 162
The evolutionary road from wild moth to domestic silkworm
Xiang, H., Liu, X., Li, M., Zhu, Y., Wang, L., Cui, Y., Liu, L., Fang, G., Qian, H., Xu, A., et al. (2018) · Nature Ecology & Evolution · doi:10.1038/s41559-018-0593-4 · Cited by 165
A genetic history of the pre-contact Caribbean
Fernandes, D. M., Sirak, K. A., Ringbauer, H., Sedig, J., Rohland, N., Cheronet, O., Mah, M., Mallick, S., Olalde, I., Culleton, B. J., et al. (2021) · Nature · doi:10.1038/s41586-020-03053-2 · Cited by 109
Self-citationBaxi, E. G., Thompson, T., Li, J., Kaye, J. A., Lim, R. G., Wu, J., Ramamoorthy, D., Lima, L., Vaibhav, V., Matlock, A., et al. (2022) · Nature Neuroscience · doi:10.1038/s41593-021-01006-0 · Cited by 154
“We implemented randomized PCA 52 using the Python library scikit-allel package 53 The annotation pipeline incorporated elements from ANNOVAR 54 and generated reports, including genotypes for all samples.”
InfluentialDevelopment and Evaluation of a Genetic Risk Score for Obesity
Belsky, D. W., Moffitt, T. E., Sugden, K., Williams, B., Houts, R., McCarthy, J., & Caspi, A. (2013) · Biodemography and Social Biology · doi:10.1080/19485565.2013.774628 · Cited by 165
“Such principal components were derived separately for whites and blacks in the ARIC cohort using the method described by Patterson, Price, and Reich ( 2006) and were included in the database we obtained from dbGaP (GENEVA ARIC Project 2009).”
Chaubey, G., Metspalu, M., Choi, Y., Magi, R., Romero, I. G., Soares, P., van Oven, M., Behar, D. M., Rootsi, S., Hudjashov, G., et al. (2011) · Molecular Biology and Evolution · doi:10.1093/molbev/msq288 · Cited by 163
“Because background linkage disequilibrium (LD) can affect both principal component analysis (PCA) (Patterson et al. 2006) and ‘‘structure-like’’ analysis (Alexander et al. 2009), we thinned the data set by excluding SNPs unique to either of the two Illumina platforms, SNPs from mtDNA, X, and Y chromosomes and removing…”
BackgroundMethodInfluentialMolecular tools and analytical approaches for the characterization of farm animal genetic diversity
Lenstra, J. A., Groeneveld, L. F., Eding, H., Kantanen, J., Williams, J. L., Taberlet, P., Nicolazzi, E. L., Sölkner, J., Simianer, H., Ciani, E., et al. (2012) · Animal Genetics · doi:10.1111/j.1365-2052.2011.02309.x · Cited by 157
Components of the accuracy of genomic prediction in a multi-breed sheep population1
Daetwyler, H. D., Kemper, K. E., van der Werf, J. H. J., & Hayes, B. J. (2012) · Journal of Animal Science · doi:10.2527/jas.2011-4557 · Cited by 159
Chen, C., Liu, Z., Pan, Q., Chen, X., Wang, H., Guo, H., Liu, S., Lu, H., Tian, S., Li, R., et al. (2016) · Molecular Biology and Evolution · doi:10.1093/molbev/msw017 · Cited by 158
“0 (Patterson et al. 2006) and population structure analyses using frappe (Tang et al. 2005) corroborated these patterns.”
BackgroundMethodThe Arrival of Siberian Ancestry Connecting the Eastern Baltic to Uralic Speakers further East
Saag, L., Laneman, M., Varul, L., Malve, M., Valk, H., Razzak, M. A., Shirobokov, I. G., Khartanovich, V. I., Mikhaylova, E. R., Kushniarevich, A., et al. (2019) · Current Biology · doi:10.1016/j.cub.2019.04.026 · Cited by 157
López Herráez, D., Bauchet, M., Tang, K., Theunert, C., Pugach, I., Li, J., Nandineni, M. R., Gross, A., Scholz, M., & Stoneking, M. (2009) · PLoS ONE · doi:10.1371/journal.pone.0007888 · Cited by 162
“001), according to the TW statistic [23].”
MethodInfluentialBreton, G., Schlebusch, C. M., Lombard, M., Sjödin, P., Soodyall, H., & Jakobsson, M. (2014) · Current Biology · doi:10.1016/j.cub.2014.02.041 · Cited by 164
The Genome-wide Patterns of Variation Expose Significant Substructure in a Founder Population
Jakkula, E., Rehnström, K., Varilo, T., Pietiläinen, O. P. H., Paunio, T., Pedersen, N. L., deFaire, U., Järvelin, M.-R., Saharinen, J., Freimer, N., et al. (2008) · The American Journal of Human Genetics · doi:10.1016/j.ajhg.2008.11.005 · Cited by 161
“Linkage disequilibrium unit (LDU) maps were constructed for the same chromosomes with the LDMAP program.6,25 The LDU scale is constructed from the product of physical (kb) distance and a parameter describing the exponential decline in association with distance computed for each interval between adjacent SNPs.”
MethodInfluentialThe wax gourd genomes offer insights into the genetic diversity and ancestral cucurbit karyotype
Xie, D., Xu, Y., Wang, J., Liu, W., Zhou, Q., Luo, S., Huang, W., He, X., Li, Q., Peng, Q., et al. (2019) · Nature Communications · doi:10.1038/s41467-019-13185-3 · Cited by 163
Privé, F., Luu, K., Blum, M. G. B., McGrath, J. J., & Vilhjálmsson, B. J. (2020) · Bioinformatics · doi:10.1093/bioinformatics/btaa520 · Cited by 162
Ancient DNA and deep population structure in sub-Saharan African foragers
Lipson, M., Sawchuk, E. A., Thompson, J. C., Oppenheimer, J., Tryon, C. A., Ranhorn, K. L., de Luna, K. M., Sirak, K. A., Olalde, I., Ambrose, S. H., et al. (2022) · Nature · doi:10.1038/s41586-022-04430-9 · Cited by 156
Self-citationHeath, S. C., Gut, I. G., Brennan, P., McKay, J. D., Bencko, V., Fabianova, E., Foretova, L., Georges, M., Janout, V., Kabesch, M., et al. (2008) · European Journal of Human Genetics · doi:10.1038/ejhg.2008.210 · Cited by 160
A New Fully Automated Approach for Aligning and Comparing Shapes
Boyer, D., Puente, J., Gladman, J. T., Glynn, C., Mukherjee, S., Yapuncich, G., & Daubechies, I. C. (2014) · The Anatomical Record · doi:10.1002/ar.23084 · Cited by 169
“, 1999), genetics (Patterson et al., 2006), image analysis (Roweis and Saul, 2000), and text analysis (Blei et al.”
BackgroundMcEvoy, B. P., Powell, J. E., Goddard, M. E., & Visscher, P. M. (2011) · Genome Research · doi:10.1101/gr.119636.110 · Cited by 156
“We used Principal Component Analysis (PCA), as implemented in the EIGENSTRAT package (Patterson et al. 2006), to give an overview of the major population structure.”
MethodKrapohl, E., & Plomin, R. (2016) · Molecular Psychiatry · doi:10.1038/mp.2015.2 · Cited by 160
Genetic Structure of Chimpanzee Populations
Becquet, C., Patterson, N., Stone, A. C., Przeworski, M., & Reich, D. (2007) · PLoS Genetics · doi:10.1371/journal.pgen.0030066 · Cited by 157
“We examined whether our data fit the SMM in the 49 individuals that are identified as western chimpanzees by both STRUCTURE and PCA.”
InfluentialSelf-citationIbrahima, O., Mariac, C., Pham, J., & Vigouroux, Y. (2008) · Theoretical and Applied Genetics · doi:10.1007/s00122-008-0793-4 · Cited by 161
“The statistical significance for these first two axes of the PCA using Patterson et al. (2006) procedure was strong (x = 107.”
BackgroundMethodInfluentialSalvi, E., Kutalik, Z., Glorioso, N., Benaglio, P., Frau, F., Kuznetsova, T., Arima, H., Hoggart, C., Tichet, J., Nikitin, Y. P., et al. (2012) · Hypertension · doi:10.1161/hypertensionaha.111.181990 · Cited by 158
Kozlenkov, A., Roussos, P., Timashpolsky, A., Barbu, M., Rudchenko, S., Bibikova, M., Klotzle, B., Byne, W., Lyddon, R., Di Narzo, A. F., et al. (2014) · Nucleic Acids Research · doi:10.1093/nar/gkt838 · Cited by 154
Genome-wide association study identifies multiple loci associated with bladder cancer risk
Figueroa, J. D., Ye, Y., Siddiq, A., Garcia-Closas, M., Chatterjee, N., Prokunina-Olsson, L., Cortessis, V. K., Kooperberg, C., Cussenot, O., Benhamou, S., et al. (2014) · Human Molecular Genetics · doi:10.1093/hmg/ddt519 · Cited by 156
“Principal component analysis (PCA) of genotyped subjects (excluding one from each inferred closely related pairs) was performed with GLU struct.pca module (a similar procedure to EIGENSTRAT) (44,45).”
MethodGenes reveal traces of common recent demographic history for most of the Uralic-speaking populations
Tambets, K., Yunusbayev, B., Hudjashov, G., Ilumäe, A.-M., Rootsi, S., Honkola, T., Vesakoski, O., Atkinson, Q., Skoglund, P., Kushniarevich, A., et al. (2018) · Genome Biology · doi:10.1186/s13059-018-1522-1 · Cited by 157
“2a and Additional file 3: Figure S1) was carried out with the smartpca program of the EIGENSOFT package [75], using 171,454 SNPs.”
MethodAdaptive Introgression: An Untapped Evolutionary Mechanism for Crop Adaptation
Burgarella, C., Barnaud, A., Kane, N. A., Jankowski, F., Scarcelli, N., Billot, C., Vigouroux, Y., & Berthouly‐Salazar, C. (2019) · Frontiers in Plant Science · doi:10.3389/fpls.2019.00004 · Cited by 185
Porth, I. M., Klápště, J., Skyba, O., Hannemann, J., McKown, A. D., Guy, R. D., DiFazio, S. P., Muchero, W., Ranjan, P., Tuskan, G. A., et al. (2013) · New Phytologist · doi:10.1111/nph.12422 · Cited by 179
Barley landraces are characterized by geographically heterogeneous genomic origins
Poets, A. M., Fang, Z., Clegg, M. T., & Morrell, P. L. (2015) · Genome Biology · doi:10.1186/s13059-015-0712-3 · Cited by 154
“The PCA was performed in the SmartPCA program from the EIGENSOFT package [53].”
MethodPopulation genomics and the evolution of virulence in the fungal pathogen Cryptococcus neoformans
Desjardins, C. A., Giamberardino, C., Sykes, S. M., Yu, C.-H., Tenor, J. L., Chen, Y., Yang, T., Jones, A. M., Sun, S., Haverkamp, M. R., et al. (2017) · Genome Research · doi:10.1101/gr.218727.116 · Cited by 157
“Principal components analysis 537 was run on all variants using SMARTPCA (Patterson et al. 2006).”
Lopes, M. S., Dreisigacker, S., Peña, R. J., Sukumaran, S., & Reynolds, M. P. (2014) · Theoretical and Applied Genetics · doi:10.1007/s00122-014-2444-2 · Cited by 180
“Population structure or stratification is particularly important in genome-wide studies because it can cause spurious marker-trait associations (Pritchard et al. 2000; Patterson et al. 2006; Kang et al. 2008).”
Background
Metadata
- Authors
- Patterson, N., Price, A. L., & Reich, D.
- Affiliations
- Broad Institute (US)
- Corresponding author
- Patterson, Nick
- Venue
- PLoS Genetics
- Publisher
- Public Library of Science (PLoS)
- Published
- 2006
- Volume
- 2
- Issue
- 12
- Pages
- e190
- ISSN
- 1553-7390 (ISSN-L)
- 1553-7404
- PMC
- PMC1713260
- OpenAlex
- W2108169091
- Cited by
- 5,280
- References
- 49
- Citations by year
- 2026: 303 · 2025: 380 · 2024: 430 · 2023: 361 · 2022: 393 · 2021: 405 · 2020: 352 · 2019: 324 · 2018: 313 · 2017: 298 · 2016: 270 · 2015: 250 · 2014: 248 · 2013: 227 · 2012: 212
- FWCI
- 35.78
- Type
- journal article
- Language
- en
- Open access
- gold
- doi.org
- Locations
- PLoS Genetics (publishedVersion, cc-by)
- Europe PMC (PubMed Central) (publishedVersion, cc-by)
- PubMed Central (publishedVersion, cc-by)
- PubMed (publishedVersion)
- Digital Access to Scholarship at Harvard (DASH) (Harvard University) (submittedVersion, cc-by)
- RePEc: Research Papers in Economics (submittedVersion)
- DOAJ (DOAJ: Directory of Open Access Journals) (submittedVersion)
- Funders
- Wellcome Trust
- National Human Genome Research Institute (R01HG006399)
- Topics
- Life Sciences › Biochemistry, Genetics and Molecular Biology › Genetics › Genetic diversity and population structure
- Life Sciences › Biochemistry, Genetics and Molecular Biology › Genetics › Forensic and Genetic Research
- Life Sciences › Biochemistry, Genetics and Molecular Biology › Genetics › Genetic Associations and Epidemiology
- Keywords
- population structure, principal component analysis, significance tests, genetic differentiation, phase transitions, sample size determination, FST, genetic data, eigenvalue analysis
- MeSH terms
- Computer Simulation, Genetic Markers, Genetics, Medical, Genetics, Population, Humans, Models, Genetic, Genetic Variation, Models, Statistical, Principal Component Analysis
About these checks
Registry, retraction, Cites and statistics results are computed, not judged, with one exception: a printed reference that no index lists is read once by a model before it counts as a citation error. Claims are extracted by a model and kept only when their quote appears verbatim in the text; each cited source is then checked, with a model’s help, for whether it says what the claim relies on. Those verdicts can be wrong — read the claim’s quote and the cited source before relying on one.
Statistics and arithmetic are recomputed, not judged.
Confidence bands are shown only for fields calibrated on our annotated test set. None is calibrated yet, so no band is shown.
What counts as a claim ›How we measure confidence ›How we check this ›
Are you an author, or do you see a problem with this page? Request a review
Data sources
Bibliographic data: Semantic Scholar, OpenAlex, Crossref.
Contains information from the Semantic Scholar Academic Graph Datasets, made available under the ODC Attribution License (ODC-BY 1.0).
Semantic Scholar’s data is described in: Kinney, R., et al. (2023). The Semantic Scholar Open Data Platform. arXiv:2301.10140.
