

Population Structure and Eigenanalysis
Open accessThe DOI matches its Crossref record; 48 of the 49 references it cites were found in a registry or an index.
Abstract
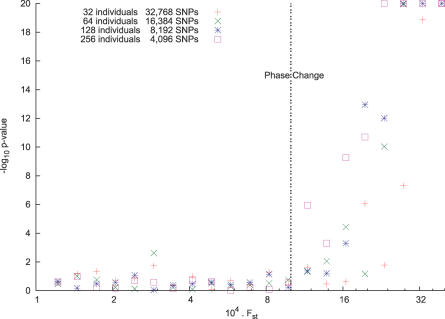
Current methods for inferring population structure from genetic data do not provide formal significance tests for population differentiation. We discuss an approach to studying population structure (principal components analysis) that was first applied to genetic data by Cavalli-Sforza and colleagues. We place the method on a solid statistical footing, using results from modern statistics to develop formal significance tests. We also uncover a general "phase change" phenomenon about the ability to detect structure in genetic data, which emerges from the statistical theory we use, and has an important implication for the ability to discover structure in genetic data: for a fixed but large dataset size, divergence between two populations (as measured, for example, by a statistic like FST) below a threshold is essentially undetectable, but a little above threshold, detection will be easy. This means that we can predict the dataset size needed to detect structure.
Overview
The claims and statistics of this paper haven’t been checked yet.
Free: it reads the open-access text and checks the first 5 claims that cite a source we can check. Create a free account to check every claim.
Integrity signals
Registry
Cites
Statistics
Figures
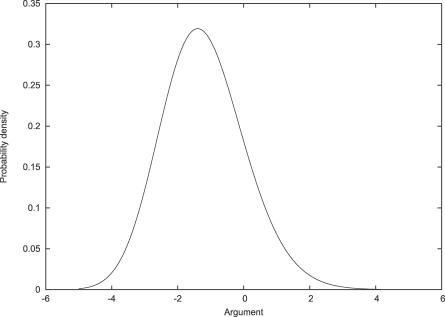
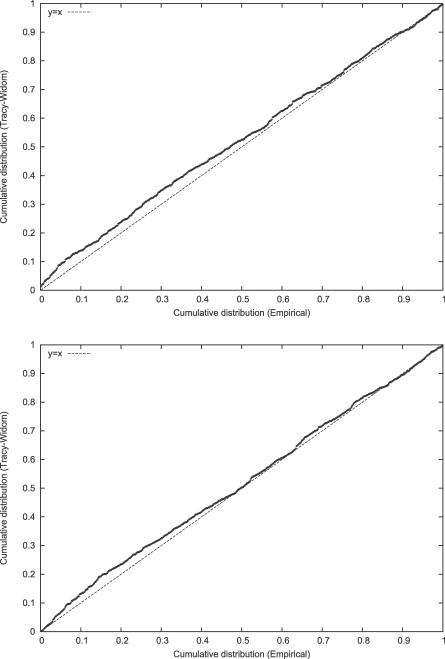
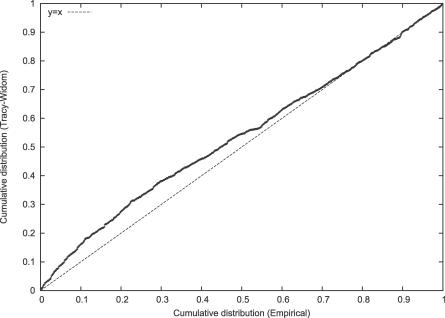
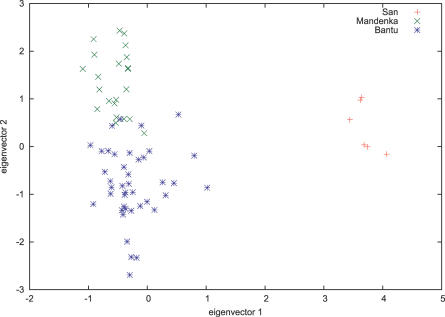
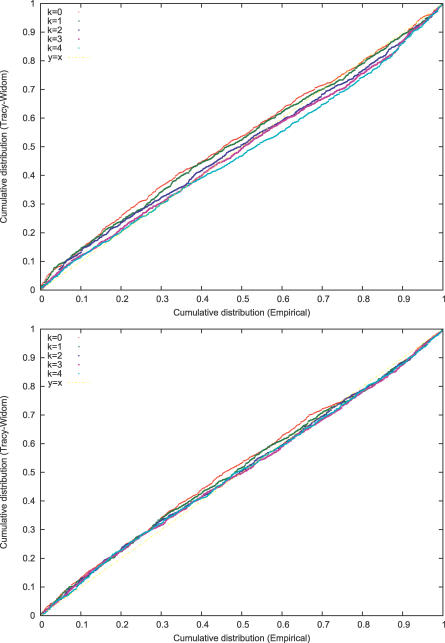
Verification
Claims the paper makes
The claims and statistics of this paper haven’t been checked yet.
Free: it reads the open-access text and checks the first 5 claims that cite a source we can check. Create a free account to check every claim.
Claims other papers make about this one
Each is checked against this paper’s own text: does it say what the citing paper says it does?
The source backs part of the claim, not all of it — or backs it for a different population, condition or comparison.
In the citing paper
“It is notable that PCA clustering is sensitive to the sample size of different ancestries and also to their amount of genetic drift, which exaggerates principal component distances 207,208,211,212 .”
From Ancient DNA analysis (2021) · cites this paper as [207]
Experimental — accuracy not yet measured
Self-check
Percentages, sums and reported differences re-computed from the paper’s own numbers.
The self-check needs the paper’s full text.
Citations
Cites
Inference of Population Structure Using Multilocus Genotype Data
Pritchard, J. K., Stephens, M., & Donnelly, P. (2000) · Genetics · doi:10.1093/genetics/155.2.945 · Cited by 33,908
Principal components analysis corrects for stratification in genome-wide association studies
Price, A. L., Patterson, N. J., Plenge, R. M., Weinblatt, M. E., Shadick, N. A., & Reich, D. (2006) · Nature Genetics · doi:10.1038/ng1847 · Cited by 10,248 · cited 2×
“A parallel paper [14] explores applications to medical genetics.”
BackgroundSelf-citationFalush, D., Stephens, M., & Pritchard, J. K. (2003) · Genetics · doi:10.1093/genetics/164.4.1567 · Cited by 7,959
The International HapMap Project
†The International HapMap Consortium, Genotyping centres: Baylor College of Medicine and ParAllele BioScience, Gibbs, R. A., Belmont, J. W., Hardenbol, P., Willis, T. D., Yu, F., Chinese HapMap Consortium, Yang, H., Ch'ang, L.-Y., et al. (2003) · Nature · doi:10.1038/nature02168 · Cited by 6,057
A haplotype map of the human genome
The International HapMap Consortium (2005) · Nature · doi:10.1038/nature04226 · Cited by 5,858 · cited 1×
“For instance, in the International Haplotype Map project [ 26 ], markers were chosen about 5,000 bases apart (phase 1), or about 1,000 bases apart (phase 2), and so nearby markers will often be in LD. Mathematically this will induce correlation between nearby columns of our matrix M. The effect of this will be that th…”
BackgroundSpielman, R. S., McGinnis, R. E., & Ewens, W. J. (1993) · PubMed · Cited by 3,651
Searle, S. R., & Searle, S. R. (1971) · Cited by 3,229
The History and Geography of Human Genes: Abridged paperback Edition
Cavalli-Sforza, L. L., Menozzi, P., & Piazza, A. (2018) · Princeton University Press eBooks · doi:10.2307/j.ctv301gjp · Cited by 3,175
Genomic Control for Association Studies
Devlin, B., & Roeder, K. (1999) · Biometrics · doi:10.1111/j.0006-341x.1999.00997.x · Cited by 3,162 · cited 3×
“If e([1]) is the principal eigenvector of the matrix X, this means that the sum of squares”
BackgroundOn the distribution of the largest eigenvalue in principal components analysis
Johnstone, I. M. (2001) · The Annals of Statistics · doi:10.1214/aos/1009210544 · Cited by 1,949 · cited 13×
“> λm, then Johnstone [1] shows that with suitable normalization and for large m and n, the largest eigenvalue λ1 is well approximated by the Tracy-Widom distribution.”
BackgroundMethodInfluential
Research works printed but not linked: 39
- Devlin, 1999, Biometrics, 55, 997
- Menozzi, 1978, Science, 201, 786
- Cavalli-Sforza, 2003, Nat Genet, 33, 266
- Shriver, 2005, Human Genomics, 2, 81
- Capelli, 2006, Ann Hum Genet, 70, 207
- Lovell, 2005, Ann Hum Genet, 69, 275
- Stoneking, 1997, Genome Res, 7, 1061
- Pritchard, 2000, Genetics, 155, 945
- Falush, 2003, Genetics, 164, 1567
- Hoggart, 2004, Am J Hum Genet, 74, 965
- Patterson, 2004, Am J Hum Genet, 74, 979
- Montana, 2004, Am J Hum Genet, 75, 771
- Price, 2006, Nat Genet, 38, 904
- Baik, 2005, Ann Probability, 33, 1643
- Baik, 2006, J Multivariate Anal, 97, 1643
- Nicholson, 2002, JRSS(B), 64, 695
- Bowcock, 1994, Nature, 368, 455
- Johnstone, 2001, Ann Stat, 29, 295
- Tracy, 1994, Commun Math Phys, 159, 151
- El Karoui, 2003, On the largest eigenvalue of Wishart matrices with identity covariance when p/n → ∞
- Soshnikov, 2002, J Stat Physics, 108, 1033
- Altshuler, 2005, Nature, 437, 1299
- Macarthur, 1957, Proc Natl Acad Sci U S A, 43, 293
- Pielou, 1975, Ecological diversity
- Ramachandran, 2005, Proc Natl Acad Sci, 102, 15942
- Gibbs, 2004, Nature, 426, 789
- Smith, 2004, Am J Hum Genet, 74, 1001
- Daly, 2001, Nat Genet, 29, 229
- Patil, 2001, Science, 294, 1719
- Allen, 2003, Am J Hum Genet, 72, 671
- Clayton, 2005, Nat Genet, 37, 1243
- Serre, 2004, Genome Res, 14, 1679
- Spielman, 1993, Am J Hum Genet, 52, 506
- Freedman, 2004, Nat Genet, 36, 388
- Marchini, 2004, Nat Genet, 36, 512
- Helgason, 2005, Nat Genet, 37, 90
- Balding, 1995, Genetica, 96, 3
- Rosenberg, 2006, Ann Hum Gen, 70, 841
- Schaffner, 2005, Genome Res, 15, 1576
Cited by
Items 201–300 of 1,074
Adaptive introgression underlies polymorphic seasonal camouflage in snowshoe hares
Jones, M. R., Mills, L. S., Alves, P. C., Callahan, C. M., Alves, J. M., Lafferty, D. J. R., Jiggins, F. M., Jensen, J. D., Melo-Ferreira, J., & Good, J. M. (2018) · Science · doi:10.1126/science.aar5273 · Cited by 339
Mouse Retinal Cell Atlas: Molecular Identification of over Sixty Amacrine Cell Types
Yan, W., Laboulaye, M. A., Tran, N. M., Whitney, I. E., Benhar, I., & Sanes, J. R. (2020) · The Journal of Neuroscience · doi:10.1523/jneurosci.0471-20.2020 · Cited by 333
“(5) Principal component (PC) analysis was applied, and significant PCs estimated based on Tracy–Widom theory (Patterson et al., 2006) were used for further analysis of clustering.”
MethodElhaik, E. (2022) · Scientific Reports · doi:10.1038/s41598-022-14395-4 · Cited by 293
Lan, Q., Hsiung, C. A., Matsuo, K., Hong, Y.-C., Seow, A., Wang, Z., Hosgood, H. D., Chen, K., Wang, J.-C., Chatterjee, N., et al. (2012) · Nature Genetics · doi:10.1038/ng.2456 · Cited by 335
Pedersen, C. B., Bybjerg-Grauholm, J., Pedersen, M. G., Grove, J., Agerbo, E., Bækvad-Hansen, M., Poulsen, J. B., Hansen, C. S., McGrath, J. J., Als, T. D., et al. (2018) · Molecular Psychiatry · doi:10.1038/mp.2017.196 · Cited by 338
Mosley, J. D., Gupta, D. K., Tan, J., Yao, J., Wells, Q. S., Shaffer, C. M., Kundu, S., Robinson-Cohen, C., Psaty, B. M., Rich, S. S., et al. (2020) · JAMA · doi:10.1001/jama.2019.21782 · Cited by 332
Xu, S., Yin, X., Li, S., Jin, W., Lou, H., Yang, L., Gong, X., Wang, H., Shen, Y., Pan, X., et al. (2009) · The American Journal of Human Genetics · doi:10.1016/j.ajhg.2009.10.015 · Cited by 338
An intercross population study reveals genes associated with body size and plumage color in ducks
Zhou, Z., Li, M., Cheng, H., Fan, W., Yuan, Z., Gao, Q., Xu, Y., Guo, Z., Zhang, Y., Hu, J., et al. (2018) · Nature Communications · doi:10.1038/s41467-018-04868-4 · Cited by 334
A Genome-Wide Search for Signals of High-Altitude Adaptation in Tibetans
Xu, S., Li, S., Yang, Y., Tan, J., Lou, H., Jin, W., Yang, L., Pan, X., Wang, J., Shen, Y., et al. (2011) · Molecular Biology and Evolution · doi:10.1093/molbev/msq277 · Cited by 331
“Genetic Difference between TBN and HAN After controls for genotype quality (see Materials and Methods), the 46 TBN samples and 92 HAN samples could be classified as two distinctive clusters in the PCA performed on GW autosomal SNPs (fig.”
MethodInfluentialSpatial Inference of Admixture Proportions and Secondary Contact Zones
Durand, E., Jay, F., Gaggiotti, O. E., & Francois, O. (2009) · Molecular Biology and Evolution · doi:10.1093/molbev/msp106 · Cited by 319
Davis, L. K., Yu, D., Keenan, C. L., Gamazon, E. R., Konkashbaev, A. I., Derks, E. M., Neale, B. M., Yang, J., Lee, S. H., Evans, P., et al. (2013) · PLoS Genetics · doi:10.1371/journal.pgen.1003864 · Cited by 332
“0 [32] and including previously defined European population samples as reference (HapMap3.”
BackgroundA Dynamic 6,000-Year Genetic History of Eurasia’s Eastern Steppe
Jeong, C., Wang, K., Wilkin, S., Taylor, W. T. T., Miller, B. K., Bemmann, J. H., Stahl, R., Chiovelli, C., Knolle, F., Ulziibayar, S., et al. (2020) · Cell · doi:10.1016/j.cell.2020.10.015 · Cited by 328
Discerning the ancestry of European Americans in genetic association studies
Price, A. L., Butler, J., Patterson, N., Capelli, C., Pascali, V. L., Scarnicci, F., Ruiz-Linares, A., Groop, L., Saetta, A. A., Korkolopoulou, P., et al. (2008) · PLoS Genetics · doi:10.1371/journal.pgen.0030236 · Cited by 327
“Recent work in theoretical statistics implies that the squared correlation between an axis of variation inferred with a limited number of markers and a true axis of variation (e.g. as inferred using genome-wide data) is approximately equal to x/(1þx), where x equals FST times the number of markers (see Text S1) [21,11…”
MethodInfluentialSelf-citationPrehistoric genomes reveal the genetic foundation and cost of horse domestication
Schubert, M., Jónsson, H., Chang, D., Der Sarkissian, C., Ermini, L., Ginolhac, A., Albrechtsen, A., Dupanloup, I., Foucal, A., Petersen, B., et al. (2014) · Proceedings of the National Academy of Sciences · doi:10.1073/pnas.1416991111 · Cited by 324
Varshney, R. K., Thudi, M., Roorkiwal, M., He, W., Upadhyaya, H. D., Yang, W., Bajaj, P., Cubry, P., Rathore, A., Jian, J., et al. (2019) · Nature Genetics · doi:10.1038/s41588-019-0401-3 · Cited by 312
Banda, Y., Kvale, M. N., Hoffmann, T. J., Hesselson, S. E., Ranatunga, D., Tang, H., Sabatti, C., Croen, L. A., Dispensa, B. P., Henderson, M., et al. (2015) · Genetics · doi:10.1534/genetics.115.178616 · Cited by 325
“2 software package (Patterson et al. 2006).”
Simultaneous Analysis of All SNPs in Genome-Wide and Re-Sequencing Association Studies
Hoggart, C. J., Whittaker, J. C., De Iorio, M., & Balding, D. J. (2008) · PLoS Genetics · doi:10.1371/journal.pgen.1000130 · Cited by 321
“Since we take a regression approach it would be straightforward to include other individual level covariates such as age and sex, as well as covariates to control for population stratification such as eigenvectors from a principal component analysis [21].”
MethodA multi-tissue atlas of regulatory variants in cattle
Liu, S., Gao, Y., Canela-Xandri, O., Wang, S., Yu, Y., Cai, W., Li, B., Xiang, R., Chamberlain, A. J., Pairo-Castineira, E., et al. (2022) · Nature Genetics · doi:10.1038/s41588-022-01153-5 · Cited by 311
Principal component analysis of genetic data
Reich, D., Price, A. L., & Patterson, N. (2008) · Nature Genetics · doi:10.1038/ng0508-491 · Cited by 307
Self-citationThe Coronary ARtery DIsease Genome-Wide Replication And Meta-Analysis (CARDIoGRAM) Consortium, Lu, X., Wang, L., Chen, S., He, L., Yang, X., Shi, Y., Cheng, J., Zhang, L., Gu, C. C., et al. (2012) · Nature Genetics · doi:10.1038/ng.2337 · Cited by 319
Pool, J. E., Corbett-Detig, R. B., Sugino, R. P., Stevens, K. A., Cardeno, C. M., Crepeau, M. W., Duchen, P., Emerson, J. J., Saelao, P., Begun, D. J., et al. (2012) · PLoS Genetics · doi:10.1371/journal.pgen.1003080 · Cited by 316
“Focusing on PCA from admixture-filtered sub-Saharan data, PC1 separated southern African populations from western African and Ethiopian populations, with eastern African samples having intermediate values (Figure 5B).”
MethodInfluentialA common variant on chromosome 11q13 is associated with atopic dermatitis
Esparza-Gordillo, J., Weidinger, S., Fölster-Holst, R., Bauerfeind, A., Ruschendorf, F., Patone, G., Rohde, K., Marenholz, I., Schulz, F., Kerscher, T., et al. (2009) · Nature Genetics · doi:10.1038/ng.347 · Cited by 317
Chromosome 6p22 Locus Associated with Clinically Aggressive Neuroblastoma
Maris, J. M., Mosse, Y. P., Bradfield, J. P., Hou, C., Monni, S., Scott, R. H., Asgharzadeh, S., Attiyeh, E. F., Diskin, S. J., Laudenslager, M., et al. (2008) · New England Journal of Medicine · doi:10.1056/nejmoa0708698 · Cited by 319
The landscape of recombination in African Americans
Hinch, A. G., Tandon, A., Patterson, N., Song, Y., Rohland, N., Palmer, C. D., Chen, G. K., Wang, K., Buxbaum, S. G., Akylbekova, E. L., et al. (2011) · Nature · doi:10.1038/nature10336 · Cited by 314
Self-citationTracing the ancestry of modern bread wheats
Wheat and Barley Legacy for Breeding Improvement (WHEALBI) consortium, Pont, C., Leroy, T., Seidel, M., Tondelli, A., Duchemin, W., Armisen, D., Lang, D., Bustos-Korts, D., Goué, N., et al. (2019) · Nature Genetics · doi:10.1038/s41588-019-0393-z · Cited by 304
Genome-wide association meta-analysis identifies new endometriosis risk loci
Nyholt, D. R., Low, S.-K., Anderson, C. A., Painter, J. N., Uno, S., Morris, A. P., MacGregor, S., Gordon, S. D., Henders, A. K., Martin, N. G., et al. (2012) · Nature Genetics · doi:10.1038/ng.2445 · Cited by 315
A Genomewide Association Study of Skin Pigmentation in a South Asian Population
Stokowski, R. P., Pant, P. V. K., Dadd, T., Fereday, A., Hinds, D. A., Jarman, C., Filsell, W., Ginger, R. S., Green, M. R., van der Ouderaa, F. J., et al. (2007) · The American Journal of Human Genetics · doi:10.1086/522235 · Cited by 315
Ratnapriya, R., Sosina, O. A., Starostik, M. R., Kwicklis, M., Kapphahn, R. J., Fritsche, L. G., Walton, A., Arvanitis, M., Gieser, L., Pietraszkiewicz, A., et al. (2019) · Nature Genetics · doi:10.1038/s41588-019-0351-9 · Cited by 312
Ancient genomes show social and reproductive behavior of early Upper Paleolithic foragers
Sikora, M., Seguin-Orlando, A., Sousa, V. C., Albrechtsen, A., Korneliussen, T., Ko, A., Rasmussen, S., Dupanloup, I., Nigst, P. R., Bosch, M. D., et al. (2017) · Science · doi:10.1126/science.aao1807 · Cited by 312
The ChinaMAP analytics of deep whole genome sequences in 10,588 individuals
The ChinaMAP Consortium, Cao, Y., Li, L., Xu, M., Feng, Z., Sun, X., Lu, J., Xu, Y., Du, P., Wang, T., et al. (2020) · Cell Research · doi:10.1038/s41422-020-0322-9 · Cited by 317
Shen, C., Du, H., Chen, Z., Lu, H., Zhu, F., Chen, H., Meng, X., Liu, Q., Liu, P., Zheng, L., et al. (2020) · Molecular Plant · doi:10.1016/j.molp.2020.07.003 · Cited by 302
Skoglund, P., Ersmark, E., Palkopoulou, E., & Dalén, L. (2015) · Current Biology · doi:10.1016/j.cub.2015.04.019 · Cited by 310
Inferring Continuous and Discrete Population Genetic Structure Across Space
Bradburd, G. S., Coop, G. M., & Ralph, P. L. (2018) · Genetics · doi:10.1534/genetics.118.301333 · Cited by 316
“In the limit of infinite data, the best value of K may be the number of samples included in the dataset [69].”
BackgroundGenetic markers in the playground of multivariate analysis
Jombart, T., Pontier, D., & Dufour, A.-B. (2009) · Heredity · doi:10.1038/hdy.2008.130 · Cited by 298
“A step in this direction has been made by Patterson et al. (2006), who applied recent developments in statistics (Soshnikov and Fyodorov, 2005) to infer the number of populations in a set of genotypes and define a threshold for genetic structuring to be detectable by PCA.”
BackgroundMethodInfluentialGenome-wide association study of intracranial aneurysm identifies three new risk loci
Yasuno, K., Bilguvar, K., Bijlenga, P., Low, S.-K., Krischek, B., Auburger, G., Simon, M., Krex, D., Arlier, Z., Nayak, N., et al. (2010) · Nature Genetics · doi:10.1038/ng.563 · Cited by 307
“Because our study consisted of multiple independently ascertained cohorts that were genotyped separately, we performed a stringent analysis to control for these biases by inferring genetic ancestries of subjects 25 , 26 .”
Yak whole-genome resequencing reveals domestication signatures and prehistoric population expansions
Qiu, Q., Wang, L., Wang, K., Yang, Y., Ma, T., Wang, Z., Zhang, X., Ni, Z., Hou, F., Long, R., et al. (2015) · Nature Communications · doi:10.1038/ncomms10283 · Cited by 304
Animal domestication in the era of ancient genomics
Frantz, L. A. F., Bradley, D. G., Larson, G., & Orlando, L. (2020) · Nature Reviews Genetics · doi:10.1038/s41576-020-0225-0 · Cited by 282
Common variations in BARD1 influence susceptibility to high-risk neuroblastoma
Capasso, M., Devoto, M., Hou, C., Asgharzadeh, S., Glessner, J. T., Attiyeh, E. F., Mosse, Y. P., Kim, C., Diskin, S. J., Cole, K. A., et al. (2009) · Nature Genetics · doi:10.1038/ng.374 · Cited by 305
“Association analyses were also done after correction for substructure based on principal components analysis implemented in EIGENSTRAT as previously describe”
MethodNon-Parametric Detection of the Number of Signals: Hypothesis Testing and Random Matrix Theory
Kritchman, S., & Nadler, B. (2009) · IEEE Transactions on Signal Processing · doi:10.1109/tsp.2009.2022897 · Cited by 306
“Before proceeding, we mention that a similar, if not identical problem, also appears in other scientific fields, such as chemometrics, econometrics, population genetics, and classical statistics [23], [21], [31], [13], [27].”
The Milieu Intérieur Consortium, Patin, E., Hasan, M., Bergstedt, J., Rouilly, V., Libri, V., Urrutia, A., Alanio, C., Scepanovic, P., Hammer, C., et al. (2018) · Nature Immunology · doi:10.1038/s41590-018-0049-7 · Cited by 296
Fast Principal Component Analysis of Large-Scale Genome-Wide Data
(2014) · doi:10.1371/journal.pone.0093766 · Cited by 305
Motamayor, J. C., Mockaitis, K., Schmutz, J., Haiminen, N., III, D. L., Cornejo, O., Findley, S. D., Zheng, P., Utro, F., Royaert, S., et al. (2013) · Genome Biology · doi:10.1186/gb-2013-14-6-r53 · Cited by 291
“Population structure and hidden relatedness that are unaccounted for can lead to the identification of spurious signals of association between predictors (that is, SNPs) and response variables (phenotype of interest) [112,113].”
BackgroundPCA-Correlated SNPs for Structure Identification in Worldwide Human Populations
Paschou, P., Ziv, E., Burchard, E. G., Choudhry, S., Rodriguez-Cintron, W., Mahoney, M. W., & Drineas, P. (2007) · PLoS Genetics · doi:10.1371/journal.pgen.0030160 · Cited by 302
“Recent studies have demonstrated that PCA is a fast, easy-to-implement method with great power for analysis of the very large datasets that are increasingly becoming available [13,19,20,22].”
BackgroundMethodInfluentialReconstructing Austronesian population history in Island Southeast Asia
Lipson, M., Loh, P.-R., Patterson, N., Moorjani, P., Ko, Y.-C., Stoneking, M., Berger, B., & Reich, D. (2014) · Nature Communications · doi:10.1038/ncomms5689 · Cited by 296
“onto principal components using EIGENSOFT (42) and deleting samples at least 5 standard deviations away from the population mean on any of the first three PCs.”
MethodInfluentialSelf-citationAncient west Eurasian ancestry in southern and eastern Africa
Pickrell, J. K., Patterson, N., Loh, P.-R., Lipson, M., Berger, B., Stoneking, M., Pakendorf, B., & Reich, D. (2014) · Proceedings of the National Academy of Sciences · doi:10.1073/pnas.1313787111 · Cited by 300
“l l l l l l l l l l l l l l l l l l l l l l l l l l l l l l l l l l l ll l l l l l l l l l l l -0.05 0.00 0.05 -0.15 0.05 !Xuun PC1 PC2 Figure 1 : Outliers in southern African data. We ran smartpca [Patterson et al., 2006] on the southern African samples, and visually examined the PCA plots for individuals that appear…”
BackgroundInfluentialSelf-citationRNA sequencing reveals the complex regulatory network in the maize kernel
Fu, J., Cheng, Y., Linghu, J., Yang, X., Kang, L., Zhang, Z., Zhang, J., He, C., Du, X., Peng, Z., et al. (2013) · Nature Communications · doi:10.1038/ncomms3832 · Cited by 305
Genome-culture coevolution promotes rapid divergence of killer whale ecotypes
Foote, A. D., Vijay, N., Ávila-Arcos, M. C., Baird, R. W., Durban, J. W., Fumagalli, M., Gibbs, R. A., Hanson, M. B., Korneliussen, T. S., Martin, M. D., et al. (2016) · Nature Communications · doi:10.1038/ncomms11693 · Cited by 290
Ancient Ethiopian genome reveals extensive Eurasian admixture in Eastern Africa
Llorente, M. G., Jones, E. R., Eriksson, A., Siska, V., Arthur, K. W., Arthur, J. W., Curtis, M. C., Stock, J. T., Coltorti, M., Pieruccini, P., et al. (2015) · Science · doi:10.1126/science.aad2879 · Cited by 295
Wang, Q., Liu, W., Liti, G., Wang, S., & Bai, F. (2012) · Molecular Ecology · doi:10.1111/j.1365-294x.2012.05732.x · Cited by 272
“The strong population structure of S. cerevisiae and the demarcation of the basal Chinese lineages were also recognized by PCA (Patterson et al. 2006; Price et al. 2006).”
BackgroundMethodInfluentialThe genetics of monarch butterfly migration and warning colouration
Zhan, S., Zhang, W., Niitepõld, K., Hsu, J., Haeger, J. F., Zalucki, M. P., Altizer, S., de Roode, J. C., Reppert, S. M., & Kronforst, M. R. (2014) · Nature · doi:10.1038/nature13812 · Cited by 292
Nelson, M. R., Bryc, K., King, K. S., Indap, A., Boyko, A. R., Novembre, J., Briley, L. P., Maruyama, Y., Waterworth, D. M., Waeber, G., et al. (2008) · The American Journal of Human Genetics · doi:10.1016/j.ajhg.2008.08.005 · Cited by 293
Admixture into and within sub-Saharan Africa
Busby, G. B., Band, G., Si Le, Q., Jallow, M., Bougama, E., Mangano, V. D., Amenga-Etego, L. N., Enimil, A., Apinjoh, T., Ndila, C. M., et al. (2016) · eLife · doi:10.7554/elife.15266 · Cited by 295
“6 Estimating pairwise FST We used smartpca in the EIGENSOFT [Patterson et al., 2006] package to estimate pairwise FST between all populations.”
MethodInfluentialAdaptive evolution of multiple traits through multiple mutations at a single gene
Linnen, C. R., Poh, Y.-P., Peterson, B. K., Barrett, R. D. H., Larson, J. G., Jensen, J. D., & Hoekstra, H. E. (2013) · Science · doi:10.1126/science.1233213 · Cited by 292
Measuring missing heritability: Inferring the contribution of common variants
Golan, D., Lander, E. S., & Rosset, S. (2014) · Proceedings of the National Academy of Sciences · doi:10.1073/pnas.1419064111 · Cited by 288
“(22), which shows that the resulting distribution of correlation matrices is equivalent to the distribution obtained from a larger number of SNPs in linkage disequilibrium.”
Background863 genomes reveal the origin and domestication of chicken
Wang, M.-S., Thakur, M., Peng, M.-S., Jiang, Y., Frantz, L. A. F., Li, M., Zhang, J.-J., Wang, S., Peters, J., Otecko, N. O., et al. (2020) · Cell Research · doi:10.1038/s41422-020-0349-y · Cited by 286
Multilocus Adaptation Associated with Heat Resistance in Reef-Building Corals
Bay, R. A., & Palumbi, S. R. (2014) · Current Biology · doi:10.1016/j.cub.2014.10.044 · Cited by 286
Genetic origins of the Minoans and Mycenaeans
Lazaridis, I., Mittnik, A., Patterson, N., Mallick, S., Rohland, N., Pfrengle, S., Furtwängler, A., Peltzer, A., Posth, C., Vasilakis, A., et al. (2017) · Nature · doi:10.1038/nature23310 · Cited by 281
Self-citationCell Atlas of The Human Fovea and Peripheral Retina
Yan, W., Peng, Y.-R., van Zyl, T., Regev, A., Shekhar, K., Juric, D., & Sanes, J. R. (2020) · Scientific Reports · doi:10.1038/s41598-020-66092-9 · Cited by 283
Randomized Algorithms for Matrices and Data
Mahoney, M. W. (2011) · Foundations and Trends® in Machine Learning · doi:10.1561/2200000035 · Cited by 232
Chasman, D. I., Giulianini, F., MacFadyen, J., Barratt, B. J., Nyberg, F., & Ridker, P. M. (2012) · Circulation: Cardiovascular Genetics · doi:10.1161/circgenetics.111.961144 · Cited by 285
Palaeogenomics of Upper Palaeolithic to Neolithic European hunter-gatherers
Posth, C., Yu, H., Ghalichi, A., Rougier, H., Crevecoeur, I., Huang, Y., Ringbauer, H., Rohrlach, A. B., Nägele, K., Villalba-Mouco, V., et al. (2023) · Nature · doi:10.1038/s41586-023-05726-0 · Cited by 279
Predictive metabolomic profiling of microbial communities using amplicon or metagenomic sequences
Mallick, H., Franzosa, E. A., Mclver, L. J., Banerjee, S., Sirota-Madi, A., Kostic, A. D., Clish, C. B., Vlamakis, H., Xavier, R. J., & Huttenhower, C. (2019) · Nature Communications · doi:10.1038/s41467-019-10927-1 · Cited by 280
A Genomewide Admixture Map for Latino Populations
Price, A. L., Patterson, N., Yu, F., Cox, D. R., Waliszewska, A., McDonald, G. J., Tandon, A., Schirmer, C., Neubauer, J., Bedoya, G., et al. (2007) · The American Journal of Human Genetics · doi:10.1086/518313 · Cited by 282
Self-citationGenomic variation in tomato, from wild ancestors to contemporary breeding accessions
Blanca, J., Montero-Pau, J., Sauvage, C., Bauchet, G., Illa, E., Díez, M. J., Francis, D., Causse, M., van der Knaap, E., & Cañizares, J. (2015) · BMC Genomics · doi:10.1186/s12864-015-1444-1 · Cited by 273
“0 package [34,35].”
HLA Has Strongest Association with IgA Nephropathy in Genome-Wide Analysis
Feehally, J., Farrall, M., Boland, A., Gale, D. P., Gut, I., Heath, S., Kumar, A., Peden, J. F., Maxwell, P. H., Morris, D. L., et al. (2010) · Journal of the American Society of Nephrology · doi:10.1681/asn.2010010076 · Cited by 281
Population genomics of post-glacial western Eurasia
Allentoft, M. E., Sikora, M., Refoyo-Martínez, A., Irving-Pease, E. K., Fischer, A., Barrie, W., Ingason, A., Stenderup, J., Sjögren, K.-G., Pearson, A., et al. (2024) · Nature · doi:10.1038/s41586-023-06865-0 · Cited by 208
Huyghe, J. R., Jackson, A. U., Fogarty, M. P., Buchkovich, M. L., Stančáková, A., Stringham, H. M., Sim, X., Yang, L., Fuchsberger, C., Cederberg, H., et al. (2013) · Nature Genetics · doi:10.1038/ng.2507 · Cited by 282
The impact of short tandem repeat variation on gene expression
Fotsing, S. F., Margoliash, J., Wang, C., Saini, S., Yanicky, R., Shleizer-Burko, S., Goren, A., & Gymrek, M. (2019) · Nature Genetics · doi:10.1038/s41588-019-0521-9 · Cited by 273
Ancient genomes link early farmers from Atapuerca in Spain to modern-day Basques
Günther, T., Valdiosera, C., Malmström, H., Ureña, I., Rodriguez-Varela, R., Sverrisdóttir, Ó. O., Daskalaki, E. A., Skoglund, P., Naidoo, T., Svensson, E. M., et al. (2015) · Proceedings of the National Academy of Sciences · doi:10.1073/pnas.1509851112 · Cited by 278
“PCAs of ancient individuals and modern European populations from the Human Origins dataset were conducted using EIGENSOFT (47).”
MethodKehdy, F. S. G., Gouveia, M. H., Machado, M., Magalhães, W. C. S., Horimoto, A. R., Horta, B. L., Moreira, R. G., Leal, T. P., Scliar, M. O., Soares-Souza, G. B., et al. (2015) · Proceedings of the National Academy of Sciences · doi:10.1073/pnas.1504447112 · Cited by 274
“PCA and ADMIXTURE analyses were performed with integrated datasets comprising the three cohort-specific EPIGEN working datasets and the public datasets populations described in SI Appendix, section 5.”
BackgroundInfluentialGagnaire, P., Broquet, T., Aurelle, D., Viard, F., Souissi, A., Bonhomme, F., Arnaud‐Haond, S., & Bierne, N. (2015) · Evolutionary Applications · doi:10.1111/eva.12288 · Cited by 270
“The shift to using selected and hitchhiker loci will probably open this can of worms, irrespective to their utility to assess connectivity in the marine realm.”
BackgroundMethodSpraggs, C. F., Budde, L. R., Briley, L. P., Bing, N., Cox, C. J., King, K. S., Whittaker, J. C., Mooser, V. E., Preston, A. J., Stein, S. H., et al. (2011) · Journal of Clinical Oncology · doi:10.1200/jco.2010.31.3197 · Cited by 275
Ancestral Origins and Genetic History of Tibetan Highlanders
Lu, D., Lou, H., Yuan, K., Wang, X., Wang, Y., Zhang, C., Lu, Y., Yang, X., Deng, L., Zhou, Y., et al. (2016) · The American Journal of Human Genetics · doi:10.1016/j.ajhg.2016.07.002 · Cited by 271
“0.(20) To investigate fine-scale popula-”
Ancient European dog genomes reveal continuity since the Early Neolithic
Botigué, L. R., Song, S., Scheu, A., Gopalan, S., Pendleton, A. L., Oetjens, M., Taravella, A. M., Seregély, T., Zeeb-Lanz, A., Arbogast, R.-M., et al. (2017) · Nature Communications · doi:10.1038/ncomms16082 · Cited by 256
Population genetic inference from genomic sequence variation
Pool, J. E., Hellmann, I., Jensen, J. D., & Nielsen, R. (2010) · Genome Research · doi:10.1101/gr.079509.108 · Cited by 268
Inferring genetic ancestry: Opportunities, challenges, and implications
Royal, C. D., Novembre, J., Fullerton, S. M., Goldstein, D. B., Long, J. C., Bamshad, M. J., & Clark, A. G. (2010) · The American Journal of Human Genetics · doi:10.1016/j.ajhg.2010.03.011 · Cited by 271
Evaluation of the lasso and the elastic net in genome-wide association studies
Waldmann, P., Mészáros, G., Gredler, B., Fuerst, C., & Sölkner, J. (2013) · Frontiers in Genetics · doi:10.3389/fgene.2013.00270 · Cited by 264
“…is based on principal component analysis (PCA) where a certain number of important eigenvectors are calculated from a similarity matrix (estimated either based on the pedigree or the SNPs) between the individuals, and are used as covariates in the SNP regression model (Patterson et al., 2006).”
MethodGenomic Insights into the Ancestry and Demographic History of South America
Homburger, J. R., Moreno-Estrada, A., Gignoux, C. R., Nelson, D., Sanchez, E., Ortiz-Tello, P., Pons-Estel, B. A., Acevedo-Vasquez, E., Miranda, P., Langefeld, C. D., et al. (2015) · PLOS Genetics · doi:10.1371/journal.pgen.1005602 · Cited by 267
“Principal Components Analysis (PCA) was performed on the combined dataset using the EIGENSOFT method implemented in the Plink software package [45,46].”
MethodExtreme Polygenicity of Complex Traits Is Explained by Negative Selection
O'Connor, L. J., Schoech, A. P., Hormozdiari, F., Gazal, S., Patterson, N., & Price, A. L. (2019) · The American Journal of Human Genetics · doi:10.1016/j.ajhg.2019.07.003 · Cited by 268
“The first row reports the effective number of independent SNPs.(32)Me is close to this value whenmarginal effect sizes approximately follow a normal distribution, which does not imply that every SNP is causal.”
BackgroundSelf-citationGenebank genomics bridges the gap between the conservation of crop diversity and plant breeding
Mascher, M., Schreiber, M., Scholz, U., Graner, A., Reif, J. C., & Stein, N. (2019) · Nature Genetics · doi:10.1038/s41588-019-0443-6 · Cited by 261
Muglia, P., Tozzi, F., Galwey, N. W., Francks, C., Upmanyu, R., Kong, X. Q., Antoniades, A., Domenici, E., Perry, J., Rothen, S., et al. (2010) · Molecular Psychiatry · doi:10.1038/mp.2008.131 · Cited by 265
Zhao, G., Lian, Q., Zhang, Z., Fu, Q., He, Y., Ma, S., Ruggieri, V., Monforte, A. J., Wang, P., Julca, I., et al. (2019) · Nature Genetics · doi:10.1038/s41588-019-0522-8 · Cited by 255
Meta-analysis of shared genetic architecture across ten pediatric autoimmune diseases
Li, Y. R., Li, J., Zhao, S. D., Bradfield, J. P., Mentch, F. D., Maggadottir, S. M., Hou, C., Abrams, D. J., Chang, D., Gao, F., et al. (2015) · Nature Medicine · doi:10.1038/nm.3933 · Cited by 265
“The first ten principal components calculated using EIGENSOFT 128 were added as covariates for all data sets except CASP, where no population stratification was observed.”
Reconstructing the genetic history of late Neanderthals
Hajdinjak, M., Fu, Q., Hübner, A., Petr, M., Mafessoni, F., Grote, S., Skoglund, P., Narasimham, V., Rougier, H., Crevecoeur, I., et al. (2018) · Nature · doi:10.1038/nature26151 · Cited by 263
Self-citationDetecting spatial genetic signatures of local adaptation in heterogeneous landscapes
Forester, B. R., Jones, M. R., Joost, S., Landguth, E. L., & Lasky, J. R. (2016) · Molecular Ecology · doi:10.1111/mec.13476 · Cited by 258
“While principal components analysis, a common ordination technique, has been used to detect population structure in genetic data for nearly 50 years (Cavalli-Sforza 1966), only recently has it been used to correct for population structure in genomewide association studies (akin to GEA, Price et al. 2006; Patterson et…”
MethodForensic genetic analysis of bio-geographical ancestry
Phillips, C. (2015) · Forensic Science International: Genetics · doi:10.1016/j.fsigen.2015.05.012 · Cited by 257
“The combined PCs define a sample’s eigenvector [83,84].”
Atzmon, G., Hao, L., Pe'er, I., Velez, C., Pearlman, A., Palamara, P. F., Morrow, B., Friedman, E., Oddoux, C., Burns, E., et al. (2010) · The American Journal of Human Genetics · doi:10.1016/j.ajhg.2010.04.015 · Cited by 260
“In addition, analysis of variance (ANOVA) was applied to each subgroup’s Eigenvalue PCA average to test whether paired populations were different.(24)”
MethodKayser, M., Liu, F., Janssens, A. C. J. W., Rivadeneira, F., Lao, O., van Duijn, K., Vermeulen, M., Arp, P., Jhamai, M. M., van IJcken, W. F. J., et al. (2008) · The American Journal of Human Genetics · doi:10.1016/j.ajhg.2007.10.003 · Cited by 260
Chao, S., Dubcovsky, J., Dvorak, J., Luo, M.-C., Baenziger, S. P., Matnyazov, R., Clark, D. R., Talbert, L. E., Anderson, J. A., Dreisigacker, S., et al. (2010) · BMC Genomics · doi:10.1186/1471-2164-11-727 · Cited by 243
“Population structure was also analyzed using the principal component analysis (PCA) implemented in the software EIGENSTRAT [48].”
MethodThe genome evolution and domestication of tropical fruit mango
Wang, P., Luo, Y., Huang, J., Gao, S., Zhu, G., Dang, Z., Gai, J., Yang, M., Zhu, M., Zhang, H., et al. (2020) · Genome Biology · doi:10.1186/s13059-020-01959-8 · Cited by 250
Genome-wide Association Study Implicates a Chromosome 12 Risk Locus for Late-Onset Alzheimer Disease
Beecham, G. W., Martin, E. R., Li, Y.-J., Slifer, M. A., Gilbert, J. R., Haines, J. L., & Pericak-Vance, M. A. (2009) · The American Journal of Human Genetics · doi:10.1016/j.ajhg.2008.12.008 · Cited by 260
“EigenStrat is a principle-components-analysis program that utilizes eigenvalues to investigate substructure and to potentially correct for it.(21) A set of 20,000 SNPs across the genome was used.”
MethodVariants in the fetal genome near FLT1 are associated with risk of preeclampsia
The FINNPEC Consortium, McGinnis, R., The GOPEC Consortium, Steinthorsdottir, V., Williams, N. O., Thorleifsson, G., Shooter, S., Hjartardottir, S., Bumpstead, S., Stefansdottir, L., et al. (2017) · Nature Genetics · doi:10.1038/ng.3895 · Cited by 250
Qi, X., Cui, C., Peng, Y., Zhang, X., Yang, Z., Zhong, H., Zhang, H., Xiang, K., Cao, X., Wang, Y., et al. (2013) · Molecular Biology and Evolution · doi:10.1093/molbev/mst093 · Cited by 196
“We examined the genetic structure among Tibetan and other Asian populations with the genome-wide autosomal SNP, Y-chromosomal and mtDNA haplogroup frequency data by using PCA (Patterson et al. 2006).”
InfluentialThe Exposome: Molecules to Populations
Niedzwiecki, M. M., Walker, D. I., Vermeulen, R., Chadeau-Hyam, M., Jones, D. P., & Miller, G. W. (2019) · Annual Review of Pharmacology and Toxicology · doi:10.1146/annurev-pharmtox-010818-021315 · Cited by 248
Ancient Rome: A genetic crossroads of Europe and the Mediterranean
Antonio, M. L., Gao, Z., Moots, H. M., Lucci, M., Candilio, F., Sawyer, S., Oberreiter, V., Calderon, D., Devitofranceschi, K., Aikens, R. C., et al. (2019) · Science · doi:10.1126/science.aay6826 · Cited by 257
Günther, T., Malmström, H., Svensson, E. M., Omrak, A., Sánchez-Quinto, F., Kılınç, G. M., Krzewińska, M., Eriksson, G., Fraser, M., Edlund, H., et al. (2018) · PLOS Biology · doi:10.1371/journal.pbio.2003703 · Cited by 252
“PCA was conducted on 42 present-day west Eurasian populations from the Human Origins data set [18,39] using smartpca [77] with numoutlieriter: 0 and lsqproject: YES options.”
Three geographically separate domestications of Asian rice
Civáň, P., Craig, H., Cox, C. J., & Brown, T. A. (2015) · Nature Plants · doi:10.1038/nplants.2015.164 · Cited by 249
Uganda Genome Resource Enables Insights into Population History and Genomic Discovery in Africa
Gurdasani, D., Carstensen, T., Fatumo, S., Chen, G., Franklin, C. S., Prado-Martinez, J., Bouman, H., Abascal, F., Haber, M., Tachmazidou, I., et al. (2019) · Cell · doi:10.1016/j.cell.2019.10.004 · Cited by 255
Collins, C., & Didelot, X. (2018) · PLOS Computational Biology · doi:10.1371/journal.pcbi.1005958 · Cited by 256
“PCA is the “gold 225 standard” method used in human GWAS [30,50] and DAPC has been proposed as a 226 potential improvement on PCA [34].”
MethodOverview of Statistical Methods for Genome-Wide Association Studies (GWAS)
Hayes, B. (2013) · Methods in Molecular Biology · doi:10.1007/978-1-62703-447-0_6 · Cited by 240
Metadata
- Authors
- Patterson, N., Price, A. L., & Reich, D.
- Affiliations
- Broad Institute (US)
- Corresponding author
- Patterson, Nick
- Venue
- PLoS Genetics
- Publisher
- Public Library of Science (PLoS)
- Published
- 2006
- Volume
- 2
- Issue
- 12
- Pages
- e190
- ISSN
- 1553-7390 (ISSN-L)
- 1553-7404
- PMC
- PMC1713260
- OpenAlex
- W2108169091
- Cited by
- 5,280
- References
- 49
- Citations by year
- 2026: 303 · 2025: 380 · 2024: 430 · 2023: 361 · 2022: 393 · 2021: 405 · 2020: 352 · 2019: 324 · 2018: 313 · 2017: 298 · 2016: 270 · 2015: 250 · 2014: 248 · 2013: 227 · 2012: 212
- FWCI
- 35.78
- Type
- journal article
- Language
- en
- Open access
- gold
- doi.org
- Locations
- PLoS Genetics (publishedVersion, cc-by)
- Europe PMC (PubMed Central) (publishedVersion, cc-by)
- PubMed Central (publishedVersion, cc-by)
- PubMed (publishedVersion)
- Digital Access to Scholarship at Harvard (DASH) (Harvard University) (submittedVersion, cc-by)
- RePEc: Research Papers in Economics (submittedVersion)
- DOAJ (DOAJ: Directory of Open Access Journals) (submittedVersion)
- Funders
- Wellcome Trust
- National Human Genome Research Institute (R01HG006399)
- Topics
- Life Sciences › Biochemistry, Genetics and Molecular Biology › Genetics › Genetic diversity and population structure
- Life Sciences › Biochemistry, Genetics and Molecular Biology › Genetics › Forensic and Genetic Research
- Life Sciences › Biochemistry, Genetics and Molecular Biology › Genetics › Genetic Associations and Epidemiology
- Keywords
- population structure, principal component analysis, significance tests, genetic differentiation, phase transitions, sample size determination, FST, genetic data, eigenvalue analysis
- MeSH terms
- Computer Simulation, Genetic Markers, Genetics, Medical, Genetics, Population, Humans, Models, Genetic, Genetic Variation, Models, Statistical, Principal Component Analysis
About these checks
Registry, retraction, Cites and statistics results are computed, not judged, with one exception: a printed reference that no index lists is read once by a model before it counts as a citation error. Claims are extracted by a model and kept only when their quote appears verbatim in the text; each cited source is then checked, with a model’s help, for whether it says what the claim relies on. Those verdicts can be wrong — read the claim’s quote and the cited source before relying on one.
Statistics and arithmetic are recomputed, not judged.
Confidence bands are shown only for fields calibrated on our annotated test set. None is calibrated yet, so no band is shown.
What counts as a claim ›How we measure confidence ›How we check this ›
Are you an author, or do you see a problem with this page? Request a review
Data sources
Bibliographic data: Semantic Scholar, OpenAlex, Crossref.
Contains information from the Semantic Scholar Academic Graph Datasets, made available under the ODC Attribution License (ODC-BY 1.0).
Semantic Scholar’s data is described in: Kinney, R., et al. (2023). The Semantic Scholar Open Data Platform. arXiv:2301.10140.
