

Population Structure and Eigenanalysis
Open accessThe DOI matches its Crossref record; 48 of the 49 references it cites were found in a registry or an index.
Abstract
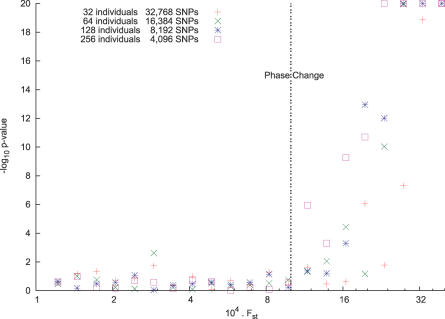
Current methods for inferring population structure from genetic data do not provide formal significance tests for population differentiation. We discuss an approach to studying population structure (principal components analysis) that was first applied to genetic data by Cavalli-Sforza and colleagues. We place the method on a solid statistical footing, using results from modern statistics to develop formal significance tests. We also uncover a general "phase change" phenomenon about the ability to detect structure in genetic data, which emerges from the statistical theory we use, and has an important implication for the ability to discover structure in genetic data: for a fixed but large dataset size, divergence between two populations (as measured, for example, by a statistic like FST) below a threshold is essentially undetectable, but a little above threshold, detection will be easy. This means that we can predict the dataset size needed to detect structure.
Overview
The claims and statistics of this paper haven’t been checked yet.
Free: it reads the open-access text and checks the first 5 claims that cite a source we can check. Create a free account to check every claim.
Integrity signals
Registry
Cites
Statistics
Figures
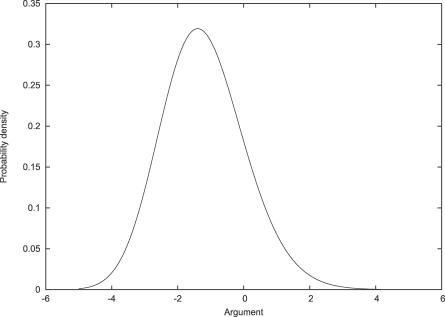
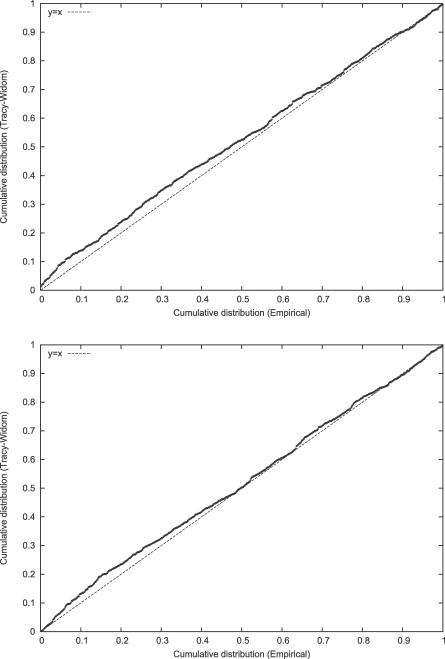
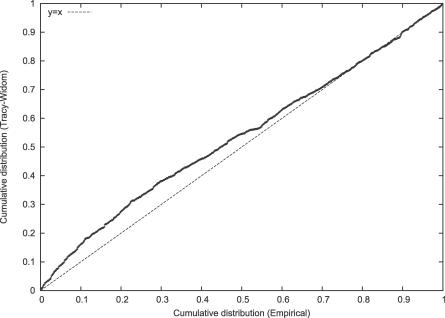
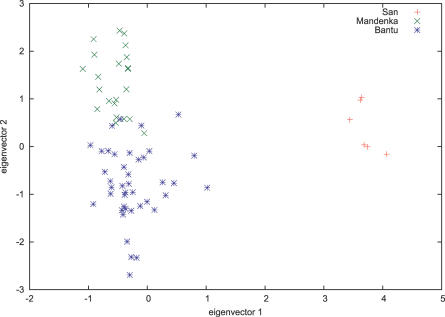
Verification
Claims the paper makes
The claims and statistics of this paper haven’t been checked yet.
Free: it reads the open-access text and checks the first 5 claims that cite a source we can check. Create a free account to check every claim.
Claims other papers make about this one
Each is checked against this paper’s own text: does it say what the citing paper says it does?
The source backs part of the claim, not all of it — or backs it for a different population, condition or comparison.
In the citing paper
“It is notable that PCA clustering is sensitive to the sample size of different ancestries and also to their amount of genetic drift, which exaggerates principal component distances 207,208,211,212 .”
From Ancient DNA analysis (2021) · cites this paper as [207]
Experimental — accuracy not yet measured
Self-check
Percentages, sums and reported differences re-computed from the paper’s own numbers.
The self-check needs the paper’s full text.
Citations
Cites
Inference of Population Structure Using Multilocus Genotype Data
Pritchard, J. K., Stephens, M., & Donnelly, P. (2000) · Genetics · doi:10.1093/genetics/155.2.945 · Cited by 33,908
Principal components analysis corrects for stratification in genome-wide association studies
Price, A. L., Patterson, N. J., Plenge, R. M., Weinblatt, M. E., Shadick, N. A., & Reich, D. (2006) · Nature Genetics · doi:10.1038/ng1847 · Cited by 10,248 · cited 2×
“A parallel paper [14] explores applications to medical genetics.”
BackgroundSelf-citationFalush, D., Stephens, M., & Pritchard, J. K. (2003) · Genetics · doi:10.1093/genetics/164.4.1567 · Cited by 7,959
The International HapMap Project
†The International HapMap Consortium, Genotyping centres: Baylor College of Medicine and ParAllele BioScience, Gibbs, R. A., Belmont, J. W., Hardenbol, P., Willis, T. D., Yu, F., Chinese HapMap Consortium, Yang, H., Ch'ang, L.-Y., et al. (2003) · Nature · doi:10.1038/nature02168 · Cited by 6,057
A haplotype map of the human genome
The International HapMap Consortium (2005) · Nature · doi:10.1038/nature04226 · Cited by 5,858 · cited 1×
“For instance, in the International Haplotype Map project [ 26 ], markers were chosen about 5,000 bases apart (phase 1), or about 1,000 bases apart (phase 2), and so nearby markers will often be in LD. Mathematically this will induce correlation between nearby columns of our matrix M. The effect of this will be that th…”
BackgroundSpielman, R. S., McGinnis, R. E., & Ewens, W. J. (1993) · PubMed · Cited by 3,651
Searle, S. R., & Searle, S. R. (1971) · Cited by 3,229
The History and Geography of Human Genes: Abridged paperback Edition
Cavalli-Sforza, L. L., Menozzi, P., & Piazza, A. (2018) · Princeton University Press eBooks · doi:10.2307/j.ctv301gjp · Cited by 3,175
Genomic Control for Association Studies
Devlin, B., & Roeder, K. (1999) · Biometrics · doi:10.1111/j.0006-341x.1999.00997.x · Cited by 3,162 · cited 3×
“If e([1]) is the principal eigenvector of the matrix X, this means that the sum of squares”
BackgroundOn the distribution of the largest eigenvalue in principal components analysis
Johnstone, I. M. (2001) · The Annals of Statistics · doi:10.1214/aos/1009210544 · Cited by 1,949 · cited 13×
“> λm, then Johnstone [1] shows that with suitable normalization and for large m and n, the largest eigenvalue λ1 is well approximated by the Tracy-Widom distribution.”
BackgroundMethodInfluential
Research works printed but not linked: 39
- Devlin, 1999, Biometrics, 55, 997
- Menozzi, 1978, Science, 201, 786
- Cavalli-Sforza, 2003, Nat Genet, 33, 266
- Shriver, 2005, Human Genomics, 2, 81
- Capelli, 2006, Ann Hum Genet, 70, 207
- Lovell, 2005, Ann Hum Genet, 69, 275
- Stoneking, 1997, Genome Res, 7, 1061
- Pritchard, 2000, Genetics, 155, 945
- Falush, 2003, Genetics, 164, 1567
- Hoggart, 2004, Am J Hum Genet, 74, 965
- Patterson, 2004, Am J Hum Genet, 74, 979
- Montana, 2004, Am J Hum Genet, 75, 771
- Price, 2006, Nat Genet, 38, 904
- Baik, 2005, Ann Probability, 33, 1643
- Baik, 2006, J Multivariate Anal, 97, 1643
- Nicholson, 2002, JRSS(B), 64, 695
- Bowcock, 1994, Nature, 368, 455
- Johnstone, 2001, Ann Stat, 29, 295
- Tracy, 1994, Commun Math Phys, 159, 151
- El Karoui, 2003, On the largest eigenvalue of Wishart matrices with identity covariance when p/n → ∞
- Soshnikov, 2002, J Stat Physics, 108, 1033
- Altshuler, 2005, Nature, 437, 1299
- Macarthur, 1957, Proc Natl Acad Sci U S A, 43, 293
- Pielou, 1975, Ecological diversity
- Ramachandran, 2005, Proc Natl Acad Sci, 102, 15942
- Gibbs, 2004, Nature, 426, 789
- Smith, 2004, Am J Hum Genet, 74, 1001
- Daly, 2001, Nat Genet, 29, 229
- Patil, 2001, Science, 294, 1719
- Allen, 2003, Am J Hum Genet, 72, 671
- Clayton, 2005, Nat Genet, 37, 1243
- Serre, 2004, Genome Res, 14, 1679
- Spielman, 1993, Am J Hum Genet, 52, 506
- Freedman, 2004, Nat Genet, 36, 388
- Marchini, 2004, Nat Genet, 36, 512
- Helgason, 2005, Nat Genet, 37, 90
- Balding, 1995, Genetica, 96, 3
- Rosenberg, 2006, Ann Hum Gen, 70, 841
- Schaffner, 2005, Genome Res, 15, 1576
Cited by
Items 301–400 of 1,074
A genome-wide association study of COPD identifies a susceptibility locus on chromosome 19q13
Cho, M. H., Castaldi, P. J., Wan, E. S., Siedlinski, M., Hersh, C. P., Demeo, D. L., Himes, B. E., Sylvia, J. S., Klanderman, B. J., Ziniti, J. P., et al. (2012) · Human Molecular Genetics · doi:10.1093/hmg/ddr524 · Cited by 251
“Significant principal components were defined using the Tracy–Widom statistic (67) as previously described (13).”
MethodGenetic variants and risk of lung cancer in never smokers: a genome-wide association study
Li, Y., Sheu, C.-C., Ye, Y., de Andrade, M., Wang, L., Chang, S.-C., Aubry, M. C., Aakre, J. A., Allen, M. S., Chen, F., et al. (2010) · The Lancet Oncology · doi:10.1016/s1470-2045(10)70042-5 · Cited by 246
Origin and evolution of qingke barley in Tibet
Zeng, X., Guo, Y., Xu, Q., Mascher, M., Guo, G., Li, S., Mao, L., Liu, Q., Xia, Z., Zhou, J., et al. (2018) · Nature Communications · doi:10.1038/s41467-018-07920-5 · Cited by 247
van Zyl, T., Yan, W., McAdams, A., Peng, Y.-R., Shekhar, K., Regev, A., Juric, D., & Sanes, J. R. (2020) · Proceedings of the National Academy of Sciences · doi:10.1073/pnas.2001250117 · Cited by 244
“17 The analysis pipeline follows methods described by Peng et al. (2019). (1) For each species, the UMI count matrix was normalized by the total number of UMI counts for each cell and multiplied by a scale factor, the median UMI counts of the group to correct library size differences.”
MethodThe genetic history of admixture across inner Eurasia
Jeong, C., Balanovsky, O., Lukianova, E., Kahbatkyzy, N., Flegontov, P., Zaporozhchenko, V., Immel, A., Wang, C.-C., Ixan, O., Khussainova, E., et al. (2019) · Nature Ecology & Evolution · doi:10.1038/s41559-019-0878-2 · Cited by 200
“0.1 package 62 .”
InfluentialSelf-citationAdmixture facilitates genetic adaptations to high altitude in Tibet
Jeong, C., Alkorta-Aranburu, G., Basnyat, B., Neupane, M., Witonsky, D. B., Pritchard, J. K., Beall, C. M., & Di Rienzo, A. (2014) · Nature Communications · doi:10.1038/ncomms4281 · Cited by 234
Accounting for Population Stratification in DNA Methylation Studies
Barfield, R. T., Almli, L. M., Kilaru, V., Smith, A. K., Mercer, K. B., Duncan, R., Klengel, T., Mehta, D., Binder, E. B., Epstein, M. P., et al. (2014) · Genetic Epidemiology · doi:10.1002/gepi.21789 · Cited by 251
“To adjust for population stratification, we considered two sets of PCs: the set that were significant according to a Tracey-Widom test [Patterson et al., 2006] (PCGWAS_TW) and the top 10 PCs of M (PCGWAS).”
MethodA Review of Single-Cell RNA-Seq Annotation, Integration, and Cell–Cell Communication
Cheng, C., Chen, W., Jin, H., & Chen, X. (2023) · Cells · doi:10.3390/cells12151970 · Cited by 224
“An example of this approach is scLCA [34], which combines the Tracy–Widom test [125–127] based on random matrix theory to determine the number of significant eigenvalues, and the silhouette score to rank the results of spectral clustering.”
MethodAnalysis and application of European genetic substructure using 300 K SNP information
Tian, C., Plenge, R. M., Ransom, M., Lee, A., Villoslada, P., Selmi, C., Klareskog, L., Pulver, A. E., Qi, L., Gregersen, P. K., et al. (2008) · PLoS Genetics · doi:10.1371/journal.pgen.0040004 · Cited by 247
“PCA can be sensitive to quality control issues that can give rise to spurious clustering [43].”
BackgroundThe History of African Gene Flow into Southern Europeans, Levantines, and Jews
Moorjani, P., Patterson, N., Hirschhorn, J. N., Keinan, A., Hao, L., Atzmon, G., Burns, E., Ostrer, H., Price, A. L., & Reich, D. (2011) · PLoS Genetics · doi:10.1371/journal.pgen.1001373 · Cited by 244
“We curated these data using Principal Components Analysis (PCA)”
MethodSelf-citationEDWARDS, S., & BENSCH, S. (2009) · Molecular Ecology · doi:10.1111/j.1365-294x.2009.04270.x · Cited by 243
“…the case when the among-population variation of any one nuclear marker is slight (FST among European geographical regions in their study was only 0.004); indeed formulas for estimating the number of markers required to differentiate populations with a given FST are known (Patterson et al. 2006).”
BackgroundInfluentialOrigin and Proliferation of Multiple-Drug Resistance in Bacterial Pathogens
Chang, H.-H., Cohen, T., Grad, Y. H., Hanage, W. P., O'Brien, T. F., & Lipsitch, M. (2015) · Microbiology and Molecular Biology Reviews · doi:10.1128/mmbr.00039-14 · Cited by 243
“Such admixture may be detected by using F-statistics (112, 113), principal-component analysis (114), or clustering methods (115) on genetic data after resistance-determining sites have been removed.”
MethodDe Wit, P., Pespeni, M. H., Ladner, J. T., Barshis, D. J., Seneca, F., Jaris, H., Therkildsen, N. O., Morikawa, M., & Palumbi, S. R. (2012) · Molecular Ecology Resources · doi:10.1111/1755-0998.12003 · Cited by 244
“We also present two quick ways to begin exploring genetic patterns in the data set using a combination of custom scripts and open source software packages: (i) principal component analysis (smartPCA (eigensoft) (Patterson et al. 2006) and (ii) FST outlier analysis [BayeScan (Foll & Gaggiotti 2008)].”
MethodSolving the missing heritability problem
Young, A. I. (2019) · PLOS Genetics · doi:10.1371/journal.pgen.1008222 · Cited by 234
McKown, A. D., Guy, R. D., Klápště, J., Geraldes, A., Friedmann, M., Cronk, Q. C. B., El‐Kassaby, Y. A., Mansfield, S. D., & Douglas, C. J. (2014) · New Phytologist · doi:10.1111/nph.12601 · Cited by 234
“For population genetic structure, we conducted two principal component analyses (PCA) using SNP markers (Patterson et al., 2006) with the ‘prcomp’ function implemented in the ‘base’ R package (R Core Development Team, 2011).”
MethodGenome-wide association study identifies three new melanoma susceptibility loci
Barrett, J. H., Iles, M. M., Harland, M., Taylor, J. C., Aitken, J. F., Andresen, P. A., Akslen, L. A., Armstrong, B. K., Avril, M.-F., Azizi, E., et al. (2011) · Nature Genetics · doi:10.1038/ng.959 · Cited by 240
van Dorp, L., Balding, D., Myers, S., Pagani, L., Tyler-Smith, C., Bekele, E., Tarekegn, A., Thomas, M. G., Bradman, N., & Hellenthal, G. (2015) · PLOS Genetics · doi:10.1371/journal.pgen.1005397 · Cited by 238
“However, similar to using principal-components analysis (PCA) [17, 18], it can be difficult to assess whether clustering patterns among groups are due to recent admixture between distinct historical populations or to ancestry shared prior to the populations diverging [15], making interpretation challenging.”
MethodCommon variants on 8p12 and 1q24.2 confer risk of schizophrenia
Shi, Y., Li, Z., Xu, Q., Wang, T., Li, T., Shen, J., Zhang, F., Chen, J., Zhou, G., Ji, W., et al. (2011) · Nature Genetics · doi:10.1038/ng.980 · Cited by 235
“Population substructure was evaluated using principal-components analysis (PCA) using EIGENSTRAT softwar”
Galanter, J. M., Gignoux, C. R., Oh, S. S., Torgerson, D., Pino-Yanes, M., Thakur, N., Eng, C., Hu, D., Huntsman, S., Farber, H. J., et al. (2017) · eLife · doi:10.7554/elife.20532 · Cited by 237
Li, Y., Zhang, K., Chen, H., Sun, F., Xu, J., Wu, Z., Li, P., Zhang, L., Du, Y., Luan, H., et al. (2013) · Nature Genetics · doi:10.1038/ng.2779 · Cited by 237
The deep population history of northern East Asia from the Late Pleistocene to the Holocene
Mao, X., Zhang, H., Qiao, S., Liu, Y., Chang, F., Xie, P., Zhang, M., Wang, T., Li, M., Cao, P., et al. (2021) · Cell · doi:10.1016/j.cell.2021.04.040 · Cited by 198
UMAP reveals cryptic population structure and phenotype heterogeneity in large genomic cohorts
Diaz-Papkovich, A., Anderson-Trocmé, L., Ben-Eghan, C., & Gravel, S. (2019) · PLOS Genetics · doi:10.1371/journal.pgen.1008432 · Cited by 237
“PCA coordinates are particularly well-suited to correct for population structure in GWAS [4].”
BackgroundInfluentialInferring landscape effects on gene flow: a new model selection framework
SHIRK, A. J., WALLIN, D. O., CUSHMAN, S. A., RICE, C. G., & WARHEIT, K. I. (2010) · Molecular Ecology · doi:10.1111/j.1365-294x.2010.04745.x · Cited by 235
“8 (Goslee & Urban 2007) to generate an n x n pairwise genetic distance matrix (Y) based on the distance between individuals along the first eigenvector (Patterson et al. 2006).”
BackgroundMethodInfluentialShatunov, A., Mok, K., Newhouse, S., Weale, M. E., Smith, B., Vance, C., Johnson, L., Veldink, J. H., van Es, M. A., van den Berg, L. H., et al. (2010) · The Lancet Neurology · doi:10.1016/s1474-4422(10)70197-6 · Cited by 230
Park, S. D. E., Magee, D. A., McGettigan, P. A., Teasdale, M. D., Edwards, C. J., Lohan, A. J., Murphy, A., Braud, M., Donoghue, M. T., Liu, Y., et al. (2015) · Genome Biology · doi:10.1186/s13059-015-0790-2 · Cited by 227
“2 software package [86].”
Gelernter, J., Kranzler, H. R., Sherva, R., Koesterer, R., Almasy, L., Zhao, H., & Farrer, L. A. (2014) · Biological Psychiatry · doi:10.1016/j.biopsych.2013.08.034 · Cited by 230
“Principal components (PC) analysis was conducted in the entire GWAS sample with Eigensoft (13,14) and 145,472 SNPs that were common to the GWAS dataset and HapMap panel (after pruning the GWAS SNPs for linkage disequilibrium [r2] 80”
Xu, H., Yang, W., Perez-Andreu, V., Devidas, M., Fan, Y., Cheng, C., Pei, D., Scheet, P., Burchard, E. G., Eng, C., et al. (2013) · JNCI: Journal of the National Cancer Institute · doi:10.1093/jnci/djt042 · Cited by 227
“In the GWAS, the association between genotypes at each of 709 059 SNPs and ALL susceptibility was tested by comparing the genotype frequency between ALL case subjects and control subjects in the logistic regression model, after adjusting for the top four principal components inferred by EIGENSTRAT (33) to control for…”
MethodHussman, J. P., Chung, R.-H., Griswold, A. J., Jaworski, J. M., Salyakina, D., Ma, D., Konidari, I., Whitehead, P. L., Vance, J. M., Martin, E. R., et al. (2011) · Molecular Autism · doi:10.1186/2040-2392-2-1 · Cited by 231
“Thus, we conducted EIGENSTRAT [38] analysis on all parents from analysed families for evidence of population substructure using the overlapping SNPs genotyped in both the UM/VU and AGRE datasets.”
MethodEisenberg, D. T. A., Kuzawa, C. W., & Hayes, M. G. (2010) · American Journal of Physical Anthropology · doi:10.1002/ajpa.21298 · Cited by 231
Norman, A., Taylor, J., Edwards, J., & Kuchel, H. (2018) · G3 Genes|Genomes|Genetics · doi:10.1534/g3.118.200311 · Cited by 214
Genome-wide analysis of the structure of the South African Coloured Population in the Western Cape
de Wit, E., Delport, W., Rugamika, C. E., Meintjes, A., Möller, M., van Helden, P. D., Seoighe, C., & Hoal, E. G. (2010) · Human Genetics · doi:10.1007/s00439-010-0836-1 · Cited by 209
“We performed principal component analysis using SMARTPCA in the EIGENSOFT package (Patterson et al. 2006; Price et al. 2006) and included all SNP markers shared between the populations analyzed (n = 74,889).”
MethodMangin, B., Siberchicot, A., Nicolas, S., Doligez, A., This, P., & Cierco-Ayrolles, C. (2012) · Heredity · doi:10.1038/hdy.2011.73 · Cited by 221
“…applications, by removing the last column of the output structure matrix, or from dimension-reduction methods, such as principal component analysis (Patterson et al., 2006), non-metric multidimensional scaling (Zhu and Yu, 2009) or sparse factor analysis (Engelhardt and Stephens, 2010) by…”
MethodDefective removal of ribonucleotides from DNA promotes systemic autoimmunity
Günther, C., Kind, B., Reijns, M. A. M., Berndt, N., Martinez-Bueno, M., Wolf, C., Tüngler, V., Chara, O., Lee, Y. A., Hübner, N., et al. (2015) · Journal of Clinical Investigation · doi:10.1172/jci78001 · Cited by 222
Common variants near ABCA1, AFAP1 and GMDS confer risk of primary open-angle glaucoma
Wellcome Trust Case Control Consortium 2, Gharahkhani, P., NEIGHBORHOOD Consortium, Burdon, K. P., Fogarty, R., Sharma, S., Hewitt, A. W., Martin, S., Law, M. H., Cremin, K., et al. (2014) · Nature Genetics · doi:10.1038/ng.3079 · Cited by 227
“Principal components were computed for all participants and reference samples of known northern European ancestry (1000G British, CEU, Finland participants) using smartpca package from EIGENSOFT software 35,36 .”
Paleolithic to Bronze Age Siberians Reveal Connections with First Americans and across Eurasia
Yu, H., Spyrou, M. A., Karapetian, M., Shnaider, S., Radzevičiūtė, R., Nägele, K., Neumann, G. U., Penske, S., Zech, J., Lucas, M., et al. (2020) · Cell · doi:10.1016/j.cell.2020.04.037 · Cited by 216
“1 (Patterson et al., 2006), with modern individuals used for calculation and all the ancient individuals projected on the calculated PCs.”
Schork, A. J., Won, H., Appadurai, V., Nudel, R., Gandal, M., Delaneau, O., Revsbech Christiansen, M., Hougaard, D. M., Bækved-Hansen, M., Bybjerg-Grauholm, J., et al. (2019) · Nature Neuroscience · doi:10.1038/s41593-018-0320-0 · Cited by 223
Assessing the performance of qpAdm: a statistical tool for studying population admixture
Harney, É., Patterson, N., Reich, D., & Wakeley, J. (2021) · Genetics · doi:10.1093/genetics/iyaa045 · Cited by 218
Self-citationA Genome‐wide Association Study of Autism Reveals a Common Novel Risk Locus at 5p14.1
Ma, D., Salyakina, D., Jaworski, J. M., Konidari, I., Whitehead, P. L., Andersen, A. N., Hoffman, J. D., Slifer, S. H., Hedges, D. J., Cukier, H. N., et al. (2009) · Annals of Human Genetics · doi:10.1111/j.1469-1809.2009.00523.x · Cited by 221
“To ensure the most homogeneous groups for association screening and replication, we excluded all families with outliers defined by EIGENSTRAT (Patterson et al., 2006) out of 4 standard deviations of principle components 1 and 2.”
BackgroundMethodInfluentialLocal PCA Shows How the Effect of Population Structure Differs Along the Genome
Li, H., & Ralph, P. (2019) · Genetics · doi:10.1534/genetics.118.301747 · Cited by 221
New World Cattle Show Ancestry from Multiple Independent Domestication Events
McTavish, E. J., Decker, J. E., Schnabel, R. D., Taylor, J. F., & Hillis, D. M. (2013) · Proceedings of the National Academy of Sciences · doi:10.1073/pnas.1303367110 · Cited by 218
“However, Tracy-Widom statistics are estimated based on the assumption of a random sampling of markers, and ascertainment bias in SNPs selected for inclusion on the used SNP chip likely violate this assumption (40, 59).”
MethodInfluentialVariation Revealed by SNP Genotyping and Morphology Provides Insight into the Origin of the Tomato
Blanca, J., Cañizares, J., Cordero, L., Pascual, L., Diez, M. J., & Nuez, F. (2012) · PLoS ONE · doi:10.1371/journal.pone.0048198 · Cited by 209
“A principal component analysis (PCA) was carried out with the smart-PCA [33] software in order to study the genetic relatedness of the accessions (Figure 1, panels A and B).”
MethodAncient Fennoscandian genomes reveal origin and spread of Siberian ancestry in Europe
Lamnidis, T. C., Majander, K., Jeong, C., Salmela, E., Wessman, A., Moiseyev, V., Khartanovich, V., Balanovsky, O., Ongyerth, M., Weihmann, A., et al. (2018) · Nature Communications · doi:10.1038/s41467-018-07483-5 · Cited by 212
Randomized algorithms for matrices and dataPreprint
Mahoney, M. W. (2011) · arXiv (Cornell University) · doi:10.48550/arxiv.1104.5557 · Cited by 260
Miller, W., Hayes, V. M., Ratan, A., Petersen, D. C., Wittekindt, N. E., Miller, J., Walenz, B., Knight, J., Qi, J., Zhao, F., et al. (2011) · Proceedings of the National Academy of Sciences · doi:10.1073/pnas.1102838108 · Cited by 215
“Using larger numbers of SNPs and the EIGENSTRAT method allows for inferences based on smaller population sizes to quantify ancestry within samples.”
MethodSelf-citationTriangulation supports agricultural spread of the Transeurasian languages
Robbeets, M., Bouckaert, R., Conte, M., Savelyev, A., Li, T., An, D.-I., Shinoda, K.-I., Cui, Y., Kawashima, T., Kim, G., et al. (2021) · Nature · doi:10.1038/s41586-021-04108-8 · Cited by 205
Li, Y. R., & Keating, B. J. (2014) · Genome Medicine · doi:10.1186/s13073-014-0091-5 · Cited by 214
Insights into the Genetic History of French Cattle from Dense SNP Data on 47 Worldwide Breeds
Gautier, M., Laloë, D., & Moazami-Goudarzi, K. (2010) · PLoS ONE · doi:10.1371/journal.pone.0013038 · Cited by 209
“Note that, as expected from the extent of LD, multivariate analyses using the SMARTPCA software package [42] which allows to perform correction for”
MethodHuman population history at the crossroads of East and Southeast Asia since 11,000 years ago
Wang, T., Wang, W., Xie, G., Li, Z., Fan, X., Yang, Q., Wu, X., Cao, P., Liu, Y., Yang, R., et al. (2021) · Cell · doi:10.1016/j.cell.2021.05.018 · Cited by 213
Shared Molecular Neuropathology Across Major Psychiatric Disorders Parallels Polygenic Overlap
Gandal, M. J., Haney, J. R., Parikshak, N. N., Leppa, V., Ramaswami, G., Hartl, C., Schork, A. J., Appadurai, V., Buil, A., Werge, T. M., et al. (2019) · Focus · doi:10.1176/appi.focus.17103 · Cited by 195
Paterson, A. D., Lopes-Virella, M. F., Waggott, D., Boright, A. P., Hosseini, S. M., Carter, R. E., Shen, E., Mirea, L., Bharaj, B., Sun, L., et al. (2009) · Arteriosclerosis, Thrombosis, and Vascular Biology · doi:10.1161/atvbaha.109.192971 · Cited by 205
Jeong, C., Ozga, A. T., Witonsky, D. B., Malmström, H., Edlund, H., Hofman, C. A., Hagan, R. W., Jakobsson, M., Lewis, C. M., Aldenderfer, M. S., et al. (2016) · Proceedings of the National Academy of Sciences · doi:10.1073/pnas.1520844113 · Cited by 212
The genetic history of the Southern Arc: A bridge between West Asia and Europe
Lazaridis, I., Alpaslan-Roodenberg, S., Acar, A., Açıkkol, A., Agelarakis, A., Aghikyan, L., Akyüz, U., Andreeva, D., Andrijašević, G., Antonović, D., et al. (2022) · Science · doi:10.1126/science.abm4247 · Cited by 190
Genomic context of NTRK1/2/3 fusion-positive tumours from a large real-world population
Westphalen, C. B., Krebs, M. G., Le Tourneau, C., Sokol, E. S., Maund, S. L., Wilson, T. R., Jin, D. X., Newberg, J. Y., Fabrizio, D., Veronese, L., et al. (2021) · npj Precision Oncology · doi:10.1038/s41698-021-00206-y · Cited by 207
Li, Y.-H., Zhao, S.-C., Ma, J.-X., Li, D., Yan, L., Li, J., Qi, X.-T., Guo, X.-S., Zhang, L., He, W.-M., et al. (2013) · BMC Genomics · doi:10.1186/1471-2164-14-579 · Cited by 207
“We then used a likelihood-based method with the program ADMIXTURE [78] to investigate the ancestry information of soybean genotypes, using PLINK [79] for genotype quality control.”
Quantifying Population Genetic Differentiation from Next-Generation Sequencing Data
Fumagalli, M., Vieira, F. G., Korneliussen, T. S., Linderoth, T., Huerta-Sánchez, E., Albrechtsen, A., & Nielsen, R. (2013) · Genetics · doi:10.1534/genetics.113.154740 · Cited by 207
“We then simulated allele frequencies for two populations using the Balding-Nichols model (Balding and Nichols, 1995) with mean equal to p anc , as in previous studies (Pritchard and Donnelly, 2001; Price et al., 2006).”
BackgroundMethodInfluentialAnalysis of 3800-year-old Yersinia pestis genomes suggests Bronze Age origin for bubonic plague
Spyrou, M. A., Tukhbatova, R. I., Wang, C.-C., Valtueña, A. A., Lankapalli, A. K., Kondrashin, V. V., Tsybin, V. A., Khokhlov, A., Kühnert, D., Herbig, A., et al. (2018) · Nature Communications · doi:10.1038/s41467-018-04550-9 · Cited by 198
Genomic insights into population history and biological adaptation in Oceania
Choin, J., Mendoza-Revilla, J., Arauna, L. R., Cuadros-Espinoza, S., Cassar, O., Larena, M., Ko, A. M.-S., Harmant, C., Laurent, R., Verdu, P., et al. (2021) · Nature · doi:10.1038/s41586-021-03236-5 · Cited by 208
Genome-Wide Association Studies for Growth and Meat Production Traits in Sheep
Zhang, L., Liu, J., Zhao, F., Ren, H., Xu, L., Lu, J., Zhang, S., Zhang, X., Wei, C., Lu, G., et al. (2013) · PLoS ONE · doi:10.1371/journal.pone.0066569 · Cited by 199
“0 EIGENSOFT software [34,35].”
Olalde, I., Schroeder, H., Sandoval-Velasco, M., Vinner, L., Lobón, I., Ramirez, O., Civit, S., García Borja, P., Salazar-García, D. C., Talamo, S., et al. (2015) · Molecular Biology and Evolution · doi:10.1093/molbev/msv181 · Cited by 207
“First, for each ancient sample, individual PCA was computed using EIGENSOFT (Patterson et al. 2006).”
MethodReitzel, A. M., Herrera, S., Layden, M. J., Martindale, M. Q., & Shank, T. M. (2013) · Molecular Ecology · doi:10.1111/mec.12228 · Cited by 200
“The summing of ANOVA statistics of genetic differentiation between pairs of populations along each eigenvector approximates a chi-square distribution with degrees of freedom equal to the number of eigenvectors (Patterson et al. 2006; see EIGENSOFT documentation).”
BackgroundIngle, J. N., Schaid, D. J., Goss, P. E., Liu, M., Mushiroda, T., Chapman, J.-A. W., Kubo, M., Jenkins, G. D., Batzler, A., Shepherd, L., et al. (2010) · Journal of Clinical Oncology · doi:10.1200/jco.2010.28.5064 · Cited by 211
“To avoid biases that might arise from differences in genetic ancestry (ie, population stratification), EIGENSTRAT software was used to determine eigenvalues for the SNP correlation matrix that statistically differed from zero on the basis of Tracy-Widom P values.(16,17) The corresponding eigenvectors were used as cova…”
MethodSCALE method for single-cell ATAC-seq analysis via latent feature extraction
Xiong, L., Xu, K., Tian, K., Shao, Y., Tang, L., Gao, G., Zhang, M., Jiang, T., & Zhang, Q. C. (2019) · Nature Communications · doi:10.1038/s41467-019-12630-7 · Cited by 218
Smoking changes adaptive immunity with persistent effects
Saint-André, V., Charbit, B., Biton, A., Rouilly, V., Possémé, C., Bertrand, A., Rotival, M., Bergstedt, J., Patin, E., Albert, M. L., et al. (2024) · Nature · doi:10.1038/s41586-023-06968-8 · Cited by 187
“To illustrate the homogeneity of the genetic structure of the 1,000 individuals of the Milieu Intérieur cohort, a PCA was performed with EIGENSTRAT 41 on 261,827 independent SNPs and 1,723 individuals, which include the 1,000 Milieu Intérieur donors together with 723 individuals from a selection of 36 populations orig…”
Understanding 6th-century barbarian social organization and migration through paleogenomics
Amorim, C. E. G., Vai, S., Posth, C., Modi, A., Koncz, I., Hakenbeck, S., La Rocca, M. C., Mende, B., Bobo, D., Pohl, W., et al. (2018) · Nature Communications · doi:10.1038/s41467-018-06024-4 · Cited by 201
Salinity Stress in Wheat: Effects, Mechanisms and Management Strategies
F. Seleiman, M., Talha Aslam, M., Ahmed Alhammad, B., Umair Hassan, M., Maqbool, R., Umer Chattha, M., Khan, I., Ireri Gitari, H., S. Uslu, O., Roy, R., et al. (2022) · Phyton · doi:10.32604/phyton.2022.017365 · Cited by 193
Moorjani, P., Sankararaman, S., Fu, Q., Przeworski, M., Patterson, N., & Reich, D. (2016) · Proceedings of the National Academy of Sciences · doi:10.1073/pnas.1514696113 · Cited by 174
Self-citationApplication of t-SNE to human genetic data
Li, W., Cerise, J. E., Yang, Y., & Han, H. (2017) · Journal of Bioinformatics and Computational Biology · doi:10.1142/s0219720017500172 · Cited by 194
Jinam, T. A., Hong, L.-C., Phipps, M. E., Stoneking, M., Ameen, M., Edo, J., HUGO Pan-Asian SNP Consortium, & Saitou, N. (2012) · Molecular Biology and Evolution · doi:10.1093/molbev/mss169 · Cited by 205
“To assess the relatedness between individuals, PCA was conducted using the smartpca program in the EIGENSOFT software package (Patterson et al. 2006) by using the SNP genotype data.”
MethodAncient DNA reveals a multistep spread of the first herders into sub-Saharan Africa
Prendergast, M. E., Lipson, M., Sawchuk, E. A., Olalde, I., Ogola, C. A., Rohland, N., Sirak, K. A., Adamski, N., Bernardos, R., Broomandkhoshbacht, N., et al. (2019) · Science · doi:10.1126/science.aaw6275 · Cited by 202
Self-citationContrasting signatures of genomic divergence during sympatric speciation
Kautt, A. F., Kratochwil, C. F., Nater, A., Machado-Schiaffino, G., Olave, M., Henning, F., Torres-Dowdall, J., Härer, A., Hulsey, C. D., Franchini, P., et al. (2020) · Nature · doi:10.1038/s41586-020-2845-0 · Cited by 198
Persistent Host Markers in Pandemic and H5N1 Influenza Viruses
Finkelstein, D. B., Mukatira, S., Mehta, P. K., Obenauer, J. C., Su, X., Webster, R. G., & Naeve, C. W. (2007) · Journal of Virology · doi:10.1128/jvi.00921-07 · Cited by 206
“sis (39) or other methods (35) will erase the host effect.”
BackgroundPopulation Substructure and Control Selection in Genome-Wide Association Studies
Yu, K., Wang, Z., Li, Q., Wacholder, S., Hunter, D. J., Hoover, R. N., Chanock, S., & Thomas, G. (2008) · PLoS ONE · doi:10.1371/journal.pone.0002551 · Cited by 200
“An approach commonly used to correct for PS is to adjust simultaneously for a fixed number of top- ranked PCs or for those PCs that have significantly large genetic variation according to the Tracy-Widom test [15,16].”
MethodInfluentialHaasl, R. J., & Payseur, B. A. (2011) · Heredity · doi:10.1038/hdy.2010.21 · Cited by 197
“One of particular importance is principal components analysis (PCA), first introduced in this context more than 30 years ago (Menozzi et al ., 1978) and today popularly implemented in the program SMARTPCA (Patterson et al ., 2006).”
Schuenemann, V. J., Peltzer, A., Welte, B., van Pelt, W. P., Molak, M., Wang, C.-C., Furtwängler, A., Urban, C., Reiter, E., Nieselt, K., et al. (2017) · Nature Communications · doi:10.1038/ncomms15694 · Cited by 201
A Paleogenomic Reconstruction of the Deep Population History of the Andes
Nakatsuka, N., Lazaridis, I., Barbieri, C., Skoglund, P., Rohland, N., Mallick, S., Posth, C., Harkins-Kinkaid, K., Ferry, M., Harney, É., et al. (2020) · Cell · doi:10.1016/j.cell.2020.04.015 · Cited by 201
“Principal Components Analysis: We performed principal components analysis (PCA) using the smartpca version 16680 in EIGENSOFT (Patterson et al., 2006).”
Self-citationAdhikari, K., Fuentes-Guajardo, M., Quinto-Sánchez, M., Mendoza-Revilla, J., Camilo Chacón-Duque, J., Acuña-Alonzo, V., Jaramillo, C., Arias, W., Lozano, R. B., Pérez, G. M., et al. (2016) · Nature Communications · doi:10.1038/ncomms11616 · Cited by 200
The impact of population structure on genomic prediction in stratified populations
Guo, Z., Tucker, D. M., Basten, C. J., Gandhi, H., Ersoz, E., Guo, B., Xu, Z., Wang, D., & Gay, G. (2014) · Theoretical and Applied Genetics · doi:10.1007/s00122-013-2255-x · Cited by 193
A whole genome Bayesian scan for adaptive genetic divergence in West African cattle
Gautier, M., Flori, L., Riebler, A., Jaffrézic, F., Laloé, D., Gut, I., Moazami-Goudarzi, K., & Foulley, J.-L. (2009) · BMC Genomics · doi:10.1186/1471-2164-10-550 · Cited by 199
“To go further in the characterization of the population relationships we carried out a principal component analysis (PCA) [13] based on all available SNP information [14].”
MethodInfluentialMarker-Based Estimation of Heritability in Immortal Populations
Kruijer, W., Boer, M. P., Malosetti, M., Flood, P. J., Engel, B., Kooke, R., Keurentjes, J. J. B., & van Eeuwijk, F. A. (2015) · Genetics · doi:10.1534/genetics.114.167916 · Cited by 198
“Let K denote the genetic relatedness or kinship matrix of the genotypes, with elements Ki; j ¼ 1p Xp l¼1 xi;l2 fl xj;l2 fl 4flð12 flÞ (1) (see, e.g., Patterson et al. 2006 and Goddard et al. 2010).”
BackgroundGenome-wide association study to identify genetic determinants of severe asthma
Wan, Y. I., Shrine, N. R. G., Soler Artigas, M., Wain, L. V., Blakey, J. D., Moffatt, M. F., Bush, A., Chung, K. F., Cookson, W. O. C. M., Strachan, D. P., et al. (2012) · Thorax · doi:10.1136/thoraxjnl-2011-201262 · Cited by 195
“Furthermore, the use of principal components analysis (PCA) covariates provides some correction for assay effects.(19) We also excluded any SNPs that showed a significant difference in allele frequencies between the three control groups (p<10 ).”
MethodKiando, S. R., Tucker, N. R., Castro-Vega, L.-J., Katz, A., D’Escamard, V., Tréard, C., Fraher, D., Albuisson, J., Kadian-Dodov, D., Ye, Z., et al. (2016) · PLOS Genetics · doi:10.1371/journal.pgen.1006367 · Cited by 196
Evolutionary and Population Genomics of the Cavity Causing Bacteria Streptococcus mutans
Cornejo, O. E., Lefébure, T., Pavinski Bitar, P. D., Lang, P., Richards, V. P., Eilertson, K., Do, T., Beighton, D., Zeng, L., Ahn, S.-J., et al. (2013) · Molecular Biology and Evolution · doi:10.1093/molbev/mss278 · Cited by 198
“PCA (Patterson et al. 2006) of synonymous SNPs with frequencies greater than 5%, was performed using the R project for Statistical Computing (http://www.”
MethodTyler, L., Lee, S. J., Young, N. D., DeIulio, G. A., Benavente, E., Reagon, M., Sysopha, J., Baldini, R. M., Troìa, A., Hazen, S. P., et al. (2016) · The Plant Genome · doi:10.3835/plantgenome2015.08.0074 · Cited by 192
“The high-quality SNP sets were subjected to principal component analysis (PCA) using SmartPCA in the EIGENSOFT package (Patterson et al., 2006; Price et al., 2006).”
The Demographic Development of the First Farmers in Anatolia
Kılınç, G. M., Omrak, A., Özer, F., Günther, T., Büyükkarakaya, A. M., Bıçakçı, E., Baird, D., Dönertaş, H. M., Ghalichi, A., Yaka, R., et al. (2016) · Current Biology · doi:10.1016/j.cub.2016.07.057 · Cited by 200
“Principal component analysis was conducted using Eigensoft [38], and model-based clustering was performed using ADMIXTURE [21].”
MethodGrey wolf genomic history reveals a dual ancestry of dogs
Bergström, A., Stanton, D. W. G., Taron, U. H., Frantz, L., Sinding, M.-H. S., Ersmark, E., Pfrengle, S., Cassatt-Johnstone, M., Lebrasseur, O., Girdland-Flink, L., et al. (2022) · Nature · doi:10.1038/s41586-022-04824-9 · Cited by 181
Genetic variants at 2q24 are associated with susceptibility to type 2 diabetes
Qi, L., Cornelis, M. C., Kraft, P., Stanya, K. J., Linda Kao, W. H., Pankow, J. S., Dupuis, J., Florez, J. C., Fox, C. S., Paré, G., et al. (2010) · Human Molecular Genetics · doi:10.1093/hmg/ddq156 · Cited by 191
“Population structure was investigated by principal component analysis (26).”
MethodIron Age and Anglo-Saxon genomes from East England reveal British migration history
Schiffels, S., Haak, W., Paajanen, P., Llamas, B., Popescu, E., Loe, L., Clarke, R., Lyons, A., Mortimer, R., Sayer, D., et al. (2016) · Nature Communications · doi:10.1038/ncomms10408 · Cited by 199
A Unified Characterization of Population Structure and Relatedness
Weir, B. S., & Goudet, J. (2017) · Genetics · doi:10.1534/genetics.116.198424 · Cited by 199
“It is customary (e.g. Yang et al., 2011) use allelic dosage to express relatedness estimates or other analyses (Patterson et al., 2006).”
BackgroundNative American gene flow into Polynesia predating Easter Island settlement
Ioannidis, A. G., Blanco-Portillo, J., Sandoval, K., Hagelberg, E., Miquel-Poblete, J. F., Moreno-Mayar, J. V., Rodríguez-Rodríguez, J. E., Quinto-Cortés, C. D., Auckland, K., Parks, T., et al. (2020) · Nature · doi:10.1038/s41586-020-2487-2 · Cited by 196
The influence of family groups on inferences made with the program Structure
ANDERSON, E. C., & DUNHAM, K. K. (2008) · Molecular Ecology Resources · doi:10.1111/j.1755-0998.2008.02355.x · Cited by 197
“Patterson et al. (2006) argue that the power to detect structure will depend not just on the genetic divergence but also on the amount of data (number of samples and markers).”
Backgroundfor The Milieu Intérieur Consortium, Scepanovic, P., Alanio, C., Hammer, C., Hodel, F., Bergstedt, J., Patin, E., Thorball, C. W., Chaturvedi, N., Charbit, B., et al. (2018) · Genome Medicine · doi:10.1186/s13073-018-0568-8 · Cited by 194
The genomic origins of the Bronze Age Tarim Basin mummies
Zhang, F., Ning, C., Scott, A., Fu, Q., Bjørn, R., Li, W., Wei, D., Wang, W., Fan, L., Abuduresule, I., et al. (2021) · Nature · doi:10.1038/s41586-021-04052-7 · Cited by 195
Unraveling ancestry, kinship, and violence in a Late Neolithic mass grave
Schroeder, H., Margaryan, A., Szmyt, M., Theulot, B., Włodarczak, P., Rasmussen, S., Gopalakrishnan, S., Szczepanek, A., Konopka, T., Jensen, T. Z. T., et al. (2019) · Proceedings of the National Academy of Sciences · doi:10.1073/pnas.1820210116 · Cited by 195
“Principal component analysis was performed using smartPCA (39), using around 1,000 modern Eurasian individuals from the HO dataset (3) and 168 previously published ancient genomes (Dataset S6).”
MethodBronze Age population dynamics and the rise of dairy pastoralism on the eastern Eurasian steppe
Jeong, C., Wilkin, S., Amgalantugs, T., Bouwman, A. S., Taylor, W. T. T., Hagan, R. W., Bromage, S., Tsolmon, S., Trachsel, C., Grossmann, J., et al. (2018) · Proceedings of the National Academy of Sciences · doi:10.1073/pnas.1813608115 · Cited by 195
“1 package (63) and by unsupervised genetic clustering using ADMIXTURE v1.”
MethodXu, S., Pugach, I., Stoneking, M., Kayser, M., Jin, L., & The HUGO Pan-Asian SNP Consortium (2012) · Proceedings of the National Academy of Sciences · doi:10.1073/pnas.1118892109 · Cited by 200
A comprehensive genomic history of extinct and living elephants
Palkopoulou, E., Lipson, M., Mallick, S., Nielsen, S., Rohland, N., Baleka, S., Karpinski, E., Ivancevic, A. M., To, T.-H., Kortschak, R. D., et al. (2018) · Proceedings of the National Academy of Sciences · doi:10.1073/pnas.1720554115 · Cited by 201
“ILS is reflected in regions of the genome where taxa that are not most closely related in the species tree cluster together (15, 33, 34).”
BackgroundSelf-citationFan, S., Kelly, D. E., Beltrame, M. H., Hansen, M. E. B., Mallick, S., Ranciaro, A., Hirbo, J., Thompson, S., Beggs, W., Nyambo, T., et al. (2019) · Genome Biology · doi:10.1186/s13059-019-1679-2 · Cited by 194
Self-citationDuforet-Frebourg, N., Luu, K., Laval, G., Bazin, E., & Blum, M. G. B. (2016) · Molecular Biology and Evolution · doi:10.1093/molbev/msv334 · Cited by 186
“PCA is a technique of multivariate analysis used to ascertain population structure (Patterson et al. 2006).”
MethodA dynastic elite in monumental Neolithic society
Cassidy, L. M., Maoldúin, R. Ó., Kador, T., Lynch, A., Jones, C., Woodman, P. C., Murphy, E., Ramsey, G., Dowd, M., Noonan, A., et al. (2020) · Nature · doi:10.1038/s41586-020-2378-6 · Cited by 192
A genome-wide association study on African-ancestry populations for asthma
Mathias, R. A., Grant, A. V., Rafaels, N., Hand, T., Gao, L., Vergara, C., Tsai, Y. J., Yang, M., Campbell, M., Foster, C., et al. (2010) · Journal of Allergy and Clinical Immunology · doi:10.1016/j.jaci.2009.08.031 · Cited by 193
“org/ david_reich_laboratory).(29) Tests for association.”
Metadata
- Authors
- Patterson, N., Price, A. L., & Reich, D.
- Affiliations
- Broad Institute (US)
- Corresponding author
- Patterson, Nick
- Venue
- PLoS Genetics
- Publisher
- Public Library of Science (PLoS)
- Published
- 2006
- Volume
- 2
- Issue
- 12
- Pages
- e190
- ISSN
- 1553-7390 (ISSN-L)
- 1553-7404
- PMC
- PMC1713260
- OpenAlex
- W2108169091
- Cited by
- 5,280
- References
- 49
- Citations by year
- 2026: 303 · 2025: 380 · 2024: 430 · 2023: 361 · 2022: 393 · 2021: 405 · 2020: 352 · 2019: 324 · 2018: 313 · 2017: 298 · 2016: 270 · 2015: 250 · 2014: 248 · 2013: 227 · 2012: 212
- FWCI
- 35.78
- Type
- journal article
- Language
- en
- Open access
- gold
- doi.org
- Locations
- PLoS Genetics (publishedVersion, cc-by)
- Europe PMC (PubMed Central) (publishedVersion, cc-by)
- PubMed Central (publishedVersion, cc-by)
- PubMed (publishedVersion)
- Digital Access to Scholarship at Harvard (DASH) (Harvard University) (submittedVersion, cc-by)
- RePEc: Research Papers in Economics (submittedVersion)
- DOAJ (DOAJ: Directory of Open Access Journals) (submittedVersion)
- Funders
- Wellcome Trust
- National Human Genome Research Institute (R01HG006399)
- Topics
- Life Sciences › Biochemistry, Genetics and Molecular Biology › Genetics › Genetic diversity and population structure
- Life Sciences › Biochemistry, Genetics and Molecular Biology › Genetics › Forensic and Genetic Research
- Life Sciences › Biochemistry, Genetics and Molecular Biology › Genetics › Genetic Associations and Epidemiology
- Keywords
- population structure, principal component analysis, significance tests, genetic differentiation, phase transitions, sample size determination, FST, genetic data, eigenvalue analysis
- MeSH terms
- Computer Simulation, Genetic Markers, Genetics, Medical, Genetics, Population, Humans, Models, Genetic, Genetic Variation, Models, Statistical, Principal Component Analysis
About these checks
Registry, retraction, Cites and statistics results are computed, not judged, with one exception: a printed reference that no index lists is read once by a model before it counts as a citation error. Claims are extracted by a model and kept only when their quote appears verbatim in the text; each cited source is then checked, with a model’s help, for whether it says what the claim relies on. Those verdicts can be wrong — read the claim’s quote and the cited source before relying on one.
Statistics and arithmetic are recomputed, not judged.
Confidence bands are shown only for fields calibrated on our annotated test set. None is calibrated yet, so no band is shown.
What counts as a claim ›How we measure confidence ›How we check this ›
Are you an author, or do you see a problem with this page? Request a review
Data sources
Bibliographic data: Semantic Scholar, OpenAlex, Crossref.
Contains information from the Semantic Scholar Academic Graph Datasets, made available under the ODC Attribution License (ODC-BY 1.0).
Semantic Scholar’s data is described in: Kinney, R., et al. (2023). The Semantic Scholar Open Data Platform. arXiv:2301.10140.
