

The DOI matches its Crossref record; 32 of the 32 references it cites were found in a registry or an index.
Mangiferin Decreases Plasma Free Fatty Acids through Promoting Its Catabolism in Liver by Activation of AMPK
Open accessAbstract
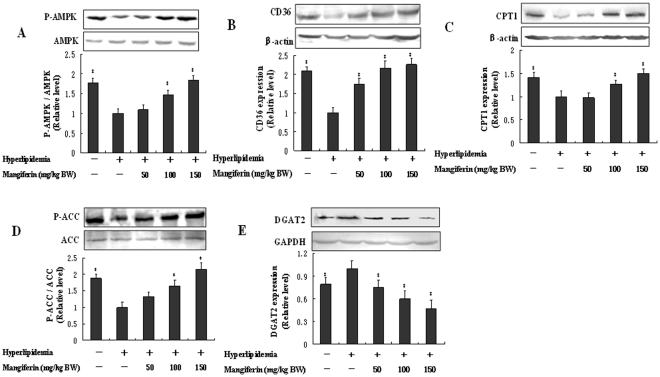
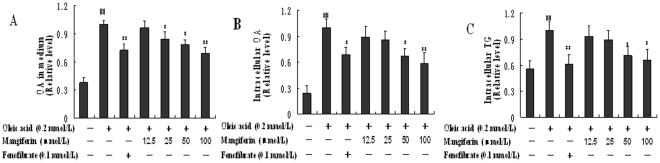
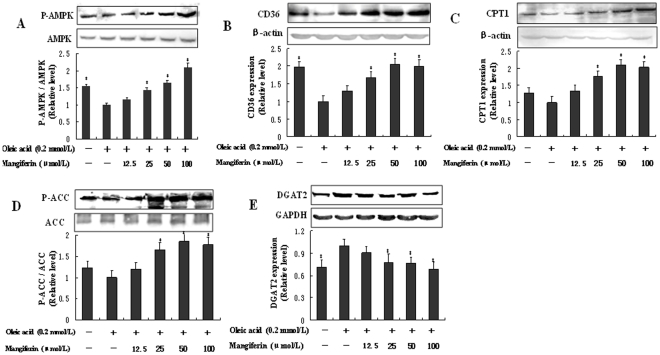
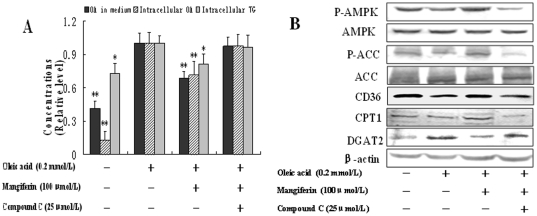
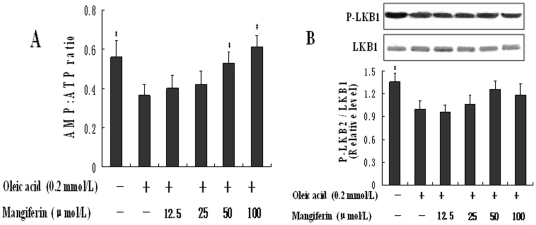
Mangiferin has been shown to have the effect of improving dyslipidemia. Plasma free fatty acids (FFA) are closely associated with blood lipid metabolism as well as many diseases including metabolic syndrome. This study is to investigate whether mangiferin has effects on FFA metabolism in hyperlipidemic rats. Wistar rats were fed a high-fat diet and administered mangiferin simultaneously for 6 weeks. Mangiferin (50, 100, 150 mg/kg BW) decreased dose-dependently FFA and triglycerides (TG) levels in plasma, and their accumulations in liver, but increased the β-hydroxybutyrate levels in both plasma and liver of hyperlipidemic rats. HepG2 cells were treated with oleic acid (OA, 0.2 mmol/L) to simulate the condition of high level of plasma FFA in vitro, and were treated with different concentrations of mangiferin simultaneously for 24 h. We found that mangiferin significantly increased FFA uptake, significantly decreased intracellular FFA and TG accumulations in HepG2 cells. Mangiferin significantly increased AMP-activated protein kinase (AMPK) phosphorylation and its downstream proteins involved in fatty acid translocase (CD36) and carnitine palmitoyltransferase 1 (CPT1), but significantly decreased acyl-CoA: diacylgycerol acyltransferase 2 (DGAT2) expression and acetyl-CoA carboxylase (ACC) activity by increasing its phosphorylation level in both in vivo and in vitro studies. Furthermore, these effects were reversed by Compound C, an AMPK inhibitor in HepG2 cells. For upstream of AMPK, mangiferin increased AMP/ATP ratio, but had no effect on LKB1 phosphorylation. In conclusion, mangiferin decreased plasma FFA levels through promoting FFA uptake and oxidation, inhibiting FFA and TG accumulations by regulating the key enzymes expression in liver through AMPK pathway. Therefore, mangiferin is a possible beneficial natural compound for metabolic syndrome by improving FFA metabolism.
Overview
The claims and statistics of this paper haven’t been checked yet.
Run the check — free, no account needed. It reads the open-access text and checks the sources it cites.
Integrity signals
Registry
Cites
Statistics
Figures
Verification
Claims the paper makes
The claims and statistics of this paper haven’t been checked yet.
Run the check — free, no account needed. It reads the open-access text and checks the sources it cites.
Claims other papers make about this one
Each is checked against this paper’s own text: does it say what the citing paper says it does?
The source backs part of the claim, not all of it — or backs it for a different population, condition or comparison.
In the citing paper
“Similarly, it was also observed in Wistar rats and HepG2 cells that levels of intracellular FFA and TG accumulation was decreased in HepG2 cells.”
From Mangiferin: An effective therapeutic agent against several disorders (Review) (2018) · cites this paper as [86]
Experimental — accuracy not yet measuredThe source backs part of the claim, not all of it — or backs it for a different population, condition or comparison.
In the citing paper
“It was observed that mangiferin upregulates the mRNA levels of peroxisome proliferator-activated receptor-α, fatty acid translocase (CD36) and carnitine palmitoyl transferase 1 (CPT-1) (86).”
From Mangiferin: An effective therapeutic agent against several disorders (Review) (2018) · cites this paper as [86]
Experimental — accuracy not yet measuredThe cited source says what the claim attributes to it.
In the citing paper
“Wistar rats were fed a high-fat diet and administered mangiferin (50, 100, 150 mg/kg) simultaneously for 6 weeks, which confirmed that mangiferin improves FFA metabolism in a dose-dependent manner through promoting FFA uptake and oxidation (86).”
From Mangiferin: An effective therapeutic agent against several disorders (Review) (2018) · cites this paper as [86]
The cited source says what the claim attributes to it.
In the citing paper
“Furthermore, mangiferin promotes AMPK phosphorylation, and upregulates the expression of CD36 and CPT-1 (86).”
From Mangiferin: An effective therapeutic agent against several disorders (Review) (2018) · cites this paper as [86]
The cited source says what the claim attributes to it.
In the citing paper
“Mangiferin increases the AMP/ATP ratio upstream of AMPK, decreases acyl-CoA:diacyl gycerol acyltransferase 2 (DGAT2) expression, decreases acetyl-CoA carboxylase (ACC) activity.”
From Mangiferin: An effective therapeutic agent against several disorders (Review) (2018) · cites this paper as [86]
The cited source says what the claim attributes to it.
In the citing paper
“Furthermore, the AMPK pathway is associated with this therapeutic effect of mangiferin (86).”
From Mangiferin: An effective therapeutic agent against several disorders (Review) (2018) · cites this paper as [86]
Self-check
Percentages, sums and reported differences re-computed from the paper’s own numbers.
The self-check needs the paper’s full text.
Citations
Cites
A RAPID METHOD OF TOTAL LIPID EXTRACTION AND PURIFICATION
Bligh, E. G., & Dyer, W. J. (1959) · Canadian Journal of Biochemistry and Physiology · doi:10.1139/o59-099 · Cited by 54,751
The Mitochondrial Carnitine Palmitoyltransferase System — From Concept to Molecular Analysis
McGarry, J. D., & Brown, N. F. (1997) · European Journal of Biochemistry · doi:10.1111/j.1432-1033.1997.00001.x · Cited by 1,616 · cited 1×
“CPT-1 and ACC are the rate-limiting enzymes for FFA b-oxidation and synthesis, respectively, in liver [22,23].”
BackgroundMechanism of free fatty acid-induced insulin resistance in humans.
Roden, M., Price, T. B., Perseghin, G., Petersen, K. F., Rothman, D. L., Cline, G. W., & Shulman, G. I. (1996) · Journal of Clinical Investigation · doi:10.1172/jci118742 · Cited by 1,539
Postic, C., & Girard, J. R. (2008) · Journal of Clinical Investigation · doi:10.1172/jci34275 · Cited by 1,243
The AMP-activated protein kinase pathway – new players upstream and downstream
Hardie, D. G. (2004) · Journal of Cell Science · doi:10.1242/jcs.01540 · Cited by 1,163
Cases, S., Smith, S. J., Zheng, Y.-W., Myers, H. M., Lear, S. R., Sande, E., Novak, S., Collins, C. C., Welch, C. L., Lusis, A. J., et al. (1998) · Proceedings of the National Academy of Sciences · doi:10.1073/pnas.95.22.13018 · Cited by 1,138
Boden, G. H. (2008) · Endocrinology and Metabolism Clinics of North America · doi:10.1016/j.ecl.2008.06.007 · Cited by 852
Effect of mangiferin on hyperglycemia and atherogenicity in streptozotocin diabetic rats
Muruganandan, S., Srinivasan, K., Gupta, S., Gupta, P. K., & Lal, J. (2005) · Journal of Ethnopharmacology · doi:10.1016/j.jep.2004.12.010 · Cited by 426
Pathways and control of ketone body metabolism: on the fringe of lipid biochemistry
Fukao, T., Lopaschuk, G. D., & Mitchell, G. A. (2004) · Prostaglandins Leukotrienes and Essential Fatty Acids · doi:10.1016/j.plefa.2003.11.001 · Cited by 418
Mechanisms Linking Obesity, Chronic Kidney Disease, and Fatty Liver Disease
Ix, J. H., & Sharma, K. (2010) · Journal of the American Society of Nephrology · doi:10.1681/asn.2009080820 · Cited by 355
Research works printed but not linked: 1
- T Fukao, 2004, Pathways and control of ketone body metabolism: on the fringe of lipid biochemistry., Prostaglandins, leukotrienes, and essential fatty acids, 70, 243, 10.1016/j.plefa.2003.11.001 · DOI
Cited by
Sorted by citations
Treatment of nonalcoholic fatty liver disease: role of AMPK
Smith, B. K., Marcinko, K., Desjardins, E. M., Lally, J., Ford, R. J., & Steinberg, G. R. (2016) · American Journal of Physiology-Endocrinology and Metabolism · doi:10.1152/ajpendo.00225.2016 · Cited by 509
Mangiferin: A natural miracle bioactive compound against lifestyle related disorders
Imran, M., Arshad, M. S., Butt, M. S., Kwon, J.-H., Arshad, M. U., & Sultan, M. T. (2017) · Lipids in Health and Disease · doi:10.1186/s12944-017-0449-y · Cited by 366
AMP-activated protein kinase: maintaining energy homeostasis at the cellular and whole-body levels
Hardie, D. G. (2014) · Annual Review of Nutrition · doi:10.1146/annurev-nutr-071812-161148 · Cited by 281
Regulation of AMP-activated protein kinase by natural and synthetic activators
Hardie, D. G. (2015) · Acta Pharmaceutica Sinica B · doi:10.1016/j.apsb.2015.06.002 · Cited by 180
Mangiferin: A xanthonoid with multipotent anti‐inflammatory potential
Saha, S., Sadhukhan, P., & Sil, P. C. (2016) · BioFactors · doi:10.1002/biof.1292 · Cited by 159
Mangiferin: An effective therapeutic agent against several disorders (Review)
Du, S., Liu, H., Lei, T., Xie, X., Wang, H., He, X., Tong, R., & Wang, Y. (2018) · Molecular Medicine Reports · doi:10.3892/mmr.2018.9529 · Cited by 139
“Furthermore, mangiferin promotes AMPK phosphorylation, and upregulates the expression of CD36 and CPT-1 (86).”
InfluentialGanji, S. H., Kashyap, M. L., & Kamanna, V. S. (2015) · Metabolism · doi:10.1016/j.metabol.2015.05.002 · Cited by 132
Wang, X., Gao, L., Lin, H., Song, J., Wang, J., Yin, Y., Zhao, J., Xu, X., Li, Z., & Li, L. (2018) · European Journal of Pharmacology · doi:10.1016/j.ejphar.2018.02.009 · Cited by 114
Zhang, X., Wu, C., Wu, H., Sheng, L., Su, Y., Zhang, X., Luan, H., Sun, G., Sun, X., Tian, Y., et al. (2013) · PLoS ONE · doi:10.1371/journal.pone.0061922 · Cited by 113
Song, J., Li, J., Hou, F., Wang, X., & Liu, B. (2015) · Metabolism · doi:10.1016/j.metabol.2014.11.008 · Cited by 109
Improving permeability and oral absorption of mangiferin by phospholipid complexation
Ma, H., Chen, H., Sun, L., Tong, L., & Zhang, T. (2014) · Fitoterapia · doi:10.1016/j.fitote.2013.10.016 · Cited by 108
Therapeutic and cosmetic applications of mangiferin: A patent review
Telang, M., Dhulap, S., Mandhare, A., & Hirwani, R. (2013) · Expert Opinion on Therapeutic Patents · doi:10.1517/13543776.2013.836182 · Cited by 103
Li, J., Liu, M., Yu, H., Wang, W., Han, L., Chen, Q., Ruan, J., Wen, S., Zhang, Y., & Wang, T. (2018) · Frontiers in Pharmacology · doi:10.3389/fphar.2018.00201 · Cited by 95
Zhang, Q., Kong, X., Yuan, H., Guan, H., Li, Y., & Niu, Y. (2019) · Journal of Diabetes Research · doi:10.1155/2019/2052675 · Cited by 95
Self-citationGonçalves-de-Albuquerque, C. F., de Moraes, I. M. M., Oliveira, F. M. D. J., Burth, P., Bozza, P. T., Faria, M. V. C., Silva, A. R., & Castro-Faria-Neto, H. C. (2016) · PLoS ONE · doi:10.1371/journal.pone.0153607 · Cited by 96
Seo, M. S., Kim, J. H., Kim, H. J., Chang, K. C., & Park, S. W. (2015) · Toxicology and Applied Pharmacology · doi:10.1016/j.taap.2015.02.020 · Cited by 93
Gómez‐Caravaca, A. M., López-Cobo, A., Verardo, V., Segura‐Carretero, A., & Fernández‐Gutiérrez, A. (2015) · Electrophoresis · doi:10.1002/elps.201500439 · Cited by 89
Dihydromyricetin Protects the Liver via Changes in Lipid Metabolism and Enhanced Ethanol Metabolism
Silva, J., Yu, X., Moradian, R., Folk, C., Spatz, M. H., Kim, P., Bhatti, A. A., Davies, D. L., & Liang, J. (2020) · Alcoholism Clinical and Experimental Research · doi:10.1111/acer.14326 · Cited by 79
Lee, K. M., Yang, S.-J., Kim, Y. D., Choi, Y. D., Nam, J. H., Choi, C. S., Choi, H.-S., & Park, C.-S. (2013) · Diabetes · doi:10.2337/db12-1030 · Cited by 77
Applications and perspectives of nanomaterials in novel vaccine development
Shen, Y., Hao, T., Ou, S., Hu, C., & Chen, L. (2017) · MedChemComm · doi:10.1039/c7md00158d · Cited by 76
Na, L., Zhang, Q., Jiang, S., Du, S., Zhang, W., Li, Y., Sun, C., & Niu, Y. (2015) · Scientific Reports · doi:10.1038/srep10344 · Cited by 74
Self-citationApontes, P., Liu, Z., Su, K., Benard, O., Youn, D. Y., Li, X., Li, W., Mirza, R. H., Bastie, C. C., Jelicks, L. A., et al. (2014) · Diabetes · doi:10.2337/db14-0006 · Cited by 69
Mangiferin modulation of metabolism and metabolic syndrome
Fomenko, E. V., & Chi, Y. (2016) · BioFactors · doi:10.1002/biof.1309 · Cited by 71
Wang, H., Zhu, Y.-Y., Wang, L., Teng, T., Zhou, M., Wang, S.-G., Tian, Y.-Z., Du, L., Yin, X.-X., & Sun, Y. (2017) · Biomedicine & Pharmacotherapy · doi:10.1016/j.biopha.2017.10.022 · Cited by 67
Dual mode action of mangiferin in mouse liver under high fat diet
Lim, J., Liu, Z., Apontes, P., Feng, D., Pessin, J. E., Sauve, A. A., Angeletti, R. H., & Chi, Y. (2014) · PLoS ONE · doi:10.1371/journal.pone.0090137 · Cited by 64
Zhang, Y., Liu, X., Han, L., Gao, X., Liu, E., & Wang, T. (2013) · Food Chemistry · doi:10.1016/j.foodchem.2013.05.121 · Cited by 61
Zou, B., Ge, Z., Zhang, Y., Du, J., Xu, Z., & Li, C. (2014) · Food & Function · doi:10.1039/c3fo60635j · Cited by 59
Živković, J., Kumar, K. A., Rushendran, R., Ilango, K., Fahmy, N. M., El‐Nashar, H. A. S., El‐Shazly, M., Ezzat, S. M., Melgar‐Lalanne, G., Romero‐Montero, A., et al. (2023) · Naunyn-Schmiedeberg s Archives of Pharmacology · doi:10.1007/s00210-023-02682-4 · Cited by 57
Chu, X., He, X., Shi, Z., Li, C., Guo, F., Li, S., Li, Y., Na, L., & Sun, C. (2015) · Molecular Nutrition & Food Research · doi:10.1002/mnfr.201400670 · Cited by 53
Self-citationHan, J., Yi, J., Liang, F., Jiang, B., Xiao, Y., Gao, S., Yang, N., Hu, H., Xie, W.-F., & Chen, W. (2015) · Molecular and Cellular Endocrinology · doi:10.1016/j.mce.2015.02.008 · Cited by 50
Xing, X., Li, D., Chen, D., Zhou, L., Chonan, R., Yamahara, J., Wang, J., & Li, Y. (2014) · Toxicology and Applied Pharmacology · doi:10.1016/j.taap.2014.08.001 · Cited by 46
Self-citationVaccarin ameliorates insulin resistance and steatosis by activating the AMPK signaling pathway
Lei, Y., Gong, L., Tan, F., Liu, Y., Li, S., Shen, H., Zhu, M. P., Cai, W., Xu, F., Hou, B., et al. (2019) · European Journal of Pharmacology · doi:10.1016/j.ejphar.2019.02.029 · Cited by 45
Self-citationDudhia, Z., Louw, J., Muller, C. J. F., Joubert, E., de Beer, D., Kinnear, C. J., & Pheiffer, C. (2013) · Phytomedicine · doi:10.1016/j.phymed.2012.12.002 · Cited by 44
Lipid reducing activity and toxicity profiles of a library of polyphenol derivatives
Urbatzka, R., Freitas, S., Palmeira, A., Almeida, T. O., Moreira, J. P. C., Azevedo, C., Afonso, C., Correia‐da‐Silva, M., Sousa, E., Pinto, M. M. M., et al. (2018) · European Journal of Medicinal Chemistry · doi:10.1016/j.ejmech.2018.03.036 · Cited by 46
Habtemariam, S. (2020) · Biomedicines · doi:10.3390/biomedicines8040090 · Cited by 42
Sekar, V., Mani, S., Malarvizhi, R., Nithya, P., & Vasanthi, H. R. (2019) · Phytomedicine · doi:10.1016/j.phymed.2019.152901 · Cited by 42
Li, M., Wang, J., Wang, F., Strappe, P., Liu, W., Zheng, J., Zhou, Z., & Zhang, Y. (2021) · Food & Function · doi:10.1039/d1fo01226f · Cited by 39
Han, J., Yang, N., Zhang, F., Zhang, C., Liang, F., Xie, W., & Chen, W. (2015) · Journal of Ethnopharmacology · doi:10.1016/j.jep.2015.05.016 · Cited by 39
Ramírez, N. R., Toledo, R. C. L., Moreira, M. E. D. C., Martino, H. S. D., Benjamin, L. D. A., de Queiróz, J. H., Ribeiro, A. Q., & Ribeiro, S. M. R. (2017) · Biomedicine & Pharmacotherapy · doi:10.1016/j.biopha.2017.05.015 · Cited by 39
Zhou, C., Zhou, J., Han, N., Liu, Z., Xiao, B., & Yin, J. (2015) · International Immunopharmacology · doi:10.1016/j.intimp.2015.01.027 · Cited by 37
The multifaceted role of mangiferin in health and diseases: a review
Jangra, A., Arora, M. K., Kisku, A., & Sharma, S. (2020) · Oriental Pharmacy and Experimental Medicine · doi:10.1007/s13596-020-00471-5 · Cited by 38
Seo, M. S., Hong, S.-W., Yeon, S. H., Kim, Y.-M., Um, K. A., Kim, J. H., Kim, H. J., Chang, K. C., & Park, S. W. (2014) · Journal of Ethnopharmacology · doi:10.1016/j.jep.2014.09.031 · Cited by 36
Targeting AMPK Signaling in the Liver: Implications for Obesity and Type 2 Diabetes Mellitus
Liu, Y., Wang, D., & Yang, L. (2022) · Current Drug Targets · doi:10.2174/1389450123666220429082702 · Cited by 35
Xu, X., Chen, Y., Song, J., Hou, F., Ma, X., Liu, B., & Huang, F. (2017) · European Journal of Nutrition · doi:10.1007/s00394-017-1441-z · Cited by 35
Jack, B. U., Malherbe, C. J., Mamushi, M., Muller, C. J. F., Joubert, E., Louw, J., & Pheiffer, C. (2019) · Biomedicine & Pharmacotherapy · doi:10.1016/j.biopha.2019.109439 · Cited by 36
Tian, X., Gao, Y., Xu, Z., Lian, S., Ma, Y., Guo, X., Hu, P., Li, Z., & Huang, C. (2016) · BioFactors · doi:10.1002/biof.1291 · Cited by 34
The evolution of Alzheimer’s disease: From mitochondria to microglia
Yang, F., Liang, Y., Wang, X., Wang, J.-T., Gao, W., Ye, Q.-Y., Li, X., Yu, Y., & Li, H. (2025) · Ageing Research Reviews · doi:10.1016/j.arr.2025.102838 · Cited by 32
Anti-inflammatory Property of AMP-activated Protein Kinase
Noor, H. B., Mou, N. A., Salem, L., Shimul, M. F. A., Biswas, S., Akther, R., Khan, S., Raihan, S., Mohib, M. M., & Sagor, M. A. T. (2019) · Anti-Inflammatory & Anti-Allergy Agents in Medicinal Chemistry · doi:10.2174/1871523018666190830100022 · Cited by 34
Zhou, L., Pan, Y., Chonan, R., Batey, R. G., Rong, X., YAMAHARA, J., Wang, J., & Li, Y. (2015) · Journal of Pharmacology and Experimental Therapeutics · doi:10.1124/jpet.115.229005 · Cited by 32
Self-citationMahali, S. K., Verma, N., & Manna, S. K. (2014) · Journal of Cellular Physiology · doi:10.1002/jcp.24647 · Cited by 30
Zhang, S., Chen, G., Li, N., Dai, M., Chen, C., Wang, P., Tang, H., Hoopes, S. L., Zeldin, D. C., Wang, D. W., et al. (2015) · Obesity · doi:10.1002/oby.21115 · Cited by 30
Ge, Y., Qiu, H., & Zheng, J. (2022) · Food Chemistry X · doi:10.1016/j.fochx.2022.100443 · Cited by 29
Zhou, C., Li, G., Li, Y., Gong, L., Huang, Y., Shi, Z., Du, S., Li, Y., Wang, M., Yin, J., et al. (2014) · Molecular BioSystems · doi:10.1039/c4mb00421c · Cited by 29
Self-citationKim, T., Yu, G., Kim, H., Kim, J., Lim, D., & Park, W. (2023) · Current Issues in Molecular Biology · doi:10.3390/cimb45020086 · Cited by 28
Danthron activates AMP-activated protein kinase and regulates lipid and glucose metabolism in vitro
Zhou, R., Wang, L., Xu, X. Y., Chen, J., Hu, L., Chen, L., & Shen, X. (2013) · Acta Pharmacologica Sinica · doi:10.1038/aps.2013.39 · Cited by 27
Wang, C., Jiang, J., Wu, W., & Kong, W. (2016) · BioMed Research International · doi:10.1155/2016/8753436 · Cited by 28
Мозес, В. Г., Korotkevich, O., Анатольевна, Ю. М., Ивановна, Е. С., Владимировна, Р. Е., Борисовна, М. К., & Евгеньевна, П. Т. (2025) · Matʹ i ditâ v Kuzbasse · doi:10.24412/2686-7338-2025-2-61-64 · Cited by 26
Choline supplementation improves the lipid metabolism of intrauterine-growth-restricted pigs
Li, W., Li, B., Lv, J., Dong, L., Zhang, L., & Wang, T. (2016) · Asian-Australasian Journal of Animal Sciences · doi:10.5713/ajas.15.0810 · Cited by 25
Effects of Benzophenones from Mango Leaves on Lipid Metabolism
Zhang, Y., Chen, Q., Liu, M.-Y., Ruan, J., Yu, H., Li, J., & Wang, T. (2019) · Chemical and Pharmaceutical Bulletin · doi:10.1248/cpb.c18-00905 · Cited by 25
Acevedo, L. M., Raya, A. I., Martínez-Moreno, J. M., Aguilera–Tejero, E., & Rivero, J.-L. L. (2017) · PLOS ONE · doi:10.1371/journal.pone.0173028 · Cited by 24
Salacia reticulata has therapeutic effects on obesity
Shimada, T., Nakayama, Y., Harasawa, Y., Matsui, H., Kobayashi, H., Sai, Y., Miyamoto, K., Tomatsu, S., & Aburada, M. (2014) · Journal of Natural Medicines · doi:10.1007/s11418-014-0845-9 · Cited by 23
Boone-Villa, D., Méndez, A. A., Miranda‐Cervantes, A., & Fernández‐Mejía, C. (2015) · Journal of Medicinal Food · doi:10.1089/jmf.2014.0170 · Cited by 22
Mangifera indica L. Leaf Extract Induces Adiponectin and Regulates Adipogenesis
Sferrazzo, G., Palmeri, R., Vanella, L., Parafati, L., Ronsisvalle, S., Biondi, A., Basile, F., Volti, G. L., & Barbagallo, I. A. (2019) · International Journal of Molecular Sciences · doi:10.3390/ijms20133211 · Cited by 22
Therapeutic Potential of the Natural Product Mangiferin in Metabolic Syndrome
Mirza, R. H., Chi, N., & Chi, Y. (2013) · Journal of Nutritional Therapeutics · doi:10.6000/1929-5634.2013.02.02.2 · Cited by 21
Hou, J., Zheng, D., Fan, K., Yu, B., Xiao, W., Ma, J., Jin, W., Tan, Y., & Wu, J. (2012) · Pharmacology · doi:10.1159/000342128 · Cited by 21
Daming capsule, a hypolipidaemic drug, lowers blood lipids by activating the AMPK signalling pathway
Bian, Y., Li, X., Li, X., Ju, J., Liang, H., Hu, X., Dong, L., Wang, N., Li, J., Zhang, Y., et al. (2019) · Biomedicine & Pharmacotherapy · doi:10.1016/j.biopha.2019.109176 · Cited by 21
Rahman, M. S., & Kim, Y. (2020) · Food and Chemical Toxicology · doi:10.1016/j.fct.2020.111415 · Cited by 22
Mangiferin Accelerates Glycolysis and Enhances Mitochondrial Bioenergetics
Liu, Z., Apontes, P., Fomenko, E., Chi, N., Schuster, V. L., Kurland, I. J., Pessin, J. E., & Chi, Y. (2018) · International Journal of Molecular Sciences · doi:10.3390/ijms19010201 · Cited by 21
Liu, R., He, J., Ji, X., Zheng, W., & Yao, W. (2021) · Animals · doi:10.3390/ani11041166 · Cited by 20
Mangiferin for the Management of Liver Diseases: A Review
Li, L., Dong, Y., Liu, X., & Wang, M. (2023) · Foods · doi:10.3390/foods12132469 · Cited by 21
Guo, F., Zi, T., Liu, L., Feng, R., & Sun, C. (2017) · Food & Function · doi:10.1039/c7fo00081b · Cited by 20
Self-citationMango leaf tea promotes hepatoprotective effects in obese rats
Ramírez, N. M., de Queiróz, J. H., Ribeiro, S. M. R., Toledo, R. C. L., Moreira, M. E. D. C., Mafra, C. L., Benjamin, L. D. A., Coelho, C. D. M., Veloso, M. P., & Martino, H. S. D. (2018) · Journal of Functional Foods · doi:10.1016/j.jff.2018.09.010 · Cited by 20
Nunes, S., Viana, S., Preguiça, I., Alves, A., Fernandes, R., Teodoro, J. S., Matos, P., Figueirinha, A., Salgueiro, L., André, A., et al. (2021) · Nutrients · doi:10.3390/nu13124192 · Cited by 20
Sabater, A. G., Ribot, J., Priego, T., Vazquez, I., Frank, S., Palou, A., & Buchwald‐Werner, S. (2017) · Cellular Physiology and Biochemistry · doi:10.1159/000477606 · Cited by 19
Rodriguez-Gonzalez, J. C., Hernández-Balmaseda, I., Declerck, K., Pérez-Novo, C., Logie, E., Theys, C., Jakubek, P., Quiñones-Maza, O. L., Dantas-Cassali, G., Carlos dos Reis, D., et al. (2021) · Frontiers in Pharmacology · doi:10.3389/fphar.2021.670167 · Cited by 19
Wu, Y., Liu, W., Yang, T., Li, M., Qin, L., Wu, L., & Liu, T. (2020) · Nutrition Research · doi:10.1016/j.nutres.2020.12.017 · Cited by 18
Xiang, G., Guo, S., Xing, N., Du, Q., Qin, J., Gao, H., Zhang, Y., & Wang, S. (2024) · The American Journal of Chinese Medicine · doi:10.1142/s0192415x24500150 · Cited by 18
Jiang, X., Wang, H., Nie, K., Gao, Y., Shen, C., Tang, Y., Wang, Z., Su, H., & Dong, H. (2024) · Chinese Medicine · doi:10.1186/s13020-024-00988-w · Cited by 17
Inhibition Effect of Triglyceride Accumulation by Large Yellow Croaker Roe DHA-PC in HepG2 Cells
Lu, X., Zhong, R., Sun, H., Zheng, B., Chen, L., Miao, S., & Liang, P. (2019) · Marine Drugs · doi:10.3390/md17090485 · Cited by 17
Zhang, Y., Zhao, J., Ren, C., Hu, B., Ding, R., He, Z., & Liang, C. (2023) · International Journal of Molecular Medicine · doi:10.3892/ijmm.2023.5237 · Cited by 16
Zhao, Q., Yang, J., Liu, B., Huang, F., & Li, Y. (2019) · Molecular Medicine Reports · doi:10.3892/mmr.2019.10127 · Cited by 15
Self-citationHassan, Y. R., El‐Shiekh, R. A., El-Hefnawy, H. M., Mohamed, O. G., Abu‐Elfotuh, K., Hamdan, A. M., Darwish, A., Gowifel, A. M. H., Tripathi, A., & Michael, C. G. (2024) · Journal of Ethnopharmacology · doi:10.1016/j.jep.2024.117747 · Cited by 10
MANGIFERIN: A POTENTIAL NATURAL MOLECULE FOR MANAGEMENT OF METABOLIC SYNDROME
Mujawdiya, P. K., & Kapur, S. (2015) · International Journal of Pharmacy and Pharmaceutical Sciences · Cited by 10
He, J., Wang, H., & Vijg, J. (2019) · Chemistry & Biodiversity · doi:10.1002/cbdv.201900176 · Cited by 10
Mangiferin and EGCG Compounds Fight Against Hyperlipidemia by Promoting FFA Oxidation via AMPK/PPARα
Xu, Y., Zhang, J., Zhang, T., Zi, M., & Zhang, Q. (2024) · PPAR Research · doi:10.1155/ppar/7178801 · Cited by 8
Lipid‐lowering effect of mangiferin through the inhibition of pancreatic lipase activity
Wang, S., Qin, Y., Liu, Y., Jiao, R., Lin, R., Yuan, Z., & He, Z. (2025) · Journal of the Science of Food and Agriculture · doi:10.1002/jsfa.14301 · Cited by 9
Qian, Q., Tang, M., Li, X., Cao, Q., & Zhu, Z. (2020) · Tropical Journal of Pharmaceutical Research · doi:10.4314/tjpr.v19i1.14 · Cited by 8
Kumar, G. R., Chandrasekaran, S., & Jagannadham, M. V. (2012) · Bangladesh Journal of Pharmacology · doi:10.3329/bjp.v8i1.13034 · Cited by 8
Shataer, D., Chen, S., Wu, Y., Fen, L., Liu, H., Lu, J., Li, B., Zhao, L., Qiu, S., & Jumai, A. (2025) · Foods · doi:10.3390/foods14132344 · Cited by 7
Insulin Resistance as a Target of Some Plant-Derived Phytocompounds
Eddouks, M., Bidi, A., Bouhali, B. E., & Zeggwagh, N. A. (2014) · Studies in natural products chemistry · doi:10.1016/b978-0-444-63430-6.00011-4 · Cited by 7
Nair, S. V., Zhang, J., & Wang, Y. (2014) · Experimental Biology and Medicine · doi:10.1177/1535370214525313 · Cited by 6
Kumar, S. N., Darvin, S. S., Toppo, E., Porchezhiyan, V., Pandikumar, P., Paulraj, M. G., & Savarimuthu Ignacimuthu, S. J. (2022) · Biocatalysis and Agricultural Biotechnology · doi:10.1016/j.bcab.2022.102312 · Cited by 6
Alsaedi, A. Q., Nader, M. A., El-Kashef, D. H., & Abdelmageed, M. E. (2025) · Frontiers in Pharmacology · doi:10.3389/fphar.2025.1572758 · Cited by 5
Pohan, A., Purwaningsih, E. H., & Dwijayanti, A. (2013) · eJournal Kedokteran Indonesia · doi:10.23886/ejki.1.1595.45-52 · Cited by 5
Soria-Lara, D. M., Gaitán-Vélez, B. V., Jiménez‐Islas, H., & Miranda‐López, R. (2019) · REVISTA BIOMÉDICA · doi:10.32776/revbiomed.v30i2.638 · Cited by 5
Wang, Y., Lei, X., Zhao, D., Xue, A., Zhu, Z., Jin, M., Zhang, N., & Li, X. (2025) · Journal of Ethnopharmacology · doi:10.1016/j.jep.2025.119699 · Cited by 4
Park, M. H., Kim, H.-J., & Han, J.-S. (2022) · Nutrition Research · doi:10.1016/j.nutres.2022.10.001 · Cited by 4
Rafailovska, E., Tuševski, O., Simic, S. G., Панов, С., Станоева, Ј. П., Dinevska-Ќovkarovska, S., & Miova, B. (2024) · Macedonian Journal of Chemistry and Chemical Engineering · doi:10.20450/mjcce.2024.2849 · Cited by 3
Jayaraj, R., Sasidharan, N., Tom, B., & Muhammad, A. K. (2016) · Journal of Biologically Active Products from Nature · doi:10.1080/22311866.2016.1227721 · Cited by 3
Anti-obesity effect of Solidago virgaaurea extract in high-fat diet-fed SD rat
Kim, C. H., Lee, J.-M., Jang, Y. S., Jeon, J.-H., Lim, S. S., Kim, S. C., Kim, J., Park, J., & Lee, J. (2016) · Animal Cells and Systems · doi:10.1080/19768354.2016.1254110 · Cited by 3
Metadata
- Authors
- Niu, Y., Li, S., Na, L., Feng, R., Liu, L., Li, Y., & Sun, C.
- Affiliations
- Harbin Medical University (CN)
- Corresponding author
- Sun, Changhao
- Venue
- PLoS ONE
- Publisher
- Public Library of Science (PLoS)
- Published
- 2012-01-23
- Volume
- 7
- Issue
- 1
- Pages
- e30782
- ISSN
- 1932-6203 (ISSN-L)
- PMC
- PMC3264633
- OpenAlex
- W2073563008
- Cited by
- 116
- References
- 32
- Citations by year
- 2026: 2 · 2025: 8 · 2024: 8 · 2023: 4 · 2022: 5 · 2021: 4 · 2020: 7 · 2019: 13 · 2018: 7 · 2017: 9 · 2016: 10 · 2015: 14 · 2014: 12 · 2013: 10 · 2012: 3
- FWCI
- 30.39
- Type
- journal article
- Language
- en
- Open access
- gold
- doi.org
- Locations
- PLoS ONE (publishedVersion, cc-by)
- Europe PMC (PubMed Central) (publishedVersion, cc-by)
- PubMed Central (publishedVersion, cc-by)
- PubMed (publishedVersion)
- DOAJ (DOAJ: Directory of Open Access Journals) (submittedVersion, cc-by-sa)
- Figshare (submittedVersion, cc-by)
- Funders
- National Natural Science Foundation of China (2010AA023002)
- National High-tech Research and Development Program (2010AA023002)
- National Institute on Alcohol Abuse and Alcoholism (K99AA023002, R00AA023002)
- Topics
- Health Sciences › Medicine › Complementary and alternative medicine › Mangiferin and Mango Extracts
- Health Sciences › Medicine › Endocrinology, Diabetes and Metabolism › Natural Antidiabetic Agents Studies
- Life Sciences › Biochemistry, Genetics and Molecular Biology › Molecular Biology › Metabolism, Diabetes, and Cancer
- Keywords
- mangiferin, plasma free fatty acids, AMPK, fatty acid degradation, hyperlipidemia, hepatic triglyceride accumulation, fatty acid uptake, fatty acid oxidation, CD36, carnitine palmitoyltransferase 1, DGAT2, acetyl-CoA carboxylase, metabolic syndrome, high-fat diet, oleic acid, beta-hydroxybutyrate
- MeSH terms
- Adenylate Kinase, Animals, Enzyme Activation, Fatty Acids, Nonesterified, Female, Humans, Hyperlipidemias, Hypoglycemic Agents, Liver, Male, Metabolism, Triglycerides, Down-Regulation, Rats, Wistar, Xanthones, Lipid Metabolism, Rats, Hep G2 Cells
About these checks
Registry, retraction, Cites and statistics results are computed, not judged, with one exception: a printed reference that no index lists is read once by a model before it counts as a citation error. Claims are extracted by a model and kept only when their quote appears verbatim in the text; each cited source is then checked, with a model’s help, for whether it says what the claim relies on. Those verdicts can be wrong — read the claim’s quote and the cited source before relying on one.
Statistics and arithmetic are recomputed, not judged.
Confidence bands are shown only for fields calibrated on our annotated test set. None is calibrated yet, so no band is shown.
What counts as a claim ›How we measure confidence ›How we check this ›
Are you an author, or do you see a problem with this page? Request a review
