

The DOI matches its Crossref record; 57 of the 57 references it cites were found in a registry or an index; 39 of the 55 sources its claims cite were checked for support.
MicroRNA 146a (miR-146a) Is Over-Expressed during Prion Disease and Modulates the Innate Immune Response and the Microglial Activation State
Open accessAbstract
Increasing evidence supports the involvement of microRNAs (miRNAs) in inflammatory and immune processes in prion neuropathogenesis. MiRNAs are small, non-coding RNA molecules which are emerging as key regulators of numerous cellular processes. We established miR-146a over-expression in prion-infected mouse brain tissues concurrent with the onset of prion deposition and appearance of activated microglia. Expression profiling of a variety of central nervous system derived cell-lines revealed that miR-146a is preferentially expressed in cells of microglial lineage. Prominent up-regulation of miR-146a was evident in the microglial cell lines BV-2 following TLR2 or TLR4 activation and also EOC 13.31 via TLR2 that reached a maximum 24-48 hours post-stimulation, concomitant with the return to basal levels of transcription of induced cytokines. Gain- and loss-of-function studies with miR-146a revealed a substantial deregulation of inflammatory response pathways in response to TLR2 stimulation. Significant transcriptional alterations in response to miR-146a perturbation included downstream mediators of the pro-inflammatory transcription factor, nuclear factor-kappa B (NF-κB) and the JAK-STAT signaling pathway. Microarray analysis also predicts a role for miR-146a regulation of morphological changes in microglial activation states as well as phagocytic mediators of the oxidative burst such as CYBA and NOS3. Based on our results, we propose a role for miR-146a as a potent modulator of microglial function by regulating the activation state during prion induced neurodegeneration.
Overview
AI snapshot
Written from the paper’s full text.
TL;DR
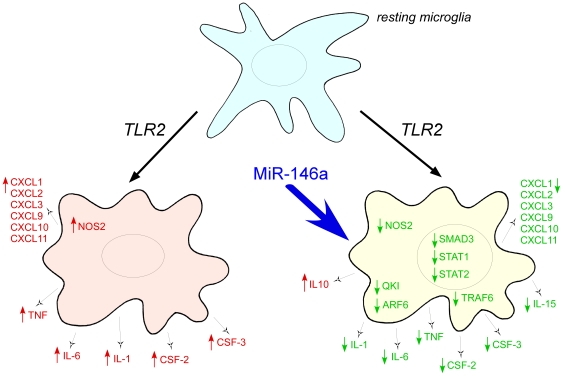
miR-146a is over-expressed in prion-infected mouse brain and is enriched in microglial cells, where TLR2/TLR4 stimulation induces it with delayed kinetics relative to cytokines. Gain- and loss-of-function studies indicate miR-146a broadly dampens microglial inflammatory and phagocytosis-related gene programs, suggesting it modulates the microglial activation state during prion disease.
Key findings
- miR-146a was consistently up-regulated in prion-infected mouse brain: 3.3-fold in 22A whole brain, 8.3-fold in RML hippocampus, 16.3-fold in RML cerebellum, and 10.0-fold in BSE cerebellum versus age-matched mock-infected controls (Table 1).
- miR-146a expression was enriched in microglial cell lines and induced by TLR2 or TLR4 agonists in BV-2 and EOC 13.31 cells, reaching a maximum at 24–48 hours and remaining elevated at 72 hours, while IL-6, CSF2/GM-CSF, and TNF transcripts peaked before 24 hours and returned to basal levels by 48 hours.
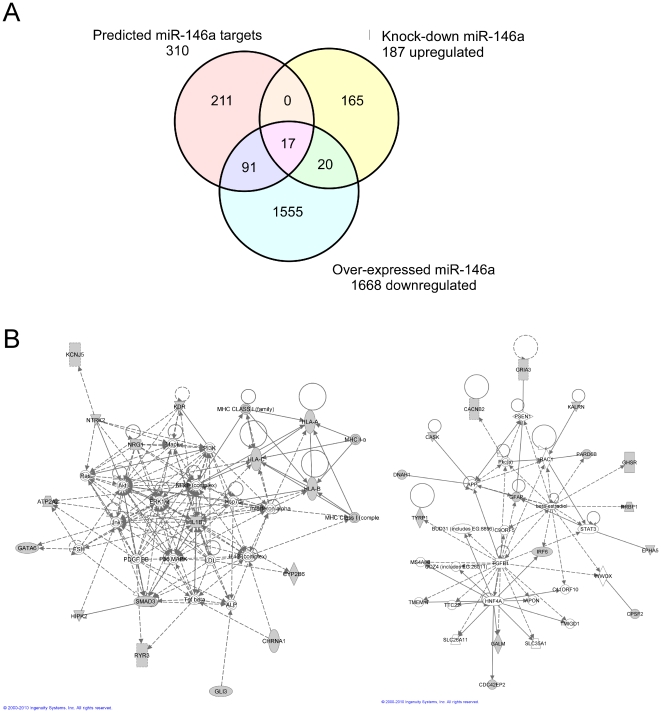
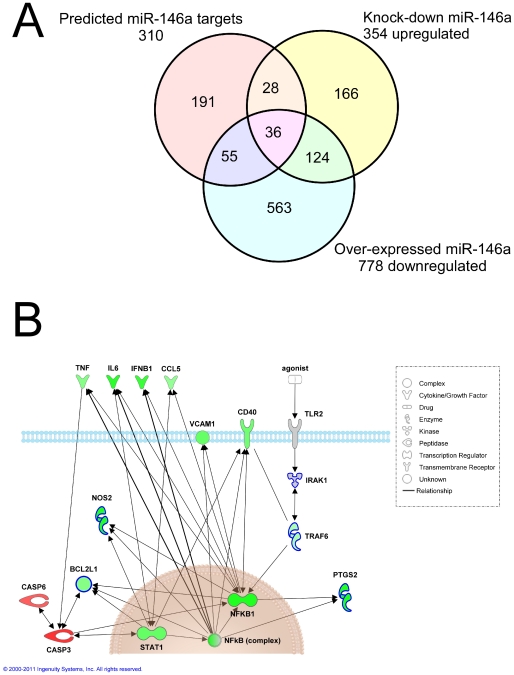
- In EOC 13.31 cells, miR-146a over-expression altered 1,668 genes by ≥1.5-fold (FDR ≤2%) in resting cells; after TLR2/LPS stimulation, 977 genes were deregulated at 24 hours (778 down, 199 up), with enrichment in NF-κB, JNK, and MAPK signaling.
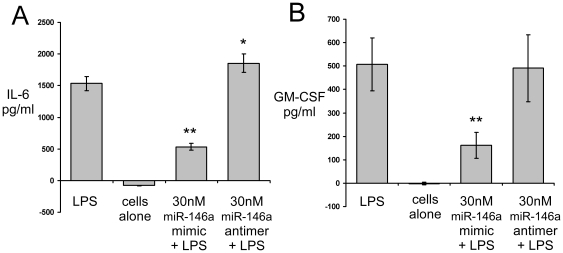
- miR-146a over-expression significantly reduced IL-6 and GM-CSF protein after TLR2 stimulation (p<0.001), while anti-miR knock-down caused a small but significant increase in IL-6; predicted targets included IL1B, SMAD3, NOS2, QK1, and BCL2L1.
Methods
- CD-1 mice were inoculated intracerebrally with 20 µl of 1% RML scrapie brain homogenate; at clinical symptoms, 6 mice per group were sacrificed and hippocampus or cerebellar tissue was used for RNA extraction, with equal numbers of age-matched mock-infected controls.
- Murine microglial cell lines BV-2 and EOC 13.31 were stimulated with LPS or heat-killed Listeria monocytogenes (HKLM), with anti-TLR2 neutralization; miR-146a was over-expressed with 30 nM pre-miR mimic or knocked down with 50 nM anti-miR, followed by qRT-PCR (normalized to U6, 2−ΔΔCt) and IL-6/GM-CSF ELISA.
- miRNA profiling used an in-house microarray; mRNA expression used Agilent whole mouse genome 4×44K arrays, analyzed with Feature Extraction, SAM (p=0.01), Ingenuity Pathway Analysis, and TargetScan 5.1; raw data deposited under GEO accession GSE17759.
Limitations
- The paper states that in situ hybridization for miR-146a was inconclusive, that miR-146a may be expressed at low levels in other cell types including neurons, and that attempts to induce miR-146a in cultured microglia with recombinant PrP or PrP106–126 were unsuccessful.
- The paper states that in vitro culture lacks multiple cell types, cell-to-cell signaling, normal cellular functions, and the long disease time course, and that TLR4 transcripts were below detection in their prion model; it also notes that MyD88 knockout data imply TLR2 signaling may not be essential in disease and that their model may not fully mimic disease processes.
- Evident from the text: findings rely on mouse models and microglial cell lines rather than human tissue; direct miR-146a targets are largely inferred from microarray intersections and bioinformatic prediction, with limited validation; some in vivo miR-146a increases were not statistically significant (22A p=9.4×10⁻²; BSE p=7.6×10⁻²), and IL-10 up-regulation was not detectable by ELISA.
Model-written summary. Check it against the paper before relying on it.
Integrity signals
Registry
Cites
Statistics
Figures
Verification
Claims the paper makes
79 Own result · 18 Own interpretation · 16 Partly supported · 9 Supported · 8 No full text of the sources · 7 Own method · 4 Couldn’t confirm · 2 Not checked yet · 2 No basis given · 1 Supported so far · 1 Not supported · accuracy not yet measured
The cited sources support only part of this claim — read each source’s verdict below.
In the paper
“Subsequently, transgenic mice with defective TLR4 signaling causing them to be hyporesponsive to lipopolysaccharide (LPS) were found to exhibit a significantly accelerated rate of prion disease development in comparison to their wild-type counterparts [11].”
§ MicroRNA 146a (miR-146a) Is Over-Expressed during Prion Disease and Modulates the Innate Immune Response and the Microglial Activation State > Introduction
What the sources say
- Partly supportedcites [11] DS Spinner, 2008, Accelerated prion disease pathogenesis in toll-like receptor 4 signaling-mutant mice., J Virol sourceExperimental — accuracy not yet measured
The paper reports significantly shorter scrapie incubation periods in TLR4-signaling-mutant C3H/HeJ mice than in strain-matched wild-type controls, and describes the mutant strain as hyporesponsive to LPS (opening passage; Discussion). It does not describe the mice in this comparison as transgenic, so that designation is unsupported. (LLM, conf=0.88)
plaindirect- Asserted: passes — The authors put it forward as true.
- Checkable: passes — It can be checked against evidence.
- Load-bearing: passes — The paper’s conclusions depend on it.
- Based: passes — The paper gives a reason why it holds.
- Partly supported
Every source the paper cites for this claim was checked and supports it.
In the paper
“We established miR-146a over-expression in prion-infected mouse brain tissues concurrent with the onset of prion deposition and appearance of activated microglia.”
- Also stated in: § Introduction · plain
“Recent work in our own laboratory showed the amount of miR-146a in the brain of scrapie infected mice to be significantly increased in comparison with age-matched control mice [17].”
- Also stated in: § MiR-146a is consistently up-regulated in the brain's of prion infected mice · boosted
“Quantitative real time-PCR (qRT-PCR) analysis using TaqMan® miRNA probes, specific for mouse miR-146a, revealed that this increase in expression is consistently found in mice clinically infected with a number of scrapie strains (22A, RML, and BSE) in comparison to age matched, mock-infected mice (Table 1).”
§ MicroRNA 146a (miR-146a) Is Over-Expressed during Prion Disease and Modulates the Innate Immune Response and the Microglial Activation State > Abstract
What the sources say
- Supportedcites [17] R Saba, 2008, A miRNA signature of prion induced neurodegeneration., PLoS One source
Table 1 in the Results reports miR-146a as 2.6-fold up-regulated in CNS tissue of scrapie-infected mice. The Methods specify that expression was compared with age-matched, mock-infected mice. (LLM, conf=0.94)
boostedcorrelational- Asserted: passes — The authors put it forward as true.
- Checkable: passes — It can be checked against evidence.
- Load-bearing: passes — The paper’s conclusions depend on it.
- Based: passes — The paper gives a reason why it holds.
- Also stated in: § Introduction · plain
Every source the paper cites for this claim was checked and supports it.
In the paper
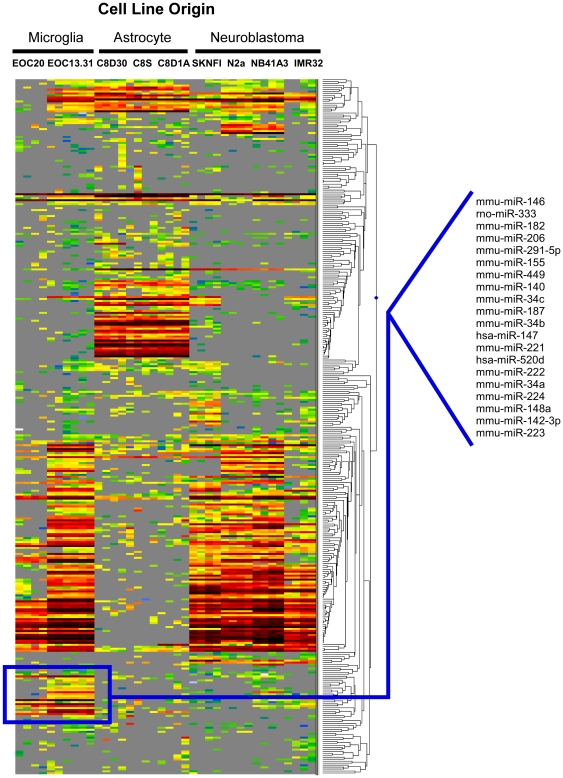
“The microglial cell-line enriched cluster contained 20 miRNAs including miR-146a and a number of other miRNAs reportedly involved in inflammation, such as miR-155, miR-221 [23] and miR-147, a microRNA that is induced upon Toll-like receptor (TLR) stimulation and regulates murine macrophage inflammatory responses [24].”
§ MicroRNA 146a (miR-146a) Is Over-Expressed during Prion Disease and Modulates the Innate Immune Response and the Microglial Activation State > Results > MiR-146a is consistently up-regulated in the brain's of prion infected mice
What the sources say
- Supportedcites [23] G Hu, 2010, miR-221 suppresses ICAM-1 translation and regulates interferon-gamma-induced ICAM-1 expression in human cholangiocytes., Am J Physiol Gastrointest Liver Physiol source
The Discussion reports that miR-221 regulates IFN-γ-induced ICAM-1 expression in human cholangiocytes and suggests that it regulates inflammatory responses in cholangiopathies. This supports the point attached to citation [23]—that miR-221 is involved in inflammation. The microglial cluster is the citing authors’ own finding, not a finding attributed to this source. (LLM, conf=0.93)
- Supportedcites [24] G Liu, 2009, miR-147, a microRNA that is induced upon toll-like receptor stimulation, regulates murine macrophage inflammatory responses., Proc Natl Acad Sci U S A source
Citation [24] attaches to the description of miR-147, not to the microglial cluster or the other miRNAs. The paper’s introductory passage reports that multiple TLRs induce miR-147, and its Results report that miR-147 attenuates inflammatory responses in murine macrophages. (LLM, conf=0.93)
plain- Asserted: passes — The authors put it forward as true.
- Checkable: passes — It can be checked against evidence.
- Load-bearing: unclear — It is unclear whether the paper’s conclusions depend on it.
- Based: passes — The paper gives a reason why it holds.
- Supported
The cited sources that could be checked couldn’t confirm or dispute this claim.
In the paper
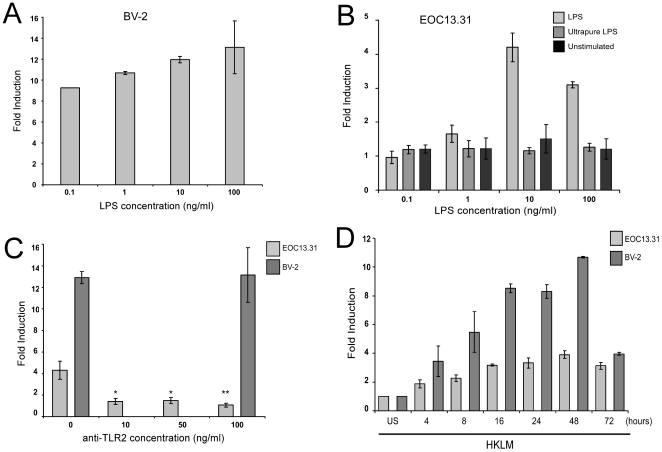
“We also observed significant up-regulation of miR-146a in EOC 13.31 cells which we hypothesized to be likely due to the presence of a contaminant in the particular LPS preparation in use, an observation previously reported by others [29].”
§ MicroRNA 146a (miR-146a) Is Over-Expressed during Prion Disease and Modulates the Innate Immune Response and the Microglial Activation State > Results > MiR-146a expression is induced in microglial cell lines by TLR2- and TLR4-agonists
What the sources say
- Could not verifycites [29] H Qin, 2005, LPS induces CD40 gene expression through the activation of NF-kappaB and STAT-1alpha in macrophages and microglia., Blood sourceExperimental — accuracy not yet measured
The Results report that LPS increased CD40 expression in EOC13 cells, not miR-146a expression. The passages found do not address miR-146a or a contaminant in the LPS preparation (searched: miR-146a, crude LPS, contaminant), so our copy does not verify the observation attributed to this paper. (LLM, conf=0.76)
hedgeddirect- Asserted: passes — The authors put it forward as true.
- Checkable: passes — It can be checked against evidence.
- Load-bearing: unclear — It is unclear whether the paper’s conclusions depend on it.
- Based: passes — The paper gives a reason why it holds.
- Could not verify
The cited sources support only part of this claim — read each source’s verdict below.
In the paper
“MiR-146a can directly down-regulate the production of pro-inflammatory cytokines by acting as a negative-feedback effector of the inflammatory signaling pathway initiated by NF-κB [16].”
§ MicroRNA 146a (miR-146a) Is Over-Expressed during Prion Disease and Modulates the Innate Immune Response and the Microglial Activation State > Introduction
What the sources say
- Partly supportedcites [16] KD Taganov, 2006, NF-kappaB-dependent induction of microRNA miR-146, an inhibitor targeted to signaling proteins of innate immune responses., Proc Natl Acad Sci U S A sourceExperimental — accuracy not yet measured
The Discussion describes a proposed negative-feedback loop in which NF-κB induces miR-146, which could down-regulate the signaling proteins IRAK1 and TRAF6. The Results show repression of reporters linked to those proteins’ 3′ UTRs, but do not show that miR-146a directly reduces pro-inflammatory cytokine production. The claim states that proposed downstream effect more definitively than the paper does; page numbers were not provided in our copy. (LLM, conf=0.88)
plaindirect- Asserted: passes — The authors put it forward as true.
- Checkable: passes — It can be checked against evidence.
- Load-bearing: passes — The paper’s conclusions depend on it.
- Based: passes — The paper gives a reason why it holds.
- Partly supported
The cited sources support only part of this claim — read each source’s verdict below.
In the paper
“These cells share numerous properties with macrophages with respect to the antigen profile, their phagocytic capacity and antimicrobial activity [25].”
§ MicroRNA 146a (miR-146a) Is Over-Expressed during Prion Disease and Modulates the Innate Immune Response and the Microglial Activation State > Results > MiR-146a expression is induced in microglial cell lines by TLR2- and TLR4-agonists
What the sources say
- Partly supportedcites [25] A Henn, 2009, The suitability of BV2 cells as alternative model system for primary microglia cultures or for animal experiments examining brain inflammation., ALTEX sourceExperimental — accuracy not yet measured
The Discussion (page not available in our copy) says BV-2 cells often behave similarly to primary microglia in phagocytosis assays. The Tab. 1 discussion also describes an inflammatory response pattern similar to that of LPS-stimulated macrophages. Neither passage establishes that BV-2 cells share macrophages’ antigen profile or antimicrobial activity, or directly compares their phagocytic capacity with macrophages. (LLM, conf=0.78)
plaincorrelational- Asserted: passes — The authors put it forward as true.
- Checkable: passes — It can be checked against evidence.
- Load-bearing: passes — The paper’s conclusions depend on it.
- Based: passes — The paper gives a reason why it holds.
- Partly supported
Every source the paper cites for this claim was checked and supports it.
In the paper
“Further evidence that TLRs may be important in the regulation of the microglial response in prion diseases stems from the observation that mice with defective TLR4 signaling, making them hyporesponsive to LPS, exhibit an accelerated rate of prion disease [11].”
§ MicroRNA 146a (miR-146a) Is Over-Expressed during Prion Disease and Modulates the Innate Immune Response and the Microglial Activation State > Discussion
What the sources say
- Supportedcites [11] DS Spinner, 2008, Accelerated prion disease pathogenesis in toll-like receptor 4 signaling-mutant mice., J Virol source
The paper’s opening summary reports that mice with a mutation preventing TLR4 signaling had significantly shorter scrapie incubation periods than wild-type controls. It also reports that macrophages from those mice were unresponsive to LPS, supporting the description of LPS hyporesponsiveness. The supplied passages do not give a page number. (LLM, conf=0.94)
plaindirect- Asserted: passes — The authors put it forward as true.
- Checkable: passes — It can be checked against evidence.
- Load-bearing: unclear — It is unclear whether the paper’s conclusions depend on it.
- Based: passes — The paper gives a reason why it holds.
- Supported
The cited sources support only part of this claim — read each source’s verdict below.
In the paper
“Validated miR-146a targets include two genes that are important mediators of TLR signaling [16]. These genes are IRAK1, which is in part responsible for transcription of NF-κB in response to immune stimulation, and TRAF6.”
§ MicroRNA 146a (miR-146a) Is Over-Expressed during Prion Disease and Modulates the Innate Immune Response and the Microglial Activation State > Discussion
What the sources say
- Partly supportedcites [16] KD Taganov, 2006, NF-kappaB-dependent induction of microRNA miR-146, an inhibitor targeted to signaling proteins of innate immune responses., Proc Natl Acad Sci U S A sourceExperimental — accuracy not yet measured
The Results identify IRAK1 and TRAF6 as key adapter molecules in TLR signaling and show that miR-146a represses reporters carrying their 3′ UTRs. The authors describe these findings as suggesting that the genes are miR-146a targets; the reporter experiments do not establish the unqualified claim that they are validated targets. (LLM, conf=0.86)
plaindirect- Asserted: passes — The authors put it forward as true.
- Checkable: passes — It can be checked against evidence.
- Load-bearing: passes — The paper’s conclusions depend on it.
- Based: passes — The paper gives a reason why it holds.
- Partly supported
The cited sources support only part of this claim — read each source’s verdict below.
In the paper
“These targets have been shown to be regulated primarily at the protein level”
§ MicroRNA 146a (miR-146a) Is Over-Expressed during Prion Disease and Modulates the Innate Immune Response and the Microglial Activation State > Results > Transcription of genes involved in NF-κB, JNK and MAPK signaling pathways and the expression of inflammatory mediators are modulated by miR-146a expression in TLR2 stimulated microglia
What the sources say
- Partly supportedcites [16] KD Taganov, 2006, NF-kappaB-dependent induction of microRNA miR-146, an inhibitor targeted to signaling proteins of innate immune responses., Proc Natl Acad Sci U S A sourceExperimental — accuracy not yet measured
The Results (page unavailable) show miR-146-dependent repression of IRAK1 and TRAF6 reporters, and the Discussion describes possible down-regulation of their protein levels. The copy does not establish that regulation is primarily at the protein level, and it does not address IRAK2. (LLM, conf=0.86)
- Partly supportedcites [37] J Hou, 2009, MicroRNA-146a feedback inhibits RIG-I-dependent type I IFN production in macrophages by targeting TRAF6, IRAK1, and IRAK2., J Immunol sourceExperimental — accuracy not yet measured
In “miR-146a targets TRAF6, IRAK1, and IRAK2” (page unavailable), the paper reports changes in TRAF6 and IRAK1 protein expression after miR-146a manipulation. It reports that IRAK2 changes at both the protein and mRNA levels. The copy therefore supports protein-level regulation, but not the claim that regulation of all three targets is primarily at the protein level. (LLM, conf=0.86)
plaindirect- Asserted: passes — The authors put it forward as true.
- Checkable: passes — It can be checked against evidence.
- Load-bearing: unclear — It is unclear whether the paper’s conclusions depend on it.
- Based: passes — The paper gives a reason why it holds.
- Partly supported
The cited sources support only part of this claim — read each source’s verdict below.
In the paper
“Contrary to previous reports, we did not find the scavenger receptors SCARB1, SCARB2 and AGER to be up-regulated during disease [39].”
§ MicroRNA 146a (miR-146a) Is Over-Expressed during Prion Disease and Modulates the Innate Immune Response and the Microglial Activation State > Discussion
What the sources say
- Partly supportedcites [39] MM Hughes, 2010, Microglia in the degenerating brain are capable of phagocytosis of beads and of apoptotic cells, but do not efficiently remove PrPSc, even upon LPS stimulation., Glia sourceExperimental — accuracy not yet measured
The Results section (‘Upregulation of Phagocytosis-Related Genes in ME7 Versus NBH Animals’; page unavailable) reports increased RAGE (AGER) expression during disease, supporting that part of the cited contrast. It reports CD36, SRA2 and CD68 as the other up-regulated scavenger receptors, but does not report up-regulation of SCARB1 or SCARB2. The citing authors’ own failure to find up-regulation is not a finding attributed to this source. (LLM, conf=0.86)
plain- Asserted: passes — The authors put it forward as true.
- Checkable: passes — It can be checked against evidence.
- Load-bearing: unclear — It is unclear whether the paper’s conclusions depend on it.
- Based: passes — The paper gives a reason why it holds.
- Partly supported
- Probably not a substantial claim. 31
- It may state two separate claims as one. 42
- The quote only partly states this claim. 4
At least one cited source doesn’t support this claim or points to a different paper, and none confirmed it — see the verdicts below.
In the paper
“Some evidence also exists suggesting that this response is independent of phagocytic clearance pathways that appear to be MyD88 dependent [53].”
§ MicroRNA 146a (miR-146a) Is Over-Expressed during Prion Disease and Modulates the Innate Immune Response and the Microglial Activation State > Discussion
What the sources say
- Disputedcites [53] P Henneke, 2002, Cellular activation, phagocytosis, and bactericidal activity against group B streptococcus involve parallel myeloid differentiation factor 88-dependent and independent signaling pathways., J Immunol sourceExperimental — accuracy not yet measured
The section on GBS internalization says MyD88 expression had no effect on macrophages’ ability to take up GBS. The section on toxic oxygen species distinguishes CR3-mediated phagocytosis from MyD88-dependent bactericidal activity as independent processes. Thus, the paper supports their independence but says the opposite of the claim’s characterization of phagocytic clearance as MyD88 dependent. (LLM, conf=0.89)
Checked by a reasoning model — may be wrong.
hedged- Asserted: passes — The authors put it forward as true.
- Checkable: passes — It can be checked against evidence.
- Load-bearing: fails — The paper’s conclusions may not depend on it.
- Based: passes — The paper gives a reason why it holds.
Probably not a substantial claim. The paper’s conclusions may not depend on it.
- Disputed
The cited sources support only part of this claim — read each source’s verdict below.
In the paper
“The neuronal cluster included miR-124, a miRNA that is especially abundant in neurons affirming the specificity of the methodology [20]–[22].”
§ MicroRNA 146a (miR-146a) Is Over-Expressed during Prion Disease and Modulates the Innate Immune Response and the Microglial Activation State > Results > MiR-146a is consistently up-regulated in the brain's of prion infected mice
What the sources say
- Partly supportedcites [20] M Lagos-Quintana, 2002, Identification of tissue-specific microRNAs from mouse., Curr Biol sourceExperimental — accuracy not yet measured
The passage labeled Abstract (no page given) reports that miR-124 variants accounted for 25%–48% of miRNAs in mouse cortex, cerebellum, and midbrain, supporting abundance in brain tissue. It does not establish that miR-124 is especially abundant specifically in neurons rather than other brain cells. The neuronal cluster and what it affirms about the citing study’s methodology are the citing authors’ interpretation, not findings of this source. (LLM, conf=0.85)
- Partly supportedcites [21] LF Sempere, 2004, Expression profiling of mammalian microRNAs uncovers a subset of brain-expressed microRNAs with possible roles in murine and human neuronal differentiation., Genome Biol sourceExperimental — accuracy not yet measured
In “Diverse miRNA expression patterns in mammalian organs” (page not supplied), the paper places miR-124a and miR-124b in a brain-expressed cluster. In “A subset of brain-expressed miRNAs is induced in retinoic acid-treated EC cells” (page not supplied), it reports their induction during neuronal differentiation, but says it did not examine expression in glial cells. It therefore supports the cluster finding, not the stronger assertion that miR-124 is especially abundant in neurons specifically. (LLM, conf=0.86)
- Supportedcites [22] AM Krichevsky, 2006, Specific microRNAs modulate embryonic stem cell-derived neurogenesis., Stem Cells source
The Discussion states that miR-124a is expressed preferentially in embryonic neurons, supporting the neuron-enrichment point attributed to this source. The neuronal cluster and the conclusion about methodology are the citing authors’ own observations, not findings this citation needs to establish. (LLM, conf=0.90)
plaincorrelational- Asserted: passes — The authors put it forward as true.
- Checkable: passes — It can be checked against evidence.
- Load-bearing: fails — The paper’s conclusions may not depend on it.
- Based: passes — The paper gives a reason why it holds.
Probably not a substantial claim. The paper’s conclusions may not depend on it. It may state two separate claims as one.
- Partly supported
Every source the paper cites for this claim was checked and supports it.
In the paper
“The microglial cell-line enriched cluster contained 20 miRNAs including miR-146a and a number of other miRNAs reportedly involved in inflammation, such as miR-155, miR-221 [23] and miR-147, a microRNA that is induced upon Toll-like receptor (TLR) stimulation and regulates murine macrophage inflammatory responses [24].”
§ MicroRNA 146a (miR-146a) Is Over-Expressed during Prion Disease and Modulates the Innate Immune Response and the Microglial Activation State > Results > MiR-146a is consistently up-regulated in the brain's of prion infected mice
What the sources say
- Supportedcites [24] G Liu, 2009, miR-147, a microRNA that is induced upon toll-like receptor stimulation, regulates murine macrophage inflammatory responses., Proc Natl Acad Sci U S A source
The Results report that miR-147 was induced in macrophages stimulated through TLR2, TLR3, and TLR4 and that miR-147 mimics reduced inflammatory cytokine production. The Discussion likewise describes miR-147 as part of a negative-feedback loop regulating murine macrophage inflammatory responses. (LLM, conf=0.95)
plaindirect- Asserted: passes — The authors put it forward as true.
- Checkable: passes — It can be checked against evidence.
- Load-bearing: fails — The paper’s conclusions may not depend on it.
- Based: passes — The paper gives a reason why it holds.
Probably not a substantial claim. The paper’s conclusions may not depend on it. It may state two separate claims as one.
- Supported
The cited sources support only part of this claim — read each source’s verdict below.
In the paper
“MiR-146a is reported to be up-regulated in LPS stimulated human macrophages, however, the microglial surface receptor that is engaged leading to activation during prion pathogenesis is unknown [16].”
§ MicroRNA 146a (miR-146a) Is Over-Expressed during Prion Disease and Modulates the Innate Immune Response and the Microglial Activation State > Results > The microglial surface receptor, TLR2, is significantly induced in the brain's of prion infected mice
What the sources say
- Partly supportedcites [16] KD Taganov, 2006, NF-kappaB-dependent induction of microRNA miR-146, an inhibitor targeted to signaling proteins of innate immune responses., Proc Natl Acad Sci U S A sourceExperimental — accuracy not yet measured
The Results (page not provided) report that miR-146a was strongly induced after LPS treatment in human THP-1 and HL-60 myeloid cell lines. The paper identifies THP-1 as a monocytic leukemia cell line; it does not establish the finding in human macrophages. (LLM, conf=0.88)
plaincorrelational- Asserted: passes — The authors put it forward as true.
- Checkable: passes — It can be checked against evidence.
- Load-bearing: fails — The paper’s conclusions may not depend on it.
- Based: passes — The paper gives a reason why it holds.
Probably not a substantial claim. The paper’s conclusions may not depend on it.
- Partly supported
The sources with a verdict support this claim; the rest weren’t checked yet, have no full text we could read, or their verdicts aren’t rated yet.
In the paper
“CFH has also been reported to be a direct target of miR-146a and potentially important in inflammation in Alzheimer's disease [32], [33].”
§ MicroRNA 146a (miR-146a) Is Over-Expressed during Prion Disease and Modulates the Innate Immune Response and the Microglial Activation State > Results > Transcription of genes involved in protein synthesis, infection mechanism, immune cell trafficking, oxidative phosphorylation and cellular movement are modulated by miR-146a expression in microglia
What the sources say
- Not checked — no full text of the sourcecites [32] AI Pogue, 2009, Characterization of an NF-kappaB-regulated, miRNA-146a-mediated down-regulation of complement factor H (CFH) in metal-sulfate-stressed human brain cells., J Inorg Biochem source
- Supportedcites [33] YY Li, 2011, Increased expression of miRNA-146a in alzheimer's disease transgenic mouse models., Neurosci Lett source
The supplied passage labeled Abstract (passages 1–2; no page supplied) reports that miRNA-146a base-pairs with the CFH mRNA 3′-UTR and down-regulates CFH. It also proposes a link between miRNA-146a signaling and inflammatory responses in Alzheimer’s disease. (LLM, conf=0.91)
hedgedconditional- Asserted: passes — The authors put it forward as true.
- Checkable: passes — It can be checked against evidence.
- Load-bearing: fails — The paper’s conclusions may not depend on it.
- Based: passes — The paper gives a reason why it holds.
Probably not a substantial claim. The paper’s conclusions may not depend on it. It may state two separate claims as one.
The cited sources support only part of this claim — read each source’s verdict below.
In the paper
“Taganov et al (2006) previously showed that TLR2 stimulation by exposure to peptidoglycan and its synthetic analog, Pam3CSK4, produced an up-regulation of miR-146a in human monocytes in contrast to TLR3, TLR7 and TLR9 agonists.”
§ MicroRNA 146a (miR-146a) Is Over-Expressed during Prion Disease and Modulates the Innate Immune Response and the Microglial Activation State > Results > MiR-146a expression is induced in microglial cell lines by TLR2- and TLR4-agonists
What the sources say
- Partly supportedcites Taganov et al (2006) sourceExperimental — accuracy not yet measured
The Results (page not supplied) report that peptidoglycan and Pam3CSK4 induced miR-146 in THP-1 cells, whereas TLR3, TLR7, and TLR9 agonists did not. THP-1 is a human monocytic leukemia cell line, not primary human monocytes; the TLR2 experiment measured miR-146 without distinguishing miR-146a from miR-146b. (LLM, conf=0.88)
plaindirect- Asserted: passes — The authors put it forward as true.
- Checkable: passes — It can be checked against evidence.
- Load-bearing: passes — The paper’s conclusions depend on it.
- Based: passes — The paper gives a reason why it holds.
Probably not a substantial claim.
- Partly supported
The cited sources that could be checked couldn’t confirm or dispute this claim.
In the paper
“Additionally, like microglial cells, they form spineous processes and express inwardly rectifying, but not outwardly rectifying K+ channels [25].”
§ MicroRNA 146a (miR-146a) Is Over-Expressed during Prion Disease and Modulates the Innate Immune Response and the Microglial Activation State > Results > MiR-146a expression is induced in microglial cell lines by TLR2- and TLR4-agonists
What the sources say
- Could not verifycites [25] A Henn, 2009, The suitability of BV2 cells as alternative model system for primary microglia cultures or for animal experiments examining brain inflammation., ALTEX sourceExperimental — accuracy not yet measured
The Introduction identifies BV-2 as a substitute for primary microglia, and the Results discuss inflammatory responses, but neither addresses spineous processes or K+ channel rectification. Searches of our copy for “spineous” and “rectifying” found no passage supporting either feature. (LLM, conf=0.74)
plain- Asserted: passes — The authors put it forward as true.
- Checkable: passes — It can be checked against evidence.
- Load-bearing: fails — The paper’s conclusions may not depend on it.
- Based: passes — The paper gives a reason why it holds.
Probably not a substantial claim. The paper’s conclusions may not depend on it. It may state two separate claims as one.
- Could not verify
The cited sources support only part of this claim — read each source’s verdict below.
In the paper
“This has been previously described in macrophages where miR-146a expression was found to be capable of dampening the immediate innate immune response mediated by TLR2 and TLR4 [16], [30], [31].”
§ MicroRNA 146a (miR-146a) Is Over-Expressed during Prion Disease and Modulates the Innate Immune Response and the Microglial Activation State > Results > Temporal induction of miR-146a expression in microglia is kinetically distinct to that of TLR2 signaling-induced cytokines
What the sources say
- Partly supportedcites [16] KD Taganov, 2006, NF-kappaB-dependent induction of microRNA miR-146, an inhibitor targeted to signaling proteins of innate immune responses., Proc Natl Acad Sci U S A sourceExperimental — accuracy not yet measured
The Results show that TLR2 and TLR4 stimuli induce miR-146 expression in THP-1 monocytic cells. The Discussion proposes that miR-146 could reduce TLR signaling, but says its exact role still requires loss-of-function and overexpression studies. It does not establish dampening of an immediate response in macrophages. (LLM, conf=0.88)
- Partly supportedcites [30] MM Perry, 2008, Rapid changes in microRNA-146a expression negatively regulate the IL-1beta-induced inflammatory response in human lung alveolar epithelial cells., J Immunol sourceExperimental — accuracy not yet measured
The Discussion reports that miR-146a dampened an IL-1β-induced inflammatory response in human lung epithelial cells. It also notes increased miR-146a expression after activation of monocytes and macrophages, but only suggests that a similar regulatory pathway might operate there. It does not establish that miR-146a dampens macrophage responses mediated specifically by TLR2 and TLR4. Page numbers are unavailable in our copy. (LLM, conf=0.87)
- Partly supportedcites [31] MA Nahid, 2009, miR-146a is critical for endotoxin-induced tolerance: IMPLICATION IN INNATE IMMUNITY., J Biol Chem sourceExperimental — accuracy not yet measured
The Results and Discussion show that miR-146a dampens TLR4-mediated responses to subsequent LPS challenge in THP-1 monocytic cells. They do not demonstrate this effect in macrophages or directly test dampening of TLR2-mediated responses. The Discussion describes TLR2 involvement as a possible extension, while the measured TNF-α response initially rises before miR-146a-associated tolerance develops; page numbers are not available in our copy. (LLM, conf=0.88)
plaindirect- Asserted: passes — The authors put it forward as true.
- Checkable: passes — It can be checked against evidence.
- Load-bearing: fails — The paper’s conclusions may not depend on it.
- Based: passes — The paper gives a reason why it holds.
Probably not a substantial claim. The paper’s conclusions may not depend on it.
- Partly supported
The cited sources that could be checked couldn’t confirm or dispute this claim.
In the paper
“As is the case in other neurodegenerative conditions, such as Alzheimer's disease, one of the pathological features of disease is the activation of the brain's resident immune cells, the microglia, and the accumulation of astrocytes. In many instances, this feature can be detected prior to clinical symptoms and other signs of neurodegeneration, such as spongiosis and neuronal cell death become app”
§ MicroRNA 146a (miR-146a) Is Over-Expressed during Prion Disease and Modulates the Innate Immune Response and the Microglial Activation State > Introduction
What the sources say
- Not checked — no full text of the sourcecites [2] A Giese, 1998, Role of microglia in neuronal cell death in prion disease., Brain Pathol source
- Could not verifycites [3] LW Shepard, 2001, Constitutive activation of NF-kappa B and secretion of interleukin-8 induced by the G protein-coupled receptor of kaposi's sarcoma-associated herpesvirus involve G alpha(13) and RhoA., J Biol Chem sourceExperimental — accuracy not yet measured
The indexed paper discusses Kaposi’s sarcoma herpesvirus signaling, NF-κB activation, and IL-8 secretion (Abstract and Discussion; page numbers unavailable). Searches for prion disease, microglia, astrocytes, and presymptomatic neurodegeneration found no passage addressing the attributed claim. (LLM, conf=0.76)
plaincorrelational- Asserted: passes — The authors put it forward as true.
- Checkable: passes — It can be checked against evidence.
- Load-bearing: fails — The paper’s conclusions may not depend on it.
- Based: passes — The paper gives a reason why it holds.
Probably not a substantial claim. The paper’s conclusions may not depend on it. It may state two separate claims as one.
Every source the paper cites for this claim was checked and supports it.
In the paper
“In prion disease, microglia appear to express low levels of pro-inflammatory cytokines during chronic neurodegeneration but may be in a “primed” state [8].”
§ MicroRNA 146a (miR-146a) Is Over-Expressed during Prion Disease and Modulates the Innate Immune Response and the Microglial Activation State > Introduction
What the sources say
- Supportedcites [8] C Cunningham, 2009, Systemic inflammation induces acute behavioral and cognitive changes and accelerates neurodegenerative disease., Biol Psychiatry source
The Background states that microglia express low levels of proinflammatory cytokines during chronic neurodegeneration but are primed to produce more after systemic LPS challenge. The Discussion’s “Exaggerated Sickness Behavior and Microglial Priming” section applies this account to the ME7 model of prion disease. (LLM, conf=0.94)
hedgedcorrelational- Asserted: passes — The authors put it forward as true.
- Checkable: passes — It can be checked against evidence.
- Load-bearing: passes — The paper’s conclusions depend on it.
- Based: passes — The paper gives a reason why it holds.
Probably not a substantial claim. It may state two separate claims as one.
- Supported
Every source the paper cites for this claim was checked and supports it.
In the paper
“Pathogenic changes in prion disease appear to be independent of MyD88, a signaling intermediate for several TLR family members, as ablation of this molecule did not lead to changes in the incubation periods, and neuropathological profiles of scrapie-infected mice [12].”
§ MicroRNA 146a (miR-146a) Is Over-Expressed during Prion Disease and Modulates the Innate Immune Response and the Microglial Activation State > Introduction
What the sources say
- Supportedcites [12] M Prinz, 2003, Prion pathogenesis in the absence of toll-like receptor signalling., EMBO Rep source
The ‘MyD88 -/- mice are highly susceptible to scrapie’ section reports similar incubation times in knockout and wild-type mice and similar vacuolization and reactive astrogliosis. Table 1 (p. 198) notes a slightly longer incubation period after low-dose intraperitoneal challenge, but the text says the difference was not statistically significant. (LLM, conf=0.93)
hedged- Asserted: passes — The authors put it forward as true.
- Checkable: passes — It can be checked against evidence.
- Load-bearing: fails — The paper’s conclusions may not depend on it.
- Based: passes — The paper gives a reason why it holds.
Probably not a substantial claim. The paper’s conclusions may not depend on it.
- Supported
The cited sources support only part of this claim — read each source’s verdict below.
In the paper
“The 3′UTRs of these genes are responsive to interaction with miR-146a, however, regulation was shown to be at the level of translation; mRNA levels remained unchanged.”
§ MicroRNA 146a (miR-146a) Is Over-Expressed during Prion Disease and Modulates the Innate Immune Response and the Microglial Activation State > Discussion
What the sources say
- Partly supportedcites [16] KD Taganov, 2006, NF-kappaB-dependent induction of microRNA miR-146, an inhibitor targeted to signaling proteins of innate immune responses., Proc Natl Acad Sci U S A sourceExperimental — accuracy not yet measured
The Results show that miR-146a reduced expression of reporters bearing the IRAK1 and TRAF6 3′ UTRs, supporting their responsiveness. The paper describes this as posttranscriptional repression, but does not show that repression occurred specifically at translation or that IRAK1 and TRAF6 mRNA levels remained unchanged. (LLM, conf=0.88)
plaindirect- Asserted: passes — The authors put it forward as true.
- Checkable: passes — It can be checked against evidence.
- Load-bearing: unclear — It is unclear whether the paper’s conclusions depend on it.
- Based: passes — The paper gives a reason why it holds.
It may state two separate claims as one.
- Partly supported
Every source the paper cites for this claim was checked and supports it.
In the paper
“Furthermore, an injection of amyloid into the hippocampus provokes increased TLR2 expression [41].”
§ MicroRNA 146a (miR-146a) Is Over-Expressed during Prion Disease and Modulates the Innate Immune Response and the Microglial Activation State > Discussion
What the sources say
- Supportedcites [41] KL Richard, 2008, Toll-like receptor 2 acts as a natural innate immune receptor to clear amyloid beta 1–42 and delay the cognitive decline in a mouse model of alzheimer's disease., J Neurosci source
The section “TLR2 expression in response to Aβ” reports that injecting Aβ1–42 into the hippocampus of wild-type mice significantly increased TLR2 gene expression compared with saline injection. The claim accurately paraphrases this finding, though the measured expression was TLR2 mRNA. (LLM, conf=0.94)
plaindirect- Asserted: passes — The authors put it forward as true.
- Checkable: passes — It can be checked against evidence.
- Load-bearing: fails — The paper’s conclusions may not depend on it.
- Based: passes — The paper gives a reason why it holds.
Probably not a substantial claim. The paper’s conclusions may not depend on it.
- Supported
The cited sources support only part of this claim — read each source’s verdict below.
In the paper
“Previously, TRAF6, IRAK1 and IRAK2 have been identified and validated as putative targets of miR-146a in macrophages [16], [37].”
§ MicroRNA 146a (miR-146a) Is Over-Expressed during Prion Disease and Modulates the Innate Immune Response and the Microglial Activation State > Results > Transcription of genes involved in NF-κB, JNK and MAPK signaling pathways and the expression of inflammatory mediators are modulated by miR-146a expression in TLR2 stimulated microglia
What the sources say
- Partly supportedcites [16] KD Taganov, 2006, NF-kappaB-dependent induction of microRNA miR-146, an inhibitor targeted to signaling proteins of innate immune responses., Proc Natl Acad Sci U S A sourceExperimental — accuracy not yet measured
The Results report that miR-146a repressed TRAF6 and IRAK1 3′ UTR reporters, supporting their identification as putative targets. The paper does not report IRAK2 as a target, and the target-validation experiments used 293 cells, not macrophages. (LLM, conf=0.90)
- Supportedcites [37] J Hou, 2009, MicroRNA-146a feedback inhibits RIG-I-dependent type I IFN production in macrophages by targeting TRAF6, IRAK1, and IRAK2., J Immunol source
The section “miR-146a targets TRAF6, IRAK1, and IRAK2” reports that miR-146a altered TRAF6 and IRAK1 expression in macrophages and presents experimental evidence for IRAK2 targeting. The Discussion explicitly states that the study demonstrated all three to be miR-146a targets in mice. (LLM, conf=0.94)
hedgeddirect- Asserted: passes — The authors put it forward as true.
- Checkable: passes — It can be checked against evidence.
- Load-bearing: fails — The paper’s conclusions may not depend on it.
- Based: passes — The paper gives a reason why it holds.
Probably not a substantial claim. The paper’s conclusions may not depend on it.
- Partly supported
The cited sources support only part of this claim — read each source’s verdict below.
In the paper
“MiR-146a is also transcribed by NF-κB and therefore may operate as part of a feedback inhibitory regulatory-loop to modulate inflammation by this transcription factor [46].”
§ MicroRNA 146a (miR-146a) Is Over-Expressed during Prion Disease and Modulates the Innate Immune Response and the Microglial Activation State > Discussion
What the sources say
- Partly supportedcites [46] K Pichler, 2008, MicroRNA miR-146a and further oncogenesis-related cellular microRNAs are dysregulated in HTLV-1-transformed T lymphocytes., Retrovirology sourceExperimental — accuracy not yet measured
The Results section reports that HTLV-1 Tax activates the miR-146a promoter through NF-κB. The Discussion proposes a possible negative feedback loop in which miR-146a suppresses NF-κB signaling, but says that loop is inoperative in the HTLV context. Our copy does not establish that the loop modulates inflammation. (LLM, conf=0.87)
hedgedconditional- Asserted: passes — The authors put it forward as true.
- Checkable: passes — It can be checked against evidence.
- Load-bearing: unclear — It is unclear whether the paper’s conclusions depend on it.
- Based: passes — The paper gives a reason why it holds.
It may state two separate claims as one.
- Partly supported
Every source the paper cites for this claim was checked and supports it.
In the paper
“Nevertheless, the study determined by Prinz et al. (2003) showed that MyD88 knock-out mice were readily infectable with scrapie and did not show any significant alteration in the time-course or pathology of the disease [12].”
§ MicroRNA 146a (miR-146a) Is Over-Expressed during Prion Disease and Modulates the Innate Immune Response and the Microglial Activation State > Discussion
What the sources say
- Supportedcites [12] M Prinz, 2003, Prion pathogenesis in the absence of toll-like receptor signalling., EMBO Rep source
The section “MyD88 -/- mice are highly susceptible to scrapie” reports that all challenged knockout mice developed scrapie and that their incubation times did not differ significantly from wild-type mice. It also reports similar brain pathology in the two groups; Table 1 (p. 198) notes a slightly longer incubation period at the lower intraperitoneal dose, but the difference was not statistically significant. (LLM, conf=0.94)
plain- Asserted: passes — The authors put it forward as true.
- Checkable: passes — It can be checked against evidence.
- Load-bearing: passes — The paper’s conclusions depend on it.
- Based: passes — The paper gives a reason why it holds.
It may state two separate claims as one.
- Supported
The cited sources support only part of this claim — read each source’s verdict below.
In the paper
“Interestingly, this gene has been shown to be targeted by miR-146a and down-regulated in Alzheimer's disease as well as in other diseases such as Herpes simplex virus type1 infection [47], [48].”
§ MicroRNA 146a (miR-146a) Is Over-Expressed during Prion Disease and Modulates the Innate Immune Response and the Microglial Activation State > Discussion
What the sources say
- Partly supportedcites [47] WJ Lukiw, 2008, An NF-kappaB-sensitive micro RNA-146a-mediated inflammatory circuit in alzheimer disease and in stressed human brain cells., J Biol Chem sourceExperimental — accuracy not yet measured
Figure 5 (p. 31319) reports that CFH, described as a miR-146a target, is down-regulated in Alzheimer disease brain. The discussion also links increased miR-146a to reduced CFH expression, but our copy does not address herpes simplex virus type 1 infection (searched: “Herpes simplex virus type 1 infection” and “HSV-1 viral infection”). (LLM, conf=0.88)
- Supportedcites [48] JM Hill, 2009, HSV-1 infection of human brain cells induces miRNA-146a and alzheimer-type inflammatory signaling., Neuroreport source
The Results report that CFH was reduced 4.5-fold in HSV-1-infected human neural cells. The Conclusion identifies CFH as a known miR-146a target. This source supports the HSV-1 portion of the sentence; the Alzheimer's disease portion is not assigned specifically to it in the two-citation sentence. (LLM, conf=0.92)
plaindirect- Asserted: passes — The authors put it forward as true.
- Checkable: passes — It can be checked against evidence.
- Load-bearing: fails — The paper’s conclusions may not depend on it.
- Based: passes — The paper gives a reason why it holds.
Probably not a substantial claim. The paper’s conclusions may not depend on it. It may state two separate claims as one.
- Partly supported
The cited sources support only part of this claim — read each source’s verdict below.
In the paper
“The gene IL-1B has previously been reported to be negatively regulated by miR-146a [30].”
§ MicroRNA 146a (miR-146a) Is Over-Expressed during Prion Disease and Modulates the Innate Immune Response and the Microglial Activation State > Results > Transcription of genes involved in protein synthesis, infection mechanism, immune cell trafficking, oxidative phosphorylation and cellular movement are modulated by miR-146a expression in microglia
What the sources say
- Partly supportedcites [30] MM Perry, 2008, Rapid changes in microRNA-146a expression negatively regulate the IL-1beta-induced inflammatory response in human lung alveolar epithelial cells., J Immunol sourceExperimental — accuracy not yet measured
The Introduction and Discussion report that miR-146a negatively regulates the inflammatory response induced by IL-1β, including IL-8 and RANTES release. They do not report negative regulation of the IL-1B gene itself; the Results instead describe IL-1β stimulation increasing miR-146a expression. Page numbers were not provided in our copy. (LLM, conf=0.84)
plaindirect- Asserted: passes — The authors put it forward as true.
- Checkable: passes — It can be checked against evidence.
- Load-bearing: fails — The paper’s conclusions may not depend on it.
- Based: passes — The paper gives a reason why it holds.
Probably not a substantial claim. The paper’s conclusions may not depend on it.
- Partly supported
The cited sources support only part of this claim — read each source’s verdict below.
In the paper
“Previous studies have determined that miR-146a can regulate NF-κB itself, as well as key genes downstream of NF-κB [16].”
§ MicroRNA 146a (miR-146a) Is Over-Expressed during Prion Disease and Modulates the Innate Immune Response and the Microglial Activation State > Discussion
What the sources say
- Partly supportedcites [16] KD Taganov, 2006, NF-kappaB-dependent induction of microRNA miR-146, an inhibitor targeted to signaling proteins of innate immune responses., Proc Natl Acad Sci U S A sourceExperimental — accuracy not yet measured
The Results show that miR-146a represses reporters bearing the IRAK1 and TRAF6 3′ UTRs, and the Discussion proposes that this could reduce NF-κB pathway activity through negative feedback. But the paper describes IRAK1 and TRAF6 as mediators of NF-κB activation, not genes downstream of NF-κB; it also does not show direct regulation of NF-κB itself. No page numbers are available in our copy. (LLM, conf=0.86)
plaindirect- Asserted: passes — The authors put it forward as true.
- Checkable: passes — It can be checked against evidence.
- Load-bearing: fails — The paper’s conclusions may not depend on it.
- Based: passes — The paper gives a reason why it holds.
Probably not a substantial claim. The paper’s conclusions may not depend on it. It may state two separate claims as one.
- Partly supported
The cited sources that could be checked couldn’t confirm or dispute this claim.
In the paper
“Additionally, a number of miRNAs found to be up-regulated in a recent study profiling glial cells in multiple sclerosis brain lesions, as well as our previous study to determine deregulated miRNAs in scrapie infection, were also identified to be enriched in microglial cell lines in this study [18], [38]. These were miR-142-3p, miR-34a, and miR-223.”
§ MicroRNA 146a (miR-146a) Is Over-Expressed during Prion Disease and Modulates the Innate Immune Response and the Microglial Activation State > Discussion
What the sources say
- Could not verifycites [18] VG Tusher, 2001, Significance analysis of microarrays applied to the ionizing radiation response., Proc Natl Acad Sci U S A sourceExperimental — accuracy not yet measured
The Materials and Methods and Results describe gene-expression measurements in irradiated human lymphoblastoid cell lines, not microglial or multiple-sclerosis glial cells. Searches for the three named miRNAs, microglia, multiple sclerosis, and scrapie found no passage addressing their enrichment or up-regulation. The cited paper therefore cannot verify the attributed claim. (LLM, conf=0.78)
- Not checked — no full text of the sourcecites [38] A Junker, 2009, MicroRNA profiling of multiple sclerosis lesions identifies modulators of the regulatory protein CD47., Brain source
plaincorrelational- Asserted: passes — The authors put it forward as true.
- Checkable: passes — It can be checked against evidence.
- Load-bearing: unclear — It is unclear whether the paper’s conclusions depend on it.
- Based: passes — The paper gives a reason why it holds.
It may state two separate claims as one.
- Could not verify
Every source the paper cites for this claim was checked and supports it.
In the paper
“Caspase-8 is known to have non-apoptotic functions and has been shown to be required for TLR signaling and in the regulation of NF-κB function [36].”
§ MicroRNA 146a (miR-146a) Is Over-Expressed during Prion Disease and Modulates the Innate Immune Response and the Microglial Activation State > Results > Transcription of genes involved in NF-κB, JNK and MAPK signaling pathways and the expression of inflammatory mediators are modulated by miR-146a expression in TLR2 stimulated microglia
What the sources say
- Supportedcites [36] B Lemmers, 2007, Essential role for caspase-8 in toll-like receptors and NFkappaB signaling., J Biol Chem source
The paper’s abstract explicitly describes non-apoptotic functions for caspase-8 and its requirement for TLR signaling and regulation of NF-κB function. The Discussion (pp. 7421–7422) specifies that the findings concern B-cell responses to TLR2, TLR3 and TLR4, with delayed rather than blocked NF-κB signaling after TLR4 stimulation. (LLM, conf=0.95)
boosteddirect- Asserted: passes — The authors put it forward as true.
- Checkable: passes — It can be checked against evidence.
- Load-bearing: fails — The paper’s conclusions may not depend on it.
- Based: passes — The paper gives a reason why it holds.
Probably not a substantial claim. The paper’s conclusions may not depend on it. It may state two separate claims as one.
- Supported
The paper states this without a source or data behind it here, so there is nothing to check it against. The quote shows it is in the paper.
In the paper
“While the BV-2 cell line divided very rapidly, at least once during a 24 hour period, EOC 13.31 cells doubled only every 48 hours.”
§ MicroRNA 146a (miR-146a) Is Over-Expressed during Prion Disease and Modulates the Innate Immune Response and the Microglial Activation State > Results > Transcription of genes involved in protein synthesis, infection mechanism, immune cell trafficking, oxidative phosphorylation and cellular movement are modulated by miR-146a expression in microglia
plain- Asserted: passes — The authors put it forward as true.
- Checkable: passes — It can be checked against evidence.
- Load-bearing: passes — The paper’s conclusions depend on it.
- Based: passes — The paper gives a reason why it holds.
It may state two separate claims as one.
A result the paper reports from its own data — it cites no other source for it, so there is none to check. The quote shows it is in the paper.
In the paper
“Other receptors including Fc (FCGR1 and FCGR3) and complement receptors (ITGAM and ITGAX), as well as TREM2 a myeloid specific receptor triggered by amyloid to promote active phagocytosis, were also found to be over-expressed.”
§ MicroRNA 146a (miR-146a) Is Over-Expressed during Prion Disease and Modulates the Innate Immune Response and the Microglial Activation State > Results > The microglial surface receptor, TLR2, is significantly induced in the brain's of prion infected mice
plaincorrelational- Asserted: passes — The authors put it forward as true.
- Checkable: passes — It can be checked against evidence.
- Load-bearing: unclear — It is unclear whether the paper’s conclusions depend on it.
- Based: passes — The paper gives a reason why it holds.
It may state two separate claims as one.
A result the paper reports from its own data — it cites no other source for it, so there is none to check. The quote shows it is in the paper.
In the paper
“However, the mRNAs of other TLRs, including TLR4, were barely detectable in our study and so we could not determine whether there was an increase in expression of these receptors in the infected animals.”
§ MicroRNA 146a (miR-146a) Is Over-Expressed during Prion Disease and Modulates the Innate Immune Response and the Microglial Activation State > Results > The microglial surface receptor, TLR2, is significantly induced in the brain's of prion infected mice
plain- Asserted: passes — The authors put it forward as true.
- Checkable: passes — It can be checked against evidence.
- Load-bearing: unclear — It is unclear whether the paper’s conclusions depend on it.
- Based: passes — The paper gives a reason why it holds.
It may state two separate claims as one.
A result the paper reports from its own data — it cites no other source for it, so there is none to check. The quote shows it is in the paper.
In the paper
“This treatment, in turn, prevented the induction of miR-146a in EOC 13.31 cells stimulated via the crude LPS preparation, but not similarly treated BV-2 cells (Figure 2C).”
§ MicroRNA 146a (miR-146a) Is Over-Expressed during Prion Disease and Modulates the Innate Immune Response and the Microglial Activation State > Results > MiR-146a expression is induced in microglial cell lines by TLR2- and TLR4-agonists
plaindirect- Asserted: passes — The authors put it forward as true.
- Checkable: passes — It can be checked against evidence.
- Load-bearing: passes — The paper’s conclusions depend on it.
- Based: passes — The paper gives a reason why it holds.
It may state two separate claims as one.
A result the paper reports from its own data — it cites no other source for it, so there is none to check. The quote shows it is in the paper.
In the paper
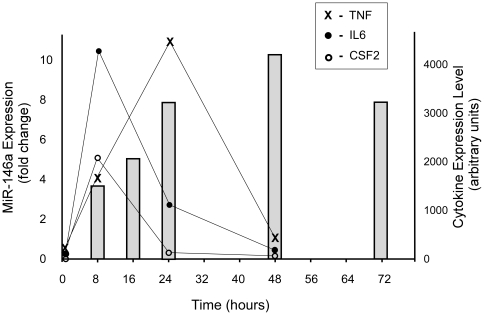
“Agonist treatment uniformly resulted in the significant induction of miR-146a expression that increased over time to a maximum at 48 hours post-stimulation, but was still elevated even at 72 hours post stimulation (Figure 3).”
§ MicroRNA 146a (miR-146a) Is Over-Expressed during Prion Disease and Modulates the Innate Immune Response and the Microglial Activation State > Results > Temporal induction of miR-146a expression in microglia is kinetically distinct to that of TLR2 signaling-induced cytokines
plaindirect- Asserted: passes — The authors put it forward as true.
- Checkable: passes — It can be checked against evidence.
- Load-bearing: passes — The paper’s conclusions depend on it.
- Based: passes — The paper gives a reason why it holds.
It may state two separate claims as one.
A result the paper reports from its own data — it cites no other source for it, so there is none to check. The quote shows it is in the paper.
In the paper
“All three were found to peak well before 24 hours post-stimulation and had all returned to basal levels by 48 hours (Figure 3).”
§ MicroRNA 146a (miR-146a) Is Over-Expressed during Prion Disease and Modulates the Innate Immune Response and the Microglial Activation State > Results > Temporal induction of miR-146a expression in microglia is kinetically distinct to that of TLR2 signaling-induced cytokines
plain- Asserted: passes — The authors put it forward as true.
- Checkable: passes — It can be checked against evidence.
- Load-bearing: passes — The paper’s conclusions depend on it.
- Based: passes — The paper gives a reason why it holds.
It may state two separate claims as one.
A result the paper reports from its own data — it cites no other source for it, so there is none to check. The quote shows it is in the paper.
In the paper
“In situ hybridization to detect miR-146a expression proved inconclusive in confirming this (data not shown).”
§ MicroRNA 146a (miR-146a) Is Over-Expressed during Prion Disease and Modulates the Innate Immune Response and the Microglial Activation State > Results > MiR-146a is consistently up-regulated in the brain's of prion infected mice
plain- Asserted: passes — The authors put it forward as true.
- Checkable: passes — It can be checked against evidence.
- Load-bearing: fails — The paper’s conclusions may not depend on it.
- Based: passes — The paper gives a reason why it holds.
Probably not a substantial claim. The paper’s conclusions may not depend on it.
A result the paper reports from its own data — it cites no other source for it, so there is none to check. The quote shows it is in the paper.
In the paper
“Other groups of up-regulated genes included genes involved in cell cycle progression, cell death, cellular movement and morphology.”
§ MicroRNA 146a (miR-146a) Is Over-Expressed during Prion Disease and Modulates the Innate Immune Response and the Microglial Activation State > Results > Transcription of genes involved in NF-κB, JNK and MAPK signaling pathways and the expression of inflammatory mediators are modulated by miR-146a expression in TLR2 stimulated microglia
plaincorrelational- Asserted: passes — The authors put it forward as true.
- Checkable: passes — It can be checked against evidence.
- Load-bearing: unclear — It is unclear whether the paper’s conclusions depend on it.
- Based: passes — The paper gives a reason why it holds.
It may state two separate claims as one.
A result the paper reports from its own data — it cites no other source for it, so there is none to check. The quote shows it is in the paper.
In the paper
“The transcription regulator SMAD3 was identified as a potential target of miR-146a in both resting cells and those stimulated with LPS and has not been described to be a target of miR-146a.”
§ MicroRNA 146a (miR-146a) Is Over-Expressed during Prion Disease and Modulates the Innate Immune Response and the Microglial Activation State > Results > Transcription of genes involved in NF-κB, JNK and MAPK signaling pathways and the expression of inflammatory mediators are modulated by miR-146a expression in TLR2 stimulated microglia
hedgedcorrelational- Asserted: passes — The authors put it forward as true.
- Checkable: passes — It can be checked against evidence.
- Load-bearing: unclear — It is unclear whether the paper’s conclusions depend on it.
- Based: passes — The paper gives a reason why it holds.
It may state two separate claims as one.
- The authors state this as an assumption: Most translational repression is accompanied by miRNA-mediated mRNA degradation.
- Rests on an assumption: Direct targets of miR-146a important in immune activation are likely to be those found at the intersection of genes up-regulated following knock-down and down-regulated after over-expression, provided they exhibit altered expression detectable at the mRNA level.
A result the paper reports from its own data — it cites no other source for it, so there is none to check. The quote shows it is in the paper.
In the paper
“A significant number of genes were de-regulated under these conditions, 22 (3 down-regulated, 19 up-regulated) at 8 hours post transfection and 977 (778 down-regulated, 199 up-regulated) at 24 hours.”
§ MicroRNA 146a (miR-146a) Is Over-Expressed during Prion Disease and Modulates the Innate Immune Response and the Microglial Activation State > Results > Transcription of genes involved in NF-κB, JNK and MAPK signaling pathways and the expression of inflammatory mediators are modulated by miR-146a expression in TLR2 stimulated microglia
plaindirect- Asserted: passes — The authors put it forward as true.
- Checkable: passes — It can be checked against evidence.
- Load-bearing: passes — The paper’s conclusions depend on it.
- Based: passes — The paper gives a reason why it holds.
It may state two separate claims as one.
A result the paper reports from its own data — it cites no other source for it, so there is none to check. The quote shows it is in the paper.
In the paper
“Our first finding was that in contrast to the rapid and transient induction of transcription of inflammatory mediators such as cytokines IL-6 and TNF, miR-146a expression follows alternate kinetics. MiR-146a was induced at a slower rate, reaching a peak after 24 hours that is maintained even at 48 and 72 hours post-stimulation; time-points when cytokine expression levels have returned to base-line”
§ MicroRNA 146a (miR-146a) Is Over-Expressed during Prion Disease and Modulates the Innate Immune Response and the Microglial Activation State > Discussion
plaincorrelational- Asserted: passes — The authors put it forward as true.
- Checkable: passes — It can be checked against evidence.
- Load-bearing: passes — The paper’s conclusions depend on it.
- Based: passes — The paper gives a reason why it holds.
It may state two separate claims as one.
A result the paper reports from its own data — it cites no other source for it, so there is none to check. The quote shows it is in the paper.
In the paper
“Examination of the ontologies enriched in this set of up-regulated genes showed genes known to play a role in infection processes, including NR3C1, PTPRC, SFRS1, SFRS5, SMAD3, C3 and DDX58.”
§ MicroRNA 146a (miR-146a) Is Over-Expressed during Prion Disease and Modulates the Innate Immune Response and the Microglial Activation State > Results > Transcription of genes involved in NF-κB, JNK and MAPK signaling pathways and the expression of inflammatory mediators are modulated by miR-146a expression in TLR2 stimulated microglia
plaindirect- Asserted: passes — The authors put it forward as true.
- Checkable: passes — It can be checked against evidence.
- Load-bearing: unclear — It is unclear whether the paper’s conclusions depend on it.
- Based: passes — The paper gives a reason why it holds.
The quote only partly states this claim.
A result the paper reports from its own data — it cites no other source for it, so there is none to check. The quote shows it is in the paper.
In the paper
“A number of important transcriptional regulators PAX6, MDM2, JAK2 and SMAS3 were increased, as were some caspases, CASP7 and CASP8, and the apoptotic regulator BCL2L1.”
§ MicroRNA 146a (miR-146a) Is Over-Expressed during Prion Disease and Modulates the Innate Immune Response and the Microglial Activation State > Results > Transcription of genes involved in NF-κB, JNK and MAPK signaling pathways and the expression of inflammatory mediators are modulated by miR-146a expression in TLR2 stimulated microglia
plaindirect- Asserted: passes — The authors put it forward as true.
- Checkable: passes — It can be checked against evidence.
- Load-bearing: unclear — It is unclear whether the paper’s conclusions depend on it.
- Based: passes — The paper gives a reason why it holds.
It may state two separate claims as one. The quote only partly states this claim.
A result the paper reports from its own data — it cites no other source for it, so there is none to check. The quote shows it is in the paper.
In the paper
“Ribosomal proteins were strikingly up-regulated resulting in a significance score in IPA of p = 1.13×10−54, similarly numerous mitochondrial cytochrome C oxidase subunits involved in oxidative phosphorylation were also up-regulated.”
§ MicroRNA 146a (miR-146a) Is Over-Expressed during Prion Disease and Modulates the Innate Immune Response and the Microglial Activation State > Results > Transcription of genes involved in protein synthesis, infection mechanism, immune cell trafficking, oxidative phosphorylation and cellular movement are modulated by miR-146a expression in microglia
plaindirect- Asserted: passes — The authors put it forward as true.
- Checkable: passes — It can be checked against evidence.
- Load-bearing: unclear — It is unclear whether the paper’s conclusions depend on it.
- Based: passes — The paper gives a reason why it holds.
It may state two separate claims as one.
A result the paper reports from its own data — it cites no other source for it, so there is none to check. The quote shows it is in the paper.
In the paper
“One up-regulated cytokine coding gene was IL-10, a negative regulator of cytokine production during the immune response; however, this gene was expressed at very low levels based on the spot intensity observed by microarray and we were unable to detect IL-10 expression by ELISA.”
§ MicroRNA 146a (miR-146a) Is Over-Expressed during Prion Disease and Modulates the Innate Immune Response and the Microglial Activation State > Results > Transcription of genes involved in NF-κB, JNK and MAPK signaling pathways and the expression of inflammatory mediators are modulated by miR-146a expression in TLR2 stimulated microglia
plain- Asserted: passes — The authors put it forward as true.
- Checkable: passes — It can be checked against evidence.
- Load-bearing: unclear — It is unclear whether the paper’s conclusions depend on it.
- Based: passes — The paper gives a reason why it holds.
It may state two separate claims as one.
A result the paper reports from its own data — it cites no other source for it, so there is none to check. The quote shows it is in the paper.
In the paper
“Indeed, we did find a significant number of up-regulated genes at 8 hours (691 annotated genes), with a smaller number (354 annotated genes) up-regulated at 24 hours post stimulation.”
§ MicroRNA 146a (miR-146a) Is Over-Expressed during Prion Disease and Modulates the Innate Immune Response and the Microglial Activation State > Results > Transcription of genes involved in NF-κB, JNK and MAPK signaling pathways and the expression of inflammatory mediators are modulated by miR-146a expression in TLR2 stimulated microglia
plain- Asserted: passes — The authors put it forward as true.
- Checkable: passes — It can be checked against evidence.
- Load-bearing: passes — The paper’s conclusions depend on it.
- Based: passes — The paper gives a reason why it holds.
It may state two separate claims as one.
A result the paper reports from its own data — it cites no other source for it, so there is none to check. The quote shows it is in the paper.
In the paper
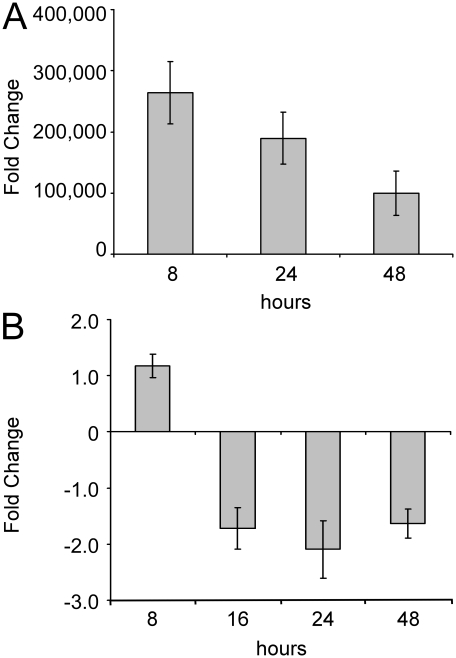
“The mRNA levels of IRAK1 were similarly found to be unchanged in our study, although we measured a small, but significant, down-regulation of TRAF6 gene expression in EOC 13.31 cells transfected with a miR-146a mimic.”
§ MicroRNA 146a (miR-146a) Is Over-Expressed during Prion Disease and Modulates the Innate Immune Response and the Microglial Activation State > Discussion
plaindirect- Asserted: passes — The authors put it forward as true.
- Checkable: passes — It can be checked against evidence.
- Load-bearing: unclear — It is unclear whether the paper’s conclusions depend on it.
- Based: passes — The paper gives a reason why it holds.
It may state two separate claims as one.
A result the paper reports from its own data — it cites no other source for it, so there is none to check. The quote shows it is in the paper.
In the paper
“These included the genes NOS1, NOS2 and NOS3, nitric oxide synthases that are inducible by TLR stimulation and NOX4, a gene involved in H2O2 production. Significantly, the genes CYBA and CYBB proposed to be primary components of the microbicidal oxidase system of phagocytes, were also down-regulated, as was SOD3. SOD1, however, was up-regulated in our work.”
§ MicroRNA 146a (miR-146a) Is Over-Expressed during Prion Disease and Modulates the Innate Immune Response and the Microglial Activation State > Results > Transcription of genes involved in protein synthesis, infection mechanism, immune cell trafficking, oxidative phosphorylation and cellular movement are modulated by miR-146a expression in microglia
plaindirect- Asserted: passes — The authors put it forward as true.
- Checkable: passes — It can be checked against evidence.
- Load-bearing: passes — The paper’s conclusions depend on it.
- Based: passes — The paper gives a reason why it holds.
It may state two separate claims as one.
A result the paper reports from its own data — it cites no other source for it, so there is none to check. The quote shows it is in the paper.
In the paper
“In particular, IL-1B, a key mediator of the inflammatory response, is both down-regulated following miR-146a over-expression and up-regulated after knock-down.”
§ MicroRNA 146a (miR-146a) Is Over-Expressed during Prion Disease and Modulates the Innate Immune Response and the Microglial Activation State > Discussion
plaindirect- Asserted: passes — The authors put it forward as true.
- Checkable: passes — It can be checked against evidence.
- Load-bearing: passes — The paper’s conclusions depend on it.
- Based: passes — The paper gives a reason why it holds.
It may state two separate claims as one.
A result the paper reports from its own data — it cites no other source for it, so there is none to check. The quote shows it is in the paper.
In the paper
“In subsequent studies using TaqMan® qRT-PCR assays we have found that miR-146a is expressed at low levels in laser capture microdissected (LCM) neurons isolated from mouse hippocampus (data not shown)”
§ MicroRNA 146a (miR-146a) Is Over-Expressed during Prion Disease and Modulates the Innate Immune Response and the Microglial Activation State > Discussion
plain- Asserted: passes — The authors put it forward as true.
- Checkable: passes — It can be checked against evidence.
- Load-bearing: fails — The paper’s conclusions may not depend on it.
- Based: passes — The paper gives a reason why it holds.
Probably not a substantial claim. The paper’s conclusions may not depend on it.
A result the paper reports from its own data — it cites no other source for it, so there is none to check. The quote shows it is in the paper.
In the paper
“This includes the down-regulation of the cytokine IL-1B by miR-146a over-expression and up-regulation following knock-down.”
§ MicroRNA 146a (miR-146a) Is Over-Expressed during Prion Disease and Modulates the Innate Immune Response and the Microglial Activation State > Results > Transcription of genes involved in protein synthesis, infection mechanism, immune cell trafficking, oxidative phosphorylation and cellular movement are modulated by miR-146a expression in microglia
plaindirect- Asserted: passes — The authors put it forward as true.
- Checkable: passes — It can be checked against evidence.
- Load-bearing: passes — The paper’s conclusions depend on it.
- Based: passes — The paper gives a reason why it holds.
It may state two separate claims as one.
A result the paper reports from its own data — it cites no other source for it, so there is none to check. The quote shows it is in the paper.
In the paper
“Substantially fewer genes were dysregulated following transfection of miR-146a anti-miR and these were for the most part up-regulated.”
§ MicroRNA 146a (miR-146a) Is Over-Expressed during Prion Disease and Modulates the Innate Immune Response and the Microglial Activation State > Results > Transcription of genes involved in protein synthesis, infection mechanism, immune cell trafficking, oxidative phosphorylation and cellular movement are modulated by miR-146a expression in microglia
plaindirect- Asserted: passes — The authors put it forward as true.
- Checkable: passes — It can be checked against evidence.
- Load-bearing: passes — The paper’s conclusions depend on it.
- Based: passes — The paper gives a reason why it holds.
It may state two separate claims as one. The quote only partly states this claim.
A result the paper reports from its own data — it cites no other source for it, so there is none to check. The quote shows it is in the paper.
In the paper
“Firstly, we confirmed that miR-146a is over-expressed in the brain's of mice during scrapie infection and that this expression is, most likely, highly enriched in cells of microglial origin based on miRNA expression profiling of various brain-derived cell lines.”
§ MicroRNA 146a (miR-146a) Is Over-Expressed during Prion Disease and Modulates the Innate Immune Response and the Microglial Activation State > Discussion
hedgedcorrelational- Asserted: passes — The authors put it forward as true.
- Checkable: passes — It can be checked against evidence.
- Load-bearing: passes — The paper’s conclusions depend on it.
- Based: passes — The paper gives a reason why it holds.
It may state two separate claims as one.
A result the paper reports from its own data — it cites no other source for it, so there is none to check. The quote shows it is in the paper.
In the paper
“Interestingly, IL-1B appeared to be tightly regulated by miR-146a; its expression is decreased following transfection of the miR-146a mimic and increased following knock-down with an anti-miR in both resting and TLR-stimulated cells.”
§ MicroRNA 146a (miR-146a) Is Over-Expressed during Prion Disease and Modulates the Innate Immune Response and the Microglial Activation State > Discussion
hedgeddirect- Asserted: passes — The authors put it forward as true.
- Checkable: passes — It can be checked against evidence.
- Load-bearing: passes — The paper’s conclusions depend on it.
- Based: passes — The paper gives a reason why it holds.
It may state two separate claims as one.
What the paper did — it cites no source for this, so there is none to check. The quote shows it is in the paper.
In the paper
“Over-expression was achieved by transfecting 30 nM of miR-146a mimic (Figure 4A).”
§ MicroRNA 146a (miR-146a) Is Over-Expressed during Prion Disease and Modulates the Innate Immune Response and the Microglial Activation State > Results > Transcription of genes involved in protein synthesis, infection mechanism, immune cell trafficking, oxidative phosphorylation and cellular movement are modulated by miR-146a expression in microglia
plaindirect- Asserted: passes — The authors put it forward as true.
- Checkable: passes — It can be checked against evidence.
- Load-bearing: passes — The paper’s conclusions depend on it.
- Based: passes — The paper gives a reason why it holds.
Probably not a substantial claim.
What the paper did — it cites no source for this, so there is none to check. The quote shows it is in the paper.
In the paper
“All procedures involving live animals were approved by the Canadian Science Centre for Human and Animal Health - Animal Care Committee (CSCHAH-ACC).”
§ MicroRNA 146a (miR-146a) Is Over-Expressed during Prion Disease and Modulates the Innate Immune Response and the Microglial Activation State > Materials and Methods > Ethics statement
plain- Asserted: passes — The authors put it forward as true.
- Checkable: passes — It can be checked against evidence.
- Load-bearing: fails — The paper’s conclusions may not depend on it.
- Based: passes — The paper gives a reason why it holds.
Probably not a substantial claim. The paper’s conclusions may not depend on it.
What the paper did — it cites no source for this, so there is none to check. The quote shows it is in the paper.
In the paper
“MiRNA expression was normalized to the U6 snRNA level which was expressed at high levels with negligible variance under the experimental conditions used in our study.”
§ MicroRNA 146a (miR-146a) Is Over-Expressed during Prion Disease and Modulates the Innate Immune Response and the Microglial Activation State > Materials and Methods > RNA isolation and miRNA quantitative real time-PCR (qRT-PCR)
plain- Asserted: passes — The authors put it forward as true.
- Checkable: passes — It can be checked against evidence.
- Load-bearing: passes — The paper’s conclusions depend on it.
- Based: passes — The paper gives a reason why it holds.
Probably not a substantial claim. It may state two separate claims as one.
A claim is checked only against the cited paper’s full text, never its abstract, and none is available for its sources.
In the paper
“Un-methylated CpG DNA, which is an agonist of TLR9 signaling, has been shown to prolong the scrapie incubation period in mice, suggesting that innate immune activation can interfere with prion disease progression [9], [10].”
§ MicroRNA 146a (miR-146a) Is Over-Expressed during Prion Disease and Modulates the Innate Immune Response and the Microglial Activation State > Introduction
What the sources say
- Not checked — no full text of the sourcecites [9] S Sethi, 2002, Postexposure prophylaxis against prion disease with a stimulator of innate immunity., Lancet source
- Not checked — no full text of the sourcecites [10] DS Spinner, 2007, CpG oligodeoxynucleotide-enhanced humoral immune response and production of antibodies to prion protein PrPSc in mice immunized with 139A scrapie-associated fibrils., J Leukoc Biol source
plaindirect- Asserted: passes — The authors put it forward as true.
- Checkable: passes — It can be checked against evidence.
- Load-bearing: fails — The paper’s conclusions may not depend on it.
- Based: passes — The paper gives a reason why it holds.
Probably not a substantial claim. The paper’s conclusions may not depend on it.
A conclusion the paper draws from its own results — it cites no other source for it, so there is none to check. The quote shows it is in the paper.
In the paper
“Signaling pathways involving NF-κB, JNK and MAPK are implicated in Figure 6B.”
§ MicroRNA 146a (miR-146a) Is Over-Expressed during Prion Disease and Modulates the Innate Immune Response and the Microglial Activation State > Results > Transcription of genes involved in NF-κB, JNK and MAPK signaling pathways and the expression of inflammatory mediators are modulated by miR-146a expression in TLR2 stimulated microglia
plaincorrelational- Asserted: passes — The authors put it forward as true.
- Checkable: passes — It can be checked against evidence.
- Load-bearing: passes — The paper’s conclusions depend on it.
- Based: passes — The paper gives a reason why it holds.
The quote only partly states this claim.
A conclusion the paper draws from its own results — it cites no other source for it, so there is none to check. The quote shows it is in the paper.
In the paper
“This data implies that TLR2-signaling is not essential to the disease process and that our model may not mimic processes that occur during disease.”
§ MicroRNA 146a (miR-146a) Is Over-Expressed during Prion Disease and Modulates the Innate Immune Response and the Microglial Activation State > Discussion
hedged- Asserted: passes — The authors put it forward as true.
- Checkable: passes — It can be checked against evidence.
- Load-bearing: passes — The paper’s conclusions depend on it.
- Based: passes — The paper gives a reason why it holds.
It may state two separate claims as one.
- Rests on an assumption: MyD88 is the main adaptor protein implicated in TLR signaling and is considered essential for the induction of inflammatory cytokines triggered by most TLRs, including TLR2.
In the paper
“Conversely, we found a small number of genes to increase in expression upon transfection of a miR-146a mimic. One of these was IL-10, an anti-inflammatory cytokine that can down-regulate the expression of cytokines, MHC class II molecules, and co-stimulatory molecules on macrophages, and has been found to be up-regulated in human patients with CJD [50].”
§ MicroRNA 146a (miR-146a) Is Over-Expressed during Prion Disease and Modulates the Innate Immune Response and the Microglial Activation State > Discussion
What the sources say
- Not checked — no full text of the sourcecites [50] K Stoeck, 2006, Pro- and anti-inflammatory cytokines in the CSF of patients with creutzfeldt-jakob disease., J Neuroimmunol source
plaincorrelational- Asserted: passes — The authors put it forward as true.
- Checkable: passes — It can be checked against evidence.
- Load-bearing: fails — The paper’s conclusions may not depend on it.
- Based: passes — The paper gives a reason why it holds.
Probably not a substantial claim. The paper’s conclusions may not depend on it.
A conclusion the paper draws from its own results — it cites no other source for it, so there is none to check. The quote shows it is in the paper.
In the paper
“In terms of prion disease this suggests the considerable increase in expression of TLR2 observed at clinical stages of prion disease could be indicative of the accumulation of microglia that are not in an activation state that is optimal for phagocytosis. This could therefore contribute to defective clearing of debris and prion accumulation during later stages of disease.”
§ MicroRNA 146a (miR-146a) Is Over-Expressed during Prion Disease and Modulates the Innate Immune Response and the Microglial Activation State > Discussion
hedgedconditional- Asserted: passes — The authors put it forward as true.
- Checkable: passes — It can be checked against evidence.
- Load-bearing: passes — The paper’s conclusions depend on it.
- Based: passes — The paper gives a reason why it holds.
It may state two separate claims as one.
- Rests on an assumption: A reduction in TLR2 expression is linked with an increase in phagocytosis, implying an inverse relation between TLR2 expression and phagocytic activity.
In the paper
“Cells lacking these receptors could not initiate a Src-Vav-Rac signaling cascade required to stimulate phagocytosis of amyloid beta deposits [45].”
§ MicroRNA 146a (miR-146a) Is Over-Expressed during Prion Disease and Modulates the Innate Immune Response and the Microglial Activation State > Discussion
What the sources say
- Not checked yetcites [45] GE Landreth, 2009, Toll-like receptors in alzheimer's disease., Curr Top Microbiol Immunol
plaindirect- Asserted: passes — The authors put it forward as true.
- Checkable: passes — It can be checked against evidence.
- Load-bearing: fails — The paper’s conclusions may not depend on it.
- Based: passes — The paper gives a reason why it holds.
Probably not a substantial claim. The paper’s conclusions may not depend on it.
In the paper
“Interestingly TLR2, and TLR7 which was also up-regulated in our prion model, has also been shown to display profoundly increased expression levels in APP transgenic mice that accumulate amyloid deposits in their brain [40].”
§ MicroRNA 146a (miR-146a) Is Over-Expressed during Prion Disease and Modulates the Innate Immune Response and the Microglial Activation State > Discussion
What the sources say
- Not checked — no full text of the sourcecites [40] M Letiembre, 2009, Screening of innate immune receptors in neurodegenerative diseases: A similar pattern., Neurobiol Aging source
boostedcorrelational- Asserted: passes — The authors put it forward as true.
- Checkable: passes — It can be checked against evidence.
- Load-bearing: fails — The paper’s conclusions may not depend on it.
- Based: passes — The paper gives a reason why it holds.
Probably not a substantial claim. The paper’s conclusions may not depend on it.
A claim is checked only against the cited paper’s full text, never its abstract, and none is available for its sources.
In the paper
“It has also been reported by others that TLR 2, 4, and 9 signaling modulates phacogytosis and clearance of neurotoxic amyloid deposition in neurodegenerative diseases, perhaps by MyD88 independent signaling pathways [43], [55].”
§ MicroRNA 146a (miR-146a) Is Over-Expressed during Prion Disease and Modulates the Innate Immune Response and the Microglial Activation State > Discussion
What the sources say
- Not checked — no full text of the sourcecites [43] P Iribarren, 2005, CpG-containing oligodeoxynucleotide promotes microglial cell uptake of amyloid beta 1–42 peptide by up-regulating the expression of the G-protein- coupled receptor mFPR2., FASEB J source
- Not checked — no full text of the sourcecites [55] K Tahara, 2006, Role of toll-like receptor signalling in abeta uptake and clearance., Brain source
hedgedconditional- Asserted: passes — The authors put it forward as true.
- Checkable: passes — It can be checked against evidence.
- Load-bearing: fails — The paper’s conclusions may not depend on it.
- Based: passes — The paper gives a reason why it holds.
Probably not a substantial claim. The paper’s conclusions may not depend on it.
What the paper did — it cites no source for this, so there is none to check. The quote shows it is in the paper.
In the paper
“confirming very high reproducibility of the microarray data.”
§ MicroRNA 146a (miR-146a) Is Over-Expressed during Prion Disease and Modulates the Innate Immune Response and the Microglial Activation State > Results > Transcription of genes involved in NF-κB, JNK and MAPK signaling pathways and the expression of inflammatory mediators are modulated by miR-146a expression in TLR2 stimulated microglia
boosted- Asserted: passes — The authors put it forward as true.
- Checkable: passes — It can be checked against evidence.
- Load-bearing: fails — The paper’s conclusions may not depend on it.
- Based: passes — The paper gives a reason why it holds.
Probably not a substantial claim. The paper’s conclusions may not depend on it.
A conclusion the paper draws from its own results — it cites no other source for it, so there is none to check. The quote shows it is in the paper.
In the paper
“They are also highly related based on potential interactions identified using the IPA tool, potentially a co-ordinately regulated gene set.”
§ MicroRNA 146a (miR-146a) Is Over-Expressed during Prion Disease and Modulates the Innate Immune Response and the Microglial Activation State > Results > Transcription of genes involved in NF-κB, JNK and MAPK signaling pathways and the expression of inflammatory mediators are modulated by miR-146a expression in TLR2 stimulated microglia
hedgedcorrelational- Asserted: passes — The authors put it forward as true.
- Checkable: passes — It can be checked against evidence.
- Load-bearing: fails — The paper’s conclusions may not depend on it.
- Based: passes — The paper gives a reason why it holds.
Probably not a substantial claim. The paper’s conclusions may not depend on it. It may state two separate claims as one.
- The authors state this as an assumption: Most translational repression is accompanied by miRNA-mediated mRNA degradation.
- Rests on an assumption: Direct targets of miR-146a important in immune activation are likely to be those found at the intersection of genes up-regulated following knock-down and down-regulated after over-expression, provided they exhibit altered expression detectable at the mRNA level.
A conclusion the paper draws from its own results — it cites no other source for it, so there is none to check. The quote shows it is in the paper.
In the paper
“In addition, NOS2, QK1 and BCL2L1 are also predicted from this study as being strong candidates for targeting by miR-146a that have not previously been described.”
§ MicroRNA 146a (miR-146a) Is Over-Expressed during Prion Disease and Modulates the Innate Immune Response and the Microglial Activation State > Results > Transcription of genes involved in NF-κB, JNK and MAPK signaling pathways and the expression of inflammatory mediators are modulated by miR-146a expression in TLR2 stimulated microglia
boostedcorrelational- Asserted: passes — The authors put it forward as true.
- Checkable: passes — It can be checked against evidence.
- Load-bearing: unclear — It is unclear whether the paper’s conclusions depend on it.
- Based: passes — The paper gives a reason why it holds.
It may state two separate claims as one.
- The authors state this as an assumption: Most translational repression is accompanied by miRNA-mediated mRNA degradation.
- Rests on an assumption: Direct targets of miR-146a important in immune activation are likely to be those found at the intersection of genes up-regulated following knock-down and down-regulated after over-expression, provided they exhibit altered expression detectable at the mRNA level.
In the paper
“Landreth and Reed-Geaghan (2009) have also shown that the response of microglia to fibrillar Aβ is reliant upon the expression of TLR4, TLR2 and the co-receptor CD14 to activate intracellular signaling [45].”
§ MicroRNA 146a (miR-146a) Is Over-Expressed during Prion Disease and Modulates the Innate Immune Response and the Microglial Activation State > Discussion
What the sources say
- Not checked yetcites [45] GE Landreth, 2009, Toll-like receptors in alzheimer's disease., Curr Top Microbiol Immunol
boosteddirect- Asserted: passes — The authors put it forward as true.
- Checkable: passes — It can be checked against evidence.
- Load-bearing: fails — The paper’s conclusions may not depend on it.
- Based: passes — The paper gives a reason why it holds.
Probably not a substantial claim. The paper’s conclusions may not depend on it.
In the paper
“SMAD3 knock-out mice exhibit alterations in many aspects of glial function, including altered scar formation and immune response to injury [51]. Fewer neutrophils, macrophages/microglia, NG2-positive cells and GFAP-positive cells were reported around lesions in Smad3 null mice brains.”
§ MicroRNA 146a (miR-146a) Is Over-Expressed during Prion Disease and Modulates the Innate Immune Response and the Microglial Activation State > Discussion
What the sources say
- Not checked — no full text of the sourcecites [51] Y Wang, 2007, Smad3 null mice display more rapid wound closure and reduced scar formation after a stab wound to the cerebral cortex., Exp Neurol source
plaindirect- Asserted: passes — The authors put it forward as true.
- Checkable: passes — It can be checked against evidence.
- Load-bearing: passes — The paper’s conclusions depend on it.
- Based: passes — The paper gives a reason why it holds.
It may state two separate claims as one.
A conclusion the paper draws from its own results — it cites no other source for it, so there is none to check. The quote shows it is in the paper.
In the paper
“Not only are genes involved in cytokine and other aspects of the inflammatory response regulated by its expression, but we found in this study that genes involved in morphological changes that accompany activation, chemotaxis and oxidative burst-related genes may also be targets for either direct or indirect miR-146a regulation.”
§ MicroRNA 146a (miR-146a) Is Over-Expressed during Prion Disease and Modulates the Innate Immune Response and the Microglial Activation State > Discussion
hedgedconditional- Asserted: passes — The authors put it forward as true.
- Checkable: passes — It can be checked against evidence.
- Load-bearing: passes — The paper’s conclusions depend on it.
- Based: passes — The paper gives a reason why it holds.
It may state two separate claims as one.
A conclusion the paper draws from its own results — it cites no other source for it, so there is none to check. The quote shows it is in the paper.
In the paper
“This discrepancy is very likely multi-factorial and contributing factors include, but are certainly not limited to, lack of multiple cell types and associated cell-to-cell signaling in in vitro culture, lack of normal cellular functions under in vitro conditions, and also the time required for disease progression, which is often months to years in whole organism/animal.”
§ MicroRNA 146a (miR-146a) Is Over-Expressed during Prion Disease and Modulates the Innate Immune Response and the Microglial Activation State > Discussion
hedgedconditional- Asserted: passes — The authors put it forward as true.
- Checkable: passes — It can be checked against evidence.
- Load-bearing: passes — The paper’s conclusions depend on it.
- Based: passes — The paper gives a reason why it holds.
It may state two separate claims as one.
What the paper did — it cites no source for this, so there is none to check. The quote shows it is in the paper.
In the paper
“Transfected anti-miRs or mimics were stably detected over a 24–48 hour period post transfection; therefore cells were transfected and allowed to recover overnight, thus reducing the likelihood of differential expression induced by the transfection process, prior to stimulation.”
§ MicroRNA 146a (miR-146a) Is Over-Expressed during Prion Disease and Modulates the Innate Immune Response and the Microglial Activation State > Results > Transcription of genes involved in NF-κB, JNK and MAPK signaling pathways and the expression of inflammatory mediators are modulated by miR-146a expression in TLR2 stimulated microglia
plain- Asserted: passes — The authors put it forward as true.
- Checkable: passes — It can be checked against evidence.
- Load-bearing: passes — The paper’s conclusions depend on it.
- Based: passes — The paper gives a reason why it holds.
Probably not a substantial claim.
The paper relies on this without support.
PrPSc induces inflammatory responses by the brain's glial cells (astrocytes and microglia) by activating innate immunity pathways.
“PrPSc induces inflammatory responses by the brain's glial cells (astrocytes and microglia) by activating innate immunity pathways.”
The paper relies on this without support.
The microglial surface receptor that is engaged leading to activation during prion pathogenesis is unknown.
“MiR-146a is reported to be up-regulated in LPS stimulated human macrophages, however, the microglial surface receptor that is engaged leading to activation during prion pathogenesis is unknown [16].”
The paper relies on this without support.
The specific stimuli and signaling pathways that lead to modulations of microglial functions, and the mechanisms by which microglial activation influences chronic neurodegeneration, are as yet unknown.
“The specific stimuli and signaling pathways that lead to these modulations of functions, and the mechanisms by which microglial activation influences chronic neurodegeneration, are as yet unknown.”
The paper relies on this without support.
Whether activation of the innate immune response is beneficial or harmful in prion-like pathologies is still unknown.
“Such an inflammatory milieu has been recognized in the prion infected brain for some time; however, whether the activation of this innate immune response is beneficial or harmful in prion-like pathologies is still unknown.”
The authors state this as an assumption.
Most translational repression is accompanied by miRNA-mediated mRNA degradation.
“It has been previously reported that most translational repression is accompanied by miRNA-mediated mRNA degradation, we therefore used this assumption to predict potential direct targets of miR-146a in this system [34], [35].”
The paper relies on this without support.
Direct targets of miR-146a important in immune activation are likely to be those found at the intersection of genes up-regulated following knock-down and down-regulated after over-expression, provided they exhibit altered expression detectable at the mRNA level.
“Direct targets of miR-146a important in immune activation are likely to be those found at the intersection of genes that are up-regulated following knock-down and down-regulated after over-expression, provided that they exhibit altered expression that is detectable at the mRNA level.”
The paper relies on this without support.
Microglial cells respond to prion deposition by converting from a resting to an activated phenotype, but synthesize low levels of pro-inflammatory cytokines.
“Microglial cells, the brain's resident immune effector cells, respond to prion deposition by the conversion of a resting phenotype into one that is ‘activated’. However, although they take on an activated phenotype they synthesize fairly low levels of pro-inflammatory cytokines”
The paper relies on this without support.
Phenotypic changes in microglia are one of the earliest apparent alterations in tissue pathology detectable during prion disease.
“However, it is clear that phenotypic changes in microglia are one of the earliest apparent alterations in tissue pathology detectable during disease.”
The paper relies on this without support.
The in vivo transcriptional response likely represents the host's response to the process of neurodegeneration as much, if not more than, the response specifically to prions.
“It is often speculated that the in vivo transcriptional response likely represents the host's response to the process of neurodegeneration as much, if not more than, the response specifically to prions, which may account for our inability to detect a robust miR-146a induction in the cultured microglia.”
The paper relies on this without support.
Effector molecules downstream of multiple cell surface receptors, including TLR2 and TLR4 signals, are similar.
“However, effector molecules downstream of multiple cell surface receptors, including TLR2 (and TLR4) signals, are similar”
The paper relies on this without support.
A reduction in TLR2 expression is linked with an increase in phagocytosis, implying an inverse relation between TLR2 expression and phagocytic activity.
“Studies also link a reduction in TLR2 expression with an increase in phagocytosis, implying an inverse relation between TLR2 expression and phagocytic activity.”
The paper relies on this without support.
MyD88 is the main adaptor protein implicated in TLR signaling and is considered essential for the induction of inflammatory cytokines triggered by most TLRs, including TLR2.
“MyD88 is the main adaptor protein implicated in TLR signaling and is considered essential for the induction of inflammatory cytokines triggered by most TLRs, including TLR2.”
Claims other papers make about this one
Each is checked against this paper’s own text: does it say what the citing paper says it does?
The source backs part of the claim, not all of it — or backs it for a different population, condition or comparison.
In the citing paper
“MiR-146a is also elevated in reactive astrocytes in AD and is generally considered a compensatory anti-inflammatory regulator.”
From Cell-specific MicroRNA networks orchestrate the pathogenesis of Alzheimer’s disease (2026) · cites this paper as Saba et al., 2012
Experimental — accuracy not yet measuredThe source backs part of the claim, not all of it — or backs it for a different population, condition or comparison.
In the citing paper
“MiR-146a serves as a classical NF-κB–induced negative-feedback regulator. Elevated miR-146a in microglia acts to inhibit IRAK1 and TRAF6 (Fan et al., 2020; Lukiw et al., 2008; Saba et al., 2012; Saba et al., 2014).”
From Cell-specific MicroRNA networks orchestrate the pathogenesis of Alzheimer’s disease (2026) · cites this paper as Saba et al., 2012
Experimental — accuracy not yet measuredThe source backs part of the claim, not all of it — or backs it for a different population, condition or comparison.
In the citing paper
“Thus, miR-155 and miR-146a were shown to increase in the microglial cells in response to stimulation with Lipopolysaccharides (LPS) and Polyinosinic-polycytidylic acid (poly(I:C), respectively, and they seem to play a fundamental role in the microglial inflammatory profile [13,14].”
From miR-155 induction in microglial cells suppresses Japanese encephalitis virus replication and negatively modulates innate immune responses (2014) · cites this paper as [14]
Experimental — accuracy not yet measuredThe cited source says what the claim attributes to it.
In the citing paper
“LPS induced an upregulation of miR-146a in BV-2 and EOC 13.31 microglial cell lines (43), as well as in primary microglia cells (44).”
From Absence of miRNA-146a Differentially Alters Microglia Function and Proteome (2020) · cites this paper as [43]
Self-check
Percentages, sums and reported differences re-computed from the paper’s own numbers.
Each contradiction between two passages listed here was confirmed by an independent check.
Rated minor: it would not touch a result — a value no result rests on, a p-value that stays on the same side of the significance level, or a conflict that is clerical, resolved elsewhere in the paper, or outside its own findings.
In the paper
§ MicroRNA 146a (miR-146a) Is Over-Expressed during Prion Disease and Modulates the Innate Immune Response and the Microglial Activation State > Discussion
“Other significant alterations in expression include downstream mediators of the pro-inflammatory transcription factor, nuclear factor-kappa B (NF-κB) and the JAK-STAT signaling pathway (Figure 4B).”
§ MicroRNA 146a (miR-146a) Is Over-Expressed during Prion Disease and Modulates the Innate Immune Response and the Microglial Activation State > Results > Transcription of genes involved in protein synthesis, infection mechanism, immune cell trafficking, oxidative phosphorylation and cellular movement are modulated by miR-146a expression in microglia
“B. MiR-146a knock-down as measured by TaqMan® qRT-PCR in microglia cells after 8, 24, and 48 hrs of treatment with 50 nM (previously optimized, data not shown) of transfected anti-miR-146a in comparison to 50 nM of transfected scrambled negative control miRNA.”
Rated minor: it would not touch a result — a value no result rests on, a p-value that stays on the same side of the significance level, or a conflict that is clerical, resolved elsewhere in the paper, or outside its own findings.
In the paper
§ MicroRNA 146a (miR-146a) Is Over-Expressed during Prion Disease and Modulates the Innate Immune Response and the Microglial Activation State > Results > Transcription of genes involved in NF-κB, JNK and MAPK signaling pathways and the expression of inflammatory mediators are modulated by miR-146a expression in TLR2 stimulated microglia
“A significant number of genes were de-regulated under these conditions, 22 (3 down-regulated, 19 up-regulated) at 8 hours post transfection and 977 (778 down-regulated, 199 up-regulated) at 24 hours.”
§ MicroRNA 146a (miR-146a) Is Over-Expressed during Prion Disease and Modulates the Innate Immune Response and the Microglial Activation State > Results > Transcription of genes involved in NF-κB, JNK and MAPK signaling pathways and the expression of inflammatory mediators are modulated by miR-146a expression in TLR2 stimulated microglia
“Similarly, over-expression of miR-146a was achieved by transfection of a miRNA mimic and LPS stimulation was performed 24 hours later, followed by transcriptional analysis at 8 and 24 hours.”
Rated minor: it would not touch a result — a value no result rests on, a p-value that stays on the same side of the significance level, or a conflict that is clerical, resolved elsewhere in the paper, or outside its own findings.
In the paper
§ MicroRNA 146a (miR-146a) Is Over-Expressed during Prion Disease and Modulates the Innate Immune Response and the Microglial Activation State > Results > The microglial surface receptor, TLR2, is significantly induced in the brain's of prion infected mice
“The only other TLRs we determined to be significantly up-regulated were TLR1 and TLR7.”
§ MicroRNA 146a (miR-146a) Is Over-Expressed during Prion Disease and Modulates the Innate Immune Response and the Microglial Activation State > Results > The microglial surface receptor, TLR2, is significantly induced in the brain's of prion infected mice
“| TLR1 | 10.9 | 0.081 |”
Rated minor: it would not touch a result — a value no result rests on, a p-value that stays on the same side of the significance level, or a conflict that is clerical, resolved elsewhere in the paper, or outside its own findings.
In the paper
§ MicroRNA 146a (miR-146a) Is Over-Expressed during Prion Disease and Modulates the Innate Immune Response and the Microglial Activation State > Results > The microglial surface receptor, TLR2, is significantly induced in the brain's of prion infected mice
“Other receptors including Fc (FCGR1 and FCGR3) and complement receptors (ITGAM and ITGAX), as well as TREM2 a myeloid specific receptor triggered by amyloid to promote active phagocytosis, were also found to be over-expressed.”
§ MicroRNA 146a (miR-146a) Is Over-Expressed during Prion Disease and Modulates the Innate Immune Response and the Microglial Activation State > Results > The microglial surface receptor, TLR2, is significantly induced in the brain's of prion infected mice
“| FCGR1 | 24.5 | 0.003 | | FCGR2 | 4.4 | 0.047 |”
Citations
Cites
Bartel (2004) · doi:10.1016/s0092-8674(04)00045-5 · Cited by 34,714
MicroRNAs: Target Recognition and Regulatory Functions
Bartel, D. P. (2009) · Cell · doi:10.1016/j.cell.2009.01.002 · Cited by 20,068
In silico prediction of protein-protein interactions in human macrophages
Souiai, O., Guerfali, F. Z., Miled, S. B., Brun, C., & Benkahla, A. (2014) · BMC Research Notes · doi:10.1186/1756-0500-7-157 · Cited by 10,785
Significance analysis of microarrays applied to the ionizing radiation response
Tusher, V. G., Tibshirani, R., & Chu, G. (2001) · Proceedings of the National Academy of Sciences · doi:10.1073/pnas.091062498 · Cited by 10,568
Akira, S., & Takeda, K. (2004) · Nature reviews. Immunology · doi:10.1038/nri1391 · Cited by 8,312
Defective LPS Signaling in C3H/HeJ and C57BL/10ScCr Mice: Mutations in Tlr4 Gene
Poltorak, A., He, X., Smirnova, I., Liu, M.-Y., Huffel, C. V., Du, X., Birdwell, D., Alejos, E., Silva, M., Galanos, C., et al. (1998) · Science · doi:10.1126/science.282.5396.2085 · Cited by 7,631
Prusiner, S. B. (1998) · Proceedings of the National Academy of Sciences · doi:10.1073/pnas.95.23.13363 · Cited by 5,373
Taganov, K. D., Boldin, M. P., Chang, K.-J., & Baltimore, D. (2006) · Proceedings of the National Academy of Sciences · doi:10.1073/pnas.0605298103 · Cited by 4,317
Mammalian microRNAs predominantly act to decrease target mRNA levels
Guo, H., Ingolia, N. T., Weissman, J. S., & Bartel, D. P. (2010) · Nature · doi:10.1038/nature09267 · Cited by 3,886
The impact of microRNAs on protein output
Baek, D., Villén, J., Shin, C., Camargo, F. D., Gygi, S. P., & Bartel, D. P. (2008) · Nature · doi:10.1038/nature07242 · Cited by 3,592
Cited by
Sorted by citations
Bellingham, S. A., Coleman, B. M., & Hill, A. F. (2012) · Nucleic Acids Research · doi:10.1093/nar/gks832 · Cited by 461
Roles of microglia in brain development, tissue maintenance and repair
Michell‐Robinson, M. A., Touil, H., Healy, L. M., Owen, D. R., Durafourt, B. A., Bar‐Or, A., Antel, J. P., & Moore, C. S. (2015) · Brain · doi:10.1093/brain/awv066 · Cited by 435
MicroRNA-146a: A Dominant, Negative Regulator of the Innate Immune Response
Saba, R., Sorensen, D. L., & Booth, S. A. (2014) · Frontiers in Immunology · doi:10.3389/fimmu.2014.00578 · Cited by 427
Self-citationExosomes: Vehicles for the Transfer of Toxic Proteins Associated with Neurodegenerative Diseases?
Bellingham, S. A., Guo, B. B., Coleman, B. M., & Hill, A. F. (2012) · Frontiers in Physiology · doi:10.3389/fphys.2012.00124 · Cited by 412
Singh, S., & Singh, T. G. (2020) · Current Neuropharmacology · doi:10.2174/1570159x18666200207120949 · Cited by 307
Metadata
- Authors
- Saba, R., Gushue, S., Huzarewich, R. L. C. H., Manguiat, K., Medina, S., Robertson, C., & Booth, S. A.
- Affiliations
- Public Health Agency of Canada (CA)
- Corresponding author
- Booth, Stephanie A.
- Venue
- PLoS ONE
- Publisher
- Public Library of Science (PLoS)
- Published
- 2012-02-17
- Volume
- 7
- Issue
- 2
- Pages
- e30832
- ISSN
- 1932-6203 (ISSN-L)
- PMC
- PMC3281888
- OpenAlex
- W2084713640
- Semantic Scholar
- 12a9d810cdceb96df038db57ecb7ad335db78d45
- Cited by
- 151
- References
- 57
- Citations by year
- 2026: 4 · 2025: 5 · 2024: 4 · 2023: 4 · 2022: 10 · 2021: 10 · 2020: 13 · 2019: 9 · 2018: 13 · 2017: 15 · 2016: 11 · 2015: 16 · 2014: 14 · 2013: 16 · 2012: 7
- FWCI
- 8.04
- Type
- journal article
- Language
- en
- Open access
- gold
- doi.org
- Locations
- PLoS ONE (publishedVersion, cc-by)
- Europe PMC (PubMed Central) (publishedVersion, cc-by)
- PubMed Central (publishedVersion, cc-by)
- PubMed (publishedVersion)
- DOAJ (DOAJ: Directory of Open Access Journals) (submittedVersion)
- Funders
- Public Health Agency of Canada
- Public Health Agency
- Topics
- Life Sciences › Neuroscience › Neurology › Neuroinflammation and Neurodegeneration Mechanisms
- Life Sciences › Biochemistry, Genetics and Molecular Biology › Molecular Biology › Prion Diseases and Protein Misfolding
- Life Sciences › Biochemistry, Genetics and Molecular Biology › Cancer Research › MicroRNA in disease regulation
- Keywords
- miR-146a, prion disease, microglial activation, innate immune response, TLR2, TLR4, NF-κB signaling, JAK/STAT signaling, neuroinflammation, respiratory burst
- MeSH terms
- Animals, Brain, Cell Line, Cell Movement, Immunity, Innate, Kinetics, Lipopolysaccharides, Oxidative Phosphorylation, Prions, Time Factors, Transcription, Genetic, Protein Biosynthesis, Signal Transduction, Up-Regulation, Cluster Analysis, Cytokines, Prion Diseases, Microglia, Inflammation Mediators, Gene Expression Profiling, MicroRNAs, Toll-Like Receptor 2, Toll-Like Receptor 4, Mice
About these checks
Registry, retraction, Cites and statistics results are computed, not judged, with one exception: a printed reference that no index lists is read once by a model before it counts as a citation error. Claims are extracted by a model and kept only when their quote appears verbatim in the text; each cited source is then checked, with a model’s help, for whether it says what the claim relies on. Those verdicts can be wrong — read the claim’s quote and the cited source before relying on one.
A language model drew the claims from the paper on 2026-11-06, under version 3 of the claim definition (model deepseek-v4.1-flash, prompt extract-v3).
A second model labelled each claim on 2026-11-06 (model jev-1.13-20260917, definition revision gold-guideline-v0.2).
Cited sources are checked with a language model’s help (gpt-6-sol).
Statistics and arithmetic are recomputed, not judged.
Confidence bands are shown only for fields calibrated on our annotated test set. None is calibrated yet, so no band is shown.
What counts as a claim ›How we measure confidence ›How we check this ›
Are you an author, or do you see a problem with this page? Request a review
