

The DOI matches its Crossref record; 62 of the 62 references it cites were found in a registry or an index.
White Matter Development in Early Puberty: A Longitudinal Volumetric and Diffusion Tensor Imaging Twin Study
Open accessAbstract
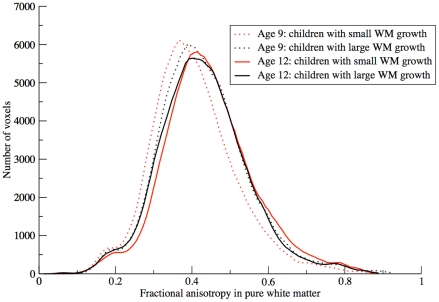
White matter microstructure and volume show synchronous developmental patterns in children. White matter volume increases considerably during development. Fractional anisotropy, a measure for white matter microstructural directionality, also increases with age. Development of white matter volume and development of white matter microstructure seem to go hand in hand. The extent to which the same or different genetic and/or environmental factors drive these two aspects of white matter maturation is currently unknown. We mapped changes in white matter volume, surface area and diffusion parameters in mono- and dizygotic twins who were scanned at age 9 (203 individuals) and again at age 12 (126 individuals). Over the three-year interval, white matter volume (+6.0%) and surface area (+1.7%) increased, fiber bundles expanded (most pronounced in the left arcuate fasciculus and splenium), and fractional anisotropy increased (+3.0%). Genes influenced white matter volume (heritability ~85%), surface area (~85%), and fractional anisotropy (locally 7% to 50%) at both ages. Finally, volumetric white matter growth was negatively correlated with fractional anisotropy increase (r = -0.62) and this relationship was driven by environmental factors. In children who showed the most pronounced white matter growth, fractional anisotropy increased the least and vice-versa. Thus, white matter development in childhood may reflect a process of both expansion and fiber optimization.
Overview
The claims and statistics of this paper haven’t been checked yet.
Run the check — free, no account needed. It reads the open-access text and checks the sources it cites.
Integrity signals
Registry
Cites
Statistics
Figures
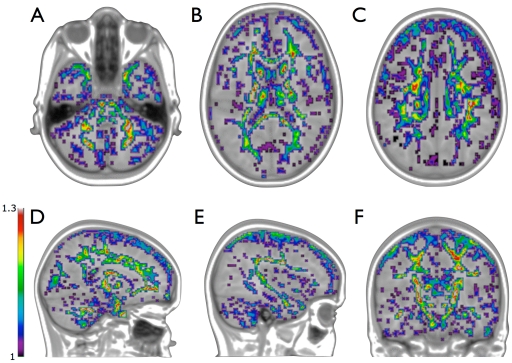
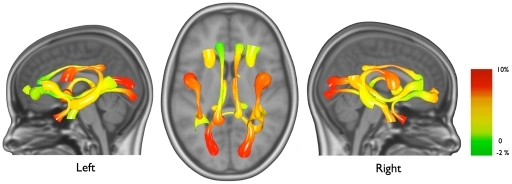
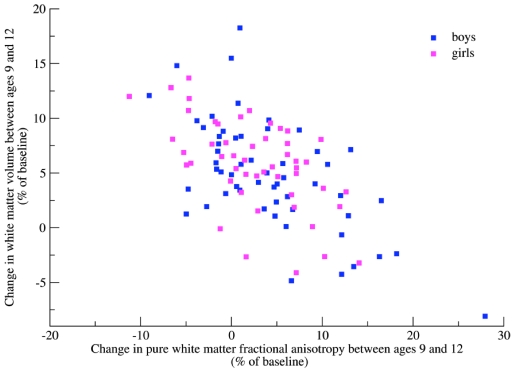
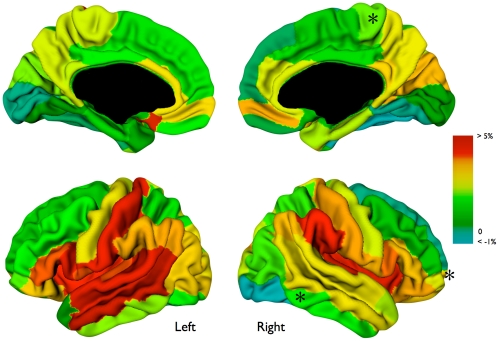
Verification
Claims the paper makes
The claims and statistics of this paper haven’t been checked yet.
Run the check — free, no account needed. It reads the open-access text and checks the sources it cites.
Claims other papers make about this one
Each is checked against this paper’s own text: does it say what the citing paper says it does?
In the citing paper
“white-matter microstructure, as represented by FA, is generally highly heritable in adults, with variability across different white-matter tracts147, 148.”
From Imaging structural and functional brain development in early childhood (2018) · cites this paper as [148]
Self-check
Percentages, sums and reported differences re-computed from the paper’s own numbers.
The self-check needs the paper’s full text.
Citations
Cites
Introduction to Quantitative Genetics.
Edwards, A. W. F., & Falconer, D. S. (1982) · Biometrics · doi:10.2307/2529912 · Cited by 21,447
Tzourio-Mazoyer, N., Landeau, B., Papathanassiou, D., Crivello, F., Etard, O., Delcroix, N., Mazoyer, B., & Joliot, M. (2002) · NeuroImage · doi:10.1006/nimg.2001.0978 · Cited by 16,319
Locally Weighted Regression: An Approach to Regression Analysis by Local Fitting
Cleveland, W. S., & Devlin, S. J. (1988) · Journal of the American Statistical Association · doi:10.1080/01621459.1988.10478639 · Cited by 5,893
Brain development during childhood and adolescence: a longitudinal MRI study
Giedd, J. N., Blumenthal, J., Jeffries, N. O., Castellanos, F. X., Liu, H., Zijdenbos, A., Paus, T., Evans, A. C., & Rapoport, J. L. (1999) · Nature Neuroscience · doi:10.1038/13158 · Cited by 5,552
Thresholding of statistical maps in functional neuroimaging using the false discovery rate
Genovese, C. R., Lazar, N. A., & Nichols, T. (2002) · NeuroImage · doi:10.1006/nimg.2001.1037 · Cited by 4,923
The basis of anisotropic water diffusion in the nervous system—A technical review.
Beaulieu, C. (2002) · NMR in Biomedicine · doi:10.1002/nbm.782 · Cited by 4,628
Multimodality image registration by maximization of mutual information
Maes, F., Collignon, A., Vandermeulen, D., Marchal, G., & Suetens, P. (1997) · IEEE Transactions on Medical Imaging · doi:10.1109/42.563664 · Cited by 4,547
Basser, P. J., & Pierpaoli, C. (1996) · Journal of Magnetic Resonance, Series B · doi:10.1006/jmrb.1996.0086 · Cited by 4,306
Methodology for Genetic Studies of Twins and Families
Neale, M. C., & Cardon, L. R. (1992) · doi:10.1007/978-94-015-8018-2 · Cited by 4,005
Introduction to Quantitative Genetics
J.-M., G., & Falconer, D. S. (1962) · Population · doi:10.2307/1525780 · Cited by 3,773
Diffusion tensor imaging: Concepts and applications
Le Bihan, D., Mangin, J., Poupon, C., Clark, C. A., Pappata, S., Molko, N., & Chabriat, H. (2001) · Journal of Magnetic Resonance Imaging · doi:10.1002/jmri.1076 · Cited by 3,547
Introduction to quantitative genetics
Falconer, D. S. (1960) · Helmholtz Centre for Ocean Research Kiel (GEOMAR) · Cited by 3,170
Johnson, J. S., & Newport, E. L. (1989) · Cognitive Psychology · doi:10.1016/0010-0285(89)90003-0 · Cited by 2,724
Regional Development of the Brain in Early Life
(1968) · Archives of Disease in Childhood · doi:10.1136/adc.43.229.388 · Cited by 2,107
Fiber tracking: principles and strategies – a technical review
Mori, S., & van Zijl, P. C. M. (2002) · NMR in Biomedicine · doi:10.1002/nbm.781 · Cited by 2,019
Longitudinal Mapping of Cortical Thickness and Brain Growth in Normal Children
Sowell, E. R., Thompson, P. M., Leonard, C. M., Welcome, S. E., Kan, E., & Toga, A. W. (2004) · The Journal of Neuroscience · doi:10.1523/jneurosci.1798-04.2004 · Cited by 1,481
Microstructural maturation of the human brain from childhood to adulthood
Lebel, C., Walker, L., Leemans, A., Phillips, L., & Beaulieu, C. (2008) · NeuroImage · doi:10.1016/j.neuroimage.2007.12.053 · Cited by 1,398
Longitudinal Development of Human Brain Wiring Continues from Childhood into Adulthood
Lebel, C., & Beaulieu, C. (2011) · Journal of Neuroscience · doi:10.1523/jneurosci.5302-10.2011 · Cited by 1,193
Classical twin studies and beyond
Boomsma, D., Busjahn, A., & Peltonen, L. (2002) · Nature Reviews Genetics · doi:10.1038/nrg932 · Cited by 1,105 · cited 1×
“Twin Data - Structural Equation Modeling Twin data can be used to estimate the respective contributions of genetic and unique environmental influences on a certain trait [34], as well as on the covariance between traits [35].”
MethodSelf-citationAutomatic 3‐D model‐based neuroanatomical segmentation
Collins, D. L., Holmes, C. J., Peters, T. M., & Evans, A. C. (1995) · Human Brain Mapping · doi:10.1002/hbm.460030304 · Cited by 975
Growth patterns in the developing brain detected by using continuum mechanical tensor maps
Thompson, P. M., Giedd, J. N., Woods, R. P., MacDonald, D., Evans, A. C., & Toga, A. W. (2000) · Nature · doi:10.1038/35004593 · Cited by 850
Kim, J. S., Singh, V., Lee, J. K., Lerch, J. P., Ad-Dab’bagh, Y., MacDonald, D. J., Lee, J. M., Kim, S. I., & Evans, A. C. (2005) · NeuroImage · doi:10.1016/j.neuroimage.2005.03.036 · Cited by 816
Multi-modality image registration by maximization of mutual information
Maes, F., Collignon, A. M. F., Vandermeulen, D., Marchal, G., & Suetens, P. (1996) · IEEE Workshop on Mathematical Methods in Biomedical Image Analysis (MMBIA) · doi:10.1109/mmbia.1996.534053 · Cited by 809
Tamnes, C. K., Østby, Y., Fjell, A. M., Westlye, L. T., Due-Tønnessen, P., & Walhovd, K. B. (2010) · Cerebral Cortex · doi:10.1093/cercor/bhp118 · Cited by 779
Benes, F. M. (1994) · Archives of General Psychiatry · doi:10.1001/archpsyc.1994.03950060041004 · Cited by 744
Raznahan, A., Shaw, P., Lalonde, F., Stockman, M., Wallace, G. L., Greenstein, D., Clasen, L., Gogtay, N., & Giedd, J. N. (2011) · The Journal of Neuroscience · doi:10.1523/jneurosci.0054-11.2011 · Cited by 712
Analysis of partial volume effects in diffusion‐tensor MRI
Alexander, A. L., Hasan, K. M., Lazar, M., Tsuruda, J. S., & Parker, D. L. (2001) · Magnetic Resonance in Medicine · doi:10.1002/mrm.1105 · Cited by 695
RESTORE: Robust estimation of tensors by outlier rejection
Chang, L., Jones, D. K., & Pierpaoli, C. M. (2005) · Magnetic Resonance in Medicine · doi:10.1002/mrm.20426 · Cited by 611
Imaging cortical association tracts in the human brain using diffusion‐tensor‐based axonal tracking
Mori, S., Kaufmann, W. E., Davatzikos, C. A., Stieltjes, B., Amodei, L., Fredericksen, K., Pearlson, G. D., Melhem, E. R., Solaiyappan, M., Raymond, G. V., et al. (2002) · Magnetic Resonance in Medicine · doi:10.1002/mrm.10074 · Cited by 558
Basser, P. J., & Pierpaoli, C. M. (2011) · Journal of Magnetic Resonance · doi:10.1016/j.jmr.2011.09.022 · Cited by 551
White matter development in adolescence: A DTI study
Asato, M. R., Terwilliger, R., Woo, J., & Luna, B. (2010) · Cerebral Cortex · doi:10.1093/cercor/bhp282 · Cited by 512
Netherlands Twin Register: From Twins to Twin Families
Boomsma, D. I., de Geus, E. J. C., Vink, J. M., Stubbe, J. H., Distel, M. A., Hottenga, J., Danielle Posthuma, B., van Beijsterveldt, T. C. E. M., Hudziak, J. J., Bartels, M., et al. (2006) · Twin Research and Human Genetics · doi:10.1375/183242706779462426 · Cited by 401
Self-citationLongitudinal changes in grey and white matter during adolescence
Giorgio, A., Watkins, K. E., Chadwick, M., James, S., Winmill, L., Douaud, G., De Stefano, N., Matthews, P. M., Smith, S. M., Johansen-Berg, H., et al. (2010) · NeuroImage · doi:10.1016/j.neuroimage.2009.08.003 · Cited by 394
Growth of white matter in the adolescent brain: role of testosterone and androgen receptor
Perrin, J. S., Hervé, P.-Y., Leonard, G., Perron, M., Pike, G. B., Pitiot, A., Richer, L., Veillette, S., Pausova, Z., & Paus, T. (2008) · The Journal of Neuroscience · doi:10.1523/jneurosci.1212-08.2008 · Cited by 331
Lerch, J. P., Pruessner, J. C., Zijdenbos, A. P., Collins, D. L., Teipel, S. J., Hampel, H. J., & Evans, A. C. (2006) · Neurobiology of Aging · doi:10.1016/j.neurobiolaging.2006.09.013 · Cited by 281
A Model-Based Method for Retrospective Correction of Geometric Distortions in Diffusion-Weighted EPI
Andersson, J., & Skare, S. T. (2002) · NeuroImage · doi:10.1006/nimg.2001.1039 · Cited by 273
Genetics of white matter development: A DTI study of 705 twins and their siblings aged 12 to 29
Chiang, M.-C., McMahon, K. L., de Zubicaray, G. I., Martin, N. G., Hickie, I. B., Toga, A. W., Wright, M. J., & Thompson, P. M. (2010) · NeuroImage · doi:10.1016/j.neuroimage.2010.10.015 · Cited by 255
Apparent diffusion tensor measurements in myelin-deficient rat spinal cords
Gulani, V., WEBB, A. G., Duncan, I. D., & Lauterbur, P. C. (2001) · Magnetic Resonance in Medicine · doi:10.1002/1522-2594(200102)45:2 · Cited by 250
White matter development during adolescence as shown by diffusion MRI
Schmithorst, V. J., & Yuan, W. (2010) · Brain and Cognition · doi:10.1016/j.bandc.2009.06.005 · Cited by 249
Is diffusion anisotropy an accurate monitor of myelination?
Mädler, B., Drabycz, S. A., Kolind, S. H., Whittall, K. P., & MacKay, A. L. (2008) · Magnetic Resonance Imaging · doi:10.1016/j.mri.2008.01.047 · Cited by 227
Longitudinal characterization of white matter maturation during adolescence
Bava, S., Thayer, R. E., Jacobus, J., Ward, M. E., Jernigan, T. L., & Tapert, S. F. (2010) · Brain Research · doi:10.1016/j.brainres.2010.02.066 · Cited by 216
Age-related regional variations of the corpus callosum identified by diffusion tensor tractography
Lebel, C., Caverhill-Godkewitsch, S., & Beaulieu, C. (2010) · NeuroImage · doi:10.1016/j.neuroimage.2010.03.072 · Cited by 209
Tyszka, J., Readhead, C., Bearer, E., Pautler, R., & Jacobs, R. (2006) · NeuroImage · doi:10.1016/j.neuroimage.2005.08.037 · Cited by 187
Peper, J. S., Schnack, H. G., Brouwer, R. M., Van Baal, G. C. M., Pjetri, E., Székely, E., van Leeuwen, M., van den Berg, S. M., Collins, D. L., Evans, A. C., et al. (2009) · Human Brain Mapping · doi:10.1002/hbm.20660 · Cited by 177
Self-citationCASCIO, C. J., GERIG, G., & PIVEN, J. (2007) · Journal of the American Academy of Child & Adolescent Psychiatry · doi:10.1097/01.chi.0000246064.93200.e8 · Cited by 167
Muetzel, R. L., Collins, P. F., Mueller, B. A., Schissel, A. M., Lim, K. O., & Luciana, M. M. (2007) · NeuroImage · doi:10.1016/j.neuroimage.2007.10.018 · Cited by 157
Ladouceur, C. D., Peper, J. S., Crone, E. A., & Dahl, R. E. (2011) · Developmental Cognitive Neuroscience · doi:10.1016/j.dcn.2011.06.002 · Cited by 154
Self-citationMcGraw, P., Liang, L., & Provenzale, J. M. (2002) · American Journal of Roentgenology · doi:10.2214/ajr.179.6.1791515 · Cited by 138
Gogtay, N., Lu, A., Leow, A. D., Klunder, A. D., Lee, A. D., Chavez, A., Greenstein, D., Giedd, J. N., Toga, A. W., Rapoport, J. L., et al. (2008) · Proceedings of the National Academy of Sciences · doi:10.1073/pnas.0806485105 · Cited by 125
Analysis of brain white matter via fiber tract modeling
Gerig, G., Gouttard, S., & Corouge, I. (2005) · doi:10.1109/iembs.2004.1404229 · Cited by 112
Brain Plasticity and Intellectual Ability Are Influenced by Shared Genes
Brans, R. G. H., Kahn, R. S., Schnack, H. G., van Baal, G. C. M., Posthuma, D., van Haren, N. E. M., Lepage, C., Lerch, J. P., Collins, D. L., Evans, A. C., et al. (2010) · Journal of Neuroscience · doi:10.1523/jneurosci.5841-09.2010 · Cited by 109
Self-citationCerebral white matter in early puberty is associated with luteinizing hormone concentrations
Peper, J. S., Brouwer, R. M., Schnack, H. G., van Baal, G. C. M., van Leeuwen, M., van den Berg, S. M., de Waal, H. A. D., Janke, A. L., Collins, D. L., Evans, A. C., et al. (2008) · Psychoneuroendocrinology · doi:10.1016/j.psyneuen.2008.03.017 · Cited by 108
Self-citationMandl, R. C. W., Schnack, H. G., Luigjes, J., van den Heuvel, M. P., Cahn, W., Kahn, R. S., & Pol, H. E. H. (2008) · Schizophrenia Bulletin · doi:10.1093/schbul/sbn161 · Cited by 100
Self-citationGenetic influences on thinning of the cerebral cortex during development
van Soelen, I. L. C., Brouwer, R. M., van Baal, G. C. M., Schnack, H. G., Peper, J. S., Collins, D. L., Evans, A. C., Kahn, R. S., Boomsma, D. I., & Pol, H. E. H. (2011) · NeuroImage · doi:10.1016/j.neuroimage.2011.11.044 · Cited by 94
Self-citationDifferential Development of Human Brain White Matter Tracts
Imperati, D., Colcombe, S. J., Kelly, C. A. M., Martino, A. D., Zhou, J. H., Castellanos, F. X., & Milham, M. P. (2011) · PLoS ONE · doi:10.1371/journal.pone.0023437 · Cited by 82
Lateralized genetic and environmental influences on human brain morphology of 8-year-old twins
Yoon, U., Fahim, C., Pérusse, D., & Evans, A. C. (2010) · NeuroImage · doi:10.1016/j.neuroimage.2010.01.007 · Cited by 78
Detecting brain growth patterns in normal children using tensor‐based morphometry
Hua, X., Leow, A., Levitt, J. G., Caplan, R., Thompson, P. M., & Toga, A. W. (2007) · Human Brain Mapping · doi:10.1002/hbm.20498 · Cited by 77
Heritability of DTI and MTR in nine-year-old children
Brouwer, R. M., Mandl, R. C. W., Peper, J. S., van Baal, G. C. M., Kahn, R. S., Boomsma, D. I., & Pol, H. E. H. (2010) · NeuroImage · doi:10.1016/j.neuroimage.2010.03.017 · Cited by 74
Self-citationSegmentation of MRI brain scans using non-uniform partial volume densities
Brouwer, R. M., Pol, H. E. H., & Schnack, H. G. (2009) · NeuroImage · doi:10.1016/j.neuroimage.2009.07.041 · Cited by 47
Self-citationHeritability of volumetric brain changes and height in children entering puberty
van Soelen, I. L. C., Brouwer, R. M., van Baal, G. C. M., Schnack, H. G., Peper, J. S., Chen, L., Kahn, R. S., Boomsma, D. I., & Pol, H. E. H. (2011) · Human Brain Mapping · doi:10.1002/hbm.21468 · Cited by 43
Self-citationJito, J., Nakasu, S., Ito, R., Fukami, T., Morikawa, S., & Inubushi, T. (2008) · Journal of Magnetic Resonance Imaging · doi:10.1002/jmri.21496 · Cited by 40
Age-Related Changes in Frontal and Temporal Lobe Volumes in Men: A Magnetic Resonance Imaging Study
Bartzokis, G., Beckson, M., Lu, P. H., Nuechterlein, K. H., Edwards, N., & Mintz, J. (2001) · Archives of General Psychiatry · doi:10.1001/archpsyc.58.5.461 · Cited by 14
Research works printed but not linked: 2
- ILC van Soelen, 2011, Heritability of volumetric changes during brain development., Hum Brain Map, Dec, 3
- MC Neale, 2006, 'Mx: statistical modeling', VCU Box 900126, Richmond, VA 23298: Department of Psychiatry, 7th Edition
Cited by
Sorted by citations
Semple, B. D., Blomgren, K., Gimlin, K., Ferriero, D. M., & Noble-Haeusslein, L. J. (2013) · Progress in Neurobiology · doi:10.1016/j.pneurobio.2013.04.001 · Cited by 2,132
Imaging structural and functional brain development in early childhood
Gilmore, J. H., Knickmeyer, R. C., & Gao, W. (2018) · Nature Reviews Neuroscience · doi:10.1038/nrn.2018.1 · Cited by 1,013
The development of brain white matter microstructure
Lebel, C., & Deoni, S. (2018) · NeuroImage · doi:10.1016/j.neuroimage.2017.12.097 · Cited by 602
Lebel, C., Treit, S., & Beaulieu, C. (2019) · NMR in Biomedicine · doi:10.1002/nbm.3778 · Cited by 379
Methods and considerations for longitudinal structural brain imaging analysis across development
Mills, K. L., & Tamnes, C. K. (2014) · Developmental Cognitive Neuroscience · doi:10.1016/j.dcn.2014.04.004 · Cited by 282
Metadata
- Authors
- Brouwer, R. M., Mandl, R. C. W., Schnack, H. G., van Soelen, I. L. C., van Baal, G. C., Peper, J. S., Kahn, R. S., Boomsma, D. I., & Pol, H. E. H.
- Affiliations
- University Medical Center Utrecht (NL)
- Leiden University (NL)
- Vrije Universiteit Amsterdam (NL)
- Corresponding author
- Brouwer, Rachel M.
- ORCID
- Venue
- PLoS ONE
- Publisher
- Public Library of Science (PLoS)
- Published
- 2012-04-13
- Volume
- 7
- Issue
- 4
- Pages
- e32316
- ISSN
- 1932-6203 (ISSN-L)
- PMC
- PMC3326005
- OpenAlex
- W2137931201
- Cited by
- 107
- References
- 62
- Citations by year
- 2026: 2 · 2025: 4 · 2024: 2 · 2023: 6 · 2022: 8 · 2021: 9 · 2020: 12 · 2019: 5 · 2018: 8 · 2017: 10 · 2016: 10 · 2015: 13 · 2014: 9 · 2013: 8 · 2012: 1
- FWCI
- 7.49
- Type
- journal article
- Language
- en
- Open access
- gold
- doi.org
- Locations
- PLoS ONE (publishedVersion, cc-by)
- Europe PMC (PubMed Central) (publishedVersion, cc-by)
- PubMed Central (publishedVersion, cc-by)
- PubMed (publishedVersion)
- VU Research Portal (publishedVersion, other-oa)
- Data Archiving and Networked Services (DANS) (submittedVersion, other-oa)
- Leiden Repository (Leiden University) (submittedVersion)
- Digital Academic REpository of VU University Amsterdam (Vrije Universiteit Amsterdam) (submittedVersion, cc-by)
- DOAJ (DOAJ: Directory of Open Access Journals) (submittedVersion, cc-by-sa)
- Data Archiving and Networked Services (DANS) (submittedVersion, cc-by)
- Funders
- Nederlandse Organisatie voor Wetenschappelijk Onderzoek (NWO 51.02.060, NWO 480-04-004, 230374, 480-04-004, 51.02.060)
- Hersenstichting
- Topics
- Health Sciences › Medicine › Radiology, Nuclear Medicine and Imaging › Advanced Neuroimaging Techniques and Applications
- Social Sciences › Psychology › Experimental and Cognitive Psychology › Cognitive Abilities and Testing
- Life Sciences › Neuroscience › Cognitive Neuroscience › Functional Brain Connectivity Studies
- Keywords
- white matter development, precocious puberty, fractional anisotropy, white matter volume, heritability, monozygotic twins, dizygotic twins, arcuate fasciculus, splenium, child neurodevelopment, genetic and environmental factors
- MeSH terms
- Brain, Child, Female, Humans, Male, Anisotropy, Diffusion Tensor Imaging
About these checks
Registry, retraction, Cites and statistics results are computed, not judged, with one exception: a printed reference that no index lists is read once by a model before it counts as a citation error. Claims are extracted by a model and kept only when their quote appears verbatim in the text; each cited source is then checked, with a model’s help, for whether it says what the claim relies on. Those verdicts can be wrong — read the claim’s quote and the cited source before relying on one.
Statistics and arithmetic are recomputed, not judged.
Confidence bands are shown only for fields calibrated on our annotated test set. None is calibrated yet, so no band is shown.
What counts as a claim ›How we measure confidence ›How we check this ›
Are you an author, or do you see a problem with this page? Request a review
