

The DOI matches its Crossref record; 50 of the 52 references it cites were found in a registry or an index.
Evaluating amazon’s mechanical turk as a tool for experimental behavioral research
Open accessAbstract
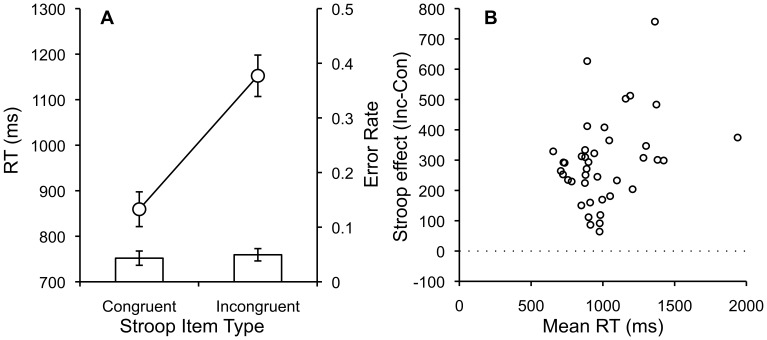
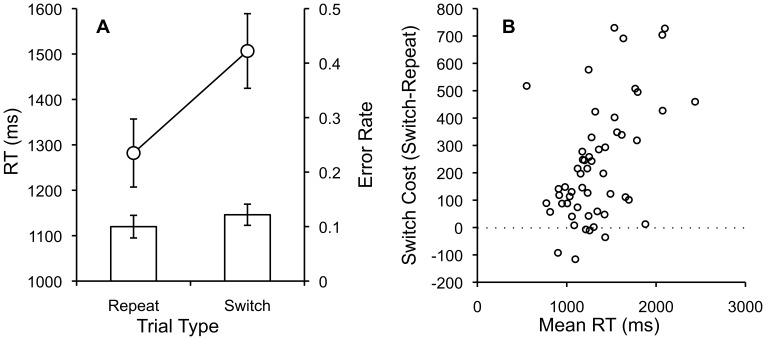
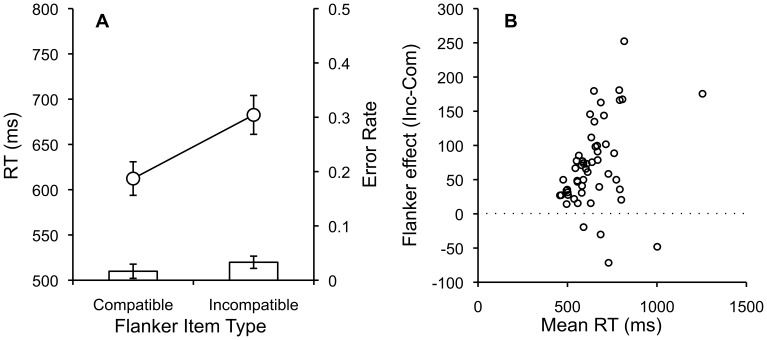
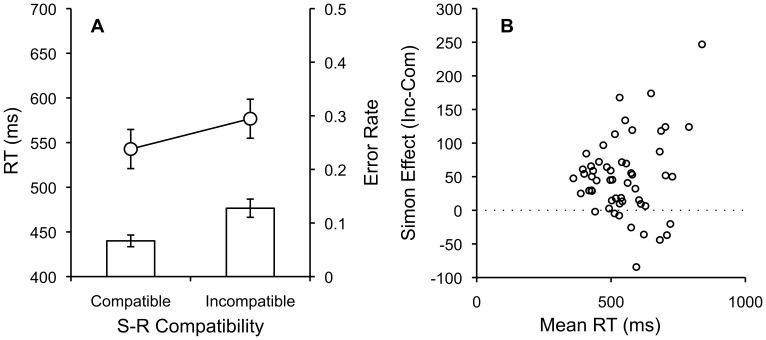
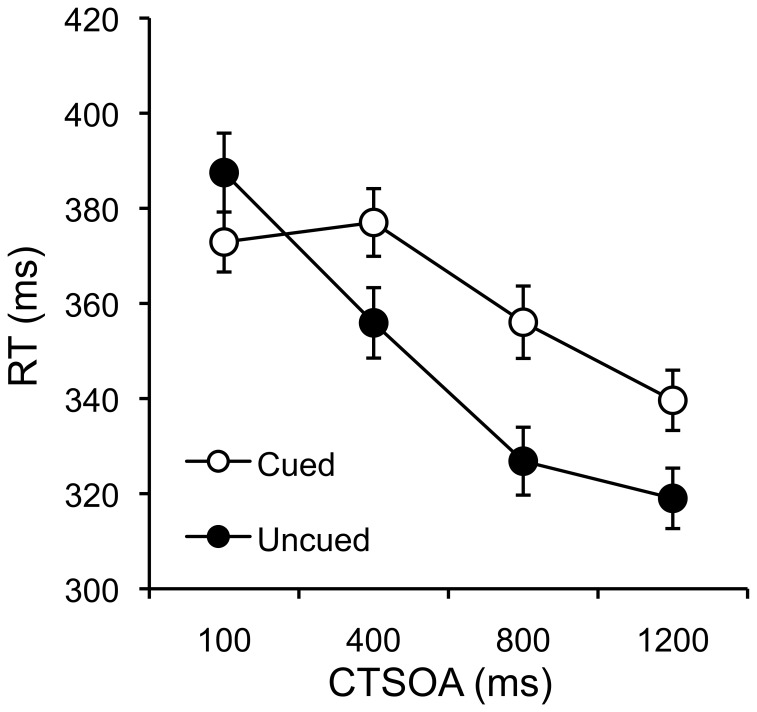
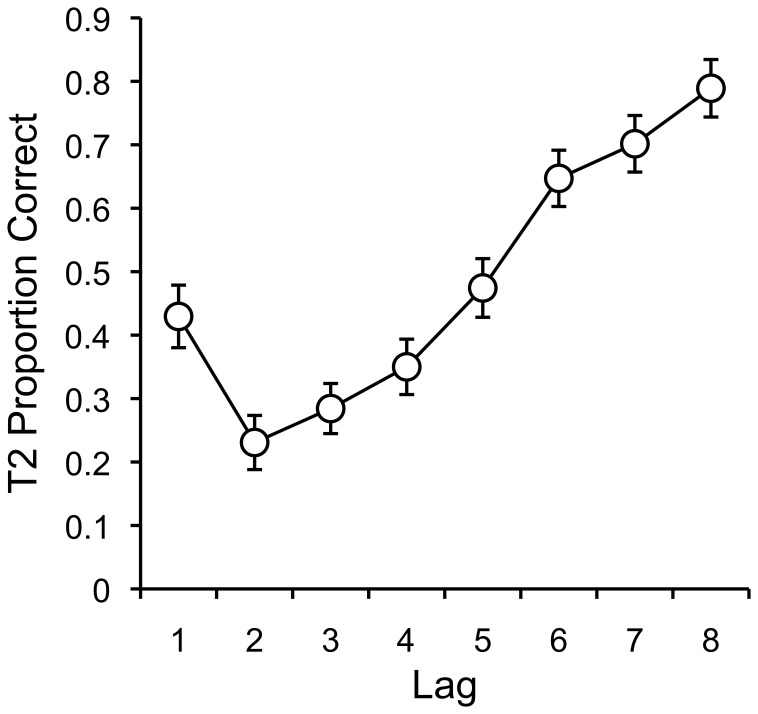
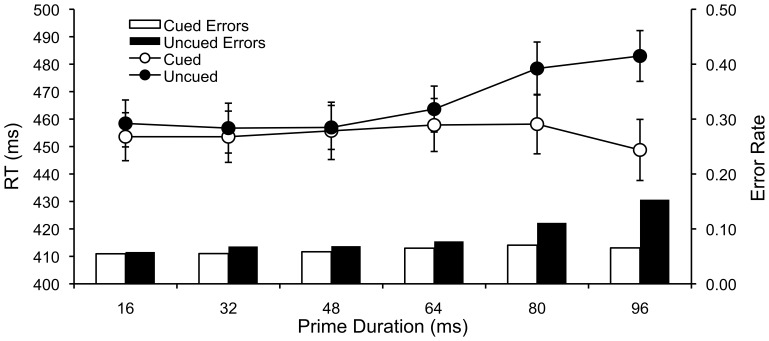
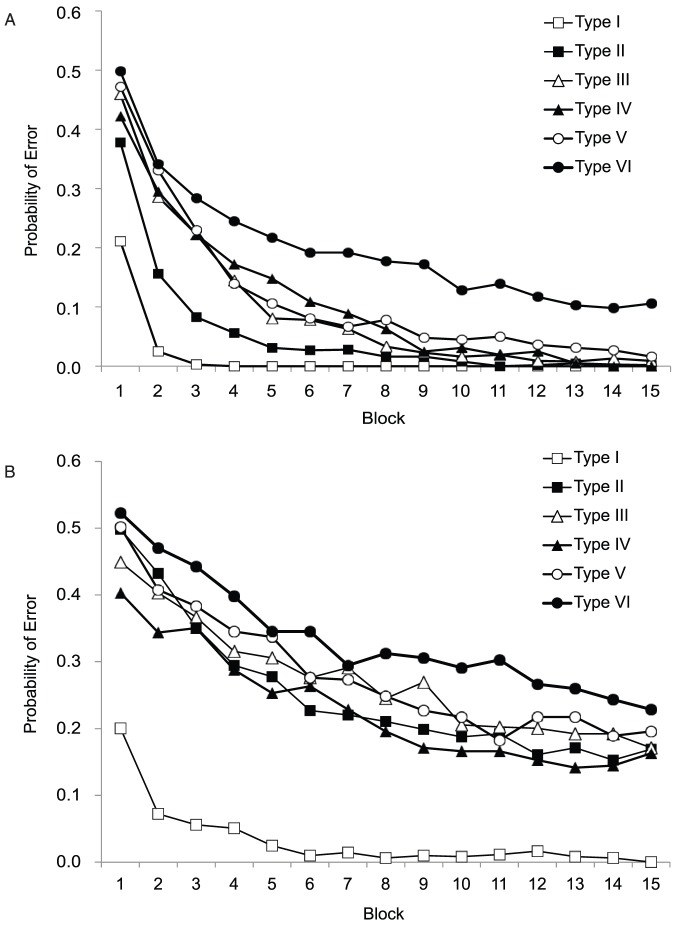
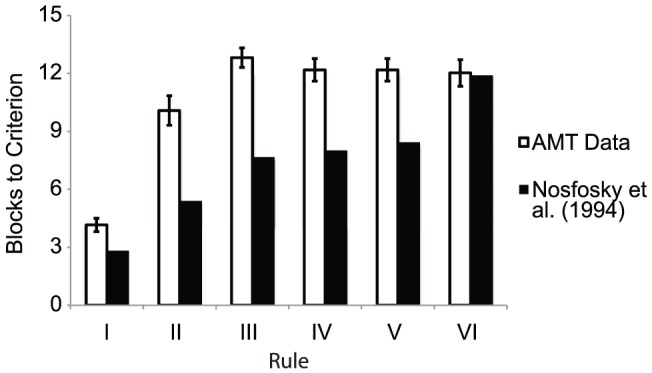
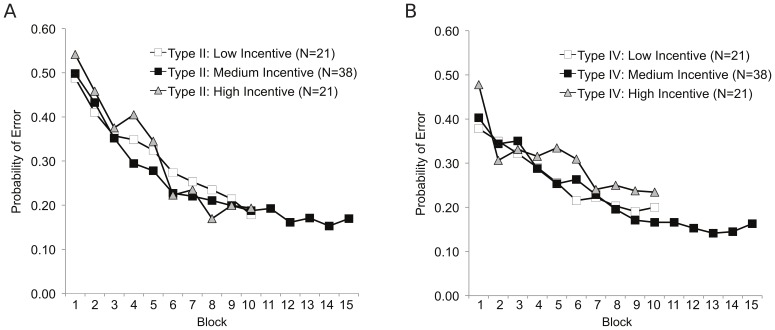
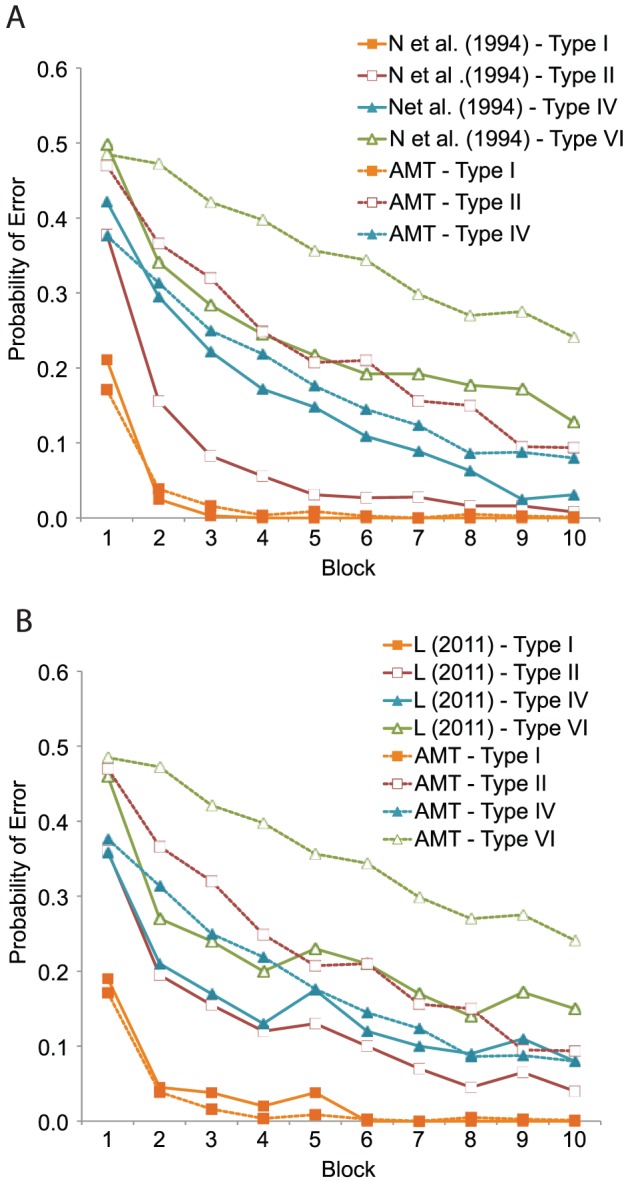
Amazon Mechanical Turk (AMT) is an online crowdsourcing service where anonymous online workers complete web-based tasks for small sums of money. The service has attracted attention from experimental psychologists interested in gathering human subject data more efficiently. However, relative to traditional laboratory studies, many aspects of the testing environment are not under the experimenter's control. In this paper, we attempt to empirically evaluate the fidelity of the AMT system for use in cognitive behavioral experiments. These types of experiment differ from simple surveys in that they require multiple trials, sustained attention from participants, comprehension of complex instructions, and millisecond accuracy for response recording and stimulus presentation. We replicate a diverse body of tasks from experimental psychology including the Stroop, Switching, Flanker, Simon, Posner Cuing, attentional blink, subliminal priming, and category learning tasks using participants recruited using AMT. While most of replications were qualitatively successful and validated the approach of collecting data anonymously online using a web-browser, others revealed disparity between laboratory results and online results. A number of important lessons were encountered in the process of conducting these replications that should be of value to other researchers.
Overview
The claims and statistics of this paper haven’t been checked yet.
Run the check — free, no account needed. It reads the open-access text and checks the sources it cites.
Integrity signals
Registry
Cites
Statistics
Figures
Verification
Claims the paper makes
The claims and statistics of this paper haven’t been checked yet.
Run the check — free, no account needed. It reads the open-access text and checks the sources it cites.
Claims other papers make about this one
Each is checked against this paper’s own text: does it say what the citing paper says it does?
In the citing paper
“Regarding online experiments in general, Crump et al. [32] showed that the data collected online using a web-browser seemed mostly in line with laboratory results, so long as the experiment methods were solid.”
From Adaptive trust calibration for human-AI collaboration (2020) · cites this paper as [32]
Self-check
Percentages, sums and reported differences re-computed from the paper’s own numbers.
The self-check needs the paper’s full text.
Citations
Cites
Studies of interference in serial verbal reactions
Stroop, J. R. (1935) · Journal of Experimental Psychology · doi:10.1037/h0054651 · Cited by 18,622
Amazon's Mechanical Turk: A New Source of Inexpensive, Yet High-Quality, Data?
Buhrmester, M., Kwang, T., & Gosling, S. D. (2011) · Perspectives on Psychological Science · doi:10.1177/1745691610393980 · Cited by 9,996
Effects of noise letters upon the identification of a target letter in a nonsearch task
Eriksen, B. A., & Eriksen, C. W. (1974) · Perception & Psychophysics · doi:10.3758/bf03203267 · Cited by 7,230
Simmons, J. P., Nelson, L. D., & Simonsohn, U. (2011) · Psychological Science · doi:10.1177/0956797611417632 · Cited by 6,567
Half a century of research on the Stroop effect: An integrative review.
MacLeod, C. M. (1991) · Psychological Bulletin · doi:10.1037/0033-2909.109.2.163 · Cited by 5,500
Running experiments on Amazon Mechanical Turk
Paolacci, G., Chandler, J., & Ipeirotis, P. G. (2010) · Judgment and Decision Making · doi:10.1017/s1930297500002205 · Cited by 3,767
Instructional manipulation checks: Detecting satisficing to increase statistical power
Oppenheimer, D. M., Meyvis, T., & Davidenko, N. (2009) · Journal of Experimental Social Psychology · doi:10.1016/j.jesp.2009.03.009 · Cited by 3,493
Conducting behavioral research on Amazon’s Mechanical Turk
Mason, W., & Suri, S. (2012) · Behavior Research Methods · doi:10.3758/s13428-011-0124-6 · Cited by 3,172
Monsell, S. (2003) · Trends in Cognitive Sciences · doi:10.1016/s1364-6613(03)00028-7 · Cited by 2,984
Components of visual orienting
Posner, M. I. (1984) · Attention and performance · Cited by 2,980
Research works printed but not linked: 1
- Ipeirotis PG (2010) Demographics of Mechanical Turk (Tech. Rep. No. CeDER-10-01). New York: New York University. Available: http://hdl.handle.net/2451/29585. Accessed 2012 Jun 1.
Cited by
Sorted by citations
Items 501–600 of 1,000
Freitas, J. D., & Alvarez, G. A. (2018) · Cognition · doi:10.1016/j.cognition.2018.05.017 · Cited by 31
Crowdsourced Measurement of Reaction Times to Audiovisual Stimuli With Various Degrees of Asynchrony
Bazilinskyy, P., & de Winter, J. (2018) · Human Factors The Journal of the Human Factors and Ergonomics Society · doi:10.1177/0018720818787126 · Cited by 23
People Infer Recursive Visual Concepts from Just a Few Examples
Lake, B. M., & Piantadosi, S. T. (2019) · Computational Brain & Behavior · doi:10.1007/s42113-019-00053-y · Cited by 34
Past behavior and future judgements: seizing and freezing in response to cyber operations
Gomez, M. A. (2019) · Journal of Cybersecurity · doi:10.1093/cybsec/tyz012 · Cited by 26
Wang-Jones, T. S., Alhassoon, O. M., Hattrup, K., Ferdman, B. M., & Lowman, R. L. (2017) · Psychology of Sexual Orientation and Gender Diversity · doi:10.1037/sgd0000218 · Cited by 26
Muldoon, K. M., Armstrong-Heimsoth, A., & Thomas, J. (2017) · PLoS ONE · doi:10.1371/journal.pone.0185635 · Cited by 26
Effects of E-cigarette Advertising Messages and Cues on Cessation Outcomes
Jo, C. L., Golden, S. D., Noar, S. M., Rini, C. K., & Ribisl, K. M. (2017) · Tobacco Regulatory Science · doi:10.18001/trs.4.1.3 · Cited by 26
Extraversion and compatibilist intuitions: a ten-year retrospective and meta-analyses
Feltz, A., & Cokely, E. T. (2019) · Philosophical Psychology · doi:10.1080/09515089.2019.1572692 · Cited by 26
Sound the alarm! Updating beliefs and degradative cyber operations
Gomez, M. A. (2019) · European Journal of International Security · doi:10.1017/eis.2019.2 · Cited by 24
Using Electronic Confederates for Experimental Research in Organizational Science
Leavitt, K., Qiu, F., & Shapiro, D. L. (2019) · Organizational Research Methods · doi:10.1177/1094428119889136 · Cited by 28
How decisions and the desire for coherency shape subjective preferences over time
Hornsby, A. N., & Love, B. C. (2020) · Cognition · doi:10.1016/j.cognition.2020.104244 · Cited by 37
Gentili, C., & Cristea, I. A. (2020) · Frontiers in Psychology · doi:10.3389/fpsyg.2020.01786 · Cited by 30
Controllable Medical Image Generation via GAN
Ren, Z., Yu, S. X., & Whitney, D. C. (2022) · Journal of Perceptual Imaging · doi:10.2352/j.percept.imaging.2022.5.000502 · Cited by 26
Haywood, D., Baughman, F. D., Mullan, B. A., & Heslop, K. (2022) · Brain Sciences · doi:10.3390/brainsci12040421 · Cited by 29
Reaction time and working memory in gamers and non-gamers
Ziv, G., Lidor, R., & Levin, O. (2022) · Scientific Reports · doi:10.1038/s41598-022-10986-3 · Cited by 29
Inhibitory control as a significant predictor of academic performance in Chinese high schoolers
Privitera, A. J., Zhou, Y., & Xie, X. (2022) · Child Neuropsychology · doi:10.1080/09297049.2022.2098941 · Cited by 29
Using Mechanical Turk to Assess the Effects of Age and Spatial Proximity on Inattentional Blindness
Stothart, C. R., Boot, W. R., & Simons, D. J. (2015) · Collabra · doi:10.1525/collabra.26 · Cited by 29
Brockhaus, S., Amos, C., Fawcett, A. M., Knemeyer, A. M., & Fawcett, S. E. (2017) · The Journal of Marketing Theory and Practice · doi:10.1080/10696679.2017.1345594 · Cited by 26
Methods to Test Visual Attention Online
Yung, A., Cardoso-Leite, P., Dale, G., Bavelier, D., & Green, C. S. (2015) · Journal of Visualized Experiments · doi:10.3791/52470 · Cited by 26
Reflexive Intergroup Bias in Third-Party PunishmentPreprint
Yudkin, D. A., Rothmund, T., Twardawski, M., Thalla, N. L., & Bavel, J. J. V. (2015) · SSRN Electronic Journal · doi:10.2139/ssrn.2648686 · Cited by 26
Numerical discrimination is mediated by neural coding variation
Prather, R. (2014) · Cognition · doi:10.1016/j.cognition.2014.08.003 · Cited by 25
van Steenbergen, H., & Bocanegra, B. R. (2015) · Behavior Research Methods · doi:10.3758/s13428-015-0677-x · Cited by 27
Visual Assertions: Effects of Photo Manipulation and Dual Processing for Food Advertisements
Lazard, A. J., Mackert, M., Bock, M. A., Love, B., Dudo, A. D., & Atkinson, L. (2018) · Visual Communication Quarterly · doi:10.1080/15551393.2017.1417047 · Cited by 25
Two’s a Crowd: Women Candidates in Concurrent Elections
Ditonto, T., & Andersen, D. J. (2018) · Journal of Women Politics & Policy · doi:10.1080/1554477x.2018.1475790 · Cited by 24
Renewal and resurgence phenomena generalize to Amazon's Mechanical Turk
Robinson, T. P., & Kelley, M. E. (2020) · Journal of the Experimental Analysis of Behavior · doi:10.1002/jeab.576 · Cited by 25
How causal information affects decisions
Zheng, M., Marsh, J. K., Nickerson, J. V., & Kleinberg, S. (2020) · Cognitive Research Principles and Implications · doi:10.1186/s41235-020-0206-z · Cited by 26
Kirk, P. A., Robinson, O. J., & Gilbert, S. J. (2020) · Quarterly Journal of Experimental Psychology · doi:10.1177/1747021820970156 · Cited by 29
“I Don't Agree with Giving Cash”: A Survey Experiment Examining Support for Public Assistance
Campbell, C., & Gaddis, S. M. (2016) · Social Science Quarterly · doi:10.1111/ssqu.12338 · Cited by 25
PONT: A Protocol for Online Neuropsychological Testing
Saban, W., & Ivry, R. B. (2021) · Journal of Cognitive Neuroscience · doi:10.1162/jocn_a_01767 · Cited by 29
A quantitative analysis of the effects of alternative reinforcement rate and magnitude on resurgence
Podlesnik, C. A., Ritchey, C. M., Kuroda, T., & Cowie, S. (2022) · Behavioural Processes · doi:10.1016/j.beproc.2022.104641 · Cited by 29
Is the juice worth the squeeze? Learning the marginal value of mental effort over time.
Otto, A. R., Braem, S., Silvetti, M., & Vassena, E. (2022) · Journal of Experimental Psychology General · doi:10.1037/xge0001208 · Cited by 29
Barbey, F. M., Farina, F. R., Buick, A. R., Danyeli, L. V., Dyer, J., Islam, M. N., Krylova, M., Murphy, B., Nolan, H., Rueda‐Delgado, L. M., et al. (2022) · Frontiers in Digital Health · doi:10.3389/fdgth.2022.944753 · Cited by 27
An investigation of how context affects the response of pedestrians to the movement of others
Tong, Y., & Bode, N. W. F. (2022) · Safety Science · doi:10.1016/j.ssci.2022.105919 · Cited by 25
What moves us? The intrinsic memorability of dance.
Ongchoco, J. D. K., Chun, M. M., & Bainbridge, W. A. (2022) · Journal of Experimental Psychology Learning Memory and Cognition · doi:10.1037/xlm0001168 · Cited by 25
Mays, D. M., Moran, M. B., Levy, D. T., & NIAURA, R. S. (2015) · Nicotine & Tobacco Research · doi:10.1093/ntr/ntv140 · Cited by 25
Too hot to help! Exploring the impact of ambient temperature on helping
Belkin, L. Y., & Kouchaki, M. (2017) · European Journal of Social Psychology · doi:10.1002/ejsp.2242 · Cited by 27
Stigma against false confessors impacts post‐exoneration financial compensation
Kukucka, J., & Evelo, A. J. (2019) · Behavioral Sciences & the Law · doi:10.1002/bsl.2403 · Cited by 24
Abstract numeric relations and the visual structure of algebra.
Landy, D. H., Brookes, D. T., & Smout, R. (2014) · Journal of Experimental Psychology Learning Memory and Cognition · doi:10.1037/a0036823 · Cited by 25
Saunders, B., Milyavskaya, M., Etz, A. J., Randles, D., & Inzlicht, M. (2017) · doi:10.31234/osf.io/bxfsu · Cited by 32
Heinemann, H., Mussel, P., & Schäpers, P. (2022) · Frontiers in Psychology · doi:10.3389/fpsyg.2022.1003866 · Cited by 32
Large-Scale Analysis of Auditory Segregation Behavior Crowdsourced via a Smartphone App
Teki, S., Kumar, S., & Griffiths, T. D. (2016) · PLoS ONE · doi:10.1371/journal.pone.0153916 · Cited by 24
Evidence for arrogance: On the relative importance of expertise, outcome, and manner
Milyavsky, M., Kruglanski, A. W., Chernikova, M., & Schori‐Eyal, N. (2017) · PLoS ONE · doi:10.1371/journal.pone.0180420 · Cited by 26
Saryazdi, R., Bannon, J., Rodrigues, A. S., Klammer, C., & Chambers, C. G. (2018) · Behavior Research Methods · doi:10.3758/s13428-018-1028-5 · Cited by 24
Correlation Database of 60 Cross-Disciplinary Surveys and Cognitive Tasks Assessing Self-Regulation
Mazza, G. L., Smyth, H. L., Bissett, P. G., Canning, J. R., Eisenberg, I. W., Enkavi, A. Z., González, O., Kim, S. J., Metcalf, S. A., Muniz, F. B., et al. (2020) · Journal of Personality Assessment · doi:10.1080/00223891.2020.1732994 · Cited by 24
Do truth-telling oaths improve honesty in crowd-working?
Jacquemet, N., James, A. G., Luchini, S., Murphy, J. J., & Shogren, J. F. (2021) · PLoS ONE · doi:10.1371/journal.pone.0244958 · Cited by 24
Ferrar, J., Griffith, G. J., Skirrow, C., Cashdollar, N. M., Taptiklis, N., Dobson, J., Cree, F., Cormack, F. K., Barnett, J. H., & Munafo, M. R. (2021) · Journal of Medical Internet Research · doi:10.2196/26004 · Cited by 23
Verifying online information: Development and validation of a self-report scale
Tifferet, S. (2021) · Technology in Society · doi:10.1016/j.techsoc.2021.101788 · Cited by 24
CommunityBots: Creating and Evaluating A Multi-Agent Chatbot Platform for Public Input Elicitation
Jiang, Z., Rashik, M., Panchal, K., Jasim, M., Sarvghad, A., Riahi, P., DeWitt, E., Thurber, F., & Mahyar, N. (2023) · Proceedings of the ACM on Human-Computer Interaction · doi:10.1145/3579469 · Cited by 26
Presentation Accuracy of the Web Revisited: Animation Methods in the HTML5 Era
Garaizar, P., Vadillo, M. A., & López–de–Ipiña, D. (2014) · PLoS ONE · doi:10.1371/journal.pone.0109812 · Cited by 24
The Impact of Modality on Mind Wandering during Comprehension
Kopp, K. J., & D’Mello, S. K. (2015) · Applied Cognitive Psychology · doi:10.1002/acp.3163 · Cited by 29
Establishing a Human Baseline for the Winograd Schema Challenge.
Bender, D. S. (2015) · MAICS · Cited by 24
Strickland, J. C., & Victor, G. A. (2019) · International Journal of Drug Policy · doi:10.1016/j.drugpo.2019.10.013 · Cited by 24
An Examination of the Factor Structure of the Multidimensional Psychological Flexibility Inventory.
Thomas, K. N., Bardeen, J. R., Witte, T. K., Rogers, T. A., Benfer, N., & Clauss, K. (2022) · Assessment · doi:10.1177/10731911211024353 · Cited by 24
L2 self-paced reading data collection across three contexts: In-person, online, and crowdsourcing
Patterson, A. S., & Nicklin, C. (2023) · Research Methods in Applied Linguistics · doi:10.1016/j.rmal.2023.100045 · Cited by 23
Positive Disability Identity Predicts Sense of Belonging in Emerging Adults With a Disability
Raver, A., Murchake, H., & Chalk, H. M. (2018) · Psi Chi Journal of Psychological Research · doi:10.24839/2325-7342.jn23.2.157 · Cited by 31
Nightingale, C., Swartz, M. T., Ramig, L. O., & McAllister, T. (2020) · American Journal of Speech-Language Pathology · doi:10.1044/2019_ajslp-19-00162 · Cited by 23
Validation of the Iowa Test of Consonant Perception
Geller, J., Holmes, A., Schwalje, A. T., Berger, J. I., Gander, P. E., Choi, I., & McMurray, B. (2021) · The Journal of the Acoustical Society of America · doi:10.1121/10.0006246 · Cited by 23
Crowdsourcing in Cognitive and Systems Neuroscience
Johnson, B. P., Dayan, E., Censor, N., & Cohen, L. G. (2021) · The Neuroscientist · doi:10.1177/10738584211017018 · Cited by 23
Evaluating effects of context changes on resurgence in humans
Ritchey, C. M., Kuroda, T., & Podlesnik, C. A. (2021) · Behavioural Processes · doi:10.1016/j.beproc.2021.104563 · Cited by 25
Toti, J.-F., & Romero, A. M. S. (2023) · European Journal of Marketing · doi:10.1108/ejm-11-2020-0831 · Cited by 23
Optimality bias in moral judgment
Freitas, J. D., & Johnson, S. G. B. (2018) · Journal of Experimental Social Psychology · doi:10.1016/j.jesp.2018.07.011 · Cited by 23
Understanding Cumulative Risk Perception from Judgments and Choices: An Application to Flood Risks
Maza, C. D. L., Davis, A. L., González, C., & Azevedo, I. L. (2018) · Risk Analysis · doi:10.1111/risa.13206 · Cited by 24
Doing What Makes You Happy: Health Message Framing for Younger and Older Adults
Liu, X., Shuster, M. M., Mikels, J. A., & Stine‐Morrow, E. A. L. (2019) · Experimental Aging Research · doi:10.1080/0361073x.2019.1627491 · Cited by 23
On the Transportability of Laboratory Results
Bader, F., Baumeister, B., Berger, R. D., & Keuschnigg, M. (2019) · Sociological Methods & Research · doi:10.1177/0049124119826151 · Cited by 25
Proximity under Threat: The Role of Physical Distance in Intergroup Relations
Xiao, Y. J., Wohl, M. J. A., & Bavel, J. J. V. (2016) · PLoS ONE · doi:10.1371/journal.pone.0159792 · Cited by 23
Extreme party animals: Effects of political identification and ideological extremity
Brown, J. K., & Hohman, Z. P. (2022) · Journal of Applied Social Psychology · doi:10.1111/jasp.12863 · Cited by 23
Tang, R., Bugg, J. M., Snijder, J.-P., Conway, A. R. A., & Braver, T. S. (2022) · Quarterly Journal of Experimental Psychology · doi:10.1177/17470218221114769 · Cited by 22
Influence of Anthropomorphic Agent on Human Empathy Through Games
Tsumura, T., & Yamada, S. (2023) · IEEE Access · doi:10.1109/access.2023.3269301 · Cited by 23
The Ethical, Societal, and Global Implications of Crowdsourcing Research
Du, S., Babalola, M. T., D’Cruz, P., Dóci, E., Garcia‐Lorenzo, L., Hassan, L. M., Islam, G., Newman, A., Noronha, E., & van Gils, S. (2024) · Journal of Business Ethics · doi:10.1007/s10551-023-05604-9 · Cited by 27
Portrayals of Technoscience in Video Games
Dudo, A. D., Cicchirillo, V. J., Atkinson, L., & Marx, S. (2014) · Science Communication · doi:10.1177/1075547013520240 · Cited by 21
The impacts of political cues and practical information on climate change decisions
Wong‐Parodi, G., & Fischhoff, B. (2015) · Environmental Research Letters · doi:10.1088/1748-9326/10/3/034004 · Cited by 23
Bauhoff, S., Montero, A., & Scharf, D. M. (2016) · The American Journal of Drug and Alcohol Abuse · doi:10.1080/00952990.2016.1207654 · Cited by 22
Social Salience Discriminates Learnability of Contextual Cues in an Artificial Language
Rácz, P., Hay, J., & Pierrehumbert, J. (2017) · Frontiers in Psychology · doi:10.3389/fpsyg.2017.00051 · Cited by 28
Website Designs for Communicating About Chemicals in Cigarette Smoke
Lazard, A. J., Byron, M., Vu, H., Peters, E. M., Schmidt, A., & Brewer, N. T. (2017) · Health Communication · doi:10.1080/10410236.2017.1407276 · Cited by 22
Posttraumatic stress, uncontrollability, and emotional distress tolerance
Hancock, L., & Bryant, R. A. (2018) · Depression and Anxiety · doi:10.1002/da.22783 · Cited by 27
Willingness to participate in HIV research at the end of life (EOL)
Prakash, K., Gianella, S., Dubé, K., Taylor, J., Lee, G., & Smith, D. M. (2018) · PLoS ONE · doi:10.1371/journal.pone.0199670 · Cited by 22
Amos, C., Brockhaus, S., Fawcett, A. M., Fawcett, S. E., & Knemeyer, A. M. (2018) · The International Journal of Logistics Management · doi:10.1108/ijlm-12-2017-0344 · Cited by 22
Maimonides’ ladder: States of mutual knowledge and the perception of charitability.
Freitas, J. D., DeScioli, P., Thomas, K. A., & Pinker, S. A. (2018) · Journal of Experimental Psychology General · doi:10.1037/xge0000507 · Cited by 22
Ferguson, E., Dorner, L., France, C. R., France, J. L., Masser, B., Lam, M., Marta, E., Alfieri, S., Merz, E., Adams, B. G., et al. (2018) · ISBT Science Series · doi:10.1111/voxs.12471 · Cited by 22
Keefer, L. A., Goode, C., & Berkel, L. D. V. (2015) · Journal of Social and Political Psychology · doi:10.5964/jspp.v3i2.492 · Cited by 22
Don't Get Too Excited: Assessing Individual Differences in the Down-Regulation of Positive Emotions
Zou, C., Plaks, J. E., & Peterson, J. B. (2017) · Journal of Personality Assessment · doi:10.1080/00223891.2017.1339711 · Cited by 22
Situational Strength Cues from Social Sources at Work: Relative Importance and Mediated Effects
Alaybek, B., Dalal, R. S., Sheng, Z., Morris, A. G., Tomassetti, A. J., & Holland, S. J. (2017) · Frontiers in Psychology · doi:10.3389/fpsyg.2017.01512 · Cited by 22
Gandullia, L., Lezzi, E., & Parciasepe, P. (2020) · Journal of Economic Psychology · doi:10.1016/j.joep.2020.102268 · Cited by 21
Examining mentors as buffers of burnout for employees high in neuroticism
Varghese, L. S., Rogers, A. P., Finkelstein, L. M., & Barber, L. K. (2020) · Human Resource Development Quarterly · doi:10.1002/hrdq.21390 · Cited by 23
Ritchey, C. M., Kuroda, T., Rung, J. M., & Podlesnik, C. A. (2021) · Learning and Motivation · doi:10.1016/j.lmot.2021.101728 · Cited by 24
Describing Vocalizations in Young Children: A Big Data Approach Through Citizen Science Annotation
Semenzin, C., Hamrick, L. R., Seidl, A. H., Kelleher, B., & Cristià, A. (2021) · Journal of Speech Language and Hearing Research · doi:10.1044/2021_jslhr-20-00661 · Cited by 21
Using a News Article to Convey Climate Science Consensus Information
Rode, J. B., Iqbal, S., Butler, B. J., & Ditto, P. H. (2021) · Science Communication · doi:10.1177/10755470211027235 · Cited by 16
How big should this object be? Perceptual influences on viewing-size preferences
Chen, Y.-C., Deza, A., & Konkle, T. (2022) · Cognition · doi:10.1016/j.cognition.2022.105114 · Cited by 21
Equal Quality for Online and Lab Data: A Direct Comparison from Two Dual-Task Paradigms
Sauter, M., Stefani, M., & Mack, W. (2022) · Open Psychology · doi:10.1515/psych-2022-0003 · Cited by 21
A desire for distraction: uncovering the rates of media multitasking during online research studies
Drody, A. C., Pereira, E. J., & Smilek, D. (2023) · Scientific Reports · doi:10.1038/s41598-023-27606-3 · Cited by 30
Cooper, E. A., & Farid, H. (2014) · Public Understanding of Science · doi:10.1177/0963662514554354 · Cited by 21
Kelley, T., & Bertenthal, B. I. (2016) · Information and Computer Security · doi:10.1108/ics-01-2016-0002 · Cited by 22
Exploring the Structure of Spatial Representations
Madl, T., Franklin, S., Chen, K., Trappl, R., & Montaldi, D. (2016) · PLoS ONE · doi:10.1371/journal.pone.0157343 · Cited by 25
Brink, W. D., Lee, L. S., & Pyzoha, J. S. (2018) · Behavioral Research in Accounting · doi:10.2308/bria-52103 · Cited by 21
Hoffmann, D. A., Marx, J. M., Burmeister, J. M., & Musher‐Eizenman, D. R. (2018) · International Journal of Environmental Research and Public Health · doi:10.3390/ijerph15040720 · Cited by 23
Who uses custom sports betting products?
Newall, P. W. S., Cassidy, R., Walasek, L., Ludvig, E. A., & Meyer, C. (2020) · Addiction Research & Theory · doi:10.1080/16066359.2020.1792887 · Cited by 21
How the wisdom of crowds, and of the crowd within, are affected by expertise
Fiechter, J. L., & Kornell, N. (2021) · Cognitive Research Principles and Implications · doi:10.1186/s41235-021-00273-6 · Cited by 21
Getting policy-makers to listen to field experiments
Dolan, P., & Galizzi, M. M. (2014) · Oxford Review of Economic Policy · doi:10.1093/oxrep/gru035 · Cited by 22
Qianchen, L., Gallagher, R. M., & Tsuchiya, N. (2022) · Royal Society Open Science · doi:10.1098/rsos.210394 · Cited by 21
Dunbar, A., & Kubrin, C. E. (2018) · Journal of Experimental Criminology · doi:10.1007/s11292-018-9342-6 · Cited by 24
Metadata
- Authors
- Crump, M. J. C., McDonnell, J. V., & Gureckis, T. M.
- Affiliations
- City University of New York (US)
- New York University (US)
- Corresponding author
- Crump, Matthew J. C.
- Venue
- PLoS ONE
- Publisher
- Public Library of Science (PLoS)
- Published
- 2013-03-13
- Volume
- 8
- Issue
- 3
- Pages
- e57410
- ISSN
- 1932-6203 (ISSN-L)
- PMC
- PMC3596391
- OpenAlex
- W2080211902
- Semantic Scholar
- d59101076dd96b6b39f58c3d3e3747e5cf5f98ab
- Cited by
- 1,617
- References
- 52
- Citations by year
- 2026: 25 · 2025: 63 · 2024: 83 · 2023: 108 · 2022: 162 · 2021: 171 · 2020: 164 · 2019: 138 · 2018: 164 · 2017: 155 · 2016: 146 · 2015: 129 · 2014: 86 · 2013: 20
- FWCI
- 192.44
- Type
- journal article
- Language
- en
- Open access
- gold
- doi.org
- Locations
- PLoS ONE (publishedVersion, cc-by)
- Europe PMC (PubMed Central) (publishedVersion, cc-by)
- PubMed Central (publishedVersion, cc-by)
- PubMed (publishedVersion)
- CUNY Academic Works (City University of New York) (submittedVersion)
- RePEc: Research Papers in Economics (submittedVersion)
- DOAJ (DOAJ: Directory of Open Access Journals) (submittedVersion, cc-by-sa)
- Topics
- Physical Sciences › Computer Science › Computer Science Applications › Mobile Crowdsensing and Crowdsourcing
- Life Sciences › Neuroscience › Cognitive Neuroscience › Neural and Behavioral Psychology Studies
- Social Sciences › Economics, Econometrics and Finance › Economics and Econometrics › Experimental Behavioral Economics Studies
- Keywords
- Amazon Mechanical Turk, online crowdsourcing, replication, Stroop task, attentional blink, subliminal priming, category learning, Simon task, flanker task, stimulus presentation
- MeSH terms
- Attention, Cues, Humans, Learning, Reaction Time, Internet, Behavioral Research, Learning Curve
About these checks
Registry, retraction, Cites and statistics results are computed, not judged, with one exception: a printed reference that no index lists is read once by a model before it counts as a citation error. Claims are extracted by a model and kept only when their quote appears verbatim in the text; each cited source is then checked, with a model’s help, for whether it says what the claim relies on. Those verdicts can be wrong — read the claim’s quote and the cited source before relying on one.
Statistics and arithmetic are recomputed, not judged.
Confidence bands are shown only for fields calibrated on our annotated test set. None is calibrated yet, so no band is shown.
What counts as a claim ›How we measure confidence ›How we check this ›
Are you an author, or do you see a problem with this page? Request a review
