

SoilGrids250m: Global gridded soil information based on machine learning
Open accessThe DOI matches its Crossref record; 85 of the 89 references it cites were found in a registry or an index.
Abstract
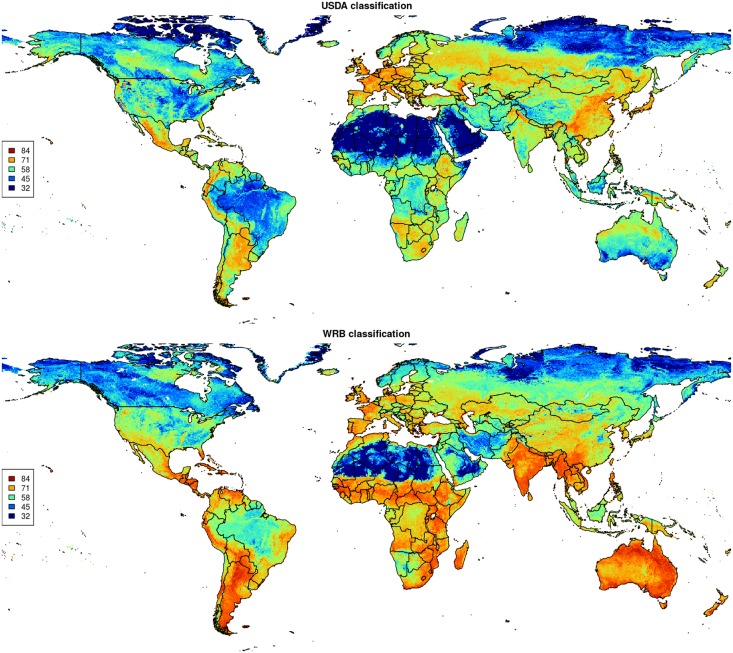
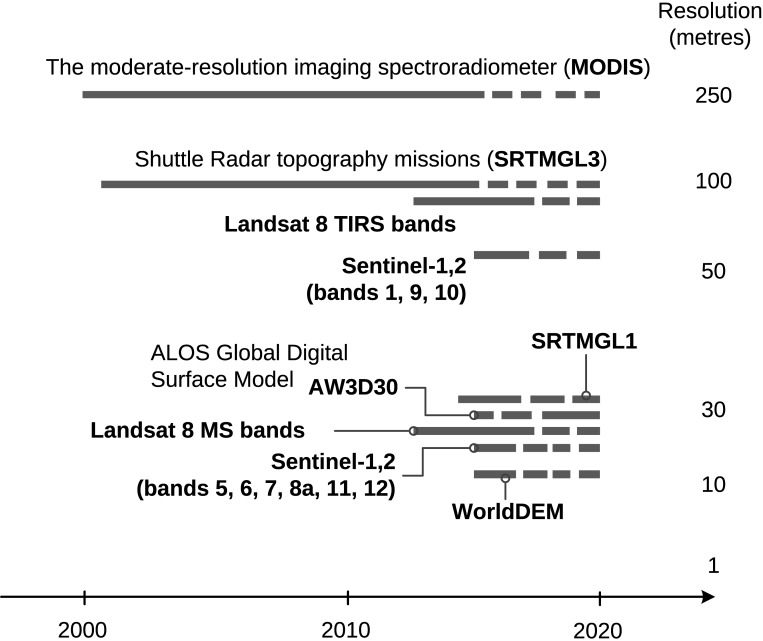
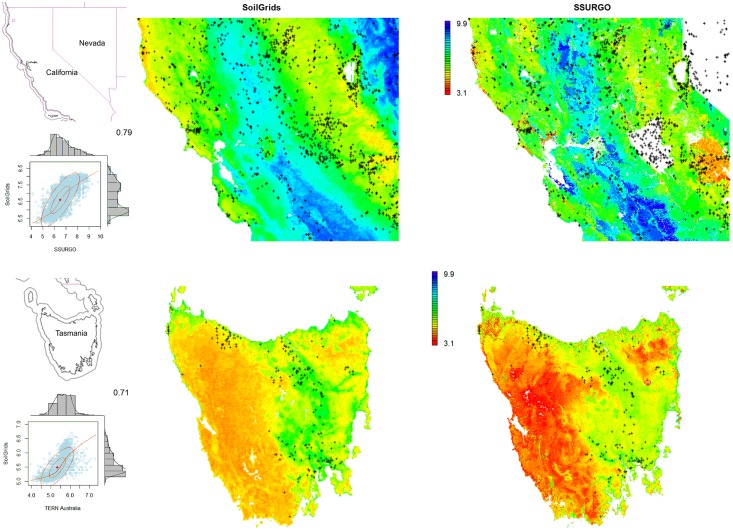
This paper describes the technical development and accuracy assessment of the most recent and improved version of the SoilGrids system at 250m resolution (June 2016 update). SoilGrids provides global predictions for standard numeric soil properties (organic carbon, bulk density, Cation Exchange Capacity (CEC), pH, soil texture fractions and coarse fragments) at seven standard depths (0, 5, 15, 30, 60, 100 and 200 cm), in addition to predictions of depth to bedrock and distribution of soil classes based on the World Reference Base (WRB) and USDA classification systems (ca. 280 raster layers in total). Predictions were based on ca. 150,000 soil profiles used for training and a stack of 158 remote sensing-based soil covariates (primarily derived from MODIS land products, SRTM DEM derivatives, climatic images and global landform and lithology maps), which were used to fit an ensemble of machine learning methods-random forest and gradient boosting and/or multinomial logistic regression-as implemented in the R packages ranger, xgboost, nnet and caret. The results of 10-fold cross-validation show that the ensemble models explain between 56% (coarse fragments) and 83% (pH) of variation with an overall average of 61%. Improvements in the relative accuracy considering the amount of variation explained, in comparison to the previous version of SoilGrids at 1 km spatial resolution, range from 60 to 230%. Improvements can be attributed to: (1) the use of machine learning instead of linear regression, (2) to considerable investments in preparing finer resolution covariate layers and (3) to insertion of additional soil profiles. Further development of SoilGrids could include refinement of methods to incorporate input uncertainties and derivation of posterior probability distributions (per pixel), and further automation of spatial modeling so that soil maps can be generated for potentially hundreds of soil variables. Another area of future research is the development of methods for multiscale merging of SoilGrids predictions with local and/or national gridded soil products (e.g. up to 50 m spatial resolution) so that increasingly more accurate, complete and consistent global soil information can be produced. SoilGrids are available under the Open Data Base License.
Overview
The claims and statistics of this paper haven’t been checked yet.
Free: it reads the open-access text and checks the first 5 claims that cite a source we can check. Create a free account to check every claim.
Integrity signals
Registry
Cites
Statistics
Figures






Verification
Claims the paper makes
The claims and statistics of this paper haven’t been checked yet.
Free: it reads the open-access text and checks the first 5 claims that cite a source we can check. Create a free account to check every claim.
Claims other papers make about this one
Each is checked against this paper’s own text: does it say what the citing paper says it does?
The source backs part of the claim, not all of it — or backs it for a different population, condition or comparison.
In the citing paper
“These uncertainties are mostly due to the uneven distribution and overall scarcity of field data for modelling and validating carbon stocks in the biomass and soil 27,64,65 .”
From Global priority areas for ecosystem restoration (2020) · cites this paper as [65]
Experimental — accuracy not yet measured
Self-check
Percentages, sums and reported differences re-computed from the paper’s own numbers.
The self-check needs the paper’s full text.
Citations
Cites
XGBoost: A Scalable Tree Boosting System
Chen, T., & Guestrin, C. (2016) · Proceedings of the 22nd ACM SIGKDD International Conference on Knowledge Discovery and Data Mining · doi:10.1145/2939672.2939785 · Cited by 54,569
Modern Applied Statistics with S
Venables, W. N., & Ripley, B. D. (2002) · Statistics and Computing · doi:10.1007/978-0-387-21706-2 · Cited by 24,305
Very high resolution interpolated climate surfaces for global land areas
Hijmans, R. J., Cameron, S. E., Parra, J. L., Jones, P. G., & Jarvis, A. (2005) · International Journal of Climatology · doi:10.1002/joc.1276 · Cited by 19,825
Total Carbon, Organic Carbon, and Organic Matter
Nelson, D. W., & Sommers, L. E. (1982) · Agronomy Monographs · doi:10.2134/agronmonogr9.2.2ed.c29 · Cited by 9,978
Building Predictive Models in R Using the caret Package
Kuhn, M. (2008) · Journal of Statistical Software · doi:10.18637/jss.v028.i05 · Cited by 8,863
Weighted kappa: nominal scale agreement provision for scaled disagreement or partial credit
Cohen, J. (1968) · Psychological Bulletin · doi:10.1037/h0026256 · Cited by 8,736
Kuhn, M., & Johnson, K. (2013) · doi:10.1007/978-1-4614-6849-3 · Cited by 6,788
Communication in the presence of noise
Shannon, C. E. (1949) · Proceedings of the IRE · doi:10.1109/jrproc.1949.232969 · Cited by 6,539
Anonim, A. (2010) · Cited by 4,945
Communication In The Presence Of Noise
Shannon, C. E. (1998) · Proceedings of the IEEE · doi:10.1109/jproc.1998.659497 · Cited by 4,804
Research works printed but not linked: 5
- D Arrouays, 2014, Soil carbon. vol. 125 of Advances in Agronomy, 93
- SA Lei, 1998, Soil Properties of the Kelso Sand Dunes in the Mojave Desert, The Southwestern Naturalist, 43, 47
- Huffman GJ, Bolvin DT. GPCP version 2 combined precipitation data set documentation. vol. 1. Laboratory for Atmospheres, NASA Goddard Space Flight Center and Science Systems and Applications; 2009.
- Kempen B. Updating soil information with digital soil mapping [PhD thesis]. Wageningen University. Wageningen; 2011. Available from: http://edepot.wur.nl/187198.
- Eberhardt E. Deriving WRB soil types using National German Soil Survey Guidelines. In: NCSS National Conference. NCSS Standards. Asheville, NC: United States Department of Agriculture USDA-NRCS; 2011. p. 1–2.
Cited by
Items 801–900 of 1,006
Zhang, L., Zhang, Z., Tao, F., Luo, Y., Zhang, J., & Cao, J. (2022) · Agricultural and Forest Meteorology · doi:10.1016/j.agrformet.2022.108856 · Cited by 51
Water table depth modulates productivity and biomass across Amazonian forests
de Sousa, T. R., Schietti, J., Ribeiro, I. O., Emilio, T., Herrera, R., ter Steege, H., de Castilho, C. V., Esquivel‐Muelbert, A., Baker, T. R., Lopes, A. P., et al. (2022) · Global Ecology and Biogeography · doi:10.1111/geb.13531 · Cited by 57
“SoilGrids has a layer of cation exchange capacity (CEC) (Hengl et al. , 2017), but the correlation of measured cations and the mapped CEC has been shown to be low, as CEC includes the concentration of aluminium, which is not a nutrient (Moulatlet et al. , 2017).”
Cool Farm Tool Water: A global on-line tool to assess water use in crop production
Kayatz, B., Baroni, G., Hillier, J., Lüdtke, S., Heathcote, R., Malin, D., van Tonder, C., Kuster, B., Freese, D., Hüttl, R. F., et al. (2018) · Journal of Cleaner Production · doi:10.1016/j.jclepro.2018.09.160 · Cited by 60
Land‐use controls on carbon biogeochemistry in lowland streams of the Congo Basin
Drake, T. W., Podgorski, D. C., Dinga, B. J., Chanton, J. P., Six, J., & Spencer, R. G. M. (2019) · Global Change Biology · doi:10.1111/gcb.14889 · Cited by 48
“High fire-derived nitrogen deposition on central African forests.”
BackgroundInfluentialWei, Y., Shi, Z., Biswas, A., Yang, S., Ding, J., & Wang, F. (2019) · The Science of The Total Environment · doi:10.1016/j.scitotenv.2019.135387 · Cited by 54
Global earthworm distribution and activity windows based on soil hydromechanical constraints
Ruiz, S., Bickel, S., & Or, D. (2021) · Communications Biology · doi:10.1038/s42003-021-02139-5 · Cited by 51
Temperature and pH mediate stoichiometric constraints of organically derived soil nutrients
de Souza, L. F. T., & Billings, S. (2021) · Global Change Biology · doi:10.1111/gcb.15985 · Cited by 48
Pierson, D., Lohse, K. A., Wieder, W. R., Patton, N. R., Facer, J., de Graaff, M., Georgiou, K., Seyfried, M. S., Flerchinger, G. N., & Will, R. (2022) · Scientific Reports · doi:10.1038/s41598-022-14224-8 · Cited by 53
Reader, M. O., Eppinga, M. B., de Boer, H. J., Damm, A., Petchey, O. L., & Santos, M. J. (2022) · Global Environmental Change · doi:10.1016/j.gloenvcha.2022.102612 · Cited by 53
GIFT —An R package to access the Global Inventory of Floras and Traits
Denelle, P., Weigelt, P., & Kreft, H. (2023) · Methods in Ecology and Evolution · doi:10.1111/2041-210x.14213 · Cited by 58
“Raster layers mostly contain continuous metrics that provide insights into macroclimatic, topographic, edaphic or paleoclimatic variables or sometimes categorical information like the distribution of soil classes (Hengl et al., 2017).”
BackgroundMajor drivers of soil acidification over 30 years differ in paddy and upland soils in China
Xu, D., Ros, G. H., Zhu, Q., Xu, M., Wen, S., Cai, Z., Zhang, F. S., & VRIES, W. D. (2024) · The Science of The Total Environment · doi:10.1016/j.scitotenv.2024.170189 · Cited by 47
Ali, A., Erkossa, T., Gudeta, K., Abera, W., Mesfin, E., Mekete, T., Haile, M. T., Haile, W., Abegaz, A., Tafesse, D., et al. (2024) · SOIL · doi:10.5194/soil-10-189-2024 · Cited by 54
“…of Nitisols was overshadowed by Vertisols and Luvisols, resulting in a likely underestimation of the Nitisols area coverage. management) that could capture the variability of the country’s heterogeneous landscapes; (iii) dimension reduction of co-variates; (iv) use of remedial measures for…”
BackgroundMethodInfluentialNauman, T., Duniway, M. C., Villarreal, M. L., & Poitras, T. B. (2017) · The Science of The Total Environment · doi:10.1016/j.scitotenv.2017.01.034 · Cited by 50
“Through efforts similar to SoilGrids (Hengl et al., 2017), PSCS maps could be produced globally, but this will require concerted effort, especially at 30-m resolution due to computational challenges (Chaney et al.”
MethodNajmuddin, O., Deng, X., & Jia, S. (2017) · Physics and Chemistry of the Earth Parts A/B/C · doi:10.1016/j.pce.2017.06.002 · Cited by 51
Huang, J., Minasny, B., McBratney, A. B., Padarian, J., & Triantafilis, J. (2017) · The Science of The Total Environment · doi:10.1016/j.scitotenv.2017.09.136 · Cited by 50
Upscaling soil-atmosphere CO2 and CH4 fluxes across a topographically complex forested landscape
Warner, D. L., Guevara, M., Inamdar, S., & Vargas, R. (2018) · Agricultural and Forest Meteorology · doi:10.1016/j.agrformet.2018.09.020 · Cited by 49
Self-citationWildfire Impacts on Slope Stability Triggering in Mountain Areas
Abbate, A., Longoni, L., Ivanov, V. I., & Papini, M. (2019) · Geosciences · doi:10.3390/geosciences9100417 · Cited by 48
Bessah, E., Raji, A. O., Taiwo, O. J., Agodzo, S. K., Ololade, O. O., & Strapasson, A. (2019) · Journal of Hydrology Regional Studies · doi:10.1016/j.ejrh.2019.100654 · Cited by 47
Data synthesis for crop variety evaluation. A review
Brown, D., den Bergh, I. V., de Bruin, S., Machida, L., & van Etten, J. (2020) · Agronomy for Sustainable Development · doi:10.1007/s13593-020-00630-7 · Cited by 65
“For instance, data on rainfall, temperature, elevation and soils are openly and freely available from open and public databases such as Climate Hazards Group InfraRed Precipitation with Station data (CHIRPS) (Funk et al. 2015), MODIS Land Surface Temperature (Wan et al. 2015), Hole-filled SRTM for the globe version 4…”
BackgroundMethods and approaches to advance soil macroecology
White, H. J., León‐Sánchez, L., Burton, V. J., Cameron, E. K., Caruso, T., Cunha, L., Dirilgen, T., Jurburg, S. D., Kelly, R., Kumaresan, D., et al. (2020) · Global Ecology and Biogeography · doi:10.1111/geb.13156 · Cited by 56
“…provide environmental information at coarse resolutions (2 km × 2 km) but large geographical extents, that is, continental, whilst machine learning techniques combining soil and earth observation data can provide global gridded soil information at a resolution of 250 m × 250 m (Hengl et al., 2017).”
BackgroundSpatially divergent trends of nitrogen versus phosphorus limitation across European forests
Du, E., van Doorn, M., & VRIES, W. D. (2021) · The Science of The Total Environment · doi:10.1016/j.scitotenv.2021.145391 · Cited by 49
Cho, S., Kang, M., Ichii, K., Kim, J., Lim, J., Chun, J., Park, C., Kim, H. S., Choi, S.-W., Lee, S.-H., et al. (2021) · Agricultural and Forest Meteorology · doi:10.1016/j.agrformet.2021.108653 · Cited by 52
Akinyemi, F. O., & Speranza, C. I. (2021) · International Journal of Applied Earth Observation and Geoinformation · doi:10.1016/j.jag.2021.102644 · Cited by 55
Human-Induced water loss from closed inland Lakes: Hydrological simulations in China’s Daihai lake
Wang, S., Xu, C., Zhang, W., Chen, H., & Zhang, B. (2022) · Journal of Hydrology · doi:10.1016/j.jhydrol.2022.127552 · Cited by 47
McBratney, A. B., de Gruijter, J., & Bryce, A. (2018) · Geoderma · doi:10.1016/j.geoderma.2018.11.048 · Cited by 54
A framework for understanding online group behaviors during a catastrophic event
Kim, J., & Park, H. (2019) · International Journal of Information Management · doi:10.1016/j.ijinfomgt.2019.102051 · Cited by 48
Barrio-Anta, M., Castedo‐Dorado, F., Cámara-Obregón, A., & López-Sánchez, C. A. (2020) · Annals of Forest Science · doi:10.1007/s13595-020-00941-5 · Cited by 50
Chiputwa, B., Blundo‐Canto, G., Steward, P., Andrieu, N., & Ndiaye, O. (2021) · Agricultural Systems · doi:10.1016/j.agsy.2021.103309 · Cited by 55
Dari, J., Brocca, L., Quintana‐Seguí, P., Casadei, S., Escorihuela, M., Stefan, V., & Morbidelli, R. (2022) · Advances in Water Resources · doi:10.1016/j.advwatres.2022.104130 · Cited by 46
Schweppe, R., Thober, S., Müller, S., Kelbling, M., Kumar, R., Attinger, S., & Samaniego, L. (2022) · Geoscientific model development · doi:10.5194/gmd-15-859-2022 · Cited by 49
Sepúlveda, U. M., Mendoza, P. A., Mizukami, N., & Newman, A. J. (2022) · Hydrology and earth system sciences · doi:10.5194/hess-26-3419-2022 · Cited by 57
Global Soil Salinity Prediction by Open Soil Vis-NIR Spectral Library
Zhou, Y., Chen, S., Hu, B., Ji, W., Li, S., Hong, Y., Xu, H., Wang, N., Xue, J., Zhang, X., et al. (2022) · Remote Sensing · doi:10.3390/rs14215627 · Cited by 48
“It runs much faster and requires less memory in model fitting, so it is a preferable solution for big data modelling [34,35].”
BackgroundRezaei, M., Mousavi, S. R., Rahmani, A., Zeraatpisheh, M., Rahmati, M., Pakparvar, M., Abadi, V. A. J. M., Seuntjens, P., & Cornelis, W. (2023) · Computers and Electronics in Agriculture · doi:10.1016/j.compag.2023.107821 · Cited by 53
Wu, D., Zheng, L., Wang, Y., Gong, J., Li, J., & Chen, Q. (2024) · Journal of Cleaner Production · doi:10.1016/j.jclepro.2024.143022 · Cited by 47
Predicting gully densities at sub‐continental scales: a case study for the Horn of Africa
Vanmaercke, M., Chen, Y., Haregeweyn, N., Geeter, S. D., Campforts, B., Heyndrickx, W., Tsunekawa, A., & Poesen, J. (2020) · Earth Surface Processes and Landforms · doi:10.1002/esp.4999 · Cited by 50
“In addition, also the soil characteristics considered here were derived from machine learning approaches and may be subject to important uncertainties (Table 1; Hengl et al., 2017).”
BackgroundMethodNauman, T., Duniway, M. C., Webb, N. P., & Belnap, J. (2018) · Earth Surface Processes and Landforms · doi:10.1002/esp.4457 · Cited by 53
“Spatial modeling of q was used to compare the relative impacts of distributed rangeland land uses (livestock, OHV, and low land-use areas) and unpaved road networks on aeolian sediment transport rates (following similar workflow to Nauman and Duniway, 2016; Hengl et al., 2017).”
MethodThe relationship between environmental niche breadth and geographic range size across plant species
Cardillo, M., Dinnage, R., & McAlister, W. H. (2018) · Journal of Biogeography · doi:10.1111/jbi.13477 · Cited by 46
“Soil type layers (pH, soil depth, clay content and organic carbon content) were obtained from www.soilgrids.org (Hengl et al., 2017) at 250 m resolution, then aggregated to the same grid as the climate data, using the aggregate function in the R package ‘raster’.”
MethodThe leaf economic and plant size spectra of European forest understory vegetation
Cubino, J. P., Biurrun, I., Bonari, G., Braslavskaya, T. Y., Font, X., Jandt, U., Jansen, F., Rašomavičius, V., Škvorc, Ž., Willner, W., et al. (2021) · Ecography · doi:10.1111/ecog.05598 · Cited by 51
“Finally, we also obtained data for soil pH (at 15 cm depth) at a resolution of ~ 250 m (rescaled to 30 arc seconds) from the SoilGrids database (<https://soilgrids.org/>; Hengl et al. 2017).”
MethodFerraz, K. M. P. M. D. B., Oliveira, B. G., Attias, N., & Desbiez, A. L. J. (2021) · Perspectives in Ecology and Conservation · doi:10.1016/j.pecon.2021.01.001 · Cited by 53
Dering, M., Baranowska, M., Beridze, B., Chybicki, I. J., Danelia, I., Iszkuło, G., Kvartskhava, G., Kosiński, P., Rączka, G., Thomas, P. A., et al. (2021) · Scientific Reports · doi:10.1038/s41598-021-02098-1 · Cited by 45
Acidification of soil due to forestation at the global scale
Huang, X., Cui, C., Hou, E., Li, F., Liu, W., Jiang, L., Luo, Y., & Xu, X. (2021) · Forest Ecology and Management · doi:10.1016/j.foreco.2021.119951 · Cited by 45
“Any missing values of soil properties were filled with values derived from the SoilGrids database (Hengl et al., 2017) or the Regridded Harmonized World Soil Database v1.”
MethodCombination of Hyperspectral and Machine Learning to Invert Soil Electrical Conductivity
Jia, P., Zhang, J., He, W., Hu, Y. C., Zeng, R., Zamanian, K., Jia, K., & Zhao, X. (2022) · Remote Sensing · doi:10.3390/rs14112602 · Cited by 47
Land Suitability for Cocoa Cultivation in Peru: AHP and MaxEnt Modeling in a GIS Environment
Briceño, N. B. R., García, L., Cotrina-Sánchez, A., Goñas, M., López, R. S., Silva-López, J. O., & Oliva, M. (2022) · Agronomy · doi:10.3390/agronomy12122930 · Cited by 45
“Soil physicochemical properties, with 250 m spatial resolution, were obtained from SoilGrids 2.0 [42].”
MethodInfluentialDas, N. N., Jalilvand, E., Tajrishy, M., Tajrishy, M., Kumar, S. V., & Das, N. N. (2023) · Water Resources Research · doi:10.1029/2022wr033342 · Cited by 45
Leung, D. M., Kok, J. F., Li, L., Okin, G. S., Prigent, C., Klose, M., García‐Pando, C. P., Menut, L., Mahowald, N. M., Lawrence, D. M., et al. (2023) · Atmospheric chemistry and physics · doi:10.5194/acp-23-6487-2023 · Cited by 53
Nitrogen addition delays the emergence of an aridity-induced threshold for plant biomass
Li, H., Terrer, C., Berdugo, M., Maestre, F. T., Zhu, Z., Peñuelas, J., Yu, K., Luo, L. G., Gong, J.-Y., & Ye, J. (2023) · National Science Review · doi:10.1093/nsr/nwad242 · Cited by 49
“The soil total nitrogen at 0–30 cm were obtained from the Soil Grid dataset [ 83 ], and the total soil phosphorus dataset (0–30 cm) were obtained from the dataset in He et al. (2021) [ 84 ].”
Liu, C., Li, W., Xu, J., Zhou, H., Wang, W., & Wang, H. (2023) · Ecological Indicators · doi:10.1016/j.ecolind.2023.111365 · Cited by 45
Global 1 km land surface parameters for kilometer-scale Earth system modeling
Li, L., Bisht, G., Hao, D., & Leung, L.-Y. R. (2024) · Earth system science data · doi:10.5194/essd-16-2007-2024 · Cited by 67
Spatial autocorrelation in machine learning for modelling soil organic carbon
Kmoch, A., Harrison, C. T., Choi, J., & Uuemaa, E. (2025) · Ecological Informatics · doi:10.1016/j.ecoinf.2025.103057 · Cited by 51
Global impoverishment of natural vegetation revealed by dark diversity
Pärtel, M., Tamme, R., Carmona, C. P., Riibak, K., Moora, M., Bennett, J. A., Chiarucci, A., Chytrý, M., de Bello, F., Eriksson, O., et al. (2025) · Nature · doi:10.1038/s41586-025-08814-5 · Cited by 63
“We used mean annual temperature and annual precipitation from the CHELSA database (resolution 1 km) 60,61 , soil pH, organic carbon content, sand fraction proportion from SoilGrids (resolution 250 m) 62 and the topographic ruggedness of the terrain (resolution 250 m) 63 .”
Nauman, T., & Duniway, M. C. (2019) · Geoderma · doi:10.1016/j.geoderma.2019.03.037 · Cited by 47
Yunis, C. R. C., López, R. S., Oliva, M., Barboza, E., Silva-López, J. O., Trigoso, D. I., & Briceño, N. B. R. (2020) · ISPRS International Journal of Geo-Information · doi:10.3390/ijgi9010028 · Cited by 50
“This system provides global predictions for the standard numerical properties of the soil at seven depths and 250 m resolution, generated from 150,000 soil profiles, 158 covariates obtained from remote sensors and a set of machine learning methods [49].”
Jing, W., Zhang, P., Zhao, X., Yang, Y., Jiang, H., Xu, J., Yang, J., & Li, Y. (2020) · Journal of Hydrology · doi:10.1016/j.jhydrol.2020.125239 · Cited by 47
López-Sánchez, C. A., Castedo‐Dorado, F., Cámara-Obregón, A., & Barrio-Anta, M. (2020) · Forest Ecology and Management · doi:10.1016/j.foreco.2020.118723 · Cited by 53
Nayak, H. S., Silva, . V., Parihar, C. M., Kakraliya, S. K., Krupnik, T. J., Bijarniya, D., Jat, M. L., Sharma, P. C., Jat, H. S., Sidhu, H. S., et al. (2021) · Field Crops Research · doi:10.1016/j.fcr.2021.108328 · Cited by 51
“, percentage of sand, silt, and clay in the top 0–30 cm layer) were obtained for each field from the International Soil Reference and Information Centre (ISRIC) soil database at a spatial resolution of 250 m (Hengl et al., 2017).”
MethodGap-free global annual soil moisture: 15 km grids for 1991–2018
Guevara, M., Taufer, M., & Vargas, R. (2021) · Earth system science data · doi:10.5194/essd-13-1711-2021 · Cited by 46
Self-citationCao, H., Henze, D. K., Zhu, L., Shephard, M. W., Cady‐Pereira, K., Dammers, E., Sitwell, M., Heath, N. K., Lonsdale, C. R., Bash, J. O., et al. (2022) · Journal of Geophysical Research Atmospheres · doi:10.1029/2021jd035687 · Cited by 47
“to a more recent dataset (Hengl et al., 2017), which has been constrained using long-term soil profile measurements (Batjes et al.”
MethodImproving the Performance of Index Insurance Using Crop Models and Phenological Monitoring
Afshar, M. H., Foster, T., Higginbottom, T. P., Parkes, B., Hufkens, K., Mansabdar, S., Ceballos, F., & Kramer, B. (2021) · Remote Sensing · doi:10.3390/rs13050924 · Cited by 48
Nasta, P., Szabó, B., & Romano, N. (2021) · Journal of Hydrology Regional Studies · doi:10.1016/j.ejrh.2021.100903 · Cited by 49
“…chemical properties provides high-quality and detailed (high-spatial-resolution) information to support the implementation of PTFs for modeling applications, such as SoilGrids 250 m (Hengl et al., 2017), and its recently updated version, SoilGrids 2.0 (Batjes et al., 2020; de Sousa et al., 2021).”
InfluentialTranslating open-source remote sensing data to crop water productivity improvement actions
Safi, A. R., Karimi, P., Mul, M., Chukalla, A. D., & de Fraiture, C. (2021) · Agricultural Water Management · doi:10.1016/j.agwat.2021.107373 · Cited by 44
Bouma, J., Bonfante, A., Basile, A., van Tol, J. J., Broeke, M. J. D. H., Mulder, M., Heinen, M., Rossiter, D. G., Poggio, L., & Hirmas, D. R. (2022) · Geoderma · doi:10.1016/j.geoderma.2022.115988 · Cited by 50
Recent advances and opportunities in data assimilation for physics-based hydrological modeling
Camporese, M., & Girotto, M. (2022) · Frontiers in Water · doi:10.3389/frwa.2022.948832 · Cited by 44
“Starting from prior parameter distributions that can be extracted from globally available datasets (e.g., Batjes, 1997; Hengl et al., 2017), data assimilation allows for their dynamic update, which can lead to improved model predictions (e.”
MethodRegional uniqueness of tree species composition and response to forest loss and climate change
van Tiel, N., Fopp, F., Brun, P., van den Hoogen, J., Karger, D. N., Casadei, C. M., Lyu, L., Tuia, D., Zimmermann, N. E., Crowther, T. W., et al. (2024) · Nature Communications · doi:10.1038/s41467-024-48276-3 · Cited by 53
Soil health in Latin America and the Caribbean
Poppiel, R. R., Cherubin, M. R., Novais, J. J., & Demattê, J. A. M. (2025) · Communications Earth & Environment · doi:10.1038/s43247-025-02021-w · Cited by 48
“Even when soil datasets are available on a global scale 23,24 , they have gaps due to remote or inaccessible regions, causing generalizations in the assessment of soil nuances across landscapes and climates worldwide 25 – 27 .”
Stabilization of acidification in China’s cropland soils
Zhang, W., Wei, C., Li, J., Zhou, Q., Ma, J., Li, Y., He, Y.-L., Zou, Y., Luo, Y., & Yao, Y. (2025) · Nature Geoscience · doi:10.1038/s41561-025-01813-1 · Cited by 50
“Recent advancements in statistical learning techniques have produced global soil databases such as SoilGrids 15 and the Harmo-nized World Soil Database 16 , offering high-resolution, spatially explicit soil data, including pH, but these efforts primarily focus on static mapping 17,18 , failing to…”
Rethinking Global Soil Degradation: Drivers, Impacts, and Solutions
Shokri, N., Robinson, D. A., Afshar, M. H., Alewell, C., Aminzadeh, M., Arthur, E., Broothaerts, N., Campbell, G. A., Eklund, L., Gupta, S., et al. (2025) · Reviews of Geophysics · doi:10.1029/2025rg000883 · Cited by 57
On Upscaling of Soil Microbial Processes and Biogeochemical Fluxes From Aggregates to Landscapes
Ebrahimi, A. N., & Or, D. (2018) · Journal of Geophysical Research Biogeosciences · doi:10.1029/2017jg004347 · Cited by 48
“Additionally, readily available soil global maps at high resolution (e.g., soilgrids; Hengl et al., 2017) could be used to extract soil physical and chemical properties for the region of the interest.”
BackgroundSoil microbial anaplerotic CO2 fixation in temperate soils
Nel, J. A., & Cramer, M. D. (2018) · Geoderma · doi:10.1016/j.geoderma.2018.08.014 · Cited by 44
Why tree lines are lower on islands—Climatic and biogeographic effects hold the answer
Karger, D. N., Kessler, M. R., Conrad, O., Weigelt, P., Kreft, H., König, C., & Zimmermann, N. E. (2019) · Global Ecology and Biogeography · doi:10.1111/geb.12897 · Cited by 52
“We assumed an upper soil layer that holds a maximum of 30 mm of water and a lower layer with a water holding capacity taken from Soilgrids (Hengl et al., 2017) aggregated to 30 arc second resolution.”
BackgroundThe landscape of soil carbon data: Emerging questions, synergies and databases
Malhotra, A., Todd-Brown, K. E., Nave, L. E., Batjes, N. H., Holmquist, J. R., Hoyt, A. M., Iversen, C. M., Jackson, R. B., Lajtha, K., Lawrence, C. R., et al. (2019) · Progress in Physical Geography Earth and Environment · doi:10.1177/0309133319873309 · Cited by 54
“If users are interested in global carbon stocks, they may use the entire World Soil Information Service (WoSIS) database (Batjes et al., 2017) or its derived products (SoilGrids250 m; Hengl et al., 2017).”
MethodSelf-citationMeasho, S., Chen, B., Pellikka, P., Trisurat, Y., Guo, L., Sun, S., & Zhang, H. (2020) · Journal of Geophysical Research Biogeosciences · doi:10.1029/2020jg005632 · Cited by 49
“Soil depth and plant available water content inputs were extracted from Africa SoilGrids (http://www.isric. org/data/AfSoilGrids250m) at 250‐m spatial resolutions of world soil information service (Hengl et al., 2017).”
MethodResultCano‐Díaz, C., Maestre, F. T., Eldridge, D. J., Singh, B. K., Bardgett, R. D., Fierer, N., & Delgado‐Baquerizo, M. (2020) · Global Ecology and Biogeography · doi:10.1111/geb.13173 · Cited by 49
“Soil properties for this grid were obtained from SoilGrids (Hengl et al., 2017).”
MethodBriceño, N. B. R., Cotrina-Sánchez, A., Barboza, E., Gurbillón, M. Á. B., Sarmiento, F. O., Sotomayor, D. A., Oliva, M., & López, R. S. (2020) · Diversity · doi:10.3390/d12080305 · Cited by 49
Functional diversity of the Australian flora: Strong links to species richness and climate
Andrew, S. C., Mokany, K., Falster, D. S., Wenk, E. H., Wright, I. J., Merow, C., Adams, V. M., & Gallagher, R. V. (2021) · Journal of Vegetation Science · doi:10.1111/jvs.13018 · Cited by 48
Soil Aggregate Stability Mapping Using Remote Sensing and GIS-Based Machine Learning Technique
Bouslıhım, Y., Rochdi, A., Aboutayeb, R., Paaza, N. E. A., Miftah, A., & Hssaini, L. (2021) · Frontiers in Earth Science · doi:10.3389/feart.2021.748859 · Cited by 47
“…of a large number of satellite images (Sepuru and Dude, 2018), and the availability of various databases related to soil (Batjes et al., 2017; Hengl et al., 2017), topography (Gonzalez-Moradas and Viveen, 2020), or climate (Fick and Hijmans, 2017), which are shared with the researchers for…”
BackgroundJalilvand, E., Abolafia‐Rosenzweig, R., Tajrishy, M., & Das, N. N. (2021) · IEEE Journal of Selected Topics in Applied Earth Observations and Remote Sensing · doi:10.1109/jstars.2021.3119228 · Cited by 52
CCAM: China Catchment Attributes and Meteorology dataset
Hao, Z., Jin, J., Xia, R., Tian, S., Yang, W., Liu, Q., Zhu, M., Ma, T., Jing, C., & Zhang, Y. (2021) · Earth system science data · doi:10.5194/essd-13-5591-2021 · Cited by 52
“The proposed dataset has a total of 54 soil attributes (Table A1) derived from Hengl et al. (2017), Dai et al. (2019), and Shangguan et al. (2013) Five categories of soil characteristics (pH in H 2 O, organic carbon content, depth to bedrock, cation exchange capacity (CEC), and bulk density) are…”
MethodCushman, K. C., Detto, M., García, M., & Muller‐Landau, H. C. (2022) · Ecology Letters · doi:10.1111/ele.13978 · Cited by 53
Abera, W., Tamene, L. D., Tesfaye, K., Jimenez, D. R., Dorado, H., Erkossa, T., Kihara, J., Ahmed, J. S., Amede, T., & Ramírez-Villegas, J. (2022) · Experimental Agriculture · doi:10.1017/s0014479722000047 · Cited by 58
“Soil data were downloaded from the 250-m spatial resolution SoilGrids database (Hengl et al. , 2017).”
Todd-Brown, K. E., Abramoff, R., Beem-Miller, J. P., Blair, H. K., Earl, S. R., Frederick, K. J., Fuka, D. R., Guevara, M., Harden, J. W., Heckman, K., et al. (2022) · Biogeosciences · doi:10.5194/bg-19-3505-2022 · Cited by 49
Self-citationPohl, F., Rakovec, O., Rebmann, C., Hildebrandt, A., Boeing, F., Hermanns, F., Attinger, S., Samaniego, L., & Kumar, R. (2023) · Scientific Data · doi:10.1038/s41597-023-02192-1 · Cited by 44
Modelling and prediction of wind damage in forest ecosystems of the Sudety Mountains, SW Poland
Pawlik, Ł., & Harrison, S. P. (2021) · The Science of The Total Environment · doi:10.1016/j.scitotenv.2021.151972 · Cited by 48
Correlates of geoxyle diversity in Afrotropical grasslands
Meller, P., Stellmes, M., Fidélis, A., & Finckh, M. (2022) · Journal of Biogeography · doi:10.1111/jbi.14305 · Cited by 50
Digital mapping of soil organic carbon stocks in the forest lands of Dominican Republic
Duarte, E., Zagal, E., V, Barrera, J. A., Dubé, F., Casco, F., & Hernández, A. J. (2022) · European Journal of Remote Sensing · doi:10.1080/22797254.2022.2045226 · Cited by 48
Climate change induced elevational range shifts of Himalayan tree species
Maharjan, S. K., Sterck, F. J., Raes, N., Zhao, Y., & Poorter, L. (2022) · Biotropica · doi:10.1111/btp.13159 · Cited by 47
Yi, C., Li, X., Zeng, J., Fan, L., Xie, Z., Gao, L., Xing, Z., Ma, H., Boudah, A., Zhou, H., et al. (2023) · Journal of Hydrology · doi:10.1016/j.jhydrol.2023.129325 · Cited by 47
Shen, Y., Nielsen, K., Revel, M., Liu, D., & Yamazaki, D. (2023) · Earth system science data · doi:10.5194/essd-15-2781-2023 · Cited by 52
“The pH in H2O, cation exchange capacity (CEC), bulk density, and organic carbon content were determined from the SoilGrids250m dataset (SG250; Hengl et al., 2017).”
MethodWu, D., Zheng, L., Wang, Y., Gong, J., Li, J., & Chen, Q. (2023) · Ecological Indicators · doi:10.1016/j.ecolind.2023.111322 · Cited by 47
Novel temperatures are already widespread beneath the world’s tropical forest canopies
Trew, B. T., Edwards, D. P., Lees, A. C., Klinges, D. H., Early, R., Svátek, M., Plichta, R., Matula, R., Okello, J., Niessner, A., et al. (2024) · Nature Climate Change · doi:10.1038/s41558-024-02031-0 · Cited by 53
“…both steps used the microclima 69 package for R v.4.2 70 ; (5) soil type, sourced at a gridded spatial resolution of 250 m from soilgrids.org 71 , which was then resam-pled to a gridded spatial resolution of 5 km using the nearest-neighbour method; (6) a digital elevation model, sourced…”
InfluentialGeospatial Mapping of Soil Organic Carbon Using Regression Kriging and Remote Sensing
Kumar, N., Velmurugan, A., Hamm, N., & Dadhwal, V. K. (2018) · Journal of the Indian Society of Remote Sensing · doi:10.1007/s12524-017-0738-y · Cited by 43
“Because of its utility, several studies have used RS data for digital soil mapping (Mulder et al. 2011; Dewitte et al. 2012; Nawar et al. 2015; Hengl et al. 2017).”
BackgroundMethodBetter estimates of soil carbon from geographical data: a revised global approach
Duarte‐Guardia, S., Peri, P. L., Amelung, W., Sheil, D., Laffan, S. W., Borchard, N., Bird, M. I., Dieleman, W. I. J., Pepper, D. A., Zutta, B. R., et al. (2018) · Mitigation and Adaptation Strategies for Global Change · doi:10.1007/s11027-018-9815-y · Cited by 45
“This approach has the drawback that it calculates SOC from soil properties, such as bulk density, soil organic matter, and particle distribution, which has much higher uncertainty than SOC calculated directly from empirical data (Hengl et al. 2014; Hengl et al. 2017).”
BackgroundMethodZhu, Y., Wei, W., Li, H., Wang, B., Yang, X., & Liu, Y. (2018) · Global Ecology and Conservation · doi:10.1016/j.gecco.2018.e00501 · Cited by 46
Ko, A., Mascaro, G., & Vivoni, E. R. (2019) · Water Resources Research · doi:10.1029/2018wr023521 · Cited by 44
“…(Hengl et al., 2017), consists of global maps of soil physical properties, including bulk density and content mass fractions of clay, silt, and sand at multiple depths, which were generated by merging soil profiles and remote sensing imagery (see Hengl et al., 2014, 2017, for details).”
BackgroundMethodInfluentialWu, T., Luo, J., Dong, W., Sun, Y., Xia, L., & Zhang, X. (2019) · IEEE Journal of Selected Topics in Applied Earth Observations and Remote Sensing · doi:10.1109/jstars.2019.2902375 · Cited by 47
Apparent ecosystem carbon turnover time: uncertainties and robust features
Fan, N., Koirala, S., Reichstein, M., Thurner, M., Avitabile, V., Santoro, M., Ahrens, B., Weber, U., & Carvalhais, N. (2020) · Earth system science data · doi:10.5194/essd-12-2517-2020 · Cited by 44
“First, there are relatively fewer measurements of BD, missing in several horizons (Hengl et al., 2017).”
BackgroundA Sequentially Coupled Catchment‐Scale Numerical Model for Snowmelt‐Induced Soil Slope Instabilities
Subramanian, S. S., Fan, X., Yunus, A. P., van Asch, T. W. J., Scaringi, G., Xu, Q., Dai, L., Ishikawa, T., & Huang, R. (2020) · Journal of Geophysical Research Earth Surface · doi:10.1029/2019jf005468 · Cited by 43
“We used the 250 m resolution global soil depth data by Hengl et al. (2017) and Shangguan et al. (2017) and cross‐verified them with two insitu measurements at different sites inside the Imo basin Yamabe et al. (2010).”
MethodEisenberg, J., & Muvundja, F. A. (2020) · Land · doi:10.3390/land9040125 · Cited by 43
“The AfSIS dataset (African Soil Information Service; Table 1) contains grain sizes and organic carbon content for different soil depths [16,46,47] and was therefore used for K factor calculations.”
MethodWeber, T. K. D., Finkel, M., Gonçalves, M. C., Vereecken, H., & Diamantopoulos, E. (2020) · Water Resources Research · doi:10.1029/2019wr026820 · Cited by 43
“One step toward achieving this is by mapping model parameters based on soil property (Hengl et al., 2017) or hydraulic property (Tóth et al.”
BackgroundMethodBanerjee, O., Crossman, N. D., Vargas, R., Brander, L., Verburg, P. H., Cicowiez, M., Hauck, J., & McKenzie, E. (2020) · Ecosystem Services · doi:10.1016/j.ecoser.2020.101202 · Cited by 51
Self-citationChallenges and opportunities of species distribution modelling of terrestrial arthropod predators
Mammola, S., Pétillon, J., Hacala, A., Monsimet, J., Marti, S., Cardoso, P., & Lafage, D. (2021) · Diversity and Distributions · doi:10.1111/ddi.13434 · Cited by 45
“As in the case of climatic variables, there is a general paucity of raster data at a meaningful spatial resolution, although the availability of global- scale, high- resolution variables is growing (e.g. SoilTemp: Lembrechts et al., 2020; SoilGrid: Hengl et al., 2017).”
Background
Metadata
- Authors
- Hengl, T., Mendes de Jesus, J., Heuvelink, G. B. M., Ruiperez Gonzalez, M., Kilibarda, M., Blagotić, A., Shangguan, W., Wright, M. N., Geng, X., Bauer-Marschallinger, B., Guevara, M. A., Vargas, R., MacMillan, R. A., Batjes, N. H., Leenaars, J. G. B., Ribeiro, E., Wheeler, I., Mantel, S., & Kempen, B.
- Affiliations
- ISRIC - World Soil Information (NL)
- University of Belgrade (RS)
- Sun Yat-sen University (CN)
- University of Lübeck (DE)
- Agriculture and Agri-Food Canada (CA)
- TU Wien (AT)
- University of Delaware (US)
- ORCID
- Venue
- PLOS ONE
- Publisher
- Public Library of Science (PLoS)
- Published
- 2017-02-16
- Volume
- 12
- Issue
- 2
- Pages
- e0169748
- ISSN
- 1932-6203 (ISSN-L)
- PMC
- PMC5313206
- OpenAlex
- W2588003345
- Cited by
- 4,733
- References
- 89
- Citations by year
- 2026: 591 · 2025: 654 · 2024: 610 · 2023: 634 · 2022: 669 · 2021: 672 · 2020: 402 · 2019: 265 · 2018: 173 · 2017: 56
- FWCI
- 137.14
- Type
- journal article
- Language
- en
- Open access
- gold
- doi.org
- Licence
- Locations
- PLoS ONE (publishedVersion, cc-by)
- PubMed Central (publishedVersion, cc-by)
- PubMed (publishedVersion)
- RePEc: Research Papers in Economics (submittedVersion)
- DOAJ (DOAJ: Directory of Open Access Journals) (submittedVersion)
- GraFar (University of Belgrade, Faculty of Civil Engineering) (submittedVersion, cc-by)
- Socio-Environmental Systems Modeling (submittedVersion, cc-by)
- Data Archiving and Networked Services (DANS) (submittedVersion, other-oa)
- Topics
- Life Sciences › Agricultural and Biological Sciences › Soil Science › Soil Geostatistics and Mapping
- Physical Sciences › Environmental Science › Environmental Engineering › Soil Moisture and Remote Sensing
- Physical Sciences › Environmental Science › Management, Monitoring, Policy and Law › Soil and Land Suitability Analysis
- Keywords
- SoilGrids, soil properties, soil organic carbon, soil bulk density, cation exchange capacity, soil pH, soil texture, coarse fragments, bedrock depth, soil classification, USDA soil classification, MODIS, random forest, gradient boosting, multinomial logistic regression, ensemble learning, accuracy assessment, soil mapping
- MeSH terms
- Machine Learning, Algorithms, Conservation of Natural Resources, Environmental Monitoring, Humans, Models, Theoretical, Soil, Geographic Information Systems
About these checks
Registry, retraction, Cites and statistics results are computed, not judged, with one exception: a printed reference that no index lists is read once by a model before it counts as a citation error. Claims are extracted by a model and kept only when their quote appears verbatim in the text; each cited source is then checked, with a model’s help, for whether it says what the claim relies on. Those verdicts can be wrong — read the claim’s quote and the cited source before relying on one.
Statistics and arithmetic are recomputed, not judged.
Confidence bands are shown only for fields calibrated on our annotated test set. None is calibrated yet, so no band is shown.
What counts as a claim ›How we measure confidence ›How we check this ›
Are you an author, or do you see a problem with this page? Request a review
Data sources
Bibliographic data: Semantic Scholar, OpenAlex, Crossref.
Contains information from the Semantic Scholar Academic Graph Datasets, made available under the ODC Attribution License (ODC-BY 1.0).
Semantic Scholar’s data is described in: Kinney, R., et al. (2023). The Semantic Scholar Open Data Platform. arXiv:2301.10140.
