

SoilGrids250m: Global gridded soil information based on machine learning
Open accessThe DOI matches its Crossref record; 85 of the 89 references it cites were found in a registry or an index.
Abstract
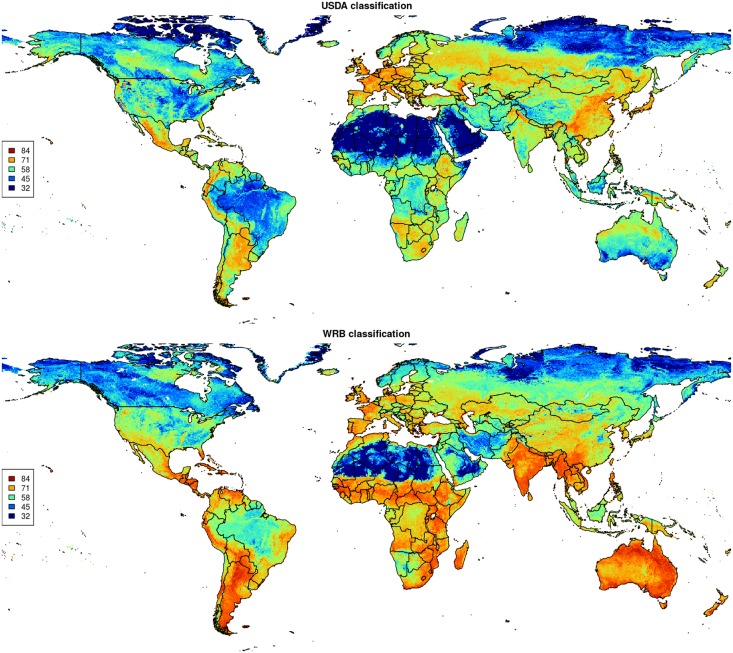
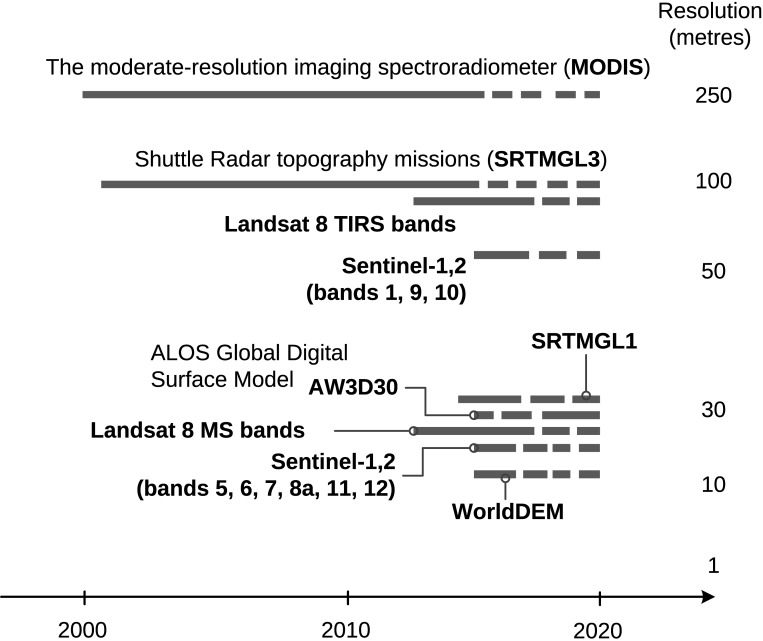
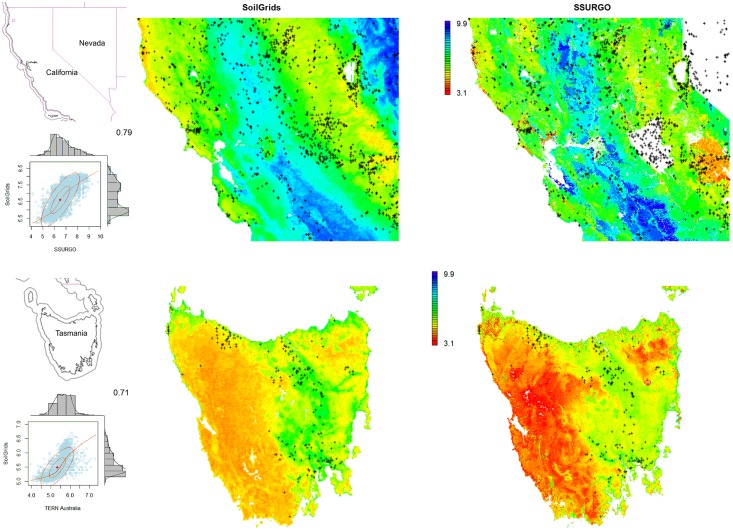
This paper describes the technical development and accuracy assessment of the most recent and improved version of the SoilGrids system at 250m resolution (June 2016 update). SoilGrids provides global predictions for standard numeric soil properties (organic carbon, bulk density, Cation Exchange Capacity (CEC), pH, soil texture fractions and coarse fragments) at seven standard depths (0, 5, 15, 30, 60, 100 and 200 cm), in addition to predictions of depth to bedrock and distribution of soil classes based on the World Reference Base (WRB) and USDA classification systems (ca. 280 raster layers in total). Predictions were based on ca. 150,000 soil profiles used for training and a stack of 158 remote sensing-based soil covariates (primarily derived from MODIS land products, SRTM DEM derivatives, climatic images and global landform and lithology maps), which were used to fit an ensemble of machine learning methods-random forest and gradient boosting and/or multinomial logistic regression-as implemented in the R packages ranger, xgboost, nnet and caret. The results of 10-fold cross-validation show that the ensemble models explain between 56% (coarse fragments) and 83% (pH) of variation with an overall average of 61%. Improvements in the relative accuracy considering the amount of variation explained, in comparison to the previous version of SoilGrids at 1 km spatial resolution, range from 60 to 230%. Improvements can be attributed to: (1) the use of machine learning instead of linear regression, (2) to considerable investments in preparing finer resolution covariate layers and (3) to insertion of additional soil profiles. Further development of SoilGrids could include refinement of methods to incorporate input uncertainties and derivation of posterior probability distributions (per pixel), and further automation of spatial modeling so that soil maps can be generated for potentially hundreds of soil variables. Another area of future research is the development of methods for multiscale merging of SoilGrids predictions with local and/or national gridded soil products (e.g. up to 50 m spatial resolution) so that increasingly more accurate, complete and consistent global soil information can be produced. SoilGrids are available under the Open Data Base License.
Overview
The claims and statistics of this paper haven’t been checked yet.
Free: it reads the open-access text and checks the first 5 claims that cite a source we can check. Create a free account to check every claim.
Integrity signals
Registry
Cites
Statistics
Figures






Verification
Claims the paper makes
The claims and statistics of this paper haven’t been checked yet.
Free: it reads the open-access text and checks the first 5 claims that cite a source we can check. Create a free account to check every claim.
Claims other papers make about this one
Each is checked against this paper’s own text: does it say what the citing paper says it does?
The source backs part of the claim, not all of it — or backs it for a different population, condition or comparison.
In the citing paper
“These uncertainties are mostly due to the uneven distribution and overall scarcity of field data for modelling and validating carbon stocks in the biomass and soil 27,64,65 .”
From Global priority areas for ecosystem restoration (2020) · cites this paper as [65]
Experimental — accuracy not yet measured
Self-check
Percentages, sums and reported differences re-computed from the paper’s own numbers.
The self-check needs the paper’s full text.
Citations
Cites
XGBoost: A Scalable Tree Boosting System
Chen, T., & Guestrin, C. (2016) · Proceedings of the 22nd ACM SIGKDD International Conference on Knowledge Discovery and Data Mining · doi:10.1145/2939672.2939785 · Cited by 54,569
Modern Applied Statistics with S
Venables, W. N., & Ripley, B. D. (2002) · Statistics and Computing · doi:10.1007/978-0-387-21706-2 · Cited by 24,305
Very high resolution interpolated climate surfaces for global land areas
Hijmans, R. J., Cameron, S. E., Parra, J. L., Jones, P. G., & Jarvis, A. (2005) · International Journal of Climatology · doi:10.1002/joc.1276 · Cited by 19,825
Total Carbon, Organic Carbon, and Organic Matter
Nelson, D. W., & Sommers, L. E. (1982) · Agronomy Monographs · doi:10.2134/agronmonogr9.2.2ed.c29 · Cited by 9,978
Building Predictive Models in R Using the caret Package
Kuhn, M. (2008) · Journal of Statistical Software · doi:10.18637/jss.v028.i05 · Cited by 8,863
Weighted kappa: nominal scale agreement provision for scaled disagreement or partial credit
Cohen, J. (1968) · Psychological Bulletin · doi:10.1037/h0026256 · Cited by 8,736
Kuhn, M., & Johnson, K. (2013) · doi:10.1007/978-1-4614-6849-3 · Cited by 6,788
Communication in the presence of noise
Shannon, C. E. (1949) · Proceedings of the IRE · doi:10.1109/jrproc.1949.232969 · Cited by 6,539
Anonim, A. (2010) · Cited by 4,945
Communication In The Presence Of Noise
Shannon, C. E. (1998) · Proceedings of the IEEE · doi:10.1109/jproc.1998.659497 · Cited by 4,804
Research works printed but not linked: 5
- D Arrouays, 2014, Soil carbon. vol. 125 of Advances in Agronomy, 93
- SA Lei, 1998, Soil Properties of the Kelso Sand Dunes in the Mojave Desert, The Southwestern Naturalist, 43, 47
- Huffman GJ, Bolvin DT. GPCP version 2 combined precipitation data set documentation. vol. 1. Laboratory for Atmospheres, NASA Goddard Space Flight Center and Science Systems and Applications; 2009.
- Kempen B. Updating soil information with digital soil mapping [PhD thesis]. Wageningen University. Wageningen; 2011. Available from: http://edepot.wur.nl/187198.
- Eberhardt E. Deriving WRB soil types using National German Soil Survey Guidelines. In: NCSS National Conference. NCSS Standards. Asheville, NC: United States Department of Agriculture USDA-NRCS; 2011. p. 1–2.
Cited by
Items 601–700 of 1,006
Spatial modeling of litter and soil carbon stocks on forest land in the conterminous United States
Cao, B., Domke, G. M., Russell, M. B., & Walters, B. F. (2018) · The Science of The Total Environment · doi:10.1016/j.scitotenv.2018.10.359 · Cited by 68
Conservation agriculture improves adaptive capacity of cropping systems to climate stress in Malawi
Komarek, A. M., Thierfelder, C., & Steward, P. (2021) · Agricultural Systems · doi:10.1016/j.agsy.2021.103117 · Cited by 68
Species-Distribution Modeling: Advantages and Limitations of Its Application. 1. General Approaches
Lissovsky, A. A., Dudov, S. V., & Obolenskaya, E. V. (2021) · Biology Bulletin Reviews · doi:10.1134/s2079086421030075 · Cited by 64
ASCAT IB: A radar-based vegetation optical depth retrieved from the ASCAT scatterometer satellite
Liu, X., Wigneron, J., Fan, L., Frappart, F., Ciais, P., Baghdadi, N. N., Zribi, M., Jagdhuber, T., Li, X., Wang, M., et al. (2021) · Remote Sensing of Environment · doi:10.1016/j.rse.2021.112587 · Cited by 62
The cocoa yield gap in Ghana: A quantification and an analysis of factors that could narrow the gap
Asante, P. A., Rahn, E., Zuidema, P. A., Rozendaal, D. M. A., Baan, M. V. D., Läderach, P., Asare, R., Cryer, N. C., & Anten, N. P. R. (2022) · Agricultural Systems · doi:10.1016/j.agsy.2022.103473 · Cited by 79
Abuhay, W., Gashaw, T., & Tsegaye, L. (2023) · Journal of Agriculture and Food Research · doi:10.1016/j.jafr.2023.100535 · Cited by 65
Kumar, C., Walton, G., Santi, P. M., & Huillca, C. A. L. (2023) · Remote Sensing · doi:10.3390/rs15051376 · Cited by 69
New water accounting reveals why the Colorado River no longer reaches the sea
Richter, B. D., Lamsal, G., Marston, L. T., Dhakal, S., Sangha, L., Rushforth, R. R., Wei, D., Ruddell, B. L., Davis, K. F., Hernández-Cruz, A., et al. (2024) · Communications Earth & Environment · doi:10.1038/s43247-024-01291-0 · Cited by 62
“We used climate data (precipitation, minimum and maximum air temperature, reference ET) from gridMET 38 , soil texture data from ISRIC 46 database and crop parameters from AquaCrop-OS to run the model.”
Abel, C., Maestre, F. T., Berdugo, M., Tagesson, T., Abdi, A. M., Horion, S., & Fensholt, R. (2024) · Communications Earth & Environment · doi:10.1038/s43247-024-01546-w · Cited by 76
Pei, T., & Qiu, T. (2024) · Acta Geotechnica · doi:10.1007/s11440-024-02384-y · Cited by 63
“The soil information (i.e., sand/clay content, soil bulk density, and field capacity) was obtained from SoilGrids [34], which provides a global estimation of a wide range of soil, land cover, hydrology, geology, climate, and relief characteristics with a spatial resolution of 250 m.”
Applications and challenges of digital soil mapping in Africa
Nenkam, A. M., Wadoux, A. M. J. ‐., Minasny, B., Silatsa, F. B. T., Yemefack, M., Ugbaje, S. U., Akpa, S., Zijl, G. M. V., Bouasria, A., Bouslıhım, Y., et al. (2024) · Geoderma · doi:10.1016/j.geoderma.2024.117007 · Cited by 71
Spatio-temporal assessment of topsoil organic carbon stock change in Hungary
Szatmári, G., Pirkó, B., Koós, S., Laborczi, A., Bakacsi, Z., Szabó, J., & Pásztor, L. (2019) · Soil and Tillage Research · doi:10.1016/j.still.2019.104410 · Cited by 71
Climate change decreases the cooling effect from postfire albedo in boreal North America
Potter, S., Solvik, K. K., Erb, A. M., Goetz, S. J., Johnstone, J. F., Mack, M. C., Randerson, J. T., Román, M. O., Schaaf, C., Turetsky, M. R., et al. (2019) · Global Change Biology · doi:10.1111/gcb.14888 · Cited by 66
“Soil properties were acquired from SoilGrids at a 250 m resolution (Hengl et al., 2017), including percent clay (0–2 µm), silt (2–50 µm), sand (50–2,000 µm), course material (>2,000 µm), bulk density (g/cm3), soil organic carbon stock (tons/ha), soil organic carbon content (g/kg), soil water…”
BackgroundMapping at 30 m Resolution of Soil Attributes at Multiple Depths in Midwest Brazil
Poppiel, R. R., Lacerda, M. P. C., Safanelli, J. L., Rizzo, R., Júnior, M. P. D. O., Novais, J. J., & Demattê, J. A. M. (2019) · Remote Sensing · doi:10.3390/rs11242905 · Cited by 65
“The huge volume of quantitative (pedometric) data required in the production of soil attribute maps, for large areas, limits the feasibility of conventional (traditional) manual (expert-based) soil mapping [3,4].”
BackgroundMethodInfluentialDescombes, P., Walthert, L., Baltensweiler, A., Meuli, R. G., Karger, D. N., Ginzler, C., Zurell, D., & Zimmermann, N. E. (2020) · Ecography · doi:10.1111/ecog.05117 · Cited by 68
Yang, R., Liu, L., Zhang, X., He, R., Zhu, C., Zhang, Z., & Li, J. (2021) · Geoderma · doi:10.1016/j.geoderma.2021.115407 · Cited by 66
Zhong, Y., Xue, Z., Jiang, M., Liu, B., & Wang, G. (2020) · Ecological Indicators · doi:10.1016/j.ecolind.2020.107137 · Cited by 67
Trends in Satellite Earth Observation for Permafrost Related Analyses—A Review
Philipp, M., Dietz, A. J., Buchelt, S., & Kuenzer, C. (2021) · Remote Sensing · doi:10.3390/rs13061217 · Cited by 61
“The SoilGrids database on the other hand provides global information about soil pH value, organic carbon content, soil texture and other parameters on a 250 m spatial resolution [463].”
BackgroundMethodLin, M., Simons, A. L., Harrigan, R. J., Curd, E., Schneider, F., Ruiz‐Ramos, D. V., Gold, Z. J., Osborne, M. G., Shirazi, S., Schweizer, T. M., et al. (2021) · Ecological Applications · doi:10.1002/eap.2379 · Cited by 69
“…yield increasingly copious and accessible abiotic data (Pettorelli et al. 2014, Schimel et al. 2019) on land cover, topography, soil property (Hengl et al. 2017), bio-climate (Fick and Hijmans 2017), human impact (WCS and CIESIN 2005), and vegetation (e.g., Sentinel-2; European Space…”
Reith, J., Ghazaryan, G., Muthoni, F., & Dubovyk, O. (2021) · Remote Sensing · doi:10.3390/rs13091754 · Cited by 74
Shahri, A. A., Shan, C., Zäll, E., & Larsson, S. (2021) · Journal of Rock Mechanics and Geotechnical Engineering · doi:10.1016/j.jrmge.2021.07.006 · Cited by 63
Hounkpatin, O., Bossa, A. Y., Yira, Y., Igué, A. M., & SINSIN, B. A. (2021) · Geoderma Regional · doi:10.1016/j.geodrs.2021.e00444 · Cited by 69
Hao, D., Bisht, G., Huang, M., Ma, P., Tesfa, T. K., Lee, W., Gu, Y., & Leung, L.-Y. R. (2022) · Journal of Advances in Modeling Earth Systems · doi:10.1029/2021ms002862 · Cited by 63
“This data was generated using site-level soil profile data and remote sensing-based soil covariates and machine learning methods trained based on site-level soil profile data (Hengl et al., 2017).”
MethodRandom forest-based modeling of stream nutrients at national level in a data-scarce region
Virro, H., Kmoch, A., Vainu, M., & Uuemaa, E. (2022) · The Science of The Total Environment · doi:10.1016/j.scitotenv.2022.156613 · Cited by 66
International demand for food and services drives environmental footprints of pesticide use
Tang, F. H. M., Malik, A., Li, M., Lenzen, M., & Maggi, F. (2022) · Communications Earth & Environment · doi:10.1038/s43247-022-00601-8 · Cited by 69
Flooding and inundation maps using interpolated CYGNSS reflectivity observations
Chew, C. C., Small, E. E., & Huelsing, H. K. (2023) · Remote Sensing of Environment · doi:10.1016/j.rse.2023.113598 · Cited by 70
Treat, C. C., Virkkala, A., Burke, E., Bruhwiler, L., Chatterjee, A., Fisher, J. B., Hashemi, J., Parmentier, F. W., Rogers, B. M., Westermann, S., et al. (2024) · Journal of Geophysical Research Biogeosciences · doi:10.1029/2023jg007638 · Cited by 71
Roitman, I., Bustamante, M., Haidar, R. F., Shimbo, J. Z., Abdala, G. C., Eiten, G., Fagg, C. W., Felfili, M. C., Felfili, J. M., Jacobson, T. K. B., et al. (2018) · PLoS ONE · doi:10.1371/journal.pone.0196742 · Cited by 77
A comprehensive uncertainty quantification of large-scale process-based crop modeling frameworks
Dokoohaki, H., Kivi, M., Martinez‐Feria, R. A., Miguez, F. E., & Hoogenboom, G. (2021) · Environmental Research Letters · doi:10.1088/1748-9326/ac0f26 · Cited by 67
Fersch, B., Jagdhuber, T., Schrön, M., Völksch, I., & Jäger, M. (2018) · Water Resources Research · doi:10.1029/2018wr023337 · Cited by 60
“𝜃(N) = 𝜚bd (𝜃grv(N,N0) − 𝜃offset) (7) We use information about soil bulk density 𝜚bd and additional water equivalent 𝜃offset (lattice water and organic carbon) from the SoilGrids database (Hengl et al., 2017; see values in Table A1).”
MethodImproving daily stochastic streamflow prediction: comparison of novel hybrid data-mining algorithms
Khosravi, K., Golkarian, A., Booij, M. J., Barzegar, R., Sun, W., Yaseen, Z. M., & Mosavi, A. H. (2021) · Hydrological Sciences Journal · doi:10.1080/02626667.2021.1928673 · Cited by 62
The chosen few—variations in common and rare soil bacteria across biomes
Bickel, S., & Or, D. (2021) · The ISME Journal · doi:10.1038/s41396-021-00981-3 · Cited by 66
“using only the input data of CWC and soil porosity [51], we mapped global regions where rare bacteria, on average, likely dominated (Fig.”
MethodReappraisal of SMAP inversion algorithms for soil moisture and vegetation optical depth
Gao, L., Ebtehaj, A. M., Chaubell, J., Sadeghi, M., Li, X., & Wigneron, J. (2021) · Remote Sensing of Environment · doi:10.1016/j.rse.2021.112627 · Cited by 64
Evolution of Uncertainty in Terrestrial Carbon Storage in Earth System Models from CMIP5 to CMIP6
Wei, N., Xia, J., Zhou, J., Jiang, L., Cui, E., Ping, J., & Luo, Y. (2022) · Journal of Climate · doi:10.1175/jcli-d-21-0763.1 · Cited by 62
Impacts of the Desiccation of the Aral Sea on the Central Asian Dust Life‐Cycle
Banks, J., Heinold, B., & Schepanski, K. (2022) · Journal of Geophysical Research Atmospheres · doi:10.1029/2022jd036618 · Cited by 66
“, 2021), released in May 2020 as an update to the SoilGrids data set described by Hengl et al. (2017). SoilGrids is a project of the International Soil Reference Information Centre to automate the creation of a globally consistent soil database. This provides the clay, silt and sand percentages of the soil on a Homolo…”
BackgroundMethodInfluentialLi, J., Hu, W., Chau, H. W., Beare, M., Cichota, R., Teixeira, E. I., Moore, T., Di, H. J., Cameron, K. C., Guo, J., et al. (2023) · Global Change Biology · doi:10.1111/gcb.16618 · Cited by 61
Soil properties constrain predicted poleward migration of plants under climate change
Ni, M., & Vellend, M. (2023) · New Phytologist · doi:10.1111/nph.19164 · Cited by 71
“1; Hengl et al ., 2017), soil properties may play an important role in determining plant distributions at large spatial scales (regions to continents), constraining plant latitudinal ranges.”
InfluentialHounkpatin, O., Schmidt, K., Stumpf, F., Forkuor, G., Behrens, T., Scholten, T., Amelung, W., & Welp, G. (2018) · Scientific Reports · doi:10.1038/s41598-018-28244-w · Cited by 67
Galleguillos, M., Gimeno, F., Puelma, C., Zambrano‐Bigiarini, M., Lara, A., & Rojas, M. (2021) · Journal of Hydrology · doi:10.1016/j.jhydrol.2021.126047 · Cited by 63
Brombacher, J., Silva, I. R. D. O., Degen, J., & Pelgrum, H. (2022) · Agricultural Water Management · doi:10.1016/j.agwat.2022.107602 · Cited by 65
Global dataset of soil organic carbon in tidal marshes
Maxwell, T. L., Rovai, A., Adame, M. F., Adams, J. B., Álvarez-Rogel, J., Austin, W. E. N., Beasy, K. M., Boscutti, F., Böttcher, M. E., Bouma, T. J., et al. (2023) · Scientific Data · doi:10.1038/s41597-023-02633-x · Cited by 76
Closing yield gap is crucial to avoid potential surge in global carbon emissions
Suh, S., Johnson, J. A., Tambjerg, L., Sim, S., Broeckx-Smith, S., Reyes, W., & Chaplin‐Kramer, R. (2020) · Global Environmental Change · doi:10.1016/j.gloenvcha.2020.102100 · Cited by 61
Rewilding in the face of climate change
Carroll, C., & Noss, R. F. (2020) · Conservation Biology · doi:10.1111/cobi.13531 · Cited by 64
“2b & Table 2) (Hengl et al. 2017; Stralberg et al. 2020a).”
Roostaei, J., Colley, S., Mulhern, R., May, A. A., & Gibson, J. M. (2021) · Journal of Hazardous Materials · doi:10.1016/j.jhazmat.2021.125075 · Cited by 57
Cotrina-Sánchez, A., Briceño, N. B. R., Bandopadhyay, S., Ghosh, S., Guzmán, C. T., Oliva, M., Guzman, B. K., & López, R. S. (2021) · Diversity · doi:10.3390/d13060261 · Cited by 64
“org; accessed on 15 January 2021) [42].”
A USLE-based model with modified LS-factor combined with sediment delivery module for Alpine basins
Kaffas, K., Pisinaras, V., Sayah, M. J. A., Santopietro, S., & Righetti, M. (2021) · CATENA · doi:10.1016/j.catena.2021.105655 · Cited by 59
Heat stress may cause a significant reduction of rice yield in China under future climate scenarios
Sun, Q., Zhao, Y., Zhang, Y., Chen, S., Ying, Q., Lv, Z., Che, X., & Wang, D. (2021) · The Science of The Total Environment · doi:10.1016/j.scitotenv.2021.151746 · Cited by 61
Li, Y., Liu, W., Feng, Q., Zhu, M., Yang, L., & Zhang, J. (2022) · Remote Sensing · doi:10.3390/rs14010239 · Cited by 61
“org/, accessed on 23 June 2021), having been released by the ISRIC (International Soil Reference Information Centre)—World Soil Information [68].”
Zhou, Y., Biro, A., Wong, M. Y., Batterman, S. A., & Staver, A. C. (2022) · Ecology · doi:10.1002/ecy.3807 · Cited by 62
Naz, B. S., Sharples, W., Ma, Y., Goergen, K., & Kollet, S. J. (2023) · Geoscientific model development · doi:10.5194/gmd-16-1617-2023 · Cited by 70
Understanding trait diversity: the role of geodiversity
Vernham, G., Bailey, J. J., Chase, J. M., Hjort, J., Field, R., & Schrodt, F. (2023) · Trends in Ecology & Evolution · doi:10.1016/j.tree.2023.02.010 · Cited by 66
Mayer, M., Baltensweiler, A., James, J. N., Rigling, A., & Hagedorn, F. (2023) · Global Ecology and Biogeography · doi:10.1111/geb.13779 · Cited by 61
“We applied the SOC response functions to a global map of SOC stocks (Hengl et al., 2017), which we masked with a global forest map (Sayre et al., 2020 ).”
MethodQuantitative assessment on the distribution patterns of microplastics in global inland waters
Jin, X., Li, Z., Peñuelas, J., Sardans, J., Wu, Q., Peng, Y., Hědenec, P., Li, Z., Yuan, C., Yuan, J., et al. (2025) · Communications Earth & Environment · doi:10.1038/s43247-025-02320-2 · Cited by 70
Protect young secondary forests for optimum carbon removal
Robinson, N., Drever, C. R., Gibbs, D. A., Lister, K., Esquivel‐Muelbert, A., Heinrich, V., Ciais, P., Silva, C. H. L., Liu, Z., Pugh, T. A. M., et al. (2025) · Nature Climate Change · doi:10.1038/s41558-025-02355-5 · Cited by 75
Chen, S., Xu, D., Li, S., Ji, W., Yang, M., Zhou, Y., Hu, B., Xu, H., & Shi, Z. (2019) · Land Degradation and Development · doi:10.1002/ldr.3497 · Cited by 61
“However, among several existing SOC products (FAO/IIASA/ISRIC/ISSCAS/JRC, 2012; Hengl et al., 2017; Liang et al., 2019; Zhou, Webster, Viscarra Rossel, Shi, & Chen, 2019), the uncertainty of the spatial distribution of SOC in the Qinghai-Tibetan Plateau is quite large, making it difficult to…”
BackgroundWietrzyk-Pełka, P., Rola, K., Szymański, W., & Węgrzyn, M. H. (2019) · The Science of The Total Environment · doi:10.1016/j.scitotenv.2019.135151 · Cited by 59
Digital mapping of the soil thickness of loess deposits over a calcareous bedrock in central France
Chen, S., Richer-De-Forges, A. C., Mulder, V. L., Martelet, G., Loiseau, T., Lehmann, S., & Arrouays, D. (2020) · CATENA · doi:10.1016/j.catena.2020.105062 · Cited by 64
Wang, H., Yue, C., Mao, Q., Zhao, J., Ciais, P., Li, W., Yu, Q., & Mu, X. (2020) · Geoderma · doi:10.1016/j.geoderma.2020.114389 · Cited by 67
Ibrahim, W. N. W., Lee, K. L., Razzak, L. A. A., Nadirah, M., Danish‐Daniel, M., Zainathan, S. C., & Musa, N. (2021) · Journal of Invertebrate Pathology · doi:10.1016/j.jip.2021.107594 · Cited by 58
Martinsen, G., Bessiere, H., Caballero, Y., Koch, J., Collados‐Lara, A., Mansour, M., Sallasmaa, O., Pulido‐Velazquez, D., Williams, N. H., Zaadnoordijk, W. J., et al. (2022) · The Science of The Total Environment · doi:10.1016/j.scitotenv.2022.153464 · Cited by 66
Age and spatial distribution of the world's oldest trees
Liu, J., Xia, S., Zeng, D., Liu, C., Li, Y., Yang, W., Yang, B. S., Zhang, J., Slik, F. J. W., & Lindenmayer, D. B. (2022) · Conservation Biology · doi:10.1111/cobi.13907 · Cited by 63
Kou‐Giesbrecht, S., & Arora, V. K. (2022) · Global Biogeochemical Cycles · doi:10.1029/2022gb007341 · Cited by 61
“The depth of permeable soil layers and thus the depth to bedrock soil layers vary geographically and is specified based on the SoilGrids250 m data set (Hengl et al., 2017).”
BackgroundDigital mapping of soil organic carbon density in China using an ensemble model
Sun, Y., Ma, J., Zhao, W., Qu, Y., Gou, Z., Chen, H., Tian, Y., & Wu, F. (2023) · Environmental Research · doi:10.1016/j.envres.2023.116131 · Cited by 66
Lean, H. W., Theeuwes, N., Baldauf, M., Barkmeijer, J., Bessardon, G., Blunn, L., Bojarova, J., Boutle, I., Clark, P. A., Demuzere, M., et al. (2024) · Quarterly Journal of the Royal Meteorological Society · doi:10.1002/qj.4858 · Cited by 65
“Sub-hectometric orography datasets exist and can be global, such as the TanDEM-X ∼ 12-m resolution DEM dataset (Wessel, 2016; Zink et al. , 2014), For soil texture, hectometric Met Office UM configurations use the 1-km resolution Harmonised World Soil Database (Nachtergaele et al. , 2010), while HARMONIE-AROME cycle 4…”
Digital Soil Mapping Using Machine Learning Algorithms in a Tropical Mountainous Area
Meier, M., de Souza, E., Francelino, M. R., Filho, E. I. F., & Schaefer, C. E. G. R. (2018) · Revista Brasileira de Ciência do Solo · doi:10.1590/18069657rbcs20170421 · Cited by 68
“On soil science, the model has been applied to mapping soil nutrients (Hengl et al., 2017a) and soil properties in the United States (Ramcharan et al., 2018).”
BackgroundMethodChapman, S., Birch, C. E., Galdos, M. V., Pope, E., Davie, J. C. S., Bradshaw, C. P., Eze, S., & Marsham, J. H. (2021) · Environmental Research Letters · doi:10.1088/1748-9326/ac10e1 · Cited by 58
Chesterman, N. S., Entwistle, J., Chambers, M. C., Liu, H.-C., Agrawal, A., & Brown, D. G. (2019) · Land Use Policy · doi:10.1016/j.landusepol.2019.104051 · Cited by 65
Global Surface Soil Moisture Drydown Patterns
Mohanty, B. P., Sehgal, V., & Gaur, N. (2021) · Water Resources Research · doi:10.1029/2020wr027588 · Cited by 65
The new assessment of soil erodibility in Greece
Efthimiou, N. (2020) · Soil and Tillage Research · doi:10.1016/j.still.2020.104720 · Cited by 57
Consistent trait–environment relationships within and across tundra plant communities
Kemppinen, J., Niittynen, P., le Roux, P. C., Momberg, M., Happonen, K., Aalto, J., Rautakoski, H., Enquist, B. J., Vandvik, V., Halbritter, A. H., et al. (2021) · Nature Ecology & Evolution · doi:10.1038/s41559-021-01396-1 · Cited by 70
Grillakis, M. G., Koutroulis, A., Alexakis, D. D., Polykretis, C., & Daliakopoulos, I. Ν. (2021) · Water Resources Research · doi:10.1029/2020wr029249 · Cited by 60
“Additionally, Hengl et al. (2017) discuss that specific variables such as the coarse fragments and depth to bedrock are represented with high levels of error in the SoilGrids 250 m data set.”
BackgroundDivergent controls of soil organic carbon between observations and process-based models
Georgiou, K., Malhotra, A., Wieder, W. R., Ennis, J. H., Hartman, M. D., Sulman, B. N., Berhe, A. A., Grandy, A. S., Kyker‐Snowman, E., Lajtha, K., et al. (2021) · Biogeochemistry · doi:10.1007/s10533-021-00819-2 · Cited by 65
“As a result, the predictability of such SOC measurements is often lower (Doetterl et al. 2015; Hengl et al. 2014, 2017)—here, only 26 % of the variance in soil profiles is explained by MAT, NPP, and TEX using a random forest model, indicating that important controls at this plot-scale are…”
BackgroundThe pesticide health risk index - An application to the world's countries
Maggi, F., Tang, F. H. M., Black, A. J., Marks, G. B., & McBratney, A. B. (2021) · The Science of The Total Environment · doi:10.1016/j.scitotenv.2021.149731 · Cited by 68
Elnashar, A., Zeng, H., Wu, B., Gebremicael, T. G., & Marie, K. (2022) · The Science of The Total Environment · doi:10.1016/j.scitotenv.2022.152925 · Cited by 62
Choi, J., Lee, J., & Kim, S. (2022) · Ecological Engineering · doi:10.1016/j.ecoleng.2022.106699 · Cited by 62
How well does digital soil mapping represent soil geography? An investigation from the USA
Rossiter, D. G., Poggio, L., Beaudette, D. E., & Libohova, Z. (2022) · SOIL · doi:10.5194/soil-8-559-2022 · Cited by 64
Remote sensing‐based retrieval of soil moisture content using stacking ensemble learning models
Wang, S., Wu, Y., Li, R., & Wang, X. (2022) · Land Degradation and Development · doi:10.1002/ldr.4505 · Cited by 62
“…studies have shown that integrated learning models can be used to accurately predict several soil parameters, including soil organic carbon (Sothe et al., 2022), total nitrogen (Li et al., 2019), salinity (Vermeulen & Niekerk, 2017), pH (Tomislav et al., 2017), and texture (Swain et al., 2021).”
BackgroundSiles, J. A., Vera, A., Díaz‐López, M., García, C. P., van den Hoogen, J., Crowther, T. W., Eisenhauer, N., Guerra, C. A., Jones, A., Orgiazzi, A., et al. (2023) · Geoderma · doi:10.1016/j.geoderma.2023.116474 · Cited by 67
Bouslıhım, Y., John, K., Miftah, A., Azmi, R., Aboutayeb, R., Bouasria, A., Razouk, R., & Hssaini, L. (2024) · Annals of GIS · doi:10.1080/19475683.2024.2309868 · Cited by 62
“…by the availability of free and regular data-sets, including satellite images at various resolutions, climate data, and topography (Bouasria et al. 2022; Bouslihim et al. 2021; Hengl et al. 2017, 2021; John, Bouslihim, Bouasria, et al. 2022; John, Bouslihim, Ofem, et al. 2022; Shi et al. 2018).”
BackgroundRamos, T. B., Horta, A., Gonçalves, M. C., Pires, F. P., Duffy, D., & Martins, J. C. (2017) · CATENA · doi:10.1016/j.catena.2017.07.020 · Cited by 65
“Finally, to complete this evaluation, we have also compared our INFOSOLO maps with SoilGrids, which maps soil properties at a global scale using available datasets from different countries.”
BackgroundMethodInfluentialManchego, C. E., Hildebrandt, P., Cueva-Ortiz, J., Espinosa, C. I., Stimm, B., & Günter, S. (2017) · PLoS ONE · doi:10.1371/journal.pone.0190092 · Cited by 66
How much land is available for sustainable palm oil?
Tapia, J. F. D., Doliente, S. S., & Samsatli, S. (2021) · Land Use Policy · doi:10.1016/j.landusepol.2020.105187 · Cited by 66
Deep Learning-Based Soil Moisture Retrieval in CONUS Using CYGNSS Delay–Doppler Maps
Nabi, M. M., Senyurek, V. Y., Gürbüz, A. C., & Kurum, M. (2022) · IEEE Journal of Selected Topics in Applied Earth Observations and Remote Sensing · doi:10.1109/jstars.2022.3196658 · Cited by 59
“Soil clay and silt ratios can be obtained from the Global Gridded Soil Information (SoilGrids) [41].”
MethodYang, S., Zhao, B., Yang, D., Wang, T., Yang, Y., Ma, T., & Santisirisomboon, J. (2023) · Journal of Hydrology · doi:10.1016/j.jhydrol.2023.129454 · Cited by 67
Dasgupta, S., Debnath, S., Das, A., Biswas, A., Weindorf, D. C., Ли, Б., Shukla, A. K., Das, S., Saha, S., & Chakraborty, S. (2023) · Geoderma · doi:10.1016/j.geoderma.2023.116457 · Cited by 60
Wilkes, M., Carrivick, J. L., Castella, E., Ilg, C., Cauvy‐Fraunié, S., Fell, S. C., Füreder, L., Huss, M., James, W., Lencioni, V., et al. (2023) · Nature Ecology & Evolution · doi:10.1038/s41559-023-02061-5 · Cited by 65
Kou‐Giesbrecht, S., Arora, V. K., Seiler, C., Arneth, A., Falk, S., Jain, A. K., Joos, F., Kennedy, D., Knauer, J., Sitch, S. A., et al. (2023) · Earth System Dynamics · doi:10.5194/esd-14-767-2023 · Cited by 60
Yang, Y., Feng, D., Beck, H. E., Hu, W., Abbas, A., Sengupta, A., Monache, L. D., Hartman, R. K., Lin, P., Shen, C., et al. (2025) · Water Resources Research · doi:10.1029/2024wr039764 · Cited by 72
“Soil sand content data is from SoilGrids (Hengl et al., 2017).”
Beyond counts and averages: Relating geodiversity to dimensions of biodiversity
Read, Q. D., Zarnetske, P. L., Record, S., Dahlin, K. M., Costanza, J., Finley, A. O., Gaddis, K. D., Grady, J. M., Hobi, M. L., Latimer, A. M., et al. (2020) · Global Ecology and Biogeography · doi:10.1111/geb.13061 · Cited by 60
“We generated additional predictors from non-remotely sensed products, including soil type category from SoilGrids (Hengl et al., 2017), which uses remotely sensed data to interpolate ground-based measurements, and geological age category from USGS International Surface Geology.”
MethodLavergne, A., Sandoval, D., Hare, V., Graven, H., & Prentice, I. C. (2020) · Global Change Biology · doi:10.1111/gcb.15364 · Cited by 61
How soil erosion model conceptualization affects soil loss projections under climate change
Eekhout, J. P., & De Vente, J. (2020) · Progress in Physical Geography: Earth and Environment · doi:10.1177/0309133319871937 · Cited by 56
“The silt, clay and organic matter content were obtained from the SoilGrids database (Hengl et al., 2017).”
MethodLópez, R. S., Gómez-Fernández, D., Silva-López, J. O., Briceño, N. B. R., Oliva, M., Murga, R. E. T., Trigoso, D. I., Barboza, E., & Gurbillón, M. Á. B. (2020) · ISPRS International Journal of Geo-Information · doi:10.3390/ijgi9110673 · Cited by 66
“The data for the edaphological sub-criteria were obtained from system for global digital soil mapping SoilGrids, with a spatial resolution of 250 m [75].”
MethodTrait‐based projections of climate change effects on global biome distributions
Boonman, C. C. F., Huijbregts, M. A. J., Benítez‐López, A., Schipper, A. M., Thuiller, W., & Santini, L. (2021) · Diversity and Distributions · doi:10.1111/ddi.13431 · Cited by 59
Admas, B. F., Gashaw, T., Adem, A. A., Worqlul, A. W., Dile, Y. T., & Molla, E. (2022) · Resources Environment and Sustainability · doi:10.1016/j.resenv.2022.100059 · Cited by 56
Cropland carbon stocks driven by soil characteristics, rainfall and elevation
Chen, F., Feng, P., Harrison, M. T., Wang, B., Liu, K., Zhang, C., & Hu, K. (2022) · The Science of The Total Environment · doi:10.1016/j.scitotenv.2022.160602 · Cited by 60
Hoch, J., Sutanudjaja, E. H., Wanders, N., van Beek, R., & Bierkens, M. F. P. (2023) · Hydrology and earth system sciences · doi:10.5194/hess-27-1383-2023 · Cited by 65
“The PCR-GLOBWB model cannot directly use the soil information of SoilGrids250, which not only has a finer spatial resolution than 1 km PCR-GLOBWB but also specifies only some general attributes such as soil texture.”
MethodInfluentialFunctional diversity enhances dryland forest productivity under long-term climate change
Hisano, M., Ghazoul, J., Chen, X., & Chen, H. Y. H. (2024) · Science Advances · doi:10.1126/sciadv.adn4152 · Cited by 69
Widespread slow growth of acquisitive tree species
Augusto, L., Borelle, R., Boča, A., Bon, L., Orazio, C., Arias‐González, A., Bakker, M. R., Gartzia‐Bengoetxea, N., Auge, H., Bernier, F., et al. (2025) · Nature · doi:10.1038/s41586-025-08692-x · Cited by 75
“The data sources used were taken from the literature (N deposition 81 ; soil properties 82,83 ) or from large-scale databases.”
Fried, G., Villers, A., & Porcher, E. (2018) · Agriculture Ecosystems & Environment · doi:10.1016/j.agee.2018.03.021 · Cited by 67
“(1) From the coordinates of the field margin, we retrieved eight factors from the Soilgrids dataset at 250m resolution (Hengl et al., 2017).”
MethodGichenje, H., & Godinho, S. (2018) · Land Degradation and Development · doi:10.1002/ldr.3067 · Cited by 59
“The total SOC stock in tonnes per hectare at the standard fixed depth interval of 0–30 cm was computed using the GSIF package in R (Hengl, 2017) as a per the following equation (Hengl, Kempen, & Sanderman, 2018): SOC stock ton=ha½ ¼ SOC=1000 × BLD × 1−CRF=100ð Þ × HOT=100 × 10; where SOC = soil…”
Method
Metadata
- Authors
- Hengl, T., Mendes de Jesus, J., Heuvelink, G. B. M., Ruiperez Gonzalez, M., Kilibarda, M., Blagotić, A., Shangguan, W., Wright, M. N., Geng, X., Bauer-Marschallinger, B., Guevara, M. A., Vargas, R., MacMillan, R. A., Batjes, N. H., Leenaars, J. G. B., Ribeiro, E., Wheeler, I., Mantel, S., & Kempen, B.
- Affiliations
- ISRIC - World Soil Information (NL)
- University of Belgrade (RS)
- Sun Yat-sen University (CN)
- University of Lübeck (DE)
- Agriculture and Agri-Food Canada (CA)
- TU Wien (AT)
- University of Delaware (US)
- ORCID
- Venue
- PLOS ONE
- Publisher
- Public Library of Science (PLoS)
- Published
- 2017-02-16
- Volume
- 12
- Issue
- 2
- Pages
- e0169748
- ISSN
- 1932-6203 (ISSN-L)
- PMC
- PMC5313206
- OpenAlex
- W2588003345
- Cited by
- 4,733
- References
- 89
- Citations by year
- 2026: 591 · 2025: 654 · 2024: 610 · 2023: 634 · 2022: 669 · 2021: 672 · 2020: 402 · 2019: 265 · 2018: 173 · 2017: 56
- FWCI
- 137.14
- Type
- journal article
- Language
- en
- Open access
- gold
- doi.org
- Licence
- Locations
- PLoS ONE (publishedVersion, cc-by)
- PubMed Central (publishedVersion, cc-by)
- PubMed (publishedVersion)
- RePEc: Research Papers in Economics (submittedVersion)
- DOAJ (DOAJ: Directory of Open Access Journals) (submittedVersion)
- GraFar (University of Belgrade, Faculty of Civil Engineering) (submittedVersion, cc-by)
- Socio-Environmental Systems Modeling (submittedVersion, cc-by)
- Data Archiving and Networked Services (DANS) (submittedVersion, other-oa)
- Topics
- Life Sciences › Agricultural and Biological Sciences › Soil Science › Soil Geostatistics and Mapping
- Physical Sciences › Environmental Science › Environmental Engineering › Soil Moisture and Remote Sensing
- Physical Sciences › Environmental Science › Management, Monitoring, Policy and Law › Soil and Land Suitability Analysis
- Keywords
- SoilGrids, soil properties, soil organic carbon, soil bulk density, cation exchange capacity, soil pH, soil texture, coarse fragments, bedrock depth, soil classification, USDA soil classification, MODIS, random forest, gradient boosting, multinomial logistic regression, ensemble learning, accuracy assessment, soil mapping
- MeSH terms
- Machine Learning, Algorithms, Conservation of Natural Resources, Environmental Monitoring, Humans, Models, Theoretical, Soil, Geographic Information Systems
About these checks
Registry, retraction, Cites and statistics results are computed, not judged, with one exception: a printed reference that no index lists is read once by a model before it counts as a citation error. Claims are extracted by a model and kept only when their quote appears verbatim in the text; each cited source is then checked, with a model’s help, for whether it says what the claim relies on. Those verdicts can be wrong — read the claim’s quote and the cited source before relying on one.
Statistics and arithmetic are recomputed, not judged.
Confidence bands are shown only for fields calibrated on our annotated test set. None is calibrated yet, so no band is shown.
What counts as a claim ›How we measure confidence ›How we check this ›
Are you an author, or do you see a problem with this page? Request a review
Data sources
Bibliographic data: Semantic Scholar, OpenAlex, Crossref.
Contains information from the Semantic Scholar Academic Graph Datasets, made available under the ODC Attribution License (ODC-BY 1.0).
Semantic Scholar’s data is described in: Kinney, R., et al. (2023). The Semantic Scholar Open Data Platform. arXiv:2301.10140.
