

SoilGrids250m: Global gridded soil information based on machine learning
Open accessThe DOI matches its Crossref record; 85 of the 89 references it cites were found in a registry or an index.
Abstract
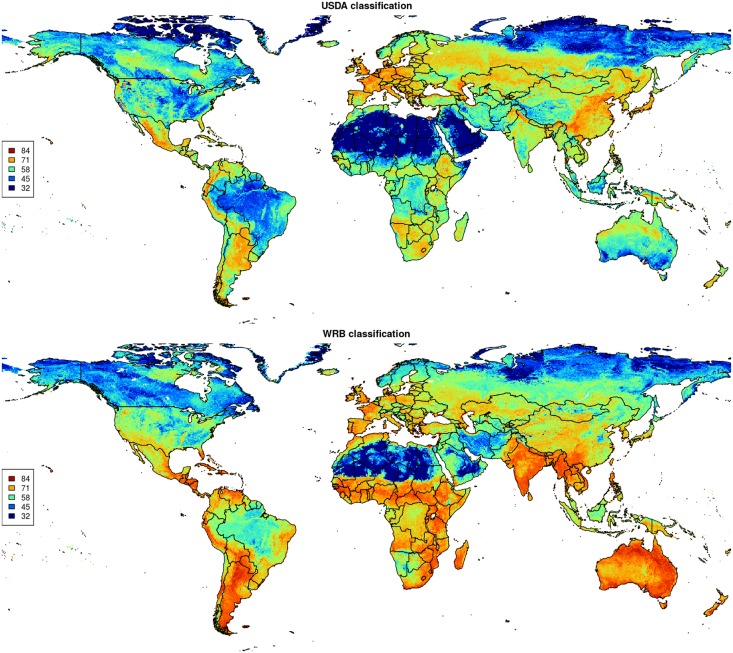
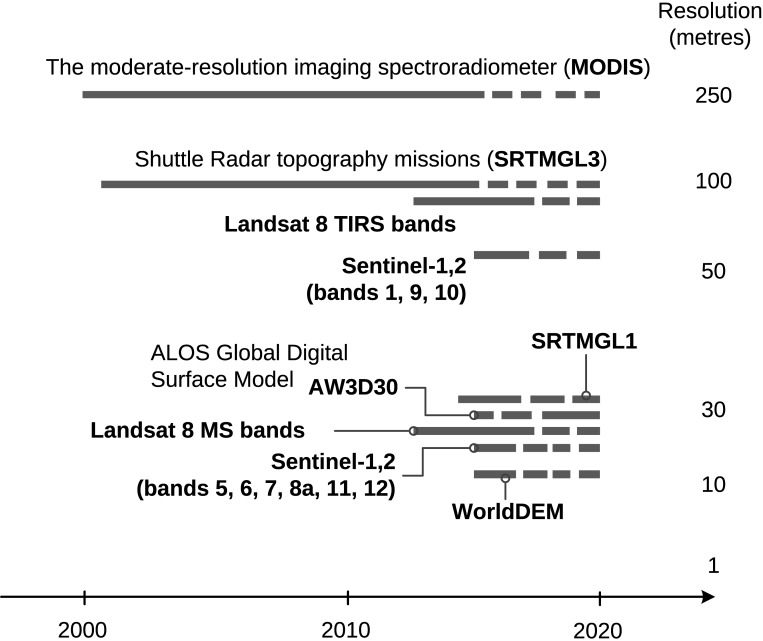
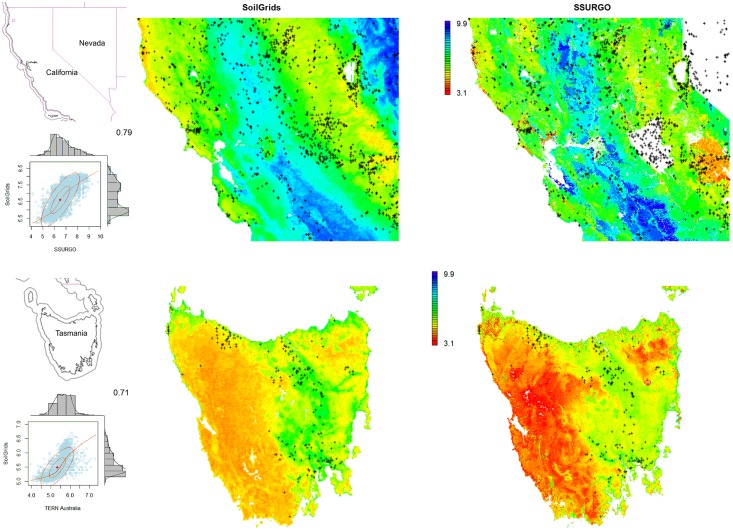
This paper describes the technical development and accuracy assessment of the most recent and improved version of the SoilGrids system at 250m resolution (June 2016 update). SoilGrids provides global predictions for standard numeric soil properties (organic carbon, bulk density, Cation Exchange Capacity (CEC), pH, soil texture fractions and coarse fragments) at seven standard depths (0, 5, 15, 30, 60, 100 and 200 cm), in addition to predictions of depth to bedrock and distribution of soil classes based on the World Reference Base (WRB) and USDA classification systems (ca. 280 raster layers in total). Predictions were based on ca. 150,000 soil profiles used for training and a stack of 158 remote sensing-based soil covariates (primarily derived from MODIS land products, SRTM DEM derivatives, climatic images and global landform and lithology maps), which were used to fit an ensemble of machine learning methods-random forest and gradient boosting and/or multinomial logistic regression-as implemented in the R packages ranger, xgboost, nnet and caret. The results of 10-fold cross-validation show that the ensemble models explain between 56% (coarse fragments) and 83% (pH) of variation with an overall average of 61%. Improvements in the relative accuracy considering the amount of variation explained, in comparison to the previous version of SoilGrids at 1 km spatial resolution, range from 60 to 230%. Improvements can be attributed to: (1) the use of machine learning instead of linear regression, (2) to considerable investments in preparing finer resolution covariate layers and (3) to insertion of additional soil profiles. Further development of SoilGrids could include refinement of methods to incorporate input uncertainties and derivation of posterior probability distributions (per pixel), and further automation of spatial modeling so that soil maps can be generated for potentially hundreds of soil variables. Another area of future research is the development of methods for multiscale merging of SoilGrids predictions with local and/or national gridded soil products (e.g. up to 50 m spatial resolution) so that increasingly more accurate, complete and consistent global soil information can be produced. SoilGrids are available under the Open Data Base License.
Overview
The claims and statistics of this paper haven’t been checked yet.
Free: it reads the open-access text and checks the first 5 claims that cite a source we can check. Create a free account to check every claim.
Integrity signals
Registry
Cites
Statistics
Figures






Verification
Claims the paper makes
The claims and statistics of this paper haven’t been checked yet.
Free: it reads the open-access text and checks the first 5 claims that cite a source we can check. Create a free account to check every claim.
Claims other papers make about this one
Each is checked against this paper’s own text: does it say what the citing paper says it does?
The source backs part of the claim, not all of it — or backs it for a different population, condition or comparison.
In the citing paper
“These uncertainties are mostly due to the uneven distribution and overall scarcity of field data for modelling and validating carbon stocks in the biomass and soil 27,64,65 .”
From Global priority areas for ecosystem restoration (2020) · cites this paper as [65]
Experimental — accuracy not yet measured
Self-check
Percentages, sums and reported differences re-computed from the paper’s own numbers.
The self-check needs the paper’s full text.
Citations
Cites
XGBoost: A Scalable Tree Boosting System
Chen, T., & Guestrin, C. (2016) · Proceedings of the 22nd ACM SIGKDD International Conference on Knowledge Discovery and Data Mining · doi:10.1145/2939672.2939785 · Cited by 54,569
Modern Applied Statistics with S
Venables, W. N., & Ripley, B. D. (2002) · Statistics and Computing · doi:10.1007/978-0-387-21706-2 · Cited by 24,305
Very high resolution interpolated climate surfaces for global land areas
Hijmans, R. J., Cameron, S. E., Parra, J. L., Jones, P. G., & Jarvis, A. (2005) · International Journal of Climatology · doi:10.1002/joc.1276 · Cited by 19,825
Total Carbon, Organic Carbon, and Organic Matter
Nelson, D. W., & Sommers, L. E. (1982) · Agronomy Monographs · doi:10.2134/agronmonogr9.2.2ed.c29 · Cited by 9,978
Building Predictive Models in R Using the caret Package
Kuhn, M. (2008) · Journal of Statistical Software · doi:10.18637/jss.v028.i05 · Cited by 8,863
Weighted kappa: nominal scale agreement provision for scaled disagreement or partial credit
Cohen, J. (1968) · Psychological Bulletin · doi:10.1037/h0026256 · Cited by 8,736
Kuhn, M., & Johnson, K. (2013) · doi:10.1007/978-1-4614-6849-3 · Cited by 6,788
Communication in the presence of noise
Shannon, C. E. (1949) · Proceedings of the IRE · doi:10.1109/jrproc.1949.232969 · Cited by 6,539
Anonim, A. (2010) · Cited by 4,945
Communication In The Presence Of Noise
Shannon, C. E. (1998) · Proceedings of the IEEE · doi:10.1109/jproc.1998.659497 · Cited by 4,804
Research works printed but not linked: 5
- D Arrouays, 2014, Soil carbon. vol. 125 of Advances in Agronomy, 93
- SA Lei, 1998, Soil Properties of the Kelso Sand Dunes in the Mojave Desert, The Southwestern Naturalist, 43, 47
- Huffman GJ, Bolvin DT. GPCP version 2 combined precipitation data set documentation. vol. 1. Laboratory for Atmospheres, NASA Goddard Space Flight Center and Science Systems and Applications; 2009.
- Kempen B. Updating soil information with digital soil mapping [PhD thesis]. Wageningen University. Wageningen; 2011. Available from: http://edepot.wur.nl/187198.
- Eberhardt E. Deriving WRB soil types using National German Soil Survey Guidelines. In: NCSS National Conference. NCSS Standards. Asheville, NC: United States Department of Agriculture USDA-NRCS; 2011. p. 1–2.
Cited by
Items 701–800 of 1,006
Zhang, Y., Schaap, M. G., & Wei, Z. (2020) · Geophysical Research Letters · doi:10.1029/2020gl088819 · Cited by 61
“OpenLandMap is an updated version of the SoilGrids effort (Hengl et al., 2014, 2017) and provides highly accurate, high‐resolution global maps of soil texture, bulk density, and so forth, derived by automated soil mapping and deduced from remote sensing products linking soil propertieswith various…”
ResultInfluentialSoil Color and Mineralogy Mapping Using Proximal and Remote Sensing in Midwest Brazil
Poppiel, R. R., Lacerda, M. P. C., Rizzo, R., Safanelli, J. L., Bonfatti, B. R., Silvero, N. E. Q., & Demattê, J. A. M. (2020) · Remote Sensing · doi:10.3390/rs12071197 · Cited by 62
Csilléry, K., Buchmann, N., & Fady, B. (2020) · Evolutionary Applications · doi:10.1111/eva.13029 · Cited by 59
“Available water capacity (AWC) of the soil (volumetric fraction) until wilting point was obtained at a 250 m resolution from the SoilGrids250 data base for depth 5, 15, 30 and 60 cm (Hengl et al., 2017).”
MethodBacterial pretreatment of microalgae and the potential of novel nature hydrolytic sources
Barati, B., Zafar, F. F., Rupani, P. F., & Wang, S. (2021) · Environmental Technology & Innovation · doi:10.1016/j.eti.2021.101362 · Cited by 61
How much carbon can be added to soil by sorption?
Abramoff, R. Z., Georgiou, K., Guenet, B., Torn, M. S., Huang, Y., Zhang, H., Feng, W., Jagadamma, S., Kaiser, K., Kothawala, D., et al. (2021) · Biogeochemistry · doi:10.1007/s10533-021-00759-x · Cited by 52
A European map of groundwater pH and calcium
Hájek, M., Jiménez-Alfaro, B., Hájek, O., Brancaleoni, L., Cantonati, M., Carbognani, M., Dedić, A., Dítě, D., Gerdol, R., Hájková, P., et al. (2021) · Earth System Science Data · doi:10.5194/essd-13-1089-2021 · Cited by 55
Zepp, S., Heiden, U., Bachmann, M., Wiesmeier, M., Steininger, M., & van Wesemael, B. (2021) · Remote Sensing · doi:10.3390/rs13163141 · Cited by 61
“In comparison to existing SOC maps (e.g., OCTOP [15], Topsoil Soil Organic Carbon Map based on the LUCAS Soil datasets for EU25 [16] or SoilGrids [96]), SCMaP provides a novel database for the estimation of soil parameters.”
MethodInfluentialWu, T., Wang, D., Mu, C., Zhang, W., Zhu, X., Zhao, L., Li, R., Hu, G., Zou, D., Chen, J., et al. (2022) · The Science of The Total Environment · doi:10.1016/j.scitotenv.2022.154464 · Cited by 59
Salazar, D. F. U., Vaudour, E., Richer-De-Forges, A. C., Chen, S., Martelet, G., Baghdadi, N. N., & Arrouays, D. (2023) · Remote Sensing · doi:10.3390/rs15092410 · Cited by 65
Mahboobi, H., Shakiba, A., & Mirbagheri, B. (2023) · Journal of Environmental Management · doi:10.1016/j.jenvman.2023.118782 · Cited by 61
Xu, Z., Sun, H., Zhang, T., Xu, H., Wu, D., & Gao, J. (2024) · Remote Sensing of Environment · doi:10.1016/j.rse.2024.114324 · Cited by 61
The Daily Erosion Project – daily estimates of water runoff, soil detachment, and erosion
Gelder, B., Sklenar, T., James, D. E., Herzmann, D. E., Cruse, R. M., Gesch, K. R., & Laflen, J. (2017) · Earth Surface Processes and Landforms · doi:10.1002/esp.4286 · Cited by 60
“Soil property databases are less limiting, with the 250m SoilGrids.org (Hengl et al., 2017; Shangguan et al., 2017) as the best known global dataset.”
BackgroundAssessing the environmental impacts of soil compaction in Life Cycle Assessment
Stoessel, F., Sonderegger, T., Bayer, P., & Hellweg, S. (2018) · The Science of The Total Environment · doi:10.1016/j.scitotenv.2018.02.222 · Cited by 61
Baseline map of soil organic carbon in Tibet and its uncertainty in the 1980s
Zhou, Y., Webster, R., Rossel, R. A. V., Shi, Z., & Chen, S. (2018) · Geoderma · doi:10.1016/j.geoderma.2018.07.037 · Cited by 55
Effectiveness of China’s protected areas in reducing deforestation
Yang, H., Viña, A., Winkler, J. A., Chung, M. G., Dou, Y., Wang, F., Zhang, J., Tang, Y., Connor, T., Zhi, Z., et al. (2019) · Environmental Science and Pollution Research · doi:10.1007/s11356-019-05232-9 · Cited by 60
“(Hengl et al. 2017) / 250 m Soil depth m Absolute depth to bedrock.”
BackgroundLehmann, P., Berli, M., Koonce, J., & Or, D. (2019) · Geophysical Research Letters · doi:10.1029/2019gl083932 · Cited by 57
“The hydraulic properties (soil water characteristics and water content‐ dependent hydraulic conductivity) were estimated locally (for each pixel) using soil textural information from the SoilGrids database (Hengl et al., 2017) and the pedotransfer functions of Tóth et al. (2015).”
MethodZhang, J., Okin, G. S., & Zhou, B. (2019) · Remote Sensing of Environment · doi:10.1016/j.rse.2019.111382 · Cited by 62
He, Q., Qin, K., Cohen, J. B., Loyola, D., Li, D., Shi, J., & Xue, Y. (2020) · Environmental Research Letters · doi:10.1088/1748-9326/abc7df · Cited by 54
When and where soil is important to modify the carbon and water economy of leaves
Paillassa, J., Wright, I. J., Prentice, I. C., Pépin, S., Smith, N. G., Éthier, G., Westerband, A. C., Lamarque, L. J., Wang, H., Cornwell, W. K., et al. (2020) · New Phytologist · doi:10.1111/nph.16702 · Cited by 55
Sylvain, J., Anctil, F., & Thiffault, É. (2021) · Geoderma · doi:10.1016/j.geoderma.2021.115153 · Cited by 58
Trophic interrelationships drive the biogeography of protistan community in agricultural ecosystems
Chen, B., Xiong, W., Qi, J., Pan, H., Chen, S., Peng, Z., Gao, H., Zhang, L., Jiang, Y., Wei, G., et al. (2021) · Soil Biology and Biochemistry · doi:10.1016/j.soilbio.2021.108445 · Cited by 53
Temporal changes on soil conservation services in large basins across the world
An, Y., Zhao, W., Li, C., & Ferreira, C. (2021) · CATENA · doi:10.1016/j.catena.2021.105793 · Cited by 58
Tier 4 maps of soil pH at 25 m resolution for the Netherlands
Helfenstein, A., Mulder, V. L., Heuvelink, G. B. M., & Okx, J. P. (2021) · Geoderma · doi:10.1016/j.geoderma.2021.115659 · Cited by 59
Self-citationChen, M., Tang, C., Li, M., Jiang, X., Luo, Y., Shi, Q., Zhang, X., Tie, Y., & Feng, Q. (2021) · CATENA · doi:10.1016/j.catena.2021.105871 · Cited by 53
A Central Asia hydrologic monitoring dataset for food and water security applications in Afghanistan
McNally, A. L., Jacob, J. P., Arsenault, K. R., Slinski, K. M., Sarmiento, D. P., Hoell, A., Pervez, S., Rowland, J., Budde, M., Kumar, S. V., et al. (2022) · Earth system science data · doi:10.5194/essd-14-3115-2022 · Cited by 53
Machine Learning Research Trends in Africa: A 30 Years Overview with Bibliometric Analysis Review
Ezugwu, A. E.-S., Oyelade, O. N., Ikotun, A. M., Agushaka, J. O., & Ho, Y. (2023) · Archives of Computational Methods in Engineering · doi:10.1007/s11831-023-09930-z · Cited by 67
Arab, M. M., Askari, H. G., Aliniaeifard, S., Mokhtassi‐Bidgoli, A., Estaji, A., Sadat‐Hosseini, M., Sohrabi, S. S., Mesgaran, M. B., Leslie, C. A., Brown, P. J., et al. (2023) · Plant Physiology and Biochemistry · doi:10.1016/j.plaphy.2023.107859 · Cited by 58
Abebe, N., Eekhout, J., Vermeulen, B., Boix‐Fayos, C., de Vente, J., Grum, B., Hoitink, A. J. F., & Baartman, J. E. M. (2023) · CATENA · doi:10.1016/j.catena.2023.107480 · Cited by 55
Kheir, A. M. S., Govind, A., Nangia, V., El-Maghraby, M., Elnashar, A., Ahmed, M., Aboelsoud, H. M., Gamal, R., & Feike, T. (2025) · Computers and Electronics in Agriculture · doi:10.1016/j.compag.2025.110317 · Cited by 63
Climate and Land-Use Change Effects on Soil Carbon Stocks over 150 Years in Wisconsin, USA
Huang, J., Hartemink, A. E., & Zhang, Y. (2019) · Remote Sensing · doi:10.3390/rs11121504 · Cited by 54
“, climate, topography, land cover, land use, and soil types) [22,23].”
Tafasca, S., Ducharne, A., & Valentin, C. (2020) · Hydrology and earth system sciences · doi:10.5194/hess-24-3753-2020 · Cited by 59
“We will mention the availability of the 250m version of SoilGrids (Hengl et al., 2017) at line 35.”
MethodInfluentialRomero-Álvarez, D., Peterson, A. T., Salzer, J. S., Pittiglio, C., Shadomy, S. V., Traxler, R. M., Vieira, A. R., Bower, W. A., Walke, H. T., & Campbell, L. P. (2020) · PLoS neglected tropical diseases · doi:10.1371/journal.pntd.0008131 · Cited by 62
“, calcium), and carbon content (S2 Table) from the SoilGrids dataset at 250 m resolution and at multiple depths ranging from 0–5 cm and 5–15 cm [61] available at https://soilgrids.”
BackgroundAjjampur, S. S. R., Kaliappan, S. P., Halliday, K. E., Palanisamy, G., Farzana, J., Manuel, M., Abraham, D., Laxmanan, S., Aruldas, K., Rose, A., et al. (2021) · PLoS neglected tropical diseases · doi:10.1371/journal.pntd.0009338 · Cited by 59
Hradilová, I., Duchoslav, M., Brus, J., Pechanec, V., Hýbl, M., Kopecký, P., Smržová, L., Štefelová, N., Vaclávek, T., Bariotakis, M., et al. (2019) · PeerJ · doi:10.7717/peerj.6263 · Cited by 52
Modern Trends and Problems of Soil Mapping
Savin, I. Y., Zhogolev, A. V., & Prudnikova, E. Y. (2019) · Eurasian Soil Science · doi:10.1134/s1064229319050107 · Cited by 55
Plague risk in the western United States over seven decades of environmental change
Carlson, C. J., Bevins, S. N., & Schmid, B. V. (2021) · Global Change Biology · doi:10.1111/gcb.15966 · Cited by 56
The impact of land use and land cover changes on soil erosion in western Iran
Damaneh, H. E., Khosravi, H., Habashi, K., Damaneh, H. E., & Tiefenbacher, J. P. (2021) · Natural Hazards · doi:10.1007/s11069-021-05032-w · Cited by 52
Radočaj, D., & Jurišić, M. (2022) · Agronomy · doi:10.3390/agronomy12092210 · Cited by 56
“…many forms, as well as its processing, and it created intricate nonlinear linkages between training data and independent predictors (covariates) [16]. big data’s many forms, as well as its processing, and it created intricate nonlinear linkages between training data and independent predictors…”
BackgroundDigital Mapping of Soil Organic Carbon Based on Machine Learning and Regression Kriging
Zhu, C., Wei, Y., Zhu, F., Lu, W., Fang, Z., Li, Z., & Pan, J. (2022) · Sensors · doi:10.3390/s22228997 · Cited by 52
Silva, . V., Baudron, F., Ngoma, H., Nyagumbo, I., Simutowe, E., Kalala, K., Habeenzu, M., Mphatso, M., & Thierfelder, C. (2023) · Agronomy for Sustainable Development · doi:10.1007/s13593-023-00872-1 · Cited by 72
“Soil data on clay, silt and sand contents, pH in water and exchangeable acidity were retrieved from SoilGrids at 250m resolution (Hengl et al. 2017) and on rooting depth and soil available water from AfSIS-GYGA (Leenaars et al. 2015).”
BackgroundMethodProjected landscape-scale repercussions of global action for climate and biodiversity protection
von Jeetze, P., Weindl, I., Johnson, J. A., Borrelli, P., Panagos, P., Bacca, E. J. M., Karstens, K., Humpenöder, F., Dietrich, J. P., Minoli, S., et al. (2023) · Nature Communications · doi:10.1038/s41467-023-38043-1 · Cited by 68
Wflow_sbm v0.7.3, a spatially distributed hydrological model: from global data to local applications
van Verseveld, W. J., Weerts, A., Visser, M., Buitink, J., Imhoff, R. O., Boisgontier, H., Bouaziz, L. J. E., Eilander, D., Hegnauer, M., ten Velden, C., et al. (2024) · Geoscientific model development · doi:10.5194/gmd-17-3199-2024 · Cited by 63
Pedology and soil class mapping from proximal and remote sensed data
Poppiel, R. R., Lacerda, M. P. C., Demattê, J. A. M., Júnior, M. P. D. O., Gallo, B. C., & Safanelli, J. L. (2019) · Geoderma · doi:10.1016/j.geoderma.2019.04.028 · Cited by 53
Identifying multidisciplinary research gaps across Arctic terrestrial gradients
Virkkala, A., Abdi, A. M., Luoto, M., & Metcalfe, D. B. (2019) · Environmental Research Letters · doi:10.1088/1748-9326/ab4291 · Cited by 55
“The availability of high-resolution and spatially-explicit environmental data sets has greatly accelerated these efforts, because landscape variation of the Arctic can be better understood and readily visualized (Fick and Hijmans 2017, Hengl et al 2017).”
BackgroundInfluentialThe overlooked spatial dimension of climate‐smart agriculture
Prestele, R., & Verburg, P. H. (2019) · Global Change Biology · doi:10.1111/gcb.14940 · Cited by 57
“…sequestration potential in CA soils was estimated following the methodology of Zomer, Bossio, Sommer, and Verchot (2017), who mapped the carbon sequestration potential in agricultural soils using scenarios from Sommer and Bossio (2014) and present-day soil carbon contents from Hengl et al. (2017).”
BackgroundMethodHuang, Y., Dong, Y., Huang, W., Ren, B., Deng, Q., Shi, Y., Bai, J., Ren, Y., Geng, Y., & Ma, H. (2020) · Insects · doi:10.3390/insects11110805 · Cited by 53
“Moreover, in this research, we also considered three nonmonthly soil factors, including soil type, 0-5 cm silt content, and 0-5 cm clay content [41], which showed no significant differences between months but also affect the suitability”
MethodkNNDM CV: k-fold nearest-neighbour distance matching cross-validation for map accuracy estimation
Linnenbrink, J., Milà, C., Ludwig, M., & Meyer, H. (2024) · Geoscientific Model Development · doi:10.5194/gmd-17-5897-2024 · Cited by 82
Vågen, T., & Winowiecki, L. A. (2019) · Remote Sensing · doi:10.3390/rs11151800 · Cited by 53
“Reference [7] applied the RUSLE empirical model to predict global soil erosion using a combination of factors derived from: (1) the Shuttle Radar Topography Mission (SRTM) and ASTER GDEM digital elevation models (DEMs) for slope length and steepness (LS factor) and (2) the WorldClim database [26] for precipitation and…”
MethodAsante, P. A., Rozendaal, D. M. A., Rahn, E., Zuidema, P. A., Quaye, A. K., Asare, R., Läderach, P., & Anten, N. P. R. (2021) · Agricultural Systems · doi:10.1016/j.agsy.2021.103214 · Cited by 64
“Soil properties were obtained from the ISRIC/SoilGrids database (Hengl et al., 2017), at a depth of 0–30 cm with a spatial resolution of 250 m.”
MethodCurrent state and past changes in frozen ground at the Third Pole: A research synthesis
Ran, Y., Li, X., Che, T., Wang, B., & Cheng, G. (2022) · Advances in Climate Change Research · doi:10.1016/j.accre.2022.09.004 · Cited by 51
Batchu, V., Nearing, G., & Gulshan, V. (2023) · Journal of Hydrometeorology · doi:10.1175/jhm-d-22-0118.1 · Cited by 62
Zhao, Q., Shan, Y., Xiang, C., Wang, J., Zou, Y., Zhang, G., & Liu, W. (2023) · Journal of Energy Chemistry · doi:10.1016/j.jechem.2023.03.030 · Cited by 52
Escarpment evolution drives the diversification of the Madagascar flora
Liu, Y., Wang, Y., Willett, S. D., Zimmermann, N. E., & Pellissier, L. (2024) · Science · doi:10.1126/science.adi0833 · Cited by 56
Yu, P., Li, C., Li, M., He, X., Wang, D., Li, H., Marcon, C., Li, Y., Pérez-Limón, S., Chen, X., et al. (2024) · Nature Genetics · doi:10.1038/s41588-024-01761-3 · Cited by 59
“Data were collected from WorldClim 65 , the NCEP/NCAR Reanalysis Project 66 , NASA Surface Radiation Budget (https://asdc.larc.nasa.gov/project/ SRB), Climate Research Unit 67 , SoilGrids 68 , the Global Soil Dataset 69 and ArcGIS 70,71 .”
Soil pH Determines Nitrogen Effects on Methane Emissions From Rice Paddies
Tang, J., Qian, H., Zhu, X., Liu, Z., Kuzyakov, Y. V., Zou, J., Wang, J., Xu, Q., Li, G., Liu, Z., et al. (2024) · Global Change Biology · doi:10.1111/gcb.17577 · Cited by 54
“The global topsoil pH data from SoilGrids250m (Hengl et al. 2017) used in our estimation are based on numerous soil survey data-sets from national and international agencies, including the US National Soil Information System (1899–2005), the Land Use/Land Cover Area Frame Survey Topsoil Survey…”
InfluentialCaires, S. A. D., Martin, C. C. G. S., Atwell, M. A., Kaya, F., Wuddivira, G. A., & Wuddivira, M. N. (2025) · Discover Soil. · doi:10.1007/s44378-025-00082-z · Cited by 66
“Machine learning has introduced substantial innovation in the field of soil mapping and management by modeling complex, high-dimensional, and non-linear relationships among soil variables and environmental covariates [11, 16].”
InfluentialUrban and nomadic isotopic niches reveal dietary connectivities along Central Asia’s Silk Roads
Hermes, T. R., Frachetti, M. D., Bullion, E. A., Maksudov, F., Mustafokulov, S., & Makarewicz, C. A. (2018) · Scientific Reports · doi:10.1038/s41598-018-22995-2 · Cited by 55
Assessing the effectiveness of Sustainable Land Management for large-scale climate change adaptation
Eekhout, J., & de Vente, J. (2018) · The Science of The Total Environment · doi:10.1016/j.scitotenv.2018.10.350 · Cited by 51
Papacharalampous, G., & Tyralis, H. (2020) · Journal of Hydrology · doi:10.1016/j.jhydrol.2020.125205 · Cited by 57
Ding, J., Yang, S., Shi, Q., Wei, Y., & Wang, F. (2020) · Remote Sensing · doi:10.3390/rs12162601 · Cited by 56
“[24] report that SoilGrids is n expecte to be as accurate or relevant s locally produced maps but can be used as an impor ant vari bl in the construction of local mod ls.”
BackgroundMethodInfluentialKäber, Y., Meyer, P., Stillhard, J., Lombaerde, E. D., Zell, J., Stadelmann, G., Bugmann, H. K. M., & Bigler, C. (2021) · Ecology and Evolution · doi:10.1002/ece3.7984 · Cited by 55
“We used modeled and interpolated soil data to quantify bucket size (Hengl et al., 2017), which resulted in many absolute bucket size values to be unrealistically high.”
MethodLahav, E., Shahrabani, S., Rosenboim, M., & Tsutsui, Y. (2021) · European Journal of Health Economics · doi:10.1007/s10198-021-01389-8 · Cited by 48
Tziachris, P., Aschonitis, V. G., Chatzistathis, T., Papadopoulou, M. P., & Doukas, I. (2020) · ISPRS International Journal of Geo-Information · doi:10.3390/ijgi9040276 · Cited by 54
Zhang, Z., Ding, J., Zhu, C., Chen, X., Wang, J., Han, L., Ma, X., & Xu, D. M. (2021) · CATENA · doi:10.1016/j.catena.2021.105572 · Cited by 51
Xu, W., Cheng, Y., Guo, Y., Yao, W., & Qian, H. (2022) · Industrial Crops and Products · doi:10.1016/j.indcrop.2022.115782 · Cited by 54
The distribution of cadmium in soil and cacao beans in Peru
Thomas, E., Atkinson, R., Zavaleta, D., Rodriguez, C., Lastra, S., Yovera, F. F., Arango, K., Pezo, A., Aguilar, J., Tames, M., et al. (2023) · The Science of The Total Environment · doi:10.1016/j.scitotenv.2023.163372 · Cited by 59
Soil erosion assessment in the Amazon basin in the last 60 years of deforestation
Riquetti, N. B., Beskow, S., Guo, L., & de Mello, C. R. (2023) · Environmental Research · doi:10.1016/j.envres.2023.116846 · Cited by 58
Impact of Climate on the Global Capacity for Enhanced Rock Weathering on Croplands
Baek, S. H., Kanzaki, Y., Lora, J. M., Planavsky, N. J., Reinhard, C. T., & Zhang, S. (2023) · Earth s Future · doi:10.1029/2023ef003698 · Cited by 68
“We derive lithology data from Hartmann and Moosdorf (2012), soil organic matter data from Hengl et al. (2017), and erosion rate data from Larsen et al. (2014).”
MethodModels of upland species’ distributions are improved by accounting for geodiversity
Bailey, J. J., Boyd, D. S., & Field, R. (2018) · Landscape Ecology · doi:10.1007/s10980-018-0723-z · Cited by 50
Fried, G., Cordeau, S., Metay, A., & Kazakou, E. (2019) · Agriculture Ecosystems & Environment · doi:10.1016/j.agee.2019.01.006 · Cited by 62
“Therefore, we retrieved 8 factors from the Soilgrids dataset at 250m resolution (Hengl et al., 2017) based on the coordinates of the vineyard plots.”
MethodIs catchment geodiversity a useful surrogate of aquatic plant species richness?
Toivanen, M., Hjort, J., Heino, J., Tukiainen, H., Aroviita, J., & Alahuhta, J. (2019) · Journal of Biogeography · doi:10.1111/jbi.13648 · Cited by 56
Halliday, K. E., Oswald, W. E., Mcharo, C., Beaumont, E., Gichuki, P. M., Kepha, S., Witek-McManus, S. S., Matendechero, S. H., El‐Busaidy, H., Muendo, R., et al. (2019) · PLoS neglected tropical diseases · doi:10.1371/journal.pntd.0007427 · Cited by 54
Protein-rich legume and pseudo-cereal crop suitability under present and future European climates
Manners, R., Varela‐Ortega, C., & van Etten, J. (2019) · European Journal of Agronomy · doi:10.1016/j.eja.2019.125974 · Cited by 58
Feigl, M., Herrnegger, M., Klotz, D., & Schulz, K. (2020) · Water Resources Research · doi:10.1029/2020wr027385 · Cited by 55
“SoilGrids is a system for digital soil mapping using state ‐ of ‐ the ‐ art machine learning.”
MethodGibson, M. J. S., & Moyle, L. C. (2020) · Molecular Ecology · doi:10.1111/mec.15477 · Cited by 59
Reich, M. S., Flockhart, D. T. T., Norris, D. R., Hu, L., & Bataille, C. P. (2021) · Methods in Ecology and Evolution · doi:10.1111/2041-210x.13707 · Cited by 50
“…data products to be dominant predictors of ⁸⁷Sr/⁸⁶Sr in plants across eastern North America, including bedrock model products (Bataille et al., 2018), geological age of rock units (Hartmann & Moosdorf, 2012) and soil pH in H2O solution (×10; Hengl et al., 2017; Figure 3a; Figures S4 and S5).”
BackgroundNie, W., Kumar, S. V., Arsenault, K. R., Peters‐Lidard, C. D., Mladenova, I. E., Bergaoui, K., Hazra, A., Zaitchik, B. F., Mahanama, S., McDonnell, R. A., et al. (2022) · Hydrology and earth system sciences · doi:10.5194/hess-26-2365-2022 · Cited by 50
A Long-term Consistent Artificial Intelligence and Remote Sensing-based Soil Moisture Dataset
Skulovich, O., & Gentine, P. (2023) · Scientific Data · doi:10.1038/s41597-023-02053-x · Cited by 50
“Soil type data, based on a machine learning global prediction of basic soil properties 38 , was used as a static variable in the NN input configurations.”
MethodSplitting on categorical predictors in random forests
Wright, M. N., & König, I. R. (2019) · PeerJ · doi:10.7717/peerj.6339 · Cited by 64
Self-citationLemercier, B., Lagacherie, P., Amelin, J., Sauter, J., Pichelin, P., Richer-De-Forges, A. C., & Arrouays, D. (2022) · Geoderma · doi:10.1016/j.geoderma.2022.116052 · Cited by 49
Aerts, J., Hut, R., van de Giesen, N., Drost, N., van Verseveld, W. J., Weerts, A., & Hazenberg, P. (2022) · Hydrology and earth system sciences · doi:10.5194/hess-26-4407-2022 · Cited by 67
Variation in carbon and nitrogen concentrations among peatland categories at the global scale
Watmough, S. A., Gilbert-Parkes, S., Basiliko, N., Lamit, L. J., Lilleskov, E. A., Andersen, R., Pasquel, J. D. Á., Artz, R., Benscoter, B. W., Borken, W., et al. (2022) · PLoS ONE · doi:10.1371/journal.pone.0275149 · Cited by 53
Zhou, W. M., Guan, K., Peng, B., Margenot, A. J., Lee, D., Tang, J., Jin, Z., Grant, R. F., DeLucia, E. H., Qin, Z., et al. (2022) · Geoderma · doi:10.1016/j.geoderma.2022.116254 · Cited by 54
Tackling Soil ARG‐Carrying Pathogens with Global‐Scale Metagenomics
Wang, B., Xu, J. M., Wang, Y., Stirling, E., Zhao, K., Lu, C., Tan, X., Kong, D., Yan, Q., He, Z., et al. (2023) · Advanced Science · doi:10.1002/advs.202301980 · Cited by 67
Yang, C., Fraga, H., van Ieperen, W., & Santos, J. A. (2020) · Agricultural Systems · doi:10.1016/j.agsy.2020.102844 · Cited by 49
Calibrating and testing APSIM for wheat-faba bean pure cultures and intercrops across Europe
Berghuijs, H. N. C., Weih, M., van der Werf, W., Karley, A. J., Adam, E., Villegas-Fernández, Á. M., Kiær, L. P., Newton, A. C., Scherber, C., Tavoletti, S., et al. (2021) · Field Crops Research · doi:10.1016/j.fcr.2021.108088 · Cited by 60
Global land characterisation using land cover fractions at 100 m resolution
Masiliū̄nas, D., Tsendbazar, N., Herold, M., Lesiv, M., Buchhorn, M., & Verbesselt, J. (2021) · Remote Sensing of Environment · doi:10.1016/j.rse.2021.112409 · Cited by 56
Odusanya, A. E., Schulz, K., Biao, E. I., Dègan, B. A. S., & Mehdi, B. (2021) · Journal of Hydrology Regional Studies · doi:10.1016/j.ejrh.2021.100893 · Cited by 52
Xu, S. N., Eisenhauer, N., Pellegrini, A. F. A., Wang, J., Certini, G., Guerra, C. A., & Lai, D. Y. F. (2022) · The Science of The Total Environment · doi:10.1016/j.scitotenv.2022.153921 · Cited by 52
Artificial intelligence and soil carbon modeling demystified: power, potentials, and perils
Grunwald, S. (2022) · Carbon Footprints · doi:10.20517/cf.2022.03 · Cited by 60
Garner, R. E., Kraemer, S. A., Onana, V. E., Huot, Y., Gregory‐Eaves, I., & Walsh, D. A. (2022) · mSystems · doi:10.1128/msystems.00316-22 · Cited by 72
“Watershed surface soil properties were accessed from SoilGrids250m (102).”
Gao, P., Xie, Y., Song, C., Cheng, C., & Ye, S. (2023) · Journal of Geographical Sciences · doi:10.1007/s11442-023-2080-3 · Cited by 48
“(Hengl et al., 2017) 11 Cation exchange capacity 12 pH in H2O”
BackgroundBurned area and carbon emissions across northwestern boreal North America from 2001–2019
Potter, S., Cooperdock, S. C., Veraverbeke, S., Walker, X. J., Mack, M. C., Goetz, S. J., Baltzer, J. L., Bourgeau-Chavez, L. L., Burrell, A. L., Dieleman, C. M., et al. (2023) · Biogeosciences · doi:10.5194/bg-20-2785-2023 · Cited by 51
Ajibade, S.-S. M., Zaidi, A. T., Bekun, F. V., Adediran, A. O., & Bassey, M. A. (2023) · Heliyon · doi:10.1016/j.heliyon.2023.e20297 · Cited by 58
“[32], which has been cited 1661 times in the literature.”
BackgroundDing, Z., Liu, K., Grunwald, S., Smith, P., Ciais, P., Wang, B., Wadoux, A. M. J. ‐., Ferreira, C., Karunaratne, S. B., Shurpali, N., et al. (2025) · Advanced Science · doi:10.1002/advs.202504152 · Cited by 69
Symbolic Regression for the Estimation of Transfer Functions of Hydrological Models
Klotz, D., Herrnegger, M., & Schulz, K. (2017) · Water Resources Research · doi:10.1002/2017wr021253 · Cited by 49
“Each cell contains three spatial predictors: the percentage of sand ( sand ) (Hengl et al., 2017), the slope in ], Knyazikhin et al., 1999; Myneni et al., 2002).”
BackgroundSteiner, F. M., Csősz, S., Markó, B., Gamisch, A., Rinnhofer, L. J., Folterbauer, C., Hammerle, S., Stauffer, C., Arthofer, W., & Schlick-Steiner, B. C. (2018) · Molecular Phylogenetics and Evolution · doi:10.1016/j.ympev.2018.04.005 · Cited by 58
Hellegers, M., Ozinga, W. A., van Hinsberg, A., Huijbregts, M. A. J., Hennekens, S. M., Schaminée, J. H. J., Dengler, J., & Schipper, A. M. (2019) · Ecography · doi:10.1111/ecog.04291 · Cited by 48
Akinyemi, F. O., Ghazaryan, G., & Dubovyk, O. (2020) · Land Degradation and Development · doi:10.1002/ldr.3695 · Cited by 52
“In the absence of national data, SOCs for use in this study were computed approximately for the year 2000 (see UNCCD, 2018 for justification) following Hengl et al. (2017) as in Equation 1.”
MethodRegional ensemble modeling reduces uncertainty for digital soil mapping
Brungard, C., Nauman, T., Duniway, M. C., Veblen, K. E., Nehring, K. C., White, D. A., Salley, S. W., & Anchang, J. Y. (2021) · Geoderma · doi:10.1016/j.geoderma.2021.114998 · Cited by 53
“At the global scale, Hengl et al. (2014) and Hengl et al. (2017) used linear-regression kriging and an ensemble of machine learners for modeling multiple soil properties and classes.”
BackgroundMethod
Metadata
- Authors
- Hengl, T., Mendes de Jesus, J., Heuvelink, G. B. M., Ruiperez Gonzalez, M., Kilibarda, M., Blagotić, A., Shangguan, W., Wright, M. N., Geng, X., Bauer-Marschallinger, B., Guevara, M. A., Vargas, R., MacMillan, R. A., Batjes, N. H., Leenaars, J. G. B., Ribeiro, E., Wheeler, I., Mantel, S., & Kempen, B.
- Affiliations
- ISRIC - World Soil Information (NL)
- University of Belgrade (RS)
- Sun Yat-sen University (CN)
- University of Lübeck (DE)
- Agriculture and Agri-Food Canada (CA)
- TU Wien (AT)
- University of Delaware (US)
- ORCID
- Venue
- PLOS ONE
- Publisher
- Public Library of Science (PLoS)
- Published
- 2017-02-16
- Volume
- 12
- Issue
- 2
- Pages
- e0169748
- ISSN
- 1932-6203 (ISSN-L)
- PMC
- PMC5313206
- OpenAlex
- W2588003345
- Cited by
- 4,733
- References
- 89
- Citations by year
- 2026: 591 · 2025: 654 · 2024: 610 · 2023: 634 · 2022: 669 · 2021: 672 · 2020: 402 · 2019: 265 · 2018: 173 · 2017: 56
- FWCI
- 137.14
- Type
- journal article
- Language
- en
- Open access
- gold
- doi.org
- Licence
- Locations
- PLoS ONE (publishedVersion, cc-by)
- PubMed Central (publishedVersion, cc-by)
- PubMed (publishedVersion)
- RePEc: Research Papers in Economics (submittedVersion)
- DOAJ (DOAJ: Directory of Open Access Journals) (submittedVersion)
- GraFar (University of Belgrade, Faculty of Civil Engineering) (submittedVersion, cc-by)
- Socio-Environmental Systems Modeling (submittedVersion, cc-by)
- Data Archiving and Networked Services (DANS) (submittedVersion, other-oa)
- Topics
- Life Sciences › Agricultural and Biological Sciences › Soil Science › Soil Geostatistics and Mapping
- Physical Sciences › Environmental Science › Environmental Engineering › Soil Moisture and Remote Sensing
- Physical Sciences › Environmental Science › Management, Monitoring, Policy and Law › Soil and Land Suitability Analysis
- Keywords
- SoilGrids, soil properties, soil organic carbon, soil bulk density, cation exchange capacity, soil pH, soil texture, coarse fragments, bedrock depth, soil classification, USDA soil classification, MODIS, random forest, gradient boosting, multinomial logistic regression, ensemble learning, accuracy assessment, soil mapping
- MeSH terms
- Machine Learning, Algorithms, Conservation of Natural Resources, Environmental Monitoring, Humans, Models, Theoretical, Soil, Geographic Information Systems
About these checks
Registry, retraction, Cites and statistics results are computed, not judged, with one exception: a printed reference that no index lists is read once by a model before it counts as a citation error. Claims are extracted by a model and kept only when their quote appears verbatim in the text; each cited source is then checked, with a model’s help, for whether it says what the claim relies on. Those verdicts can be wrong — read the claim’s quote and the cited source before relying on one.
Statistics and arithmetic are recomputed, not judged.
Confidence bands are shown only for fields calibrated on our annotated test set. None is calibrated yet, so no band is shown.
What counts as a claim ›How we measure confidence ›How we check this ›
Are you an author, or do you see a problem with this page? Request a review
Data sources
Bibliographic data: Semantic Scholar, OpenAlex, Crossref.
Contains information from the Semantic Scholar Academic Graph Datasets, made available under the ODC Attribution License (ODC-BY 1.0).
Semantic Scholar’s data is described in: Kinney, R., et al. (2023). The Semantic Scholar Open Data Platform. arXiv:2301.10140.
