

SoilGrids250m: Global gridded soil information based on machine learning
Open accessThe DOI matches its Crossref record; 85 of the 89 references it cites were found in a registry or an index.
Abstract
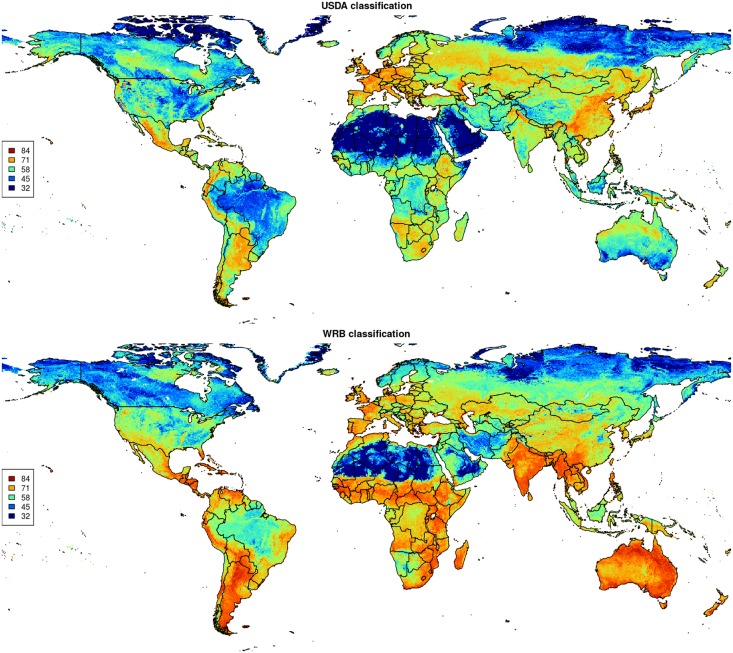
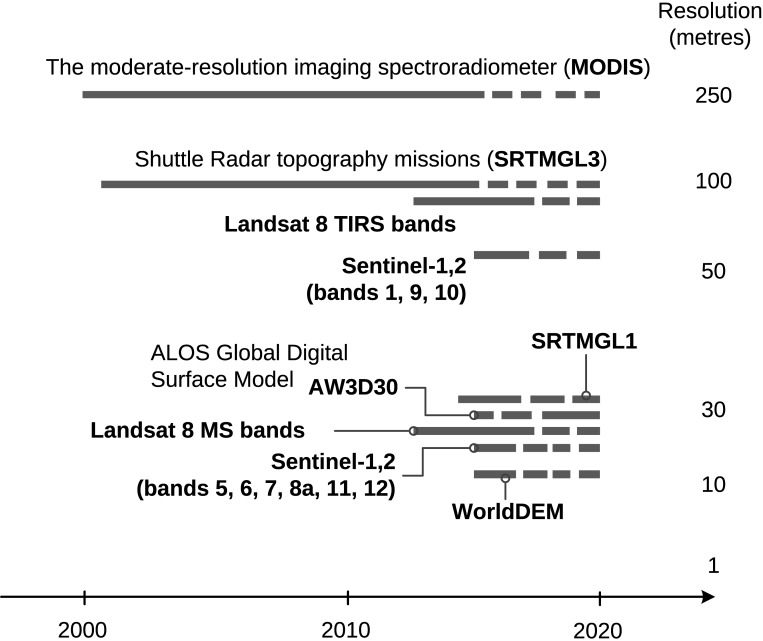
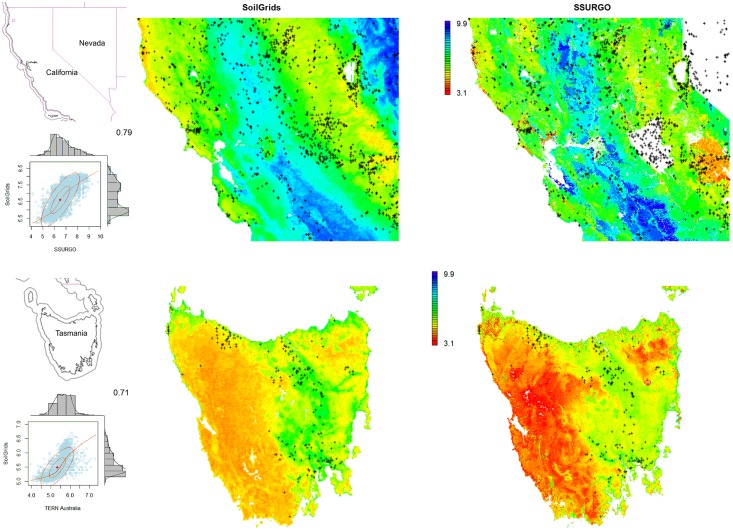
This paper describes the technical development and accuracy assessment of the most recent and improved version of the SoilGrids system at 250m resolution (June 2016 update). SoilGrids provides global predictions for standard numeric soil properties (organic carbon, bulk density, Cation Exchange Capacity (CEC), pH, soil texture fractions and coarse fragments) at seven standard depths (0, 5, 15, 30, 60, 100 and 200 cm), in addition to predictions of depth to bedrock and distribution of soil classes based on the World Reference Base (WRB) and USDA classification systems (ca. 280 raster layers in total). Predictions were based on ca. 150,000 soil profiles used for training and a stack of 158 remote sensing-based soil covariates (primarily derived from MODIS land products, SRTM DEM derivatives, climatic images and global landform and lithology maps), which were used to fit an ensemble of machine learning methods-random forest and gradient boosting and/or multinomial logistic regression-as implemented in the R packages ranger, xgboost, nnet and caret. The results of 10-fold cross-validation show that the ensemble models explain between 56% (coarse fragments) and 83% (pH) of variation with an overall average of 61%. Improvements in the relative accuracy considering the amount of variation explained, in comparison to the previous version of SoilGrids at 1 km spatial resolution, range from 60 to 230%. Improvements can be attributed to: (1) the use of machine learning instead of linear regression, (2) to considerable investments in preparing finer resolution covariate layers and (3) to insertion of additional soil profiles. Further development of SoilGrids could include refinement of methods to incorporate input uncertainties and derivation of posterior probability distributions (per pixel), and further automation of spatial modeling so that soil maps can be generated for potentially hundreds of soil variables. Another area of future research is the development of methods for multiscale merging of SoilGrids predictions with local and/or national gridded soil products (e.g. up to 50 m spatial resolution) so that increasingly more accurate, complete and consistent global soil information can be produced. SoilGrids are available under the Open Data Base License.
Overview
The claims and statistics of this paper haven’t been checked yet.
Free: it reads the open-access text and checks the first 5 claims that cite a source we can check. Create a free account to check every claim.
Integrity signals
Registry
Cites
Statistics
Figures






Verification
Claims the paper makes
The claims and statistics of this paper haven’t been checked yet.
Free: it reads the open-access text and checks the first 5 claims that cite a source we can check. Create a free account to check every claim.
Claims other papers make about this one
Each is checked against this paper’s own text: does it say what the citing paper says it does?
The source backs part of the claim, not all of it — or backs it for a different population, condition or comparison.
In the citing paper
“These uncertainties are mostly due to the uneven distribution and overall scarcity of field data for modelling and validating carbon stocks in the biomass and soil 27,64,65 .”
From Global priority areas for ecosystem restoration (2020) · cites this paper as [65]
Experimental — accuracy not yet measured
Self-check
Percentages, sums and reported differences re-computed from the paper’s own numbers.
The self-check needs the paper’s full text.
Citations
Cites
XGBoost: A Scalable Tree Boosting System
Chen, T., & Guestrin, C. (2016) · Proceedings of the 22nd ACM SIGKDD International Conference on Knowledge Discovery and Data Mining · doi:10.1145/2939672.2939785 · Cited by 54,569
Modern Applied Statistics with S
Venables, W. N., & Ripley, B. D. (2002) · Statistics and Computing · doi:10.1007/978-0-387-21706-2 · Cited by 24,305
Very high resolution interpolated climate surfaces for global land areas
Hijmans, R. J., Cameron, S. E., Parra, J. L., Jones, P. G., & Jarvis, A. (2005) · International Journal of Climatology · doi:10.1002/joc.1276 · Cited by 19,825
Total Carbon, Organic Carbon, and Organic Matter
Nelson, D. W., & Sommers, L. E. (1982) · Agronomy Monographs · doi:10.2134/agronmonogr9.2.2ed.c29 · Cited by 9,978
Building Predictive Models in R Using the caret Package
Kuhn, M. (2008) · Journal of Statistical Software · doi:10.18637/jss.v028.i05 · Cited by 8,863
Weighted kappa: nominal scale agreement provision for scaled disagreement or partial credit
Cohen, J. (1968) · Psychological Bulletin · doi:10.1037/h0026256 · Cited by 8,736
Kuhn, M., & Johnson, K. (2013) · doi:10.1007/978-1-4614-6849-3 · Cited by 6,788
Communication in the presence of noise
Shannon, C. E. (1949) · Proceedings of the IRE · doi:10.1109/jrproc.1949.232969 · Cited by 6,539
Anonim, A. (2010) · Cited by 4,945
Communication In The Presence Of Noise
Shannon, C. E. (1998) · Proceedings of the IEEE · doi:10.1109/jproc.1998.659497 · Cited by 4,804
Research works printed but not linked: 5
- D Arrouays, 2014, Soil carbon. vol. 125 of Advances in Agronomy, 93
- SA Lei, 1998, Soil Properties of the Kelso Sand Dunes in the Mojave Desert, The Southwestern Naturalist, 43, 47
- Huffman GJ, Bolvin DT. GPCP version 2 combined precipitation data set documentation. vol. 1. Laboratory for Atmospheres, NASA Goddard Space Flight Center and Science Systems and Applications; 2009.
- Kempen B. Updating soil information with digital soil mapping [PhD thesis]. Wageningen University. Wageningen; 2011. Available from: http://edepot.wur.nl/187198.
- Eberhardt E. Deriving WRB soil types using National German Soil Survey Guidelines. In: NCSS National Conference. NCSS Standards. Asheville, NC: United States Department of Agriculture USDA-NRCS; 2011. p. 1–2.
Cited by
Items 501–600 of 1,006
Monitoring and Modeling the Soil‐Plant System Toward Understanding Soil Health
Zeng, Y., Verhoef, A., Vereecken, H., Ben‐Dor, E., Veldkamp, A., Shaw, L. J., van der Ploeg, M. J., Wang, Y., & Su, Z. (2025) · Reviews of Geophysics · doi:10.1029/2024rg000836 · Cited by 91
“PTFs offer an alternative by linking easily accessible soil characteristics, such as texture, bulk density, and organic carbon content (Hengl et al., 2017; Poggio et al., 2021), with soil hydraulic and thermal parameters needed to model soil water and heat flow, as well as biogeochemical parameters…”
InfluentialHarnessing artificial intelligence to fill global shortfalls in biodiversity knowledge
Pollock, L. J., Kitzes, J. A., Beery, S., Gaynor, K. M., Jarzyna, M. A., Aodha, O. M., Meyer, B. E., Rolnick, D., Taylor, G. W., Tuia, D., et al. (2025) · Nature Reviews Biodiversity · doi:10.1038/s44358-025-00022-3 · Cited by 103
“For example, global gridded soil data (SoilGrids250) 195 are based on traditional machine learning (ML) approaches such as random forests.”
Multiscale contextual spatial modelling with the Gaussian scale space
Behrens, T., Schmidt, K., MacMillan, R. A., & Rossel, R. A. V. (2017) · Geoderma · doi:10.1016/j.geoderma.2017.09.015 · Cited by 77
Self-citationThe Tyranny of Small Scales—On Representing Soil Processes in Global Land Surface Models
Or, D. (2019) · Water Resources Research · doi:10.1029/2019wr024846 · Cited by 73
“For example, the creation of the SoilGrids250m uses 150,000 soil profiles for training advanced machine learning and spatial interpolation (Hengl et al., 2017).”
MethodHassani, A., Azapagic, A., D’Odorico, P., Keshmiri, A., & Shokri, N. (2019) · The Science of The Total Environment · doi:10.1016/j.scitotenv.2019.134718 · Cited by 78
“Based on the soil map of the Urmia basin (Hengl et al., 2017), the soil type in this area can be categorized as Inceptisol (Service USDoASC, 1999).”
MethodResponses of soil organic carbon to climate change in the Qilian Mountains and its future projection
Li, H., Wu, Y., Chen, J., Zhao, F., Wang, F., Sun, Y., Zhang, G., & Qiu, L. (2021) · Journal of Hydrology · doi:10.1016/j.jhydrol.2021.126110 · Cited by 78
Ran, Y., Jorgenson, M. T., Li, X., Jin, H., Wu, T., Li, R., & Cheng, G. (2021) · Environmental Research Letters · doi:10.1088/1748-9326/ac20f3 · Cited by 73
Arrouays, D., Mulder, V. L., & Richer-De-Forges, A. C. (2021) · Soil Security · doi:10.1016/j.soisec.2021.100018 · Cited by 86
Odebiri, O., Mutanga, O., Odindi, J., & Naicker, R. (2022) · ISPRS Journal of Photogrammetry and Remote Sensing · doi:10.1016/j.isprsjprs.2022.04.026 · Cited by 77
Hu, G., Zhao, L., Li, R., Park, H., Wu, X., Su, Y., Guggenberger, G., Wu, T., Zou, D., Zhu, X., et al. (2022) · CATENA · doi:10.1016/j.catena.2022.106844 · Cited by 74
The global biogeography of tree leaf form and habit
Ma, H., Crowther, T. W., Mo, L., Maynard, D. S., Renner, S. S., van den Hoogen, J., Zou, Y., Liang, J., de‐Miguel, S., Nabuurs, G. J., et al. (2023) · Nature Plants · doi:10.1038/s41477-023-01543-5 · Cited by 87
“In total, 58 global environmental layers reflecting climate 50 , topography, vegetation, anthropogenic and soil 67 (at 0 cm to 100 cm depth) characteristics were used as covariates in our analyses (Supplementary Fig.”
MethodDevelopment of a Geogenic Radon Hazard Index—Concept, History, Experiences
Bossew, P., Cinelli, G., Ciotoli, G., Crowley, Q., Cort, M. D., Elío, J., Gruber, V., Petermann, E., & Tollefsen, T. (2020) · International Journal of Environmental Research and Public Health · doi:10.3390/ijerph17114134 · Cited by 77
Niche divergence and limits to expansion in the high polyploid Dianthus broteri complex
López‐Jurado, J., Mateos‐Naranjo, E., & Balao, F. (2018) · New Phytologist · doi:10.1111/nph.15663 · Cited by 83
“…and two topographic continuous variables from the ENVIREM database (Title & Bemmels, 2018) at c. 1 km2 resolution; seven relevant edaphic variables from the SoilGrids database (Hengl et al., 2017) at a resolution of 250 m2; and (4) the altitude information from WorldClim (Fick & Hijmans, 2017).”
MethodKarjalainen, O., Luoto, M., Aalto, J., & Hjort, J. (2019) · The Cryosphere · doi:10.5194/tc-13-693-2019 · Cited by 73
Synthetic resampling strategies and machine learning for digital soil mapping in Iran
Taghizadeh‐Mehrjardi, R., Schmidt, K., Eftekhari, K., Behrens, T., Jamshidi, M., Davatgar, N., Toomanian, N., & Scholten, T. (2019) · European Journal of Soil Science · doi:10.1111/ejss.12893 · Cited by 75
“…local scales (Brungard, Boettinger, Duniway, Wills, & Edwards, 2015; Hounkpatin et al., 2018; Schmidt, Behrens, & Scholten, 2008), the national scale (Adhikari, Minasny, Greve, & Greve, 2014; Ramcharan et al., 2018) and the continental scale (Hengl et al., 2017; Teng, Rossel, Shi, & Behrens, 2018).”
MethodHigh potential for loss of permafrost landforms in a changing climate
Karjalainen, O., Luoto, M., Aalto, J., Etzelmüller, B., Grosse, G., Jones, B. M., Lilleøren, K. S., & Hjort, J. (2020) · Environmental Research Letters · doi:10.1088/1748-9326/abafd5 · Cited by 71
Dari, J., Quintana‐Seguí, P., Morbidelli, R., Saltalippi, C., Flammini, A., Giugliarelli, E., Escorihuela, M., Stefan, V., & Brocca, L. (2022) · Agricultural Water Management · doi:10.1016/j.agwat.2022.107537 · Cited by 73
Physical laws meet machine intelligence: current developments and future directions
Muther, T., Dahaghi, A. K., Syed, F. I., & Pham, V. V. (2022) · Artificial Intelligence Review · doi:10.1007/s10462-022-10329-8 · Cited by 82
Cai, L., Kreft, H., Taylor, A., Schrader, J., Dawson, W., Essl, F., van Kleunen, M., Pergl, J., Pyšek, P., Winter, M., et al. (2023) · Proceedings of the National Academy of Sciences · doi:10.1073/pnas.2300981120 · Cited by 81
Nijp, J., Temme, A. J. A. M., van Voorn, G. A. K., Kooistra, L., Hengeveld, G., Soons, M. B., Teuling, A. J., & Wallinga, J. (2019) · Global Change Biology · doi:10.1111/gcb.14591 · Cited by 79
“Unfortunately, global spatial data on, for example, soils (Hengl et al., 2017; Stoorvogel, Bakkenes, Temme, Batjes, & Brink, 2016) is often highly uncertain at a reso‐ lution matching the typical scale of vegetation patches (~1–250 m; Supporting Information S2).”
BackgroundSoil Organic Carbon Across Mexico and the Conterminous United States (1991–2010)
Guevara, M., Arroyo-Cruz, C. E., Brunsell, N. A., Cruz, C., Domke, G. M., Equihua, J., Etchevers, J. D., Hayes, D. J., Hengl, T., Ibelles, A., et al. (2020) · Global Biogeochemical Cycles · doi:10.1029/2019gb006219 · Cited by 76
“Our predicted SOC stock is lower when compared to values obtained from global estimates such as the re ‐ gridded HWSD (Wieder et al. 2014) or the SoilGrids250m system (Hengl et al., 2017), where this value increases to ~71 and ~92 Pg of SOC, respectively.”
InfluentialSelf-citationEwunetu, A., Simane, B., Teferi, E., & Zaitchik, B. F. (2021) · Sustainability · doi:10.3390/su13042244 · Cited by 73
“[48] and reclassified based on the values given in Table 4.”
BackgroundMethodInfluentialA framework for quantifying hydrologic effects of soil structure across scales
Bonetti, S., Wei, Z., & Or, D. (2021) · Communications Earth & Environment · doi:10.1038/s43247-021-00180-0 · Cited by 70
Salcedo, F. P., Pérez‐Cutillas, P., Alarcón, J. J., & Vivaldi, G. A. (2021) · The Science of The Total Environment · doi:10.1016/j.scitotenv.2021.152524 · Cited by 76
Haider, S., Lembrechts, J. J., McDougall, K. L., Pauchard, A., Alexander, J. M., Barros, A., Cavieres, L. A., Rashid, I., Rew, L. J., Aleksanyan, A. S., et al. (2022) · Ecology and Evolution · doi:10.1002/ece3.8590 · Cited by 77
“…we aim to keep the protocol as simple as possible, and therefore additional variables of interest can be either extracted from online resources (e.g., soil characteristics, Hengl et al., 2017) or topographic variables (Amatulli et al., 2018) or through optional add-on studies (see section below).”
Ruffault, J., Pimont, F., Cochard, H., Dupuy, J., & Martin-StPaul, N. K. (2022) · Geoscientific model development · doi:10.5194/gmd-15-5593-2022 · Cited by 84
Predicting artificially drained areas by means of a selective model ensemble
Møller, A. B., Beucher, A., Iversen, B. V., & Greve, M. H. (2018) · Geoderma · doi:10.1016/j.geoderma.2018.01.018 · Cited by 74
How Have Global River Widths Changed Over Time?
Feng, D., Gleason, C. J., Yang, X., Allen, G. H., & Pavelsky, T. M. (2022) · Water Resources Research · doi:10.1029/2021wr031712 · Cited by 70
“, soil erosion), based on previously published global data sets (Dallaire et al., 2018; Fan et al., 2013; Grill et al., 2019; Hengl et al., 2017; Huscroft et al., 2018; Lin et al., 2020; Linke et al., 2019; Liu et al., 2018; Messager et al., 2021; Wada et al., 2016; Yamazaki et al., 2017; Zhu et al., 2013), as previou…”
BackgroundClimatic vulnerabilities and ecological preferences of soil invertebrates across biomes
Bastida, F., Eldridge, D. J., Abades, S. R., Alfaro, F. D., Gallardo, A., García‐Velázquez, L., García, C. P., Hart, S. C., Pérez, C. A., Santos, F., et al. (2019) · Molecular Ecology · doi:10.1111/mec.15299 · Cited by 75
Olive tree irrigation as a climate change adaptation measure in Alentejo, Portugal
Fraga, H., Pinto, J. G., & Santos, J. A. (2020) · Agricultural Water Management · doi:10.1016/j.agwat.2020.106193 · Cited by 69
“bulk density, albedo and pH), were primarily obtained for all of the Alentejo agrarian region using information from two datasets: the global SoilGrids dataset at 250m resolution (Hengl et al., 2017) and the Harmonized World Soil Database (∼1 km resolution) (FAO/IIASA/ ISRIC/ISSCAS/JRC, 2012).”
MethodTao, F., Zhou, Z., Huang, Y., Li, Q., Lu, X., Ma, S., Huang, X., Liang, Y., Hugelius, G., Jiang, L., et al. (2020) · Frontiers in Big Data · doi:10.3389/fdata.2020.00017 · Cited by 75
Campos-Silva, L. A., & Piratelli, A. J. (2020) · Urban Ecosystems · doi:10.1007/s11252-020-01045-8 · Cited by 83
Wang, H., Zhang, X., Wu, W., & Liu, H. (2021) · Remote Sensing · doi:10.3390/rs13071229 · Cited by 70
“The extreme gradient boosting (XGboost) algorithm has been used to predict SOC with good prediction results [17,22,29,30].”
MethodMu, M., Kauwe, M. G. D., Ukkola, A., Pitman, A. J., Guo, W., Hobeichi, S., & Briggs, P. (2021) · Earth System Dynamics · doi:10.5194/esd-12-919-2021 · Cited by 72
A mechanistic assessment of urban heat island intensities and drivers across climates
Zhang, Z., Paschalis, A., Mijić, A., Meili, N., Manoli, G., van Reeuwijk, M., & Fatichi, S. (2022) · Urban Climate · doi:10.1016/j.uclim.2022.101215 · Cited by 88
Soil carbon in tropical savannas mostly derived from grasses
Zhou, Y., Bomfim, B., Bond, W. J., Boutton, T. W., Case, M. F., Coetsee, C., Davies, A. B., February, E. C., Gray, E., Silva, L. C. R., et al. (2023) · Nature Geoscience · doi:10.1038/s41561-023-01232-0 · Cited by 84
Mapping the global distribution of C4 vegetation using observations and optimality theory
Luo, X., Zhou, H., Satriawan, T. W., Tian, J., Zhao, R., Keenan, T. F., Griffith, D. M., Sitch, S. A., Smith, N. G., & Still, C. J. (2024) · Nature Communications · doi:10.1038/s41467-024-45606-3 · Cited by 91
“…naturalgrassdistribution, we fi rst used an optimality photosynthesis model 44 to simulate the optimalphotosyntheticassimilationratesofC 4 andC 3 plants(notedas AC 3 and AC 4 , respectively) using 0.5 ×0.5 degree gridded historical climate (i.e., CRU-JRA2020), soil 73 and leaf nitrogen content 74 .”
MethodInfluentialGlobal soil water erosion responses to climate and land use changes
Xiong, M., & Leng, G. (2024) · CATENA · doi:10.1016/j.catena.2024.108043 · Cited by 78
Hydropedology: Interactions between pedologic and hydrologic processes across spatiotemporal scales
Ma, Y., Li, X., Guo, L., & Lin, H. (2017) · Earth-Science Reviews · doi:10.1016/j.earscirev.2017.05.014 · Cited by 69
Downscaling AMSR-2 Soil Moisture Data With Geographically Weighted Area-to-Area Regression Kriging
Jin, Y., Ge, Y., Wang, J., Chen, Y., Heuvelink, G. B. M., & Atkinson, P. M. (2017) · IEEE Transactions on Geoscience and Remote Sensing · doi:10.1109/tgrs.2017.2778420 · Cited by 69
“Candidate additional covariates are land cover maps, apparent thermal inertia [60], and soil texture information [61].”
BackgroundSelf-citationBaseline map of organic carbon stock in farmland topsoil in East China
Deng, X., Chen, X., Ma, W., Ren, Z., Zhang, M., Grieneisen, M. L., Long, W., Ni, Z., Zhan, Y., & Lv, X. (2017) · Agriculture Ecosystems & Environment · doi:10.1016/j.agee.2017.11.022 · Cited by 73
Carbon emissions from cropland expansion in the United States
Spawn, S., Lark, T. J., & Gibbs, H. (2019) · Environmental Research Letters · doi:10.1088/1748-9326/ab0399 · Cited by 79
Lehmann, P., von Ruette, J., & Or, D. (2019) · Water Resources Research · doi:10.1029/2019wr025233 · Cited by 68
“To characterize soil properties, distribution of soil texture information were obtained from the SoilGrids database (Hengl et al., 2017) at a 250 m resolution.”
MethodEffects of long-term K fertilization on soil available potassium in East China
Song, X., Liu, F., Wu, H., Cao, Q., Zhong, C., Yang, J., Li, C., Zhao, Y.-G., & Zhang, G.-L. (2019) · CATENA · doi:10.1016/j.catena.2019.104412 · Cited by 68
Pantropical variability in tree crown allometry
Panzou, G. J. L., Fayolle, A., Jucker, T., Phillips, O. L., Bohlman, S., Banin, L. F., Lewis, S. L., Affum‐Baffoe, K., Alves, L. F., Antin, C., et al. (2020) · Global Ecology and Biogeography · doi:10.1111/geb.13231 · Cited by 73
“…predictions at seven standard depths for all numerical soil properties: 0, 5, 15, 30, 60, 100 and 200 cm. Averages over (standard) depth intervals, 0–30 cm, were derived by taking a weighted average of the predictions within the depth interval using the method developed by Hengl et al. (2017).”
MethodClimate change reshapes the eco‐evolutionary dynamics of a Neotropical seed dispersal system
Sales, L. P., Kissling, W. D., Galetti, M., Naimi, B., & Pires, M. M. (2021) · Global Ecology and Biogeography · doi:10.1111/geb.13271 · Cited by 72
Gashaw, T., Dile, Y. T., Worqlul, A. W., Bantider, A., Zeleke, G., Bewket, W., & Alamirew, T. (2021) · Environmental Management · doi:10.1007/s00267-021-01492-9 · Cited by 68
Neutrons on Rails: Transregional Monitoring of Soil Moisture and Snow Water Equivalent
Schrön, M., Oswald, S. E., Zacharias, S., Kasner, M., Dietrich, P., & Attinger, S. (2021) · Geophysical Research Letters · doi:10.1029/2021gl093924 · Cited by 68
“, 2016), soil properties (Hengl et al., 2017; McJannet et al., 2017), and road and track conditions (Schrön, Rosolem, et al.”
BackgroundAniza, R., Chen, W., Pétrissans, A., Hoang, A. T., Ashokkumar, V., & Pétrissans, M. (2023) · Environmental Pollution · doi:10.1016/j.envpol.2023.121363 · Cited by 73
A high-resolution map of soil organic carbon in cropland of Southern China
Hu, B., Xie, M., Zhou, Y., Chen, S., Zhou, Y., Ni, H., Peng, J. G., Ji, W., Hong, Y., Li, H., et al. (2024) · CATENA · doi:10.1016/j.catena.2024.107813 · Cited by 74
Root-restricting layers in German agricultural soils. Part I: extent and cause
Schneider, F., & Don, A. (2019) · Plant and Soil · doi:10.1007/s11104-019-04185-9 · Cited by 68
Substrate and climate determine terrestrial litter decomposition
Wu, Q., Ni, X., Sun, X., Chen, Z., Hong, S., Berg, B., Zheng, M., Chen, J., Zhu, J., Ai, L., et al. (2025) · Proceedings of the National Academy of Sciences · doi:10.1073/pnas.2420664122 · Cited by 67
Okello, A. M. L. S., Uhlenbrook, S., Jewitt, G. P. W., Masih, I., Riddell, E., & van der Zaag, P. (2018) · Hydrological Processes · doi:10.1002/hyp.11491 · Cited by 75
“In the Kaap valley, lithic leptosols and rhodic nitisols dominate (Hengl et al., 2014; Hengl et al., 2017).”
BackgroundAraya, S. N., Fryjoff-Hung, A., Anderson, A., Viers, J. H., & Ghezzehei, T. A. (2021) · Hydrology and earth system sciences · doi:10.5194/hess-25-2739-2021 · Cited by 77
Godlee, J. L., Ryan, C. M., Bauman, D., Bowers, S. J., Carreiras, J. M. B., Chisingui, A. V., Cromsigt, J. P. G. M., Druce, D. J., Finckh, M., Gonçalves, F. M. P., et al. (2021) · New Phytologist · doi:10.1111/nph.17639 · Cited by 75
In Situ Observation-Constrained Global Surface Soil Moisture Using Random Forest Model
Zhang, L., Zeng, Y., Zhuang, R., Szabó, B., Manfreda, S., Han, Q., & Su, Z. (2021) · Remote Sensing · doi:10.3390/rs13234893 · Cited by 68
Qiu, T., Andrus, R. A., Acuña, M. A., Ascoli, D., Bergeron, Y., Berretti, R., Berveiller, D., Bogdziewicz, M., Boivin, T., Bonal, R., et al. (2022) · Nature Communications · doi:10.1038/s41467-022-30037-9 · Cited by 80
Divergent data-driven estimates of global soil respiration
Hashimoto, S., Ito, A., & Nishina, K. (2023) · Communications Earth & Environment · doi:10.1038/s43247-023-01136-2 · Cited by 81
Global patterns of soil heterotrophic respiration – A meta-analysis of available dataset
Tang, X., Du, J., Shi, Y., Lei, N., Chen, G., Cao, L., & Pei, X. (2020) · CATENA · doi:10.1016/j.catena.2020.104574 · Cited by 71
Marondedze, A. K., & Schütt, B. (2020) · Sustainability · doi:10.3390/su12208531 · Cited by 76
“Therefore, the K factor was estimated using the ISRIC (International Soil Reference Information Centre)-World Soil Information data [78], following the equation by [79].”
MethodSchürz, C., Mehdi, B., Kiesel, J., Schulz, K., & Herrnegger, M. (2020) · Hydrology and earth system sciences · doi:10.5194/hess-24-4463-2020 · Cited by 66
Kougioumoutzis, K., Kokkoris, I. P., Panitsa, M., Trigas, P., Strid, A., & Dimopoulos, P. (2020) · Diversity · doi:10.3390/d12070270 · Cited by 77
“Seven soil variables providing predicted values for the surface soil layer at varying depths were obtained from the SoilGrids database [32].”
MethodAgricultural land-use change alters the structure and diversity of Amazon riparian forests
Maracahipes‐Santos, L., Silvério, D. V., Macedo, M. N., Maracahipes, L., Jankowski, K. J., Paolucci, L. N., Neill, C., & Brando, P. M. (2020) · Biological Conservation · doi:10.1016/j.biocon.2020.108862 · Cited by 72
High resolution middle eastern soil attributes mapping via open data and cloud computing
Poppiel, R. R., Demattê, J. A. M., Rosin, N. A., Campos, L. R., Tayebi, M., Bonfatti, B. R., Ayoubi, S., Tajik, S., Afshar, F. A., Jafari, A., et al. (2020) · Geoderma · doi:10.1016/j.geoderma.2020.114890 · Cited by 72
Zappa, L., Schlaffer, S., Bauer-Marschallinger, B., Nendel, C., Zimmerman, B., & Dorigo, W. A. (2021) · Remote Sensing · doi:10.3390/rs13091727 · Cited by 75
Self-citationXie, B., Ding, J., Ge, X., Li, X., Han, L., & Wang, Z. (2022) · Sensors · doi:10.3390/s22072685 · Cited by 71
Shi, P., Six, J., Sila, A., Vanlauwe, B., & Oost, K. V. (2022) · ISPRS Journal of Photogrammetry and Remote Sensing · doi:10.1016/j.isprsjprs.2022.09.013 · Cited by 66
Azizi, K., Garosi, Y., Ayoubi, S., & Tajik, S. (2023) · Soil and Tillage Research · doi:10.1016/j.still.2023.105681 · Cited by 71
Agricultural emissions reduction potential by improving technical efficiency in crop production
Khatri‐Chhetri, A., Sapkota, T. B., Maharjan, S., Konath, N. C., & Shirsath, P. (2023) · Agricultural Systems · doi:10.1016/j.agsy.2023.103620 · Cited by 71
A benchmark dataset and workflow for landslide susceptibility zonation
Alvioli, M., Loche, M., Jacobs, L., Grohmann, C. H., Abraham, M. T., Gupta, K., Satyam, N. D., Scaringi, G., Bornaetxea, T., Rossi, M., et al. (2024) · Earth-Science Reviews · doi:10.1016/j.earscirev.2024.104927 · Cited by 75
“Depth to bedrock, bulk density, percentage weight of clay, sand and silt particles are from Hengl et al. (2017).”
Spatial and temporal trends of soil total nitrogen and C/N ratio for croplands of East China
Deng, X., Ma, W., Ren, Z., Zhang, M., Grieneisen, M. L., Chen, X., Fei, X., Qin, F., Zhan, Y., & Lv, X. (2019) · Geoderma · doi:10.1016/j.geoderma.2019.114035 · Cited by 71
Mapping monthly population distribution and variation at 1-km resolution across China
Cheng, Z., Wang, J., & Ge, Y. (2020) · International Journal of Geographical Information Systems · doi:10.1080/13658816.2020.1854767 · Cited by 69
“2015, Hengl et al .”
Performance of linear mixed models and random forests for spatial prediction of soil pH
Makungwe, M., Chabala, L. M., Chishala, B. H., & Lark, R. M. (2021) · Geoderma · doi:10.1016/j.geoderma.2021.115079 · Cited by 68
Naimi, S., Ayoubi, S., Zeraatpisheh, M., & Demattê, J. A. M. (2021) · Remote Sensing · doi:10.3390/rs13234825 · Cited by 65
A deep neural network based SMAP soil moisture product
Gao, L., Gao, Q., Zhang, H. K., Li, X., Chaubell, J., Ebtehaj, A. M., Shen, L., & Wigneron, J. (2022) · Remote Sensing of Environment · doi:10.1016/j.rse.2022.113059 · Cited by 72
Nayak, H. S., Silva, . V., Parihar, C. M., Krupnik, T. J., Sena, D. R., Kakraliya, S. K., Jat, H. S., Sidhu, H. S., Sharma, P. C., Jat, M. L., et al. (2022) · Field Crops Research · doi:10.1016/j.fcr.2022.108640 · Cited by 79
Integrating scientific knowledge into machine learning using interactive decision trees
Sarailidis, G., Wagener, T., & Pianosi, F. (2022) · Computers & Geosciences · doi:10.1016/j.cageo.2022.105248 · Cited by 73
Xia, Z., Li, Y., Guo, S., Chen, R., Zhang, W., Guo, X., Zhang, X., & Du, P. (2024) · Earth s Future · doi:10.1029/2024ef004427 · Cited by 81
“The dryland soil information was characterized by 11 relevant variables (Coarse fragments, bulk density, soil organic carbon, etc.) at six standard depths (0–5, 5–15, 15–30 cm, etc.) obtained from the SoilGrids250 m database in a 250 m spatial resolution (Hengl et al., 2017).”
MethodFungal Necromass Carbon Dominates Global Soil Organic Carbon Storage
Fu, H., Chen, H., Ma, Z., Liang, G., Chadwick, D. R., Jones, D. L., Wanek, W., Wu, L., & Ma, Q. (2025) · Global Change Biology · doi:10.1111/gcb.70413 · Cited by 79
“Soil properties including soil pH, SOC, TN, and clay content were derived from the SoilGrids database (Hengl et al. 2017).”
Mapping topsoil organic carbon concentrations and stocks for Tanzania
Kempen, B., Dalsgaard, S., Kaaya, A. K., Chamuya, N., González, M. R., Pekkarinen, A., & Walsh, M. (2018) · Geoderma · doi:10.1016/j.geoderma.2018.09.011 · Cited by 65
Self-citationMcNicol, G., Bulmer, C., D’Amore, D. V., Sanborn, P. T., Saunders, S. C., Giesbrecht, I., Arriola, S. G. G., Bidlack, A. L., Butman, D., & Buma, B. J. (2018) · Environmental Research Letters · doi:10.1088/1748-9326/aaed52 · Cited by 68
“For example, Sanderman et al (2018b) compiled mangrove SOC stock measurements and used them in conjunction with a global SOC map (Hengl et al 2017) and maps of environmental covariates to estimate global mangrove SOC at 30 m resolution.”
BackgroundMethodInfluentialTziolas, N. V., Tsakiridis, N., Ben‐Dor, E., Theocharis, J. B., & Zalidis, G. C. (2020) · Remote Sensing · doi:10.3390/rs12091389 · Cited by 70
“This is further supported by novel machine learning algorithms for the spatial estimations of soil properties from spaceborne-sourced environmental covariates and harmonized soil observations [4].”
BackgroundSundert, K. V., Radujković, D., Cools, N., Vos, B. D., Etzold, S., Fernández‐Martínez, M., Janssens, I. A., Merilä, P., Peñuelas, J., Sardans, J., et al. (2019) · Global Change Biology · doi:10.1111/gcb.14802 · Cited by 70
Knoben, W. J. M., Clark, M., Bales, J. D., Bennett, A. R., Gharari, S., Marsh, C. B., Nijssen, B., Pietroniro, A., Spiteri, R. J., Tarboton, D. G., et al. (2022) · Water Resources Research · doi:10.1029/2021wr031753 · Cited by 72
“There is no systematic over or under prediction of these properties, but large differences between estimates and observations exist nonetheless in certain cases (Hengl et al., 2017).”
BackgroundMethodInfluentialWan, L., Liu, G., Sun, J. L., Ma, J., Cheng, H. L., Yu, S., Du, C., & Su, X. (2024) · The Science of The Total Environment · doi:10.1016/j.scitotenv.2024.172006 · Cited by 66
Shifaw, E., Sha, J., Li, X., Bao, Z., Ji, J., Ji, Z., Kassaye, A. Y., Lai, S., & Yang, Y. (2024) · The Science of The Total Environment · doi:10.1016/j.scitotenv.2024.173524 · Cited by 64
A new look at soil phenoforms – Definition, identification, mapping
Rossiter, D. G., & Bouma, J. (2017) · Geoderma · doi:10.1016/j.geoderma.2017.11.002 · Cited by 68
“…but on a grid cell basis (McBratney et al., 2003): each cell is classified with the name of the dominant soil class, and in addition information may be given about other classes present in the cell and their relative proportions, or the probability of occurrence of each class (Hengl et al., 2017).”
BackgroundCaubet, M., Dobarco, M. R., Arrouays, D., Minasny, B., & Saby, N. (2018) · Geoderma · doi:10.1016/j.geoderma.2018.09.007 · Cited by 67
National soil organic carbon estimates can improve global estimates
Vitharana, U. W. A., Mishra, U., & Mapa, R. B. (2018) · Geoderma · doi:10.1016/j.geoderma.2018.09.005 · Cited by 67
Projected changes in Rhine River flood seasonality under global warming
Rottler, E., Bronstert, A., Bürger, G., & Rakovec, O. (2021) · Hydrology and earth system sciences · doi:10.5194/hess-25-2353-2021 · Cited by 69
Kraft, B., Jung, M., Körner, M., & Reichstein, M. (2020) · The international archives of the photogrammetry, remote sensing and spatial information sciences/International archives of the photogrammetry, remote sensing and spatial information sciences · doi:10.5194/isprs-archives-xliii-b2-2020-1537-2020 · Cited by 73
“Furthermore, we used variables from the soilgrids dataset (Hengl et al., 2017): absolute depth to bedrock and the average across all soil layers of bulk density, coarse fragments, clay, silt, and sand content.”
MethodDigital mapping of zinc in urban topsoil using multisource geospatial data and random forest
Shi, T., Hu, X., Guo, L., Su, F., Tu, W., Hu, Z., Liu, H., Yang, C., Wang, J., Zhang, J., et al. (2021) · The Science of The Total Environment · doi:10.1016/j.scitotenv.2021.148455 · Cited by 67
Vegetation greening partly offsets the water erosion risk in China from 1999 to 2018
Wang, H., Zhao, W., Li, C., & Pereira, P. A. D. S. (2021) · Geoderma · doi:10.1016/j.geoderma.2021.115319 · Cited by 65
Quantifying N leaching losses as a function of N balance: A path to sustainable food supply chains
Tamagno, S., Eagle, A. J., McLellan, E. L., van Kessel, C., Linquist, B. A., Ladha, J. K., & Pittelkow, C. M. (2021) · Agriculture Ecosystems & Environment · doi:10.1016/j.agee.2021.107714 · Cited by 73
Montzka, C., Rötzer, K., Bogena, H., Sánchez, N., & Vereecken, H. (2018) · Remote Sensing · doi:10.3390/rs10030427 · Cited by 66
“, the SoilGrids data sets at a 1 km [89] and 250 m [90] resolution, respectively.”
MethodResultDry‐Season Greening and Water Stress in Amazonia: The Role of Modeling Leaf Phenology
Manoli, G., Ivanov, V. Y., & Fatichi, S. (2018) · Journal of Geophysical Research Biogeosciences · doi:10.1029/2017jg004282 · Cited by 72
“obtained for the site or retrieved from the SoilGrids250m database (Hengl et al., 2017), using the pedotrans-”
Towards Estimating Land Evaporation at Field Scales Using GLEAM
Martens, B., de Jeu, R., Verhoest, N. E. C., Schuurmans, H., Kleijer, J., & Miralles, D. G. (2018) · Remote Sensing · doi:10.3390/rs10111720 · Cited by 66
“Soil properties are obtained from the SoilGrids250m dataset [61] and land cover fractions from the MODIS MOD44B product [62], both available at 250 m resolution.”
BackgroundMethodModel averaging for mapping topsoil organic carbon in France
Chen, S., Mulder, V. L., Heuvelink, G. B. M., Poggio, L., Caubet, M., Dobarco, M. R., Walter, C. A., & Arrouays, D. (2020) · Geoderma · doi:10.1016/j.geoderma.2020.114237 · Cited by 67
Self-citationVionnet, V., Fortin, V., Gaborit, É., Roy, G., Abrahamowicz, M., Gasset, N., & Pomeroy, J. W. (2020) · Hydrology and earth system sciences · doi:10.5194/hess-24-2141-2020 · Cited by 63
Environmental drivers of soil phosphorus composition in natural ecosystems
Deiss, L., de MORAES, A., & Maire, V. (2018) · Biogeosciences · doi:10.5194/bg-15-4575-2018 · Cited by 65
Metadata
- Authors
- Hengl, T., Mendes de Jesus, J., Heuvelink, G. B. M., Ruiperez Gonzalez, M., Kilibarda, M., Blagotić, A., Shangguan, W., Wright, M. N., Geng, X., Bauer-Marschallinger, B., Guevara, M. A., Vargas, R., MacMillan, R. A., Batjes, N. H., Leenaars, J. G. B., Ribeiro, E., Wheeler, I., Mantel, S., & Kempen, B.
- Affiliations
- ISRIC - World Soil Information (NL)
- University of Belgrade (RS)
- Sun Yat-sen University (CN)
- University of Lübeck (DE)
- Agriculture and Agri-Food Canada (CA)
- TU Wien (AT)
- University of Delaware (US)
- ORCID
- Venue
- PLOS ONE
- Publisher
- Public Library of Science (PLoS)
- Published
- 2017-02-16
- Volume
- 12
- Issue
- 2
- Pages
- e0169748
- ISSN
- 1932-6203 (ISSN-L)
- PMC
- PMC5313206
- OpenAlex
- W2588003345
- Cited by
- 4,733
- References
- 89
- Citations by year
- 2026: 591 · 2025: 654 · 2024: 610 · 2023: 634 · 2022: 669 · 2021: 672 · 2020: 402 · 2019: 265 · 2018: 173 · 2017: 56
- FWCI
- 137.14
- Type
- journal article
- Language
- en
- Open access
- gold
- doi.org
- Licence
- Locations
- PLoS ONE (publishedVersion, cc-by)
- PubMed Central (publishedVersion, cc-by)
- PubMed (publishedVersion)
- RePEc: Research Papers in Economics (submittedVersion)
- DOAJ (DOAJ: Directory of Open Access Journals) (submittedVersion)
- GraFar (University of Belgrade, Faculty of Civil Engineering) (submittedVersion, cc-by)
- Socio-Environmental Systems Modeling (submittedVersion, cc-by)
- Data Archiving and Networked Services (DANS) (submittedVersion, other-oa)
- Topics
- Life Sciences › Agricultural and Biological Sciences › Soil Science › Soil Geostatistics and Mapping
- Physical Sciences › Environmental Science › Environmental Engineering › Soil Moisture and Remote Sensing
- Physical Sciences › Environmental Science › Management, Monitoring, Policy and Law › Soil and Land Suitability Analysis
- Keywords
- SoilGrids, soil properties, soil organic carbon, soil bulk density, cation exchange capacity, soil pH, soil texture, coarse fragments, bedrock depth, soil classification, USDA soil classification, MODIS, random forest, gradient boosting, multinomial logistic regression, ensemble learning, accuracy assessment, soil mapping
- MeSH terms
- Machine Learning, Algorithms, Conservation of Natural Resources, Environmental Monitoring, Humans, Models, Theoretical, Soil, Geographic Information Systems
About these checks
Registry, retraction, Cites and statistics results are computed, not judged, with one exception: a printed reference that no index lists is read once by a model before it counts as a citation error. Claims are extracted by a model and kept only when their quote appears verbatim in the text; each cited source is then checked, with a model’s help, for whether it says what the claim relies on. Those verdicts can be wrong — read the claim’s quote and the cited source before relying on one.
Statistics and arithmetic are recomputed, not judged.
Confidence bands are shown only for fields calibrated on our annotated test set. None is calibrated yet, so no band is shown.
What counts as a claim ›How we measure confidence ›How we check this ›
Are you an author, or do you see a problem with this page? Request a review
Data sources
Bibliographic data: Semantic Scholar, OpenAlex, Crossref.
Contains information from the Semantic Scholar Academic Graph Datasets, made available under the ODC Attribution License (ODC-BY 1.0).
Semantic Scholar’s data is described in: Kinney, R., et al. (2023). The Semantic Scholar Open Data Platform. arXiv:2301.10140.
