

The DOI matches its Crossref record; 91 of the 91 references it cites were found in a registry or an index.
Differentiation and Characterization of Excitatory and Inhibitory Synapses by Cryo-electron Tomography and Correlative Microscopy
Open accessAbstract
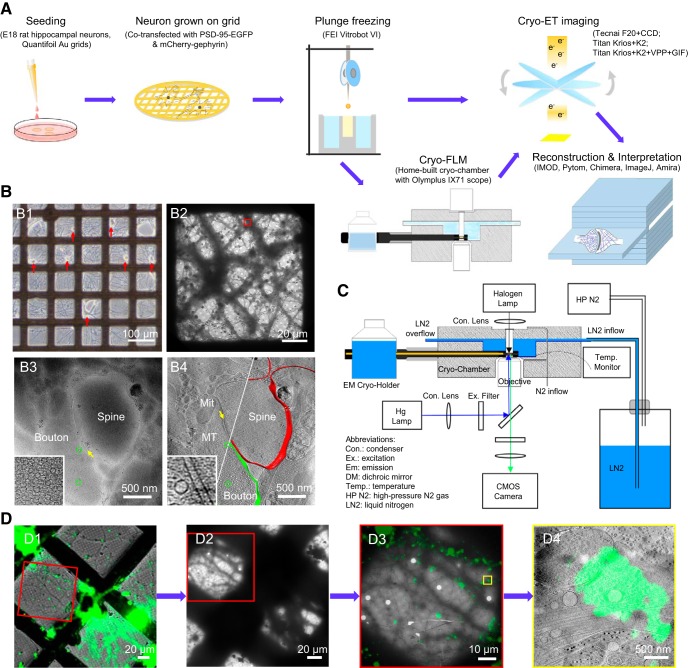
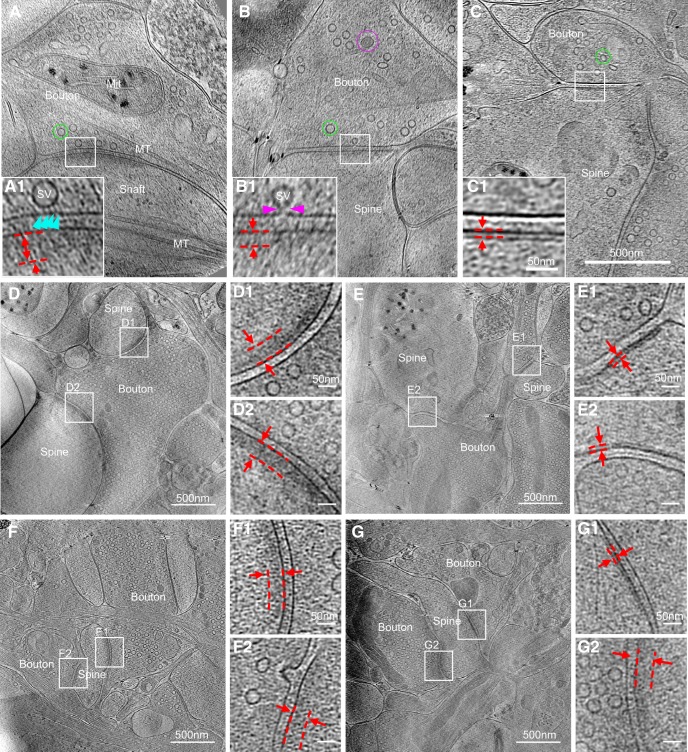
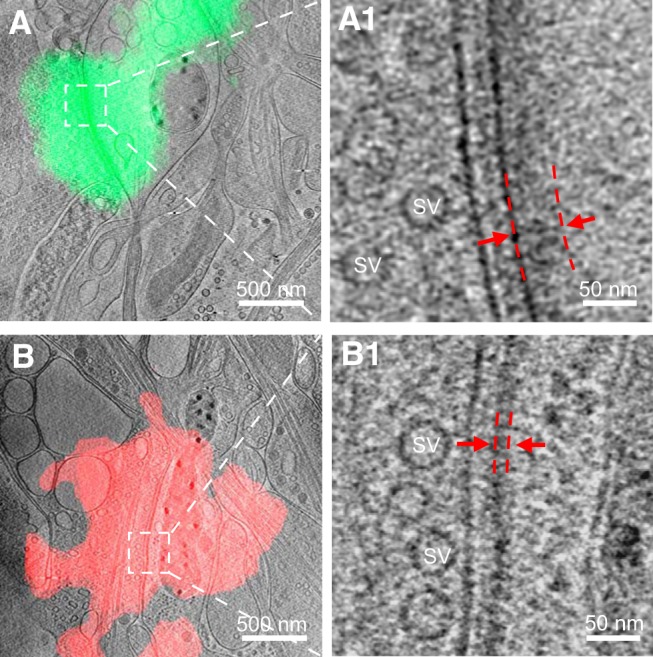
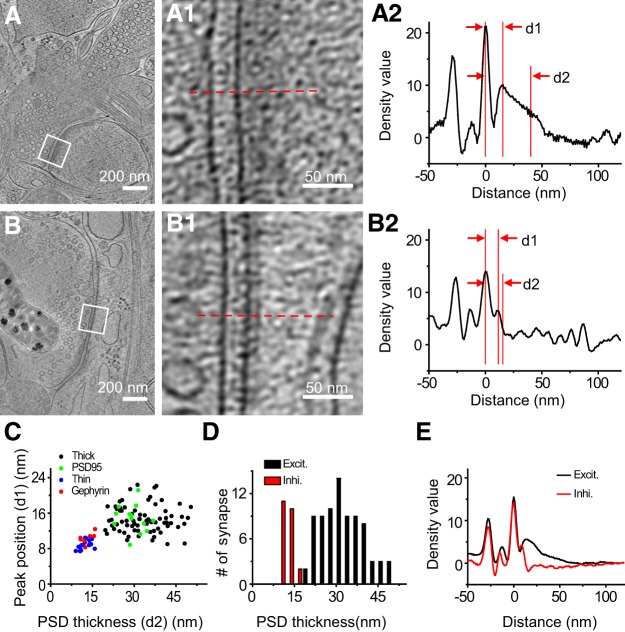
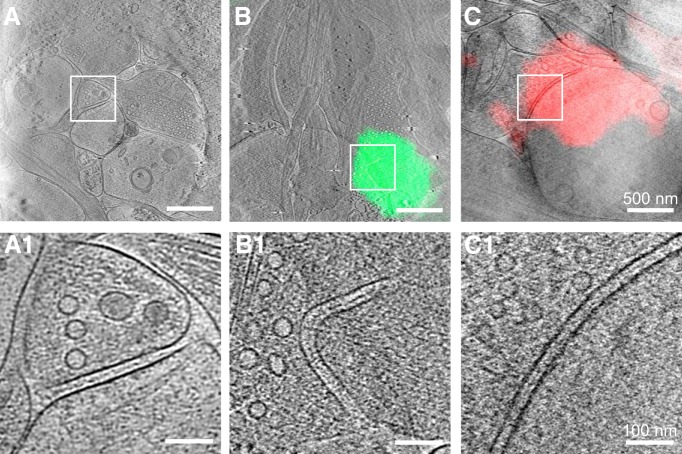
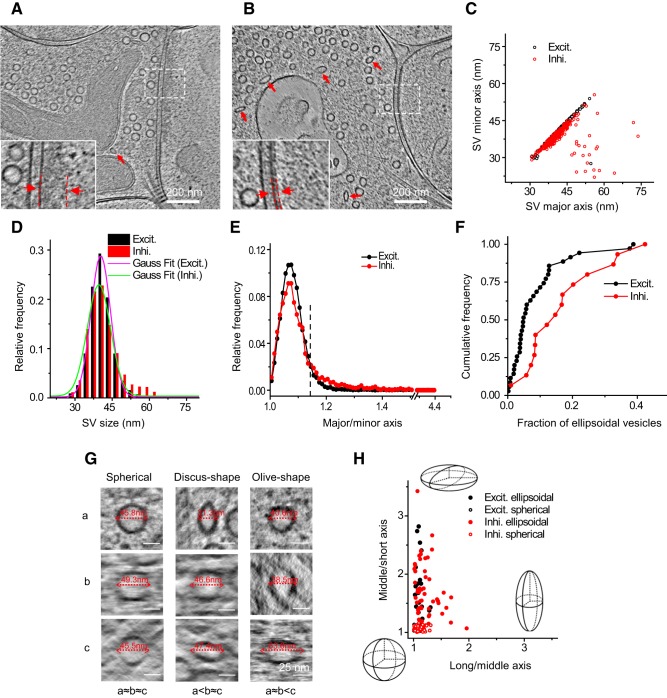
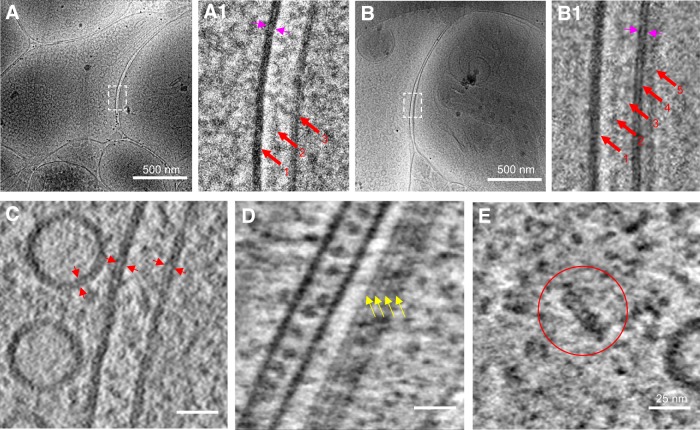
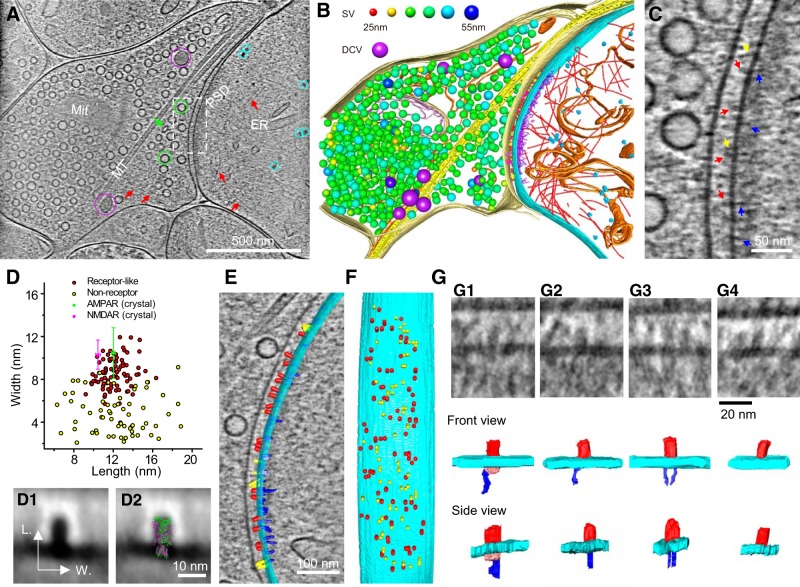
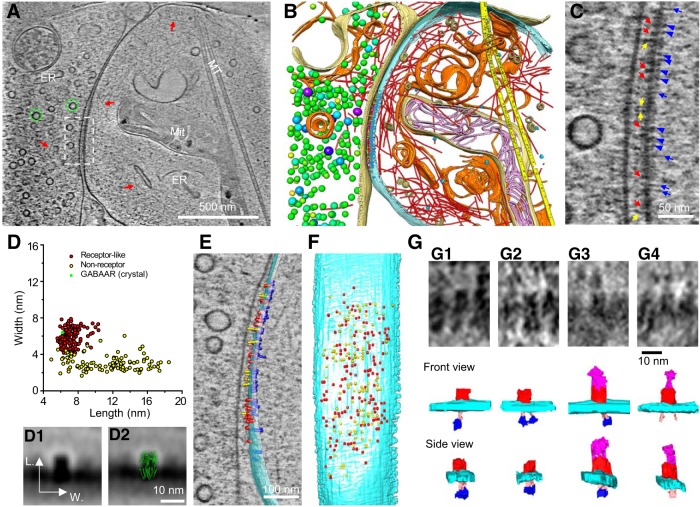
As key functional units in neural circuits, different types of neuronal synapses play distinct roles in brain information processing, learning, and memory. Synaptic abnormalities are believed to underlie various neurological and psychiatric disorders. Here, by combining cryo-electron tomography and cryo-correlative light and electron microscopy, we distinguished intact excitatory and inhibitory synapses of cultured hippocampal neurons, and visualized the in situ 3D organization of synaptic organelles and macromolecules in their native state. Quantitative analyses of >100 synaptic tomograms reveal that excitatory synapses contain a mesh-like postsynaptic density (PSD) with thickness ranging from 20 to 50 nm. In contrast, the PSD in inhibitory synapses assumes a thin sheet-like structure ∼12 nm from the postsynaptic membrane. On the presynaptic side, spherical synaptic vesicles (SVs) of 25–60 nm diameter and discus-shaped ellipsoidal SVs of various sizes coexist in both synaptic types, with more ellipsoidal ones in inhibitory synapses. High-resolution tomograms obtained using a Volta phase plate and electron filtering and counting reveal glutamate receptor-like and GABA A receptor-like structures that interact with putative scaffolding and adhesion molecules, reflecting details of receptor anchoring and PSD organization. These results provide an updated view of the ultrastructure of excitatory and inhibitory synapses, and demonstrate the potential of our approach to gain insight into the organizational principles of cellular architecture underlying distinct synaptic functions. SIGNIFICANCE STATEMENT To understand functional properties of neuronal synapses, it is desirable to analyze their structure at molecular resolution. We have developed an integrative approach combining cryo-electron tomography and correlative fluorescence microscopy to visualize 3D ultrastructural features of intact excitatory and inhibitory synapses in their native state. Our approach shows that inhibitory synapses contain uniform thin sheet-like postsynaptic densities (PSDs), while excitatory synapses contain previously known mesh-like PSDs. We discovered “discus-shaped” ellipsoidal synaptic vesicles, and their distributions along with regular spherical vesicles in synaptic types are characterized. High-resolution tomograms further allowed identification of putative neurotransmitter receptors and their heterogeneous interaction with synaptic scaffolding proteins. The specificity and resolution of our approach enables precise in situ analysis of ultrastructural organization underlying distinct synaptic functions.
Overview
The claims and statistics of this paper haven’t been checked yet.
Run the check — free, no account needed. It reads the open-access text and checks the sources it cites.
Integrity signals
Registry
Cites
Statistics
Figures
Verification
Claims the paper makes
The claims and statistics of this paper haven’t been checked yet.
Run the check — free, no account needed. It reads the open-access text and checks the sources it cites.
Claims other papers make about this one
Each is checked against this paper’s own text: does it say what the citing paper says it does?
The cited source says what the claim attributes to it.
In the citing paper
“In vertebrate EM datasets, human annotators can see differences in the vesicles for excitatory and inhibitory synapses.16,35,36,37,109,110”
From Neurotransmitter classification from electron microscopy images at synaptic sites in Drosophila melanogaster (2024) · cites this paper as [36]
Self-check
Percentages, sums and reported differences re-computed from the paper’s own numbers.
The self-check needs the paper’s full text.
Citations
Cites
UCSF Chimera—A visualization system for exploratory research and analysis
Pettersen, E. F., Goddard, T. D., Huang, C. C., Couch, G. S., Greenblatt, D. M., Meng, E. C., & Ferrin, T. E. (2004) · Journal of Computational Chemistry · doi:10.1002/jcc.20084 · Cited by 46,047
Shrestha, S., & Offer, S. M. (2016) · Medical Epigenetics · doi:10.1159/000444713 · Cited by 8,951
Computer Visualization of Three-Dimensional Image Data Using IMOD
Kremer, J. R., Mastronarde, D. N., & McIntosh, J. R. (1996) · Journal of Structural Biology · doi:10.1006/jsbi.1996.0013 · Cited by 5,530
Automated electron microscope tomography using robust prediction of specimen movements
Mastronarde, D. N. (2005) · Journal of Structural Biology · doi:10.1016/j.jsb.2005.07.007 · Cited by 5,136
Bi, G.-Q., & Poo, M.-M. (1998) · The Journal of Neuroscience · doi:10.1523/jneurosci.18-24-10464.1998 · Cited by 4,744
Self-citationDirect Least Square Fitting of Ellipses
Fitzgibbon, A., Pilu, M., & Fisher, R. B. (1999) · IEEE Transactions on Pattern Analysis and Machine Intelligence · doi:10.1109/34.765658 · Cited by 2,797
Ginsborg, B. L. (1964) · Quarterly Journal of Experimental Physiology and Cognate Medical Sciences · doi:10.1113/expphysiol.1964.sp001756 · Cited by 1,917
Li, X.-M., Mooney, P., Zheng, S., Booth, C., Braunfeld, M. B., Gubbens, S., Agard, D., & Cheng, Y.-F. (2013) · Nature Methods · doi:10.1038/nmeth.2472 · Cited by 1,866
Axo-somatic and axo-dendritic synapses of the cerebral cortex: an electron microscope study.
Eg, G. (1959) · PubMed · Cited by 1,768
Automated molecular microscopy: The new Leginon system
Suloway, C. J. M., Pulokas, J., Fellmann, D., Cheng, A., Guerra, F., Quispe, J. D., Stagg, S. M., Potter, C. S., & Carragher, B. O. (2005) · Journal of Structural Biology · doi:10.1016/j.jsb.2005.03.010 · Cited by 1,695
Synaptic Modification by Correlated Activity: Hebb's Postulate Revisited
Bi, G., & Poo, M. (2001) · Annual Review of Neuroscience · doi:10.1146/annurev.neuro.24.1.139 · Cited by 1,525
Self-citationEccles, J. C. (1964) · Springer eBooks · doi:10.1007/978-3-642-64950-9 · Cited by 1,486
Cognitive Neuroscience and the Study of Memory
Milner, B. A., Squire, L. R., & Kandel, E. R. (1998) · Neuron · doi:10.1016/s0896-6273(00)80987-3 · Cited by 1,335
Heterogeneity of release probability, facilitation, and depletion at central synapses
Dobrunz, L. E., & Stevens, C. F. (1997) · Neuron · doi:10.1016/s0896-6273(00)80338-4 · Cited by 1,183
Südhof, T. C. (2012) · Neuron · doi:10.1016/j.neuron.2012.06.012 · Cited by 1,062 · cited 2×
“Chemical synapses are basic functional units in neural circuits for information transmission, processing, and storage (Eccles, 1964; Südhof and Malenka, 2008; Mayford et al., 2012).”
BackgroundThe Postsynaptic Architecture of Excitatory Synapses: A More Quantitative View
Sheng, M., & Hoogenraad, C. C. (2007) · Annual Review of Biochemistry · doi:10.1146/annurev.biochem.76.060805.160029 · Cited by 1,003
Quantitative ultrastructural analysis of hippocampal excitatory synapses
Schikorski, T., & Stevens, C. F. (1997) · The Journal of Neuroscience · doi:10.1523/jneurosci.17-15-05858.1997 · Cited by 997
Megı́as, M., Emri, Z., Freund, T. F., & Gulyás, A. I. (2001) · Neuroscience · doi:10.1016/s0306-4522(00)00496-6 · Cited by 950
Colonnier, M. (1968) · Brain Research · doi:10.1016/0006-8993(68)90234-5 · Cited by 946
Characteristics of Excitatory and Inhibitory Synapses in the Central Nervous System of the Cat
UCHIZONO, K. (1965) · Nature · doi:10.1038/207642a0 · Cited by 917
Cell Type and Pathway Dependence of Synaptic AMPA Receptor Number and Variability in the Hippocampus
Nusser, Z., Lujan, R., Laube, G., Roberts, J. D. B., Molnar, E., & Somogyi, P. (1998) · Neuron · doi:10.1016/s0896-6273(00)80565-6 · Cited by 804
Composition of isolated synaptic boutons reveals the amounts of vesicle trafficking proteins
Wilhelm, B. G., Mandad, S., Truckenbrodt, S., Kröhnert, K., Schäfer, C., Rammner, B., Koo, S. J., Claßen, G. A., Krauss, M., Haucke, V., et al. (2014) · Science · doi:10.1126/science.1252884 · Cited by 770
Superresolution Imaging of Chemical Synapses in the Brain
Dani, A., Huang, B., Bergan, J. F., Dulac, C. G., & Zhuang, X. (2010) · Neuron · doi:10.1016/j.neuron.2010.11.021 · Cited by 748
Crystal structure of a human GABAA receptor
Miller, P. S., & Aricescu, A. R. (2014) · Nature · doi:10.1038/nature13293 · Cited by 734
Optogenetic interrogation of neural circuits: technology for probing mammalian brain structures
Zhang, F., Gradinaru, V., Adamantidis, A. R., Durand, R., Airan, R. D., de Lecea, L., & Deisseroth, K. (2010) · Nature Protocols · doi:10.1038/nprot.2009.226 · Cited by 692
Different modes of expression of AMPA and NMDA receptors in hippocampal synapses
Takumi, Y., Ramírez-León, V., Laake, P., Rinvik, E., & Ottersen, O. P. (1999) · Nature Neuroscience · doi:10.1038/10172 · Cited by 675
Zeng, M., Shang, Y., Araki, Y., Guo, T., Huganir, R. L., & Zhang, M. (2016) · Cell · doi:10.1016/j.cell.2016.07.008 · Cited by 612
Ultrafast endocytosis at mouse hippocampal synapses
Watanabe, S., Rost, B. R., Camacho-Pérez, M., Davis, M. W., Söhl-Kielczynski, B., Rosenmund, C., & Jorgensen, E. M. (2013) · Nature · doi:10.1038/nature12809 · Cited by 607
Cascade Models of Synaptically Stored Memories
Fusi, S., Drew, P. J., & Abbott, L. F. (2005) · Neuron · doi:10.1016/j.neuron.2005.02.001 · Cited by 569
NMDA receptor structures reveal subunit arrangement and pore architecture
Lee, C.-H., Lü, W., Michel, J. J. C., Goehring, A. S., Du, J., Song, X., & Gouaux, E. (2014) · Nature · doi:10.1038/nature13548 · Cited by 538
Morphological correlates of functionally defined synaptic vesicle populations
Schikorski, T., & Stevens, C. F. (2001) · Nature Neuroscience · doi:10.1038/86042 · Cited by 516
Mayford, M., Siegelbaum, S. A., & Kandel, E. R. (2012) · Cold Spring Harbor Perspectives in Biology · doi:10.1101/cshperspect.a005751 · Cited by 500
Volta potential phase plate for in-focus phase contrast transmission electron microscopy
Danev, R., Buijsse, B., Khoshouei, M., Plitzko, J. M., & Baumeister, W. P. (2014) · Proceedings of the National Academy of Sciences · doi:10.1073/pnas.1418377111 · Cited by 488
Nusser, Z., Hájos, N., Somogyi, P., & Mody, I. (1998) · Nature · doi:10.1038/25999 · Cited by 483
Ultrastructure of Synapses in the Mammalian BrainPreprint
Harris, K. M., & Weinberg, R. J. (2012) · Cold Spring Harbor Perspectives in Biology · doi:10.1101/cshperspect.a005587 · Cited by 452
Differences in Synaptic GABAA Receptor Number Underlie Variation in GABA Mini Amplitude
Nusser, Z., Cull-Candy, S., & Farrant, M. (1997) · Neuron · doi:10.1016/s0896-6273(00)80382-7 · Cited by 449
Gephyrin: a master regulator of neuronal function?
Tyagarajan, S. K., & Fritschy, J. (2014) · Nature reviews. Neuroscience · doi:10.1038/nrn3670 · Cited by 442
Phillips, G. R., Huang, J. K., Wang, Y., Tanaka, H., Shapiro, L. S., Zhang, W., Shan, W., Arndt, K., Frank, M., Gordon, R. E., et al. (2001) · Neuron · doi:10.1016/s0896-6273(01)00450-0 · Cited by 438
Ultrastructural analysis of adult mouse neocortex comparing aldehyde perfusion with cryo fixation
Korogod, N., Petersen, C. C., & Knott, G. W. (2015) · eLife · doi:10.7554/elife.05793 · Cited by 408
The Morphological and Molecular Nature of Synaptic Vesicle Priming at Presynaptic Active Zones
Imig, C., Min, S.-W., Krinner, S., Arancillo, M., Rosenmund, C., Südhof, T. C., Rhee, J., Brose, N., & Cooper, B. H. (2014) · Neuron · doi:10.1016/j.neuron.2014.10.009 · Cited by 389
Gating multiple signals through detailed balance of excitation and inhibition in spiking networks
Vogels, T. P., & Abbott, L. F. (2009) · Nature Neuroscience · doi:10.1038/nn.2276 · Cited by 375
Three-Dimensional Architecture of Presynaptic Terminal Cytomatrix
Siksou, L., Rostaing, P., Lechaire, J., Boudier, T., Ohtsuka, T., Fejtová, A., Kao, H., Greengard, P., Gundelfinger, E. D., Triller, A., et al. (2007) · Journal of Neuroscience · doi:10.1523/jneurosci.1773-07.2007 · Cited by 340
Plasma Membrane Reshaping during Endocytosis Is Revealed by Time-Resolved Electron Tomography
Kukulski, W., Schorb, M., Kaksonen, M., & Briggs, J. A. G. (2012) · Cell · doi:10.1016/j.cell.2012.05.046 · Cited by 328
PSD-95 Is Required to Sustain the Molecular Organization of the Postsynaptic Density
Chen, X., Nelson, C. D., Li, X., Winters, C. A., Azzam, R. N., Sousa, A. A., Leapman, R. D., Gainer, H., Sheng, M., & Reese, T. S. (2011) · Journal of Neuroscience · doi:10.1523/jneurosci.5968-10.2011 · Cited by 320
A molecular census of 26 S proteasomes in intact neurons
Asano, S. M., Fukuda, Y., Beck, F., Aufderheide, A., Förster, F. G., Danev, R., & Baumeister, W. P. (2015) · Science · doi:10.1126/science.1261197 · Cited by 310
Chen, X., Levy, J. M., Hou, A., Winters, C., Azzam, R., Sousa, A. A., Leapman, R. D., Nicoll, R. A., & Reese, T. S. (2015) · Proceedings of the National Academy of Sciences · doi:10.1073/pnas.1517045112 · Cited by 310
Laminar Organization of the NMDA Receptor Complex within the Postsynaptic Density
Valtschanoff, J. G., & Weinberg, R. J. (2001) · Journal of Neuroscience · doi:10.1523/jneurosci.21-04-01211.2001 · Cited by 301
Organization of the core structure of the postsynaptic density
Chen, X., Winters, C. A., Azzam, R. N., Li, X., Galbraith, J. A., Leapman, R. D., & Reese, T. S. (2008) · Proceedings of the National Academy of Sciences · doi:10.1073/pnas.0800897105 · Cited by 299
Spine loss and other dendritic abnormalities in epilepsy
Swann, J. W., Al‐Noori, S., Jiang, M., & Lee, C. L. (2000) · Hippocampus · doi:10.1002/1098-1063(2000)10:5 · Cited by 268
Quantitative analysis of the native presynaptic cytomatrix by cryoelectron tomography
Fernández-Busnadiego, R., Zuber, B., Maurer, U. E., Cyrklaff, M., Baumeister, W., & Lučić, V. (2010) · Journal of Cell Biology · doi:10.1083/jcb.200908082 · Cited by 267
Zuber, B., Nikonenko, I., Klauser, P., Müller, D., & Dubochet, J. (2005) · Proceedings of the National Academy of Sciences · doi:10.1073/pnas.0509527102 · Cited by 263
Hrabe, T., Chen, Y., Pfeffer, S., Cuellar, L. K., Mangold, A., & Förster, F. G. (2011) · Journal of Structural Biology · doi:10.1016/j.jsb.2011.12.003 · Cited by 261
Missler, M., Sudhof, T. C., & Biederer, T. (2012) · Cold Spring Harbor Perspectives in Biology · doi:10.1101/cshperspect.a005694 · Cited by 255
Nakagawa, T., Futai, K., Lashuel, H. A., Lo, I., Okamoto, K., Walz, T., Hayashi, Y., & Sheng, M. (2004) · Neuron · doi:10.1016/j.neuron.2004.10.012 · Cited by 250
Electron microscopy of excitatory and inhibitory synapses: a brief review
Gray, E. G. (1969) · Progress in Brain Research · doi:10.1016/s0079-6123(08)63235-5 · Cited by 228
Limits on the memory storage capacity of bounded synapses
Fusi, S., & Abbott, L. F. (2007) · Nature Neuroscience · doi:10.1038/nn1859 · Cited by 226
Peters, A., & Palay, S. L. (1996) · Journal of Neurocytology · doi:10.1007/bf02284835 · Cited by 209
Structure and Dynamics of AMPA Receptor GluA2 in Resting, Pre-Open, and Desensitized States
Dürr, K. L., Chen, L., Stein, R. A., Zorzi, R. D., Folea, I. M., Walz, T., Mchaourab, H. S., & Gouaux, E. (2014) · Cell · doi:10.1016/j.cell.2014.07.023 · Cited by 207
Understanding Synapses: Past, Present, and Future
Südhof, T. C., & Malenka, R. C. (2008) · Neuron · doi:10.1016/j.neuron.2008.10.011 · Cited by 207
Meyer, G. R. Y. D., Varoqueaux, F., Neeb, A., Oschlies, M., & Brose, N. (2004) · Neuropharmacology · doi:10.1016/j.neuropharm.2004.06.023 · Cited by 199
Neurexins Physically and Functionally Interact with GABAA Receptors
Zhang, C., Atasoy, D., Araç, D., Yang, X., Fucillo, M. V., Robison, A. J., Ko, J., Brünger, A. T., & Südhof, T. C. (2010) · Neuron · doi:10.1016/j.neuron.2010.04.008 · Cited by 191
Glutamate-induced transient modification of the postsynaptic density
Dosemeci, A., Tao-Cheng, J.-H., Vinade, L., Winters, C. A., Pozzo-Miller, L., & Reese, T. S. (2001) · Proceedings of the National Academy of Sciences · doi:10.1073/pnas.181336998 · Cited by 184 · cited 2×
“, 2016), and suggests the existence of multiple structural configurations, perhaps reflecting different states of their activation (Dosemeci et al., 2001) and plasticity (Bi and Poo, 1998; Montgomery and Madison, 2004).”
BackgroundThe Three-Dimensional Organization of Polyribosomes in Intact Human Cells
Brandt, F., Carlson, L. A., Hartl, F. U., Baumeister, W. P., & Grünewald, K. (2010) · Molecular Cell · doi:10.1016/j.molcel.2010.08.003 · Cited by 169
Discrete synaptic states define a major mechanism of synapse plasticity
Montgomery, J. M., & Madison, D. V. (2004) · Trends in Neurosciences · doi:10.1016/j.tins.2004.10.006 · Cited by 158
Analysis of synaptic ultrastructure without fixative using high‐pressure freezing and tomography
Rostaing, P., Réal, É., Siksou, L., Lechaire, J. P., Boudier, T., Boeckers, T. M., Gertler, F. B., Gundelfinger, E. D., Triller, A., & Marty, S. (2006) · European Journal of Neuroscience · doi:10.1111/j.1460-9568.2006.05234.x · Cited by 152
Molecular heterogeneity of central synapses: afferent and target regulation
Craig, A. M., & Boudin, H. (2001) · Nature Neuroscience · doi:10.1038/88388 · Cited by 142
Gephyrin, the enigmatic organizer at GABAergic synapses
Tretter, V. E., Mukherjee, J. T., Maric, H. M., Schindelin, H., Sieghart, W., & Moss, S. J. (2012) · Frontiers in Cellular Neuroscience · doi:10.3389/fncel.2012.00023 · Cited by 140
Electron cryotomography of vitrified cells with a Volta phase plate
Fukuda, Y., Laugks, U., Lučić, V., Baumeister, W. P., & Danev, R. (2015) · Journal of Structural Biology · doi:10.1016/j.jsb.2015.03.004 · Cited by 140
Schorb, M., & Briggs, J. A. G. (2014) · Ultramicroscopy · doi:10.1016/j.ultramic.2013.10.015 · Cited by 140
Topographic Mapping of the Synaptic Cleft into Adhesive Nanodomains
de Arce, K. P., Schrod, N., Metzbower, S. R., Allgeyer, E. S., Kong, G. K.-W., Tang, A., Krupp, A. J., Stein, V., Liu, X., Bewersdorf, J., et al. (2015) · Neuron · doi:10.1016/j.neuron.2015.11.011 · Cited by 133
Cryo–electron tomography reveals a critical role of RIM1α in synaptic vesicle tethering
Fernández‐Busnadiego, R., Asano, S. M., Oprişoreanu, A., Sakata, E., Doengi, M., Kochovski, Z., Zürner, M., Stein, V., Schoch, S., Baumeister, W. P., et al. (2013) · The Journal of Cell Biology · doi:10.1083/jcb.201206063 · Cited by 132
Three-dimensional super-resolution protein localization correlated with vitrified cellular context
Liu, B., Xue, Y., Zhao, W. M., Chen, Y., Fan, C., Gu, L., Zhang, Y., Zhang, X., Sun, L., Huang, X., et al. (2015) · Scientific Reports · doi:10.1038/srep13017 · Cited by 123
Astrocytes regulate heterogeneity of presynaptic strengths in hippocampal networks
Letellier, M., Park, Y. K., Chater, T. E., Chipman, P. H., Gautam, S. G., Oshima-Takago, T., & Goda, Y. (2016) · Proceedings of the National Academy of Sciences · doi:10.1073/pnas.1523717113 · Cited by 119
Multiscale imaging of neurons grown in culture: From light microscopy to cryo-electron tomography
Lučić, V., Kossel, A. H., Yang, T., Bonhoeffer, T., Baumeister, W. P., & Sartori-Rupp, A. (2007) · Journal of Structural Biology · doi:10.1016/j.jsb.2007.08.014 · Cited by 111
The future is cold: cryo-preparation methods for transmission electron microscopy of cells
Hurbain, I., & Sachse, M. (2011) · Biology of the Cell · doi:10.1042/bc20110015 · Cited by 107
Dobie, F. A., & Craig, A. M. (2011) · Journal of Neuroscience · doi:10.1523/jneurosci.6023-10.2011 · Cited by 89
Lowenthal, M. S., Markey, S. P., & Döṣemeci, A. (2015) · Journal of Proteome Research · doi:10.1021/acs.jproteome.5b00109 · Cited by 86
Electron tomographic analysis of synaptic ultrastructure
Burette, A. C., Lesperance, T., Crum, J., Martone, M., Volkmann, N., Ellisman, M. H., & Weinberg, R. J. (2012) · Journal of Comparative Neurology · doi:10.1002/cne.23067 · Cited by 85
Bourne, J. N., Chirillo, M. A., & Harris, K. M. (2013) · The Journal of Comparative Neurology · doi:10.1002/cne.23384 · Cited by 68
Energy-filtered transmission electron microscopy: an overview
Verbeeck, J., Dyck, D. V., & Tendeloo, G. V. (2004) · Spectrochimica Acta Part B Atomic Spectroscopy · doi:10.1016/j.sab.2004.03.020 · Cited by 58
Tatsuoka, H., & Reese, T. S. (1989) · The Journal of Comparative Neurology · doi:10.1002/cne.902900304 · Cited by 48
The gray area between synapse structure and function—Gray's synapse types I and II revisited
Klemann, C. J. H. M., & Roubos, E. W. (2011) · Synapse · doi:10.1002/syn.20962 · Cited by 47
Methods for Generating High-Resolution Structural Models from Electron Microscope Tomography Data
Ress, D. B., Harlow, M. L., Marshall, R. M., & McMahan, U. J. (2004) · Structure · doi:10.1016/j.str.2004.07.022 · Cited by 46
Three-dimensional structure of an AMPA receptor without associated stargazin/TARP proteins
Nakagawa, T., Cheng, Y., Sheng, M., & Walz, T. (2006) · Biological Chemistry · doi:10.1515/bc.2006.024 · Cited by 45
Variable priming of a docked synaptic vesicle
Jung, J. H., Szule, J. A., Marshall, R. M., & McMahan, U. J. (2016) · Proceedings of the National Academy of Sciences · doi:10.1073/pnas.1523054113 · Cited by 44
The organization of AMPA receptor subunits at the postsynaptic membrane
Jacob, A., & Weinberg, R. J. (2014) · Hippocampus · doi:10.1002/hipo.22404 · Cited by 43
Shi, L., Du, X., Zhou, H., Tao, C.-L., Liu, Y.-T., Meng, F., Wu, G., Xiong, Y., Xia, C., Wang, Y., et al. (2014) · The International Journal of Neuropsychopharmacology · doi:10.1017/s1461145714000601 · Cited by 40
Self-citationUnderstanding the Molecular Diversity of GABAergic Synapses
Sassoé‐Pognetto, M., Frola, E., Pregno, G., Briatore, F., & Patrizi, A. (2011) · Frontiers in Cellular Neuroscience · doi:10.3389/fncel.2011.00004 · Cited by 38
Dissection of active zones at the neuromuscular junction by EM tomography
Harlow, M. L., Ress, D. B., Koster, A. J., Marshall, R. M., Schwarz, M., & McMahan, U. J. (1998) · Journal of Physiology-Paris · doi:10.1016/s0928-4257(98)80141-1 · Cited by 21
Ultrastructural analysis of neuronal synapses using state-of-the-art nano-imaging techniques
Tao, C.-L., Xia, C., Chen, X., Zhou, Z., & Bi, G. (2012) · Neuroscience Bulletin · doi:10.1007/s12264-012-1249-z · Cited by 13
Self-citationCounting Gephyrins, One at a Time: A Nanoscale View on the Inhibitory Postsynapse
Heine, M., Karpova, A., & Gundelfinger, E. D. (2013) · Neuron · doi:10.1016/j.neuron.2013.07.004 · Cited by 3
Cited by
Sorted by citations
Tang, J., Yuan, F., Shen, X., Wang, Z., Rao, M., He, Y., Sun, Y., Li, X., Zhang, W., Li, Y., et al. (2019) · Advanced Materials · doi:10.1002/adma.201902761 · Cited by 850
Self-citationIsotropic reconstruction for electron tomography with deep learning
Liu, Y.-T., Zhang, H., Wang, H., Tao, C.-L., Bi, G., & Zhou, Z. H. (2022) · Nature Communications · doi:10.1038/s41467-022-33957-8 · Cited by 397
Self-citationEckstein, N., Bates, A. S., Champion, A., Du, M., Yin, Y., Schlegel, P., Lu, A. K.-Y., Rymer, T., Finley-May, S., Paterson, T., et al. (2024) · Cell · doi:10.1016/j.cell.2024.03.016 · Cited by 277
“Among clear core vesicle, human experts can distinguish excitatory and inhibitory transmitters by how elliptical their synaptic vesicles are (Tao et al., 2018; Atwood et al., 1972; Uchizono, 1965), though they have not yet to our knowledge been automatically predicted at scale in these species.”
Fluid Biomarkers for Synaptic Dysfunction and Loss
Camporesi, E., Nilsson, J., Brinkmalm, A., Becker, B., Ashton, N. J., Blennow, K., & Zetterberg, H. (2020) · Biomarker Insights · doi:10.1177/1177271920950319 · Cited by 165
MemBrain v2: an end-to-end tool for the analysis of membranes in cryo-electron tomography
Lamm, L., Zufferey, S., Zhang, H., Righetto, R. D., Waltz, F., Wietrzyñski, W., Yamauchi, K. A., Burt, A., Liu, Y., Martínez-Sánchez, A., et al. (2026) · Nature Methods · doi:10.1038/s41592-026-03178-8 · Cited by 179
Self-citation
Metadata
- Authors
- Tao, C.-L., Liu, Y.-T., Sun, R., Zhang, B., Qi, L., Shivakoti, S., Tian, C.-L., Zhang, P., Lau, P.-M., Zhou, Z. H., & Bi, G.-Q.
- Affiliations
- Chinese Academy of Sciences (CN)
- Centre for Human Genetics (GB)
- California NanoSystems Institute (US)
- University of Science and Technology of China (CN)
- Corresponding author
- Zhou, Z. Hong
- Bi, Guo-Qiang
- ORCID
- Venue
- The Journal of Neuroscience
- Publisher
- Society for Neuroscience
- Published
- 2018-01-08
- Volume
- 38
- Issue
- 6
- Pages
- 1493-1510
- ISSN
- 0270-6474 (ISSN-L)
- 1529-2401
- PMC
- PMC5815350
- OpenAlex
- W2783481291
- Cited by
- 207
- References
- 91
- Citations by year
- 2026: 18 · 2025: 24 · 2024: 30 · 2023: 14 · 2022: 27 · 2021: 40 · 2020: 30 · 2019: 17 · 2018: 5
- FWCI
- 10.48
- Type
- journal article
- Language
- en
- Open access
- hybrid
- doi.org
- Locations
- Journal of Neuroscience (publishedVersion, cc-by)
- PubMed Central (publishedVersion, cc-by)
- PubMed (publishedVersion)
- eScholarship (California Digital Library) (submittedVersion)
- eScholarship (California Digital Library) (submittedVersion, cc-by)
- Funders
- National Science Foundation
- Wellcome Trust (206422/Z/17/Z)
- National Natural Science Foundation of China (2009CB941300, 31070935, PSD-95)
- National Institutes of Health (1s10od018111-01)
- Biotechnology and Biological Sciences Research Council (BB/S003339/1)
- National Institute of General Medical Sciences (R01GM071940)
- National Center for Research Resources (S10RR023057)
- Topics
- Life Sciences › Neuroscience › Cellular and Molecular Neuroscience › Neuroscience and Neuropharmacology Research
- Life Sciences › Biochemistry, Genetics and Molecular Biology › Structural Biology › Advanced Electron Microscopy Techniques and Applications
- Life Sciences › Biochemistry, Genetics and Molecular Biology › Cell Biology › Cellular transport and secretion
- Keywords
- excitatory synapses, inhibitory synapses, synaptic ultrastructure, postsynaptic density, synaptic vesicles, glutamate receptors, GABAA receptor, synaptic scaffolding proteins, adhesion molecules, hippocampal neurons, cryo-electron tomography, correlative light and electron microscopy
- MeSH terms
- Animals, Female, Image Processing, Computer-Assisted, Inhibition, Psychological, Neurons, Pregnancy, Receptors, GABA-A, Synapses, Synaptic Vesicles, Tomography, Cell Adhesion Molecules, Receptors, Glutamate, Excitatory Postsynaptic Potentials, Cryoelectron Microscopy, Rats, Post-Synaptic Density
About these checks
Registry, retraction, Cites and statistics results are computed, not judged, with one exception: a printed reference that no index lists is read once by a model before it counts as a citation error. Claims are extracted by a model and kept only when their quote appears verbatim in the text; each cited source is then checked, with a model’s help, for whether it says what the claim relies on. Those verdicts can be wrong — read the claim’s quote and the cited source before relying on one.
Statistics and arithmetic are recomputed, not judged.
Confidence bands are shown only for fields calibrated on our annotated test set. None is calibrated yet, so no band is shown.
What counts as a claim ›How we measure confidence ›How we check this ›
Are you an author, or do you see a problem with this page? Request a review
