

The DOI matches its Crossref record; 75 of the 75 references it cites were found in a registry or an index; 24 of the 66 sources its claims cite were checked for support.
Neurotoxic Activation of Microglia Is Promoted by a Nox1-Dependent NADPH Oxidase
Open accessAbstract
Reactive oxygen species (ROS) modulate intracellular signaling but are also responsible for neuronal damage in pathological states. Microglia, the resident CNS macrophages, are prominent sources of ROS through expression of the phagocyte oxidase which catalytic subunit Nox2 generates superoxide ion (O 2 ·− ). Here we show that microglia also express Nox1 and other components of nonphagocyte NADPH oxidases, including p22 phox , NOXO1, NOXA1, and Rac1/2. The subcellular distribution and functions of Nox1 were determined by blocking Nox activity with diphenylene iodonium or apocynin, and by silencing the Nox1 gene in microglia purified from wild-type (WT) or Nox2-KO mice. [Nox1-p22 phox ] dimers localized in intracellular compartments are recruited to phagosome membranes during microglial phagocytosis of zymosan, and Nox1 produces O 2 ·− in zymosan-loaded phagosomes. In microglia activated with lipopolysaccharide (LPS), Nox1 produces O 2 ·− , which enhances cell expression of inducible nitric oxide synthase and secretion of interleukin-1β. Comparisons of microglia purified from WT, Nox2-KO, or Nox1-KO mice indicate that both Nox1 and Nox2 are required to optimize microglial production of nitric oxide. By injecting LPS in the striatum of WT and Nox1-KO mice, we show that Nox1 also enhances microglial production of cytotoxic nitrite species and promotes loss of presynaptic proteins in striatal neurons. These results demonstrate the functional expression of Nox1 in resident CNS phagocytes, which can promote production of neurotoxic compounds during neuroinflammation. Our study also shows that Nox1- and Nox2-dependent oxidases play distinct roles in microglial activation and that Nox1 is a possible target for the treatment of neuroinflammatory states.
Overview
AI snapshot
Written from the paper’s full text.
TL;DR
Microglia express a Nox1-dependent NADPH oxidase in addition to the phagocyte Nox2 oxidase, and Nox1 generates intracellular/phagosomal superoxide that promotes LPS-induced IL-1β, nitric oxide, and peroxynitrite-related neurotoxicity. In vivo, Nox1 deletion reduced tyrosine nitration in activated microglia and prevented LPS-induced loss of striatal synapsin.
Key findings
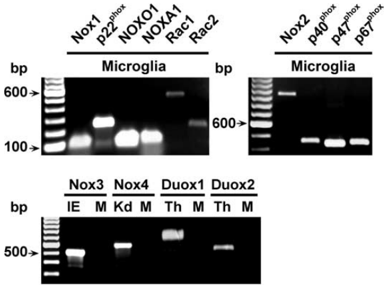
- Microglia express Nox1 and the nonphagocyte NADPH oxidase components p22phox, NOXO1, NOXA1, and Rac1/2, while Nox3, Nox4, Duox1, and Duox2 transcripts were not detectable.
- [Nox1-p22phox] dimers localize to intracellular compartments, including lysosomes, and are recruited to phagosome membranes during zymosan phagocytosis; zymosan increased hydroethidine oxidation 15-fold in WT microglia but only 5-fold in Nox2-KO microglia, and DPI abolished this signal.
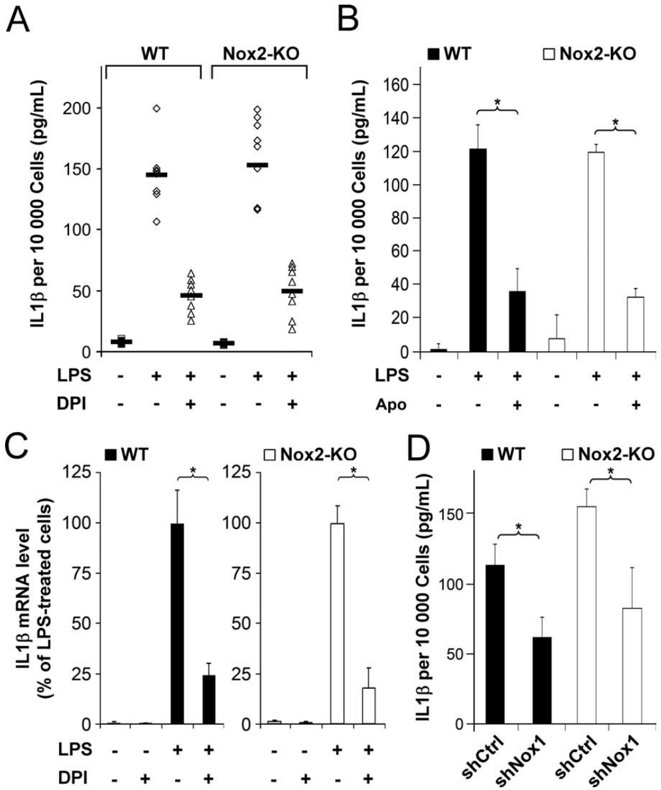
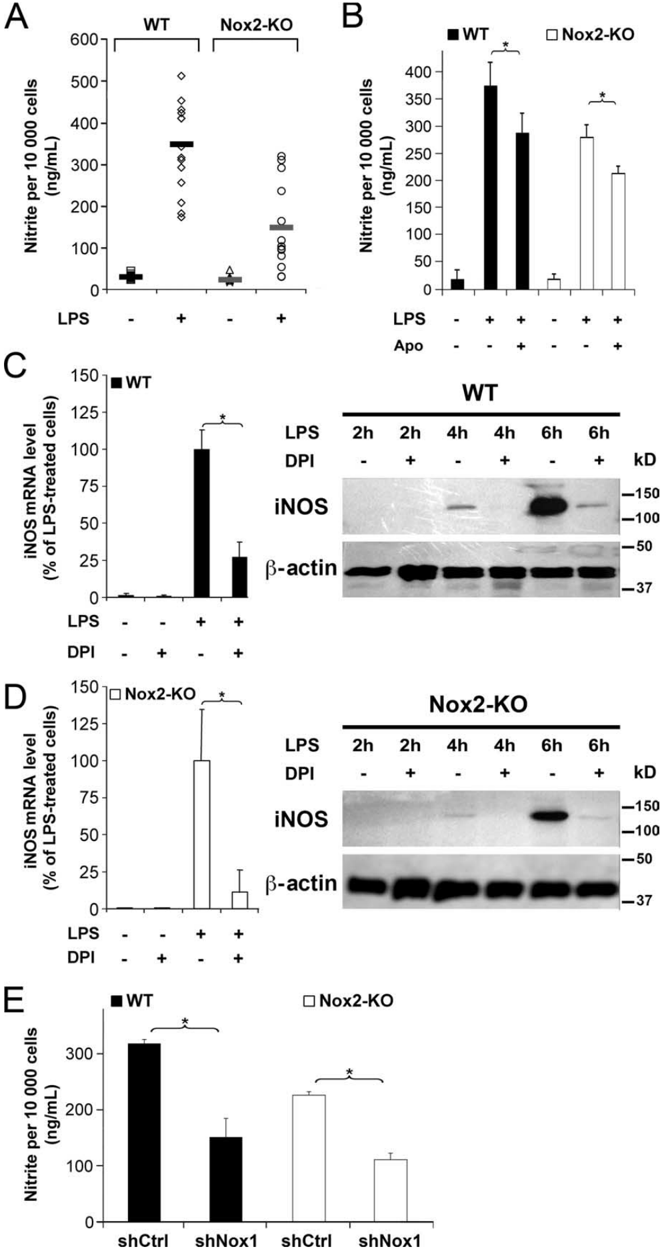
- LPS activated both Nox1 and Nox2; Nox1 promoted IL-1β and NO production. DPI reduced IL-1β secretion by 65%, apocynin reduced it by >60%, and shNox1 reduced IL-1β by at least 45%; Nox2-KO microglia produced 50% less NO than WT, Nox1 silencing reduced NO by at least 50%, and Nox1-KO microglia produced 23–73% less nitrite than WT.
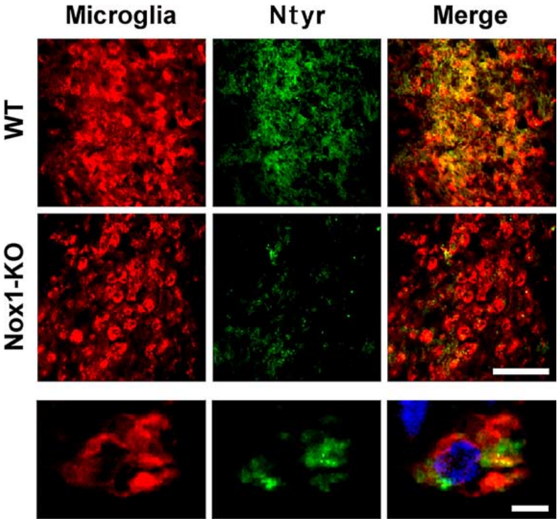
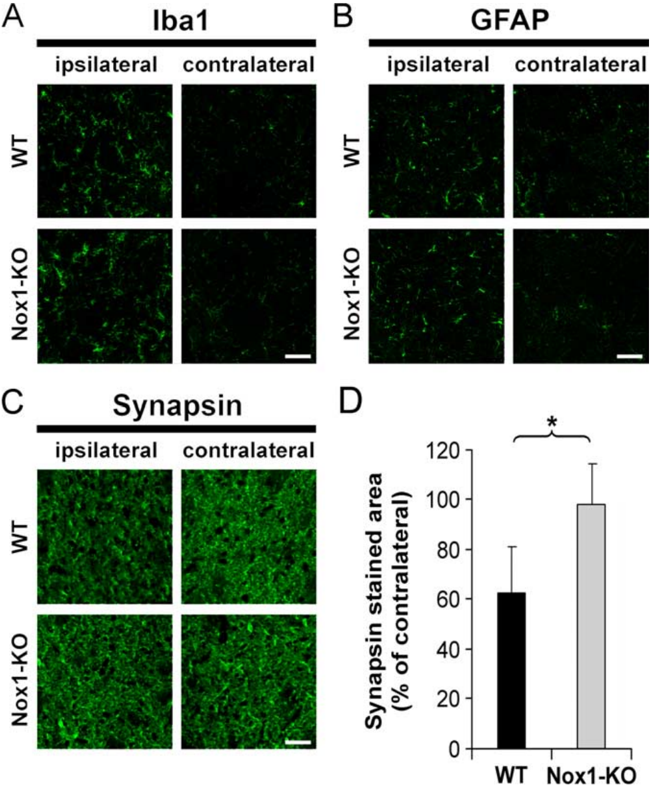
- After intrastriatal LPS, the proportion of Ntyr-stained microglia fell from 91 ± 9% in WT to 47 ± 16% in Nox1-KO mice, and WT mice showed a 40% decrease in synapsin immunoreactivity while Nox1-KO mice showed no synapsin loss.
Methods
- Microglia were purified by FACS from CX3CR1-EGFP mice or prepared from primary cultures of WT, Nox2-KO, and Nox1-KO mice; expression was assessed by RT-PCR, quantitative real-time PCR, Western blot, and immunocytochemistry.
- Nox1 was silenced with siRNA or lentiviral shRNA; Nox activity was blocked with DPI or apocynin; superoxide was detected by hydroethidine oxidation and NBT reduction, IL-1β by ELISA, and NO by nitrite/Griess measurement.
- In vivo, LPS was injected unilaterally into the striatum of 21-week-old male WT and Nox1-KO littermates, and brains were analyzed 4 days later by immunohistofluorescence for microglia, astrocytes, synapsin, and nitrotyrosine.
Limitations
- The paper states that antibodies selectively reacting with murine Nox1 were unavailable, so p22phox distribution was used to infer Nox1 localization; DPI can also inhibit other flavoenzymes; and it cannot be ruled out that Nox1 protein levels or Nox1-derived O2− differ between WT and Nox2-KO microglia.
- The paper states that the precise mechanism of the synaptic alteration remains to be determined.
- Evident from the text: double Nox1/Nox2 knockout mice were not used because both genes are on chromosome X, so the study relied on pharmacological inhibition and shNox1 silencing in Nox2-KO cells; in vivo analysis was limited to LPS-injected striatum at 4 days, and TUNEL staining detected very few degenerating cells.
Model-written summary. Check it against the paper before relying on it.
Integrity signals
Registry
Cites
Statistics
Figures
Verification
Claims the paper makes
75 Own result · 31 Own interpretation · 16 No full text of the sources · 10 Partly supported · 8 Own method · 7 Supported · 5 No basis given · 4 Sources not found · 3 Not checked yet · 2 Supported so far · accuracy not yet measured
Every source the paper cites for this claim was checked and supports it.
In the paper
“Accordingly, formation of extracellular O 2 ⅐Ϫ was not detected in LPS-stimulated microglial cultures from Nox2-KO mice (Qin et al., 2004).”
§ Neurobiology of Disease Neurotoxic Activation of Microglia Is Promoted by a Nox1-Dependent NADPH Oxidase > Discussion
What the sources say
- Supportedcites Qin et al., 2004 source
The Results section (Fig. 5A; page not supplied) reports that LPS caused significant extracellular superoxide production in microglia from PHOX+/+ mice but not PHOX−/− mice. The Experimental Procedures identify the PHOX−/− mice as lacking functional gp91, the catalytic subunit of NADPH oxidase. (LLM, conf=0.94)
plain- Asserted: passes — The authors put it forward as true.
- Checkable: passes — It can be checked against evidence.
- Load-bearing: passes — The paper’s conclusions depend on it.
- Based: passes — The paper gives a reason why it holds.
- Supported
The cited sources support only part of this claim — read each source’s verdict below.
In the paper
“In previous studies, LPS caused neuronal death when injected in the striatum of rats and gerbils but not mice, as indicated by silver or cresyl violet staining (Zito et al., 2001;Choi et al., 2007).”
§ Neurobiology of Disease Neurotoxic Activation of Microglia Is Promoted by a Nox1-Dependent NADPH Oxidase > Nox1 deletion reduces tyrosine nitration and synapsin loss induced by intracerebral injection of LPS
What the sources say
- Not checked — no full text of the sourcecites Zito et al., 2001 source
- Partly supportedcites Choi et al., 2007 sourceExperimental — accuracy not yet measured
The Discussion reports fewer striatal neurons three days after LPS injection in rats, supporting the rat neuronal-loss finding. The paper does not establish the claimed results for gerbils or mice, and its Methods describe NeuN and caspase-3 immunostaining rather than silver or cresyl violet staining. (LLM, conf=0.88)
plaindirect- Asserted: passes — The authors put it forward as true.
- Checkable: passes — It can be checked against evidence.
- Load-bearing: passes — The paper’s conclusions depend on it.
- Based: passes — The paper gives a reason why it holds.
Every source the paper cites for this claim was checked and supports it.
In the paper
“whereas invalidation of Nox1 retards progression (Marden et al., 2007).”
§ Neurobiology of Disease Neurotoxic Activation of Microglia Is Promoted by a Nox1-Dependent NADPH Oxidase > Discussion
What the sources say
- Supportedcites Marden et al., 2007 source
The Introduction states that disrupting Nox1 significantly delayed motor neuron disease progression in SOD1 G93A mice, a mouse model of ALS. The paper also reports improved survival after Nox1 deletion. (LLM, conf=0.90)
plaindirect- Asserted: passes — The authors put it forward as true.
- Checkable: passes — It can be checked against evidence.
- Load-bearing: passes — The paper’s conclusions depend on it.
- Based: passes — The paper gives a reason why it holds.
- Supported
The cited sources support only part of this claim — read each source’s verdict below.
In the paper
“The cytotoxic activity of phagosomal O 2 ⅐Ϫ also participates in normal development, where engulfing microglia cause neuronal apoptosis (Marín-Teva et al., 2004;Wakselman et al., 2008).”
§ Neurobiology of Disease Neurotoxic Activation of Microglia Is Promoted by a Nox1-Dependent NADPH Oxidase > Discussion
What the sources say
- Not matchedcites Marín-Teva et al., 2004
Couldn’t be matched to a paper in Crossref, so it can’t be checked.
- Partly supportedcites Wakselman et al., 2008 sourceExperimental — accuracy not yet measured
The Discussion reports that microglial superoxide contributes to neuronal death during hippocampal development, and the Results describe superoxide-producing microglia contacting apoptotic neurons. The paper distinguishes this death-promoting activity from phagocytosis; it does not establish that the superoxide is phagosomal or that the microglia cause apoptosis by engulfing neurons. The indexed passages have no page numbers. (LLM, conf=0.87)
plaindirect- Asserted: passes — The authors put it forward as true.
- Checkable: passes — It can be checked against evidence.
- Load-bearing: passes — The paper’s conclusions depend on it.
- Based: passes — The paper gives a reason why it holds.
- Not matched
A result the paper reports from its own data — it cites no other source for it, so there is none to check. The quote shows it is in the paper.
In the paper
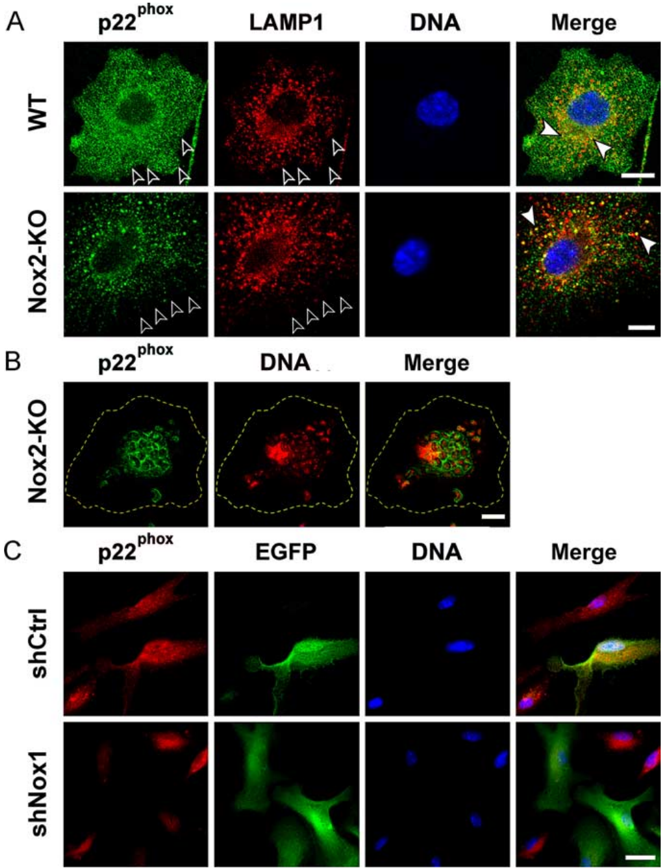
“Despite the apparent lack of p22 phox immunoreactivity at the plasma membrane, engulfment of opsonized zymosan by Nox2-KO microglia triggered a marked redistribution of p22 phox immunoreactivity to the phagosomes (Fig. 2 B).”
§ Neurobiology of Disease Neurotoxic Activation of Microglia Is Promoted by a Nox1-Dependent NADPH Oxidase > Distribution of Nox-associated p22 phox
plaindirect- Asserted: passes — The authors put it forward as true.
- Checkable: passes — It can be checked against evidence.
- Load-bearing: passes — The paper’s conclusions depend on it.
- Based: passes — The paper gives a reason why it holds.
A result the paper reports from its own data — it cites no other source for it, so there is none to check. The quote shows it is in the paper.
In the paper
“By injecting LPS in the striatum of WT and Nox1-KO mice, we show that Nox1 also enhances microglial production of cytotoxic nitrite species”
§ Neurobiology of Disease Neurotoxic Activation of Microglia Is Promoted by a Nox1-Dependent NADPH Oxidase > Abstract
plaindirect- Asserted: passes — The authors put it forward as true.
- Checkable: passes — It can be checked against evidence.
- Load-bearing: passes — The paper’s conclusions depend on it.
- Based: passes — The paper gives a reason why it holds.
A result the paper reports from its own data — it cites no other source for it, so there is none to check. The quote shows it is in the paper.
In the paper
“and favors peroxynitrite-mediated tyrosine nitration as well as loss of synapse proteins.”
§ Neurobiology of Disease Neurotoxic Activation of Microglia Is Promoted by a Nox1-Dependent NADPH Oxidase > Introduction
plaindirect- Asserted: passes — The authors put it forward as true.
- Checkable: passes — It can be checked against evidence.
- Load-bearing: passes — The paper’s conclusions depend on it.
- Based: passes — The paper gives a reason why it holds.
A result the paper reports from its own data — it cites no other source for it, so there is none to check. The quote shows it is in the paper.
In the paper
“Consistent with the detection of p22 phox stabilized through association with Nox proteins, staining of [Nox1-p22 phox ] heterodimers was strongly reduced in shNox1/EGFPtransduced Nox2-KO microglia but not in shCtrl-transduced cells (Fig. 2C).”
§ Neurobiology of Disease Neurotoxic Activation of Microglia Is Promoted by a Nox1-Dependent NADPH Oxidase > Distribution of Nox-associated p22 phox
boosteddirect- Asserted: passes — The authors put it forward as true.
- Checkable: passes — It can be checked against evidence.
- Load-bearing: passes — The paper’s conclusions depend on it.
- Based: passes — The paper gives a reason why it holds.
A result the paper reports from its own data — it cites no other source for it, so there is none to check. The quote shows it is in the paper.
In the paper
“which enhances cell expression of inducible nitric oxide synthase and secretion of interleukin-1.”
§ Neurobiology of Disease Neurotoxic Activation of Microglia Is Promoted by a Nox1-Dependent NADPH Oxidase > Abstract
plaindirect- Asserted: passes — The authors put it forward as true.
- Checkable: passes — It can be checked against evidence.
- Load-bearing: passes — The paper’s conclusions depend on it.
- Based: passes — The paper gives a reason why it holds.
A result the paper reports from its own data — it cites no other source for it, so there is none to check. The quote shows it is in the paper.
In the paper
“In this study, we first show that microglia express catalytically active Nox1 in addition to the phagocyte oxidase.”
§ Neurobiology of Disease Neurotoxic Activation of Microglia Is Promoted by a Nox1-Dependent NADPH Oxidase > Introduction
boosted- Asserted: passes — The authors put it forward as true.
- Checkable: passes — It can be checked against evidence.
- Load-bearing: passes — The paper’s conclusions depend on it.
- Based: passes — The paper gives a reason why it holds.
- Probably not a substantial claim. 37
- It may state two separate claims as one. 34
- The quote only partly states this claim. 1
Every source the paper cites for this claim was checked and supports it.
In the paper
“Nox1 deletion was reported to increase survival in a mouse model of amyotrophic lateral sclerosis (ALS)”
§ Neurobiology of Disease Neurotoxic Activation of Microglia Is Promoted by a Nox1-Dependent NADPH Oxidase > Introduction
What the sources say
- Supportedcites Marden et al., 2007 source
The paper reports that homozygous Nox1 deletion significantly delayed death in SOD1 G93A ALS mice. Figure 1 gives median survival of 162 days for Nox1-KO mice versus 129 days for Nox1-WT mice (P < 0.004). (LLM, conf=0.95)
plaindirect- Asserted: passes — The authors put it forward as true.
- Checkable: passes — It can be checked against evidence.
- Load-bearing: passes — The paper’s conclusions depend on it.
- Based: passes — The paper gives a reason why it holds.
Probably not a substantial claim.
- Supported
The sources with a verdict support this claim; the rest weren’t checked yet, have no full text we could read, or their verdicts aren’t rated yet.
In the paper
“Nox1 is predominantly expressed in colon epithelium, but was also detected in other peripheral tissues, including dorsal root ganglia and in vascular cells (Suh et al., 1999;Bedard and Krause, 2007;Ibi et al., 2008).”
§ Neurobiology of Disease Neurotoxic Activation of Microglia Is Promoted by a Nox1-Dependent NADPH Oxidase > Introduction
What the sources say
- Not checked — no full text of the sourcecites Suh et al., 1999 source
- Not checked — no full text of the sourcecites Bedard and Krause, 2007 source
- Supportedcites Ibi et al., 2008 source
The Introduction says NOX1 is primarily expressed in colon epithelial cells and to a lesser extent in vascular smooth muscle cells. The section on Nox isoform expression in DRG reports Nox1 mRNA in dorsal root ganglia. Page numbers are not available in the supplied copy. (LLM, conf=0.93)
plain- Asserted: passes — The authors put it forward as true.
- Checkable: passes — It can be checked against evidence.
- Load-bearing: fails — The paper’s conclusions may not depend on it.
- Based: passes — The paper gives a reason why it holds.
Probably not a substantial claim. The paper’s conclusions may not depend on it. It may state two separate claims as one.
The cited sources support only part of this claim — read each source’s verdict below.
In the paper
“but the cellular sources of Nox1 and the mechanisms by which Nox1 may promote neural tissue damages remained undetermined (Marden et al., 2007).”
§ Neurobiology of Disease Neurotoxic Activation of Microglia Is Promoted by a Nox1-Dependent NADPH Oxidase > Introduction
What the sources say
- Partly supportedcites Marden et al., 2007 sourceExperimental — accuracy not yet measured
The Introduction reports that Nox1 deletion delayed motor-neuron disease in ALS mice, and the Conclusions (indexed under Figure 2; page unavailable) describe possible ways oxidase-derived ROS could contribute to neurodegeneration. Our copy does not identify Nox1’s cellular sources or explicitly state that its specific damage mechanisms remained undetermined; the proposed mechanisms concern ROS generally. (LLM, conf=0.72)
plain- Asserted: passes — The authors put it forward as true.
- Checkable: passes — It can be checked against evidence.
- Load-bearing: passes — The paper’s conclusions depend on it.
- Based: passes — The paper gives a reason why it holds.
Probably not a substantial claim. It may state two separate claims as one.
- Partly supported
Every source the paper cites for this claim was checked and supports it.
In the paper
“Like other phagocytes, microglia express the phagocyte NADPH oxidase (Sankarapandi et al., 1998;Bianca et al., 1999)”
§ Neurobiology of Disease Neurotoxic Activation of Microglia Is Promoted by a Nox1-Dependent NADPH Oxidase > Introduction
What the sources say
- Supportedcites Sankarapandi et al., 1998 source
The Abstract states that microglial cells generate superoxide via a neutrophil-like NADPH oxidase. The Western blotting section identifies NADPH oxidase subunits in both stimulated and unstimulated microglia. The paper notes differences from neutrophil oxidase, but those do not undermine the claim that microglia express it. (LLM, conf=0.94)
- Supportedcites Bianca et al., 1999 source
The Discussion (page unavailable) describes NADPH oxidase activation in microglia and explains their lower response than monocytes as down-regulation of oxidase components. This supports the claim that microglia express the phagocyte NADPH oxidase. (LLM, conf=0.90)
plain- Asserted: passes — The authors put it forward as true.
- Checkable: passes — It can be checked against evidence.
- Load-bearing: passes — The paper’s conclusions depend on it.
- Based: passes — The paper gives a reason why it holds.
Probably not a substantial claim.
- Supported
Every source the paper cites for this claim was checked and supports it.
In the paper
“activation of microglia with lipopolysaccharide (LPS), a component of Gram-negative bacteria commonly used to model proinflammatory and neurotoxic activation of microglia (Lehnardt et al., 2003;Qin et al., 2004), and injection of LPS in the brain induce IL-1 and NO⅐ production via Nox1”
§ Neurobiology of Disease Neurotoxic Activation of Microglia Is Promoted by a Nox1-Dependent NADPH Oxidase > Introduction
What the sources say
- Supportedcites Lehnardt et al., 2003 source
The citation is attached to the description of LPS as a way to activate microglia, not to the later claim about IL-1β, NO, or Nox1. The Discussion states that LPS is a component of Gram-negative infections and that LPS activation of microglia caused neuronal and axonal loss in vitro and in vivo. (LLM, conf=0.90)
- Supportedcites Qin et al., 2004 source
The citation is attached to the description of LPS as a commonly used model of proinflammatory and neurotoxic microglial activation, not to the later Nox1 clause. The paper’s Abstract calls LPS a common inflammogen for studying inflammation-related neuronal death, and the Discussion describes it as an appropriate model of inflammation-mediated neurodegeneration. (LLM, conf=0.91)
plaindirect- Asserted: passes — The authors put it forward as true.
- Checkable: passes — It can be checked against evidence.
- Load-bearing: passes — The paper’s conclusions depend on it.
- Based: passes — The paper gives a reason why it holds.
It may state two separate claims as one.
- Supported
The cited sources support only part of this claim — read each source’s verdict below.
In the paper
“Like Nox2, Nox1 is a transmembrane protein which forms a heterodimer with p22 phox and generates O 2 ⅐Ϫ (Ambasta et al., 2004;Kawahara et al., 2005).”
§ Neurobiology of Disease Neurotoxic Activation of Microglia Is Promoted by a Nox1-Dependent NADPH Oxidase > Introduction
What the sources say
- Partly supportedcites Ambasta et al., 2004 sourceExperimental — accuracy not yet measured
The opening summary (p. 1) says Nox1 mediates superoxide formation and directly interacts with p22phox; the Discussion (p. 5) reports their co-precipitation. The Discussion (p. 6) describes membrane localization, but our copy does not establish the more specific claim that Nox1 is transmembrane. (LLM, conf=0.82)
- Supportedcites Kawahara et al., 2005 source
The introductory text (page unavailable) describes Nox-family proteins, including Nox1, as having transmembrane helices. The Discussion reports that p22phox interacts with Nox1 and is required for its activity, and describes Nox1-dependent superoxide generation. Together, these support the description of Nox1 as a membrane protein that partners with p22phox to generate O2−. (LLM, conf=0.88)
plain- Asserted: passes — The authors put it forward as true.
- Checkable: passes — It can be checked against evidence.
- Load-bearing: fails — The paper’s conclusions may not depend on it.
- Based: passes — The paper gives a reason why it holds.
Probably not a substantial claim. The paper’s conclusions may not depend on it. It may state two separate claims as one.
- Partly supported
The cited sources support only part of this claim — read each source’s verdict below.
In the paper
“Previous studies have shown that microglia express the full set of specific proteins that compose the phagocyte oxidase (Nox2, p22 phox , p47 phox , p40 phox , p67 phox , and Rac) (Bianca et al., 1999)”
§ Neurobiology of Disease Neurotoxic Activation of Microglia Is Promoted by a Nox1-Dependent NADPH Oxidase > Discussion
What the sources say
- Partly supportedcites Bianca et al., 1999 sourceExperimental — accuracy not yet measured
The Results section (page unavailable) lists gp91phox (Nox2), p22phox, p47phox, p40phox, p67phox, and Rac as components of the classical NADPH oxidase, which the paper reports is activated in microglia. It does not demonstrate expression of every listed protein in microglia: the Results state that testing oxidase-component translocation in rat microglia was not feasible because suitable antibodies were unavailable. (LLM, conf=0.86)
plain- Asserted: passes — The authors put it forward as true.
- Checkable: passes — It can be checked against evidence.
- Load-bearing: fails — The paper’s conclusions may not depend on it.
- Based: passes — The paper gives a reason why it holds.
Probably not a substantial claim. The paper’s conclusions may not depend on it.
- Partly supported
The cited sources support only part of this claim — read each source’s verdict below.
In the paper
“O 2 ⅐Ϫ and NO⅐ combine at diffusion-limited rates to form highly reactive ONOO Ϫ that has been implicated in the death of cultured neurons or oligodendrocyte progenitors exposed to LPS-activated microglia (Xie et al., 2002;Li et al., 2005).”
§ Neurobiology of Disease Neurotoxic Activation of Microglia Is Promoted by a Nox1-Dependent NADPH Oxidase > Discussion
What the sources say
- Supportedcites Xie et al., 2002 source
The section “Peroxynitrite mediates the neurotoxicity of microglia activated by LPS” states that NO and superoxide react at a near diffusion-limited rate to produce highly reactive peroxynitrite. It also reports that peroxynitrite decomposition catalysts blocked LPS-induced neuronal death in microglia–neuron cocultures. The oligodendrocyte-progenitor part of the citing sentence is not attributed specifically to Xie et al.; no page numbers are supplied in our copy. (LLM, conf=0.92)
- Not matchedcites Li et al., 2005
Couldn’t be matched to a paper in Crossref, so it can’t be checked.
plaincorrelational- Asserted: passes — The authors put it forward as true.
- Checkable: passes — It can be checked against evidence.
- Load-bearing: passes — The paper’s conclusions depend on it.
- Based: passes — The paper gives a reason why it holds.
It may state two separate claims as one.
- Supported
The cited sources support only part of this claim — read each source’s verdict below.
In the paper
“whereas both iNOS and IL-1 signaling have been implicated in the loss of synaptic proteins in mouse models of Alzheimer's disease (Craft et al., 2005;Medeiros et al., 2007).”
§ Neurobiology of Disease Neurotoxic Activation of Microglia Is Promoted by a Nox1-Dependent NADPH Oxidase > Discussion
What the sources say
- Partly supportedcites Craft et al., 2005 sourceExperimental — accuracy not yet measured
The Results (‘Increased synaptic degeneration in Aβ-infused IL1raKO mice’) report greater loss of PSD-95 in mice with enhanced IL-1 signaling. The Discussion says IL-1β can stimulate glial iNOS production and potentially cause neuronal damage, but does not link iNOS specifically to the loss of synaptic proteins. (LLM, conf=0.87)
- Partly supportedcites Medeiros et al., 2007 sourceExperimental — accuracy not yet measured
The Results section, “Prevention of synaptic dysfunction by TNF-α and iNOS inhibition” (page not provided), reports that iNOS inhibition or deletion protected against amyloid-β-induced loss of the synaptic protein synaptophysin in mice. The Discussion says further studies are needed to determine whether IL-1β participates; this paper does not establish the IL-1β part of the claim. (LLM, conf=0.88)
plaincorrelational- Asserted: passes — The authors put it forward as true.
- Checkable: passes — It can be checked against evidence.
- Load-bearing: fails — The paper’s conclusions may not depend on it.
- Based: passes — The paper gives a reason why it holds.
Probably not a substantial claim. The paper’s conclusions may not depend on it. It may state two separate claims as one.
- Partly supported
The cited sources support only part of this claim — read each source’s verdict below.
In the paper
“differential effects of Nox proteins in microglial expression of IL-1 and iNOS genes suggest that microglial Nox1 and Nox2 target different redoxsensitive signaling compounds, possibly because of differences in the subcellular distributions of catalytically active Nox and LPSsignaling components (Hunter, 2000).”
§ Neurobiology of Disease Neurotoxic Activation of Microglia Is Promoted by a Nox1-Dependent NADPH Oxidase > Discussion
What the sources say
- Partly supportedcites Hunter, 2000 sourceExperimental — accuracy not yet measured
The section “Spatiotemporal Aspects of Signaling” (page unavailable) says that the location of signaling components can determine signaling specificity, supporting the proposed spatial mechanism in general. It does not address microglial Nox1 or Nox2, their redox-sensitive targets, or LPS-signaling components, so it does not support the specific application to them. (LLM, conf=0.82)
hedgedconditional- Asserted: passes — The authors put it forward as true.
- Checkable: passes — It can be checked against evidence.
- Load-bearing: unclear — It is unclear whether the paper’s conclusions depend on it.
- Based: passes — The paper gives a reason why it holds.
It may state two separate claims as one.
- Partly supported
Every source the paper cites for this claim was checked and supports it.
In the paper
“LPS signals through the toll-like receptor 4 (TLR4), which promotes LPS-triggered microglial neurotoxicity (Lehnardt et al., 2003)”
§ Neurobiology of Disease Neurotoxic Activation of Microglia Is Promoted by a Nox1-Dependent NADPH Oxidase > Discussion
What the sources say
- Supportedcites Lehnardt et al., 2003 source
The Discussion states that LPS acts through TLR4 and that LPS-induced neurotoxicity requires microglia. It also reports that LPS activation of microglia caused neuronal and axonal loss, while loss of functional TLR4 prevented LPS-mediated injury. (LLM, conf=0.94)
plaindirect- Asserted: passes — The authors put it forward as true.
- Checkable: passes — It can be checked against evidence.
- Load-bearing: fails — The paper’s conclusions may not depend on it.
- Based: passes — The paper gives a reason why it holds.
Probably not a substantial claim. The paper’s conclusions may not depend on it. It may state two separate claims as one.
- Supported
The cited sources support only part of this claim — read each source’s verdict below.
In the paper
“release O 2 ⅐Ϫ or O 2 ⅐Ϫ -derived hydrogen peroxide when exposed to LPS, opsonized zymosan, or aggregated proteins that accumulate in the brain during neurodegenerative diseases (Sankarapandi et al., 1998;Zhang et al., 2005;B. Qin et al., 2006;Wilkinson et al., 2006).”
§ Neurobiology of Disease Neurotoxic Activation of Microglia Is Promoted by a Nox1-Dependent NADPH Oxidase > Discussion
What the sources say
- Partly supportedcites Sankarapandi et al., 1998 sourceExperimental — accuracy not yet measured
The Abstract and Discussion report that microglia generate superoxide when stimulated with opsonified zymosan. The paper does not establish the same response to LPS or to aggregated proteins associated with neurodegenerative disease, and it does not directly establish hydrogen peroxide release under those conditions. (LLM, conf=0.88)
- Not checked — no full text of the sourcecites Zhang et al., 2005 source
- Partly supportedcites B. Qin et al., 2006 sourceExperimental — accuracy not yet measured
The Discussion (page unavailable) reports superoxide production by amyloid-β-stimulated microglia and refers to free-radical-producing microglia activated by amyloid-β or LPS. Our copy does not establish release of hydrogen peroxide or address opsonized zymosan, so it supports only part of the sentence. (LLM, conf=0.84)
plaindirect- Asserted: passes — The authors put it forward as true.
- Checkable: passes — It can be checked against evidence.
- Load-bearing: fails — The paper’s conclusions may not depend on it.
- Based: passes — The paper gives a reason why it holds.
Probably not a substantial claim. The paper’s conclusions may not depend on it.
- Partly supported
Every source the paper cites for this claim was checked and supports it.
In the paper
“However, a recent study suggests that cultured rat microglia express Nox4 (Harrigan et al., 2008), unlike the mouse microglia investigated here.”
§ Neurobiology of Disease Neurotoxic Activation of Microglia Is Promoted by a Nox1-Dependent NADPH Oxidase > Discussion
What the sources say
- Supportedcites Harrigan et al., 2008 source
The Results section, “Expression of different NOX isoforms in microglia,” reports that RT-PCR detected NOX4 mRNA in primary rat microglia. The comparison with mouse microglia refers to the citing authors’ own study, not a finding attributed to this source. (LLM, conf=0.94)
hedged- Asserted: passes — The authors put it forward as true.
- Checkable: passes — It can be checked against evidence.
- Load-bearing: fails — The paper’s conclusions may not depend on it.
- Based: passes — The paper gives a reason why it holds.
Probably not a substantial claim. The paper’s conclusions may not depend on it. It may state two separate claims as one.
- Supported
The sources with a verdict support this claim; the rest weren’t checked yet, have no full text we could read, or their verdicts aren’t rated yet.
In the paper
“These same compounds have also been implicated in the neural tissue damage induced by injection of LPS in rodent brain (Iravani et al., 2002;Cai et al., 2003;Arai et al., 2004;Qin et al., 2004).”
§ Neurobiology of Disease Neurotoxic Activation of Microglia Is Promoted by a Nox1-Dependent NADPH Oxidase > Discussion
What the sources say
- Not checked — no full text of the sourcecites Iravani et al., 2002 source
- Not checked — no full text of the sourcecites Cai et al., 2003 source
- Supportedcites Arai et al., 2004 source
The Abstract (page not provided) reports that injecting LPS into the substantia nigra of mice reduced dopaminergic neurons. The Discussion (page not provided) implicates IL-1β and caspase-11 in that neurotoxicity, supporting the attributed link between inflammatory mediators and LPS-induced neural damage. (LLM, conf=0.88)
hedgedcorrelational- Asserted: passes — The authors put it forward as true.
- Checkable: passes — It can be checked against evidence.
- Load-bearing: fails — The paper’s conclusions may not depend on it.
- Based: passes — The paper gives a reason why it holds.
Probably not a substantial claim. The paper’s conclusions may not depend on it.
The cited sources support only part of this claim — read each source’s verdict below.
In the paper
“Loss of synaptic proteins associated with microglial activation has been observed in neuroinflammatory states such as multiple sclerosis and Alzheimer's disease (Lue et al., 1996;Vercellino et al., 2007).”
§ Neurobiology of Disease Neurotoxic Activation of Microglia Is Promoted by a Nox1-Dependent NADPH Oxidase > Discussion
What the sources say
- Not matchedcites Lue et al., 1996
Couldn’t be matched to a paper in Crossref, so it can’t be checked.
- Supportedcites Vercellino et al., 2007 source
In “Neuronal and Synaptic Damage Is Associated With Inflammation and Excitatory Amino Acid Transporter Loss in Cortical Lesions,” the paper reports that activated microglia in multiple sclerosis cortical lesions correlated with loss of synaptophysin, a presynaptic protein. That supports the multiple sclerosis portion for which Vercellino et al. is cited; the sentence also cites Lue et al. for Alzheimer’s disease. (LLM, conf=0.93)
plaincorrelational- Asserted: passes — The authors put it forward as true.
- Checkable: passes — It can be checked against evidence.
- Load-bearing: fails — The paper’s conclusions may not depend on it.
- Based: passes — The paper gives a reason why it holds.
Probably not a substantial claim. The paper’s conclusions may not depend on it.
- Not matched
A result the paper reports from its own data — it cites no other source for it, so there is none to check. The quote shows it is in the paper.
In the paper
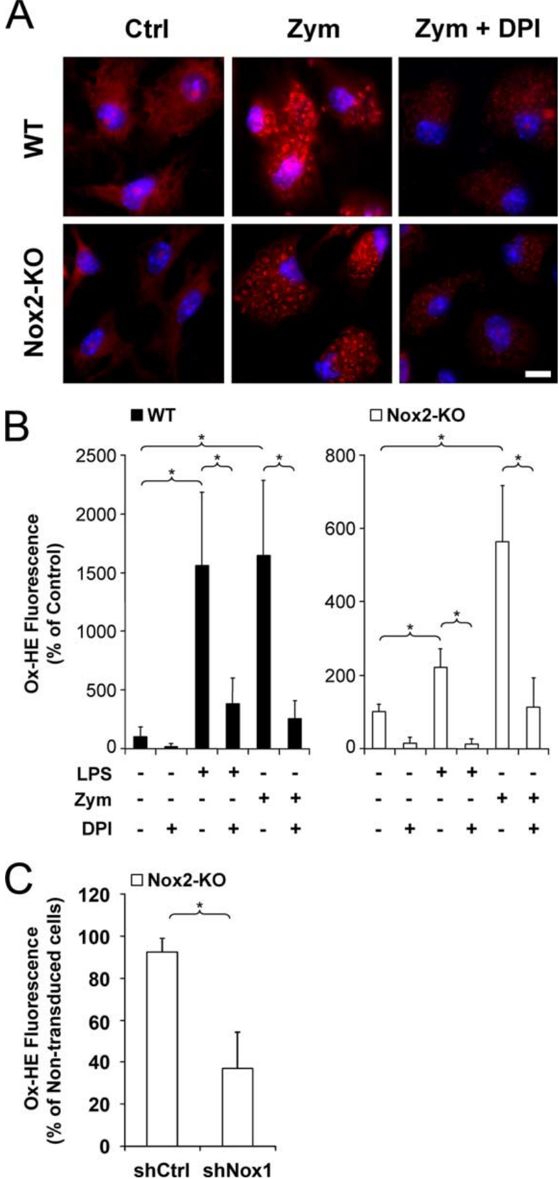
“Hydroethidine oxidation was Ͼ60% lower in shNox1-transduced cell than in nontransduced cells, whereas shCtrltransduction had no significant effect on the level of hydroethidine oxidation (Fig. 4C).”
§ Neurobiology of Disease Neurotoxic Activation of Microglia Is Promoted by a Nox1-Dependent NADPH Oxidase > Catalytic activity of Nox1 is stimulated by zymosan and LPS in microglia
plaindirect- Asserted: passes — The authors put it forward as true.
- Checkable: passes — It can be checked against evidence.
- Load-bearing: passes — The paper’s conclusions depend on it.
- Based: passes — The paper gives a reason why it holds.
It may state two separate claims as one.
A result the paper reports from its own data — it cites no other source for it, so there is none to check. The quote shows it is in the paper.
In the paper
“[Nox1-p22 phox ] dimers localized in intracellular compartments are recruited to phagosome membranes during microglial phagocytosis of zymosan”
§ Neurobiology of Disease Neurotoxic Activation of Microglia Is Promoted by a Nox1-Dependent NADPH Oxidase > Abstract
plaindirect- Asserted: passes — The authors put it forward as true.
- Checkable: passes — It can be checked against evidence.
- Load-bearing: passes — The paper’s conclusions depend on it.
- Based: passes — The paper gives a reason why it holds.
It may state two separate claims as one.
A result the paper reports from its own data — it cites no other source for it, so there is none to check. The quote shows it is in the paper.
In the paper
“and favors peroxynitrite-mediated tyrosine nitration as well as loss of synapse proteins.”
§ Neurobiology of Disease Neurotoxic Activation of Microglia Is Promoted by a Nox1-Dependent NADPH Oxidase > Introduction
plaindirect- Asserted: passes — The authors put it forward as true.
- Checkable: passes — It can be checked against evidence.
- Load-bearing: passes — The paper’s conclusions depend on it.
- Based: passes — The paper gives a reason why it holds.
It may state two separate claims as one.
A result the paper reports from its own data — it cites no other source for it, so there is none to check. The quote shows it is in the paper.
In the paper
“In Nox2-KO cells, there was only a fivefold increase in hydroethidine oxidation.”
§ Neurobiology of Disease Neurotoxic Activation of Microglia Is Promoted by a Nox1-Dependent NADPH Oxidase > Catalytic activity of Nox1 is stimulated by zymosan and LPS in microglia
plain- Asserted: passes — The authors put it forward as true.
- Checkable: passes — It can be checked against evidence.
- Load-bearing: passes — The paper’s conclusions depend on it.
- Based: passes — The paper gives a reason why it holds.
The quote only partly states this claim.
A result the paper reports from its own data — it cites no other source for it, so there is none to check. The quote shows it is in the paper.
In the paper
“Both Nox2 and Nox1 transcripts were clearly expressed by microglia from newborn mice, whereas Nox3, Nox4, Duox1, or Duox2 transcripts were not detectable (Fig. 1).”
§ Neurobiology of Disease Neurotoxic Activation of Microglia Is Promoted by a Nox1-Dependent NADPH Oxidase > Expression of Nox genes in microglia
boosted- Asserted: passes — The authors put it forward as true.
- Checkable: passes — It can be checked against evidence.
- Load-bearing: passes — The paper’s conclusions depend on it.
- Based: passes — The paper gives a reason why it holds.
It may state two separate claims as one.
A result the paper reports from its own data — it cites no other source for it, so there is none to check. The quote shows it is in the paper.
In the paper
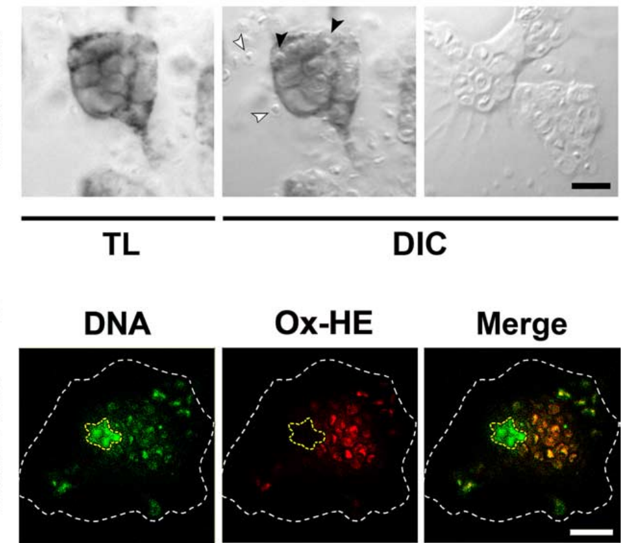
“Cell treatment with DPI (1 M) prevented phagosome staining in Nox2-KO engulfing cells, although it did not block microglial phagocytosis of zymosan (Fig. 3A).”
§ Neurobiology of Disease Neurotoxic Activation of Microglia Is Promoted by a Nox1-Dependent NADPH Oxidase > Catalytic activity of Nox1 is stimulated by zymosan and LPS in microglia
plaindirect- Asserted: passes — The authors put it forward as true.
- Checkable: passes — It can be checked against evidence.
- Load-bearing: passes — The paper’s conclusions depend on it.
- Based: passes — The paper gives a reason why it holds.
It may state two separate claims as one.
A result the paper reports from its own data — it cites no other source for it, so there is none to check. The quote shows it is in the paper.
In the paper
“In Nox2-KO microglia, the plasma membrane was not stained, although p22 phox was clearly detected in vesicles, including LAMP1-positive lysosomes (Fig. 2 A, white arrowheads), albeit at lower levels than in WT cells.”
§ Neurobiology of Disease Neurotoxic Activation of Microglia Is Promoted by a Nox1-Dependent NADPH Oxidase > Distribution of Nox-associated p22 phox
boosted- Asserted: passes — The authors put it forward as true.
- Checkable: passes — It can be checked against evidence.
- Load-bearing: passes — The paper’s conclusions depend on it.
- Based: passes — The paper gives a reason why it holds.
It may state two separate claims as one.
A result the paper reports from its own data — it cites no other source for it, so there is none to check. The quote shows it is in the paper.
In the paper
“DPI also fully prevented LPSinduction of O 2 ⅐Ϫ in Nox2-KO microglia, indicating that Nox1 is also implicated in LPS-stimulated O 2 ⅐Ϫ production (Fig. 4 A, B).”
§ Neurobiology of Disease Neurotoxic Activation of Microglia Is Promoted by a Nox1-Dependent NADPH Oxidase > Catalytic activity of Nox1 is stimulated by zymosan and LPS in microglia
hedgeddirect- Asserted: passes — The authors put it forward as true.
- Checkable: passes — It can be checked against evidence.
- Load-bearing: passes — The paper’s conclusions depend on it.
- Based: passes — The paper gives a reason why it holds.
It may state two separate claims as one.
A result the paper reports from its own data — it cites no other source for it, so there is none to check. The quote shows it is in the paper.
In the paper
“In WT microglia, anti-p22 phox immunoreactivity was observed at the plasma membrane and on intracellular vesicles, some of which expressed the lysosome marker LAMP1 (Fig. 2 A).”
§ Neurobiology of Disease Neurotoxic Activation of Microglia Is Promoted by a Nox1-Dependent NADPH Oxidase > Distribution of Nox-associated p22 phox
plaincorrelational- Asserted: passes — The authors put it forward as true.
- Checkable: passes — It can be checked against evidence.
- Load-bearing: passes — The paper’s conclusions depend on it.
- Based: passes — The paper gives a reason why it holds.
It may state two separate claims as one.
The paper states this without a source or data behind it here, so there is nothing to check it against. The quote shows it is in the paper.
In the paper
“(2) Nox1 produces O 2 ⅐Ϫ , which may react with NO⅐ formed in microglia.”
§ Neurobiology of Disease Neurotoxic Activation of Microglia Is Promoted by a Nox1-Dependent NADPH Oxidase > Discussion
hedgedconditional- Asserted: passes — The authors put it forward as true.
- Checkable: passes — It can be checked against evidence.
- Load-bearing: passes — The paper’s conclusions depend on it.
- Based: passes — The paper gives a reason why it holds.
It may state two separate claims as one.
A result the paper reports from its own data — it cites no other source for it, so there is none to check. The quote shows it is in the paper.
In the paper
“Interestingly, Nox1, but not Nox2, was implicated in microglial LPS-stimulated IL-1 production”
§ Neurobiology of Disease Neurotoxic Activation of Microglia Is Promoted by a Nox1-Dependent NADPH Oxidase > Discussion
plaincorrelational- Asserted: passes — The authors put it forward as true.
- Checkable: passes — It can be checked against evidence.
- Load-bearing: passes — The paper’s conclusions depend on it.
- Based: passes — The paper gives a reason why it holds.
It may state two separate claims as one.
A result the paper reports from its own data — it cites no other source for it, so there is none to check. The quote shows it is in the paper.
In the paper
“The preceding experiments show that Nox1 activity generates O 2 ⅐Ϫ and promotes NO⅐ production in purified microglia.”
§ Neurobiology of Disease Neurotoxic Activation of Microglia Is Promoted by a Nox1-Dependent NADPH Oxidase > Nox1 deletion reduces tyrosine nitration and synapsin loss induced by intracerebral injection of LPS
plaindirect- Asserted: passes — The authors put it forward as true.
- Checkable: passes — It can be checked against evidence.
- Load-bearing: passes — The paper’s conclusions depend on it.
- Based: passes — The paper gives a reason why it holds.
It may state two separate claims as one.
A result the paper reports from its own data — it cites no other source for it, so there is none to check. The quote shows it is in the paper.
In the paper
“Treatment of microglia with the NO synthase inhibitor N-monomethyl-L-arginine (500 M) prevented NO⅐ production but did not reduce LPS-triggered IL-1 secretion (data not shown)”
§ Neurobiology of Disease Neurotoxic Activation of Microglia Is Promoted by a Nox1-Dependent NADPH Oxidase > Nox1 promotes microglial production of IL-1 and NO⅐
plain- Asserted: passes — The authors put it forward as true.
- Checkable: passes — It can be checked against evidence.
- Load-bearing: passes — The paper’s conclusions depend on it.
- Based: passes — The paper gives a reason why it holds.
It may state two separate claims as one.
A result the paper reports from its own data — it cites no other source for it, so there is none to check. The quote shows it is in the paper.
In the paper
“(1) Nox1 promotes LPS-triggered expression of iNOS and NO⅐ production in microglia.”
§ Neurobiology of Disease Neurotoxic Activation of Microglia Is Promoted by a Nox1-Dependent NADPH Oxidase > Discussion
plaindirect- Asserted: passes — The authors put it forward as true.
- Checkable: passes — It can be checked against evidence.
- Load-bearing: passes — The paper’s conclusions depend on it.
- Based: passes — The paper gives a reason why it holds.
It may state two separate claims as one.
A result the paper reports from its own data — it cites no other source for it, so there is none to check. The quote shows it is in the paper.
In the paper
“whereas both oxidases upregulated microglial O 2 ⅐Ϫ and NO⅐ production in response to LPS.”
§ Neurobiology of Disease Neurotoxic Activation of Microglia Is Promoted by a Nox1-Dependent NADPH Oxidase > Discussion
plaindirect- Asserted: passes — The authors put it forward as true.
- Checkable: passes — It can be checked against evidence.
- Load-bearing: passes — The paper’s conclusions depend on it.
- Based: passes — The paper gives a reason why it holds.
It may state two separate claims as one.
A result the paper reports from its own data — it cites no other source for it, so there is none to check. The quote shows it is in the paper.
In the paper
“High levels of Ntyr were observed at the level of the microglial reaction, but less in Nox1-KO than in WT mice.”
§ Neurobiology of Disease Neurotoxic Activation of Microglia Is Promoted by a Nox1-Dependent NADPH Oxidase > Nox1 deletion reduces tyrosine nitration and synapsin loss induced by intracerebral injection of LPS
plaincorrelational- Asserted: passes — The authors put it forward as true.
- Checkable: passes — It can be checked against evidence.
- Load-bearing: passes — The paper’s conclusions depend on it.
- Based: passes — The paper gives a reason why it holds.
It may state two separate claims as one.
A result the paper reports from its own data — it cites no other source for it, so there is none to check. The quote shows it is in the paper.
In the paper
“this study shows that in addition to the Nox2-dependent phagocyte oxidase, microglia express a Nox1 oxidase that catalyzes intracellular and intraphagosomal production of O 2 ⅐Ϫ .”
§ Neurobiology of Disease Neurotoxic Activation of Microglia Is Promoted by a Nox1-Dependent NADPH Oxidase > Discussion
boosteddirect- Asserted: passes — The authors put it forward as true.
- Checkable: passes — It can be checked against evidence.
- Load-bearing: passes — The paper’s conclusions depend on it.
- Based: passes — The paper gives a reason why it holds.
It may state two separate claims as one.
What the paper did — it cites no source for this, so there is none to check. The quote shows it is in the paper.
In the paper
“Lentiviral vectors shCtrl and shNox1 were applied to freshly purified microglial cells at equivalent numbers of transduction units (TU), as assessed by EGFP labeling.”
§ Neurobiology of Disease Neurotoxic Activation of Microglia Is Promoted by a Nox1-Dependent NADPH Oxidase > Microglial cell cultures.
plain- Asserted: passes — The authors put it forward as true.
- Checkable: passes — It can be checked against evidence.
- Load-bearing: passes — The paper’s conclusions depend on it.
- Based: passes — The paper gives a reason why it holds.
Probably not a substantial claim.
What the paper did — it cites no source for this, so there is none to check. The quote shows it is in the paper.
In the paper
“Mean percentage of transduced microglia exceeds 85% for each genotype (WT or Nox2-KO).”
§ Neurobiology of Disease Neurotoxic Activation of Microglia Is Promoted by a Nox1-Dependent NADPH Oxidase > Nox1 promotes microglial production of IL-1 and NO⅐
plain- Asserted: passes — The authors put it forward as true.
- Checkable: passes — It can be checked against evidence.
- Load-bearing: fails — The paper’s conclusions may not depend on it.
- Based: passes — The paper gives a reason why it holds.
Probably not a substantial claim. The paper’s conclusions may not depend on it.
What the paper did — it cites no source for this, so there is none to check. The quote shows it is in the paper.
In the paper
“Controls performed by substituting primary antibodies with rabbit nonimmune serum or unrelated monoclonal antibodies of matched isotypes were negative.”
§ Neurobiology of Disease Neurotoxic Activation of Microglia Is Promoted by a Nox1-Dependent NADPH Oxidase > Microglial production of IL-1 and NO⅐.
plain- Asserted: passes — The authors put it forward as true.
- Checkable: passes — It can be checked against evidence.
- Load-bearing: fails — The paper’s conclusions may not depend on it.
- Based: passes — The paper gives a reason why it holds.
Probably not a substantial claim. The paper’s conclusions may not depend on it.
What the paper did — it cites no source for this, so there is none to check. The quote shows it is in the paper.
In the paper
“All procedures were performed in accordance with the guidelines for care and use of experimental animals of the European Economic Community (ref 86/609/CEE) and approved by the ethics committee for animal experimentation in Ile-de-France.”
§ Neurobiology of Disease Neurotoxic Activation of Microglia Is Promoted by a Nox1-Dependent NADPH Oxidase > Animals.
plain- Asserted: passes — The authors put it forward as true.
- Checkable: passes — It can be checked against evidence.
- Load-bearing: fails — The paper’s conclusions may not depend on it.
- Based: passes — The paper gives a reason why it holds.
Probably not a substantial claim. The paper’s conclusions may not depend on it. It may state two separate claims as one.
In the paper
“Nox1 activity requires rac proteins and is optimized in the presence of NOXO1 and NOXA1, two functional homologues of p47 phox and p67 phox , respectively (Ba ´nfi et al., 2003).”
§ Neurobiology of Disease Neurotoxic Activation of Microglia Is Promoted by a Nox1-Dependent NADPH Oxidase > Introduction
What the sources say
- Not matchedcites Ba ´nfi et al., 2003
Couldn’t be matched to a paper in Crossref, so it can’t be checked.
plaindirect- Asserted: passes — The authors put it forward as true.
- Checkable: passes — It can be checked against evidence.
- Load-bearing: fails — The paper’s conclusions may not depend on it.
- Based: passes — The paper gives a reason why it holds.
Probably not a substantial claim. The paper’s conclusions may not depend on it. It may state two separate claims as one.
- Not matched
A claim is checked only against the cited paper’s full text, never its abstract, and none is available for its sources.
In the paper
“but they may also promote neurodegeneration by producing proinflammatory or potentially neurotoxic effectors, including interleukin-1 (IL-1), nitric oxide (NO⅐), or reactive oxygen species (ROS) (Allan et al., 2005;Block et al., 2007;Hanisch and Kettenmann, 2007).”
§ Neurobiology of Disease Neurotoxic Activation of Microglia Is Promoted by a Nox1-Dependent NADPH Oxidase > Introduction
What the sources say
hedgedconditional- Asserted: passes — The authors put it forward as true.
- Checkable: passes — It can be checked against evidence.
- Load-bearing: passes — The paper’s conclusions depend on it.
- Based: passes — The paper gives a reason why it holds.
Probably not a substantial claim.
What the paper did — it cites no source for this, so there is none to check. The quote shows it is in the paper.
In the paper
“Lentiviral transduction did not affect microglial cell morphologies examined by phase contrast microscopy (data not shown).”
§ Neurobiology of Disease Neurotoxic Activation of Microglia Is Promoted by a Nox1-Dependent NADPH Oxidase > Distribution of Nox-associated p22 phox
plain- Asserted: passes — The authors put it forward as true.
- Checkable: passes — It can be checked against evidence.
- Load-bearing: fails — The paper’s conclusions may not depend on it.
- Based: passes — The paper gives a reason why it holds.
Probably not a substantial claim. The paper’s conclusions may not depend on it.
None of the sources cited for this claim have been checked yet.
In the paper
“but also promotes neural cell death in animal models of neurodegenerative diseases and stroke (Walder et al., 1997;Wu et al., 2003Wu et al., , 2006)).”
§ Neurobiology of Disease Neurotoxic Activation of Microglia Is Promoted by a Nox1-Dependent NADPH Oxidase > Introduction
What the sources say
- Not checked — no full text of the sourcecites Walder et al., 1997 source
- Not matchedcites Wu et al., 2003
Couldn’t be matched to a paper in Crossref, so it can’t be checked.
- Not matchedcites Wu et al., 2006
Couldn’t be matched to a paper in Crossref, so it can’t be checked.
plaindirect- Asserted: passes — The authors put it forward as true.
- Checkable: passes — It can be checked against evidence.
- Load-bearing: fails — The paper’s conclusions may not depend on it.
- Based: passes — The paper gives a reason why it holds.
Probably not a substantial claim. The paper’s conclusions may not depend on it.
In the paper
“Nox2 generates superoxide ion (O 2 ⅐Ϫ ), which ensures the phagocytic neutralization of microorganisms (Nauseef, 2007)”
§ Neurobiology of Disease Neurotoxic Activation of Microglia Is Promoted by a Nox1-Dependent NADPH Oxidase > Introduction
What the sources say
- Not checked — no full text of the sourcecites Nauseef, 2007 source
plaindirect- Asserted: passes — The authors put it forward as true.
- Checkable: passes — It can be checked against evidence.
- Load-bearing: fails — The paper’s conclusions may not depend on it.
- Based: passes — The paper gives a reason why it holds.
Probably not a substantial claim. The paper’s conclusions may not depend on it.
None of the sources cited for this claim have been checked yet.
In the paper
“However, O 2 ⅐Ϫ is also converted to hydrogen peroxide that primarily contributes to intracellular cell signaling processes through redox modulation of ion channels, enzymes, or transcription factors (Dro ¨ge, 2002;Veal et al., 2007).”
§ Neurobiology of Disease Neurotoxic Activation of Microglia Is Promoted by a Nox1-Dependent NADPH Oxidase > Introduction
What the sources say
- Not matchedcites Dro ¨ge, 2002
Couldn’t be matched to a paper in Crossref, so it can’t be checked.
- Not checked — no full text of the sourcecites Veal et al., 2007 source
plaindirect- Asserted: passes — The authors put it forward as true.
- Checkable: passes — It can be checked against evidence.
- Load-bearing: fails — The paper’s conclusions may not depend on it.
- Based: passes — The paper gives a reason why it holds.
Probably not a substantial claim. The paper’s conclusions may not depend on it.
- Not matched
What the paper did — it cites no source for this, so there is none to check. The quote shows it is in the paper.
In the paper
“Highly pure (Ͼ 99%) microglia were isolated from 2-week-old glial primary cultures”
§ Neurobiology of Disease Neurotoxic Activation of Microglia Is Promoted by a Nox1-Dependent NADPH Oxidase > Microglial cell cultures.
plain- Asserted: passes — The authors put it forward as true.
- Checkable: passes — It can be checked against evidence.
- Load-bearing: passes — The paper’s conclusions depend on it.
- Based: passes — The paper gives a reason why it holds.
Probably not a substantial claim.
In the paper
“Nox1-KO mice (Gavazzi et al., 2006) used in our experiments were derived from at least 10 backcrosses with WT C57BL/6J mice.”
§ Neurobiology of Disease Neurotoxic Activation of Microglia Is Promoted by a Nox1-Dependent NADPH Oxidase > Animals.
What the sources say
- Not checked — no full text of the sourcecites Gavazzi et al., 2006 source
plain- Asserted: passes — The authors put it forward as true.
- Checkable: passes — It can be checked against evidence.
- Load-bearing: fails — The paper’s conclusions may not depend on it.
- Based: passes — The paper gives a reason why it holds.
Probably not a substantial claim. The paper’s conclusions may not depend on it.
A claim is checked only against the cited paper’s full text, never its abstract, and none is available for its sources.
In the paper
“O 2 ⅐Ϫ may be neurotoxic by fueling the formation of highly pro-oxidant hydroxyl free radical or peroxynitrite (Halliwell, 2006;Szabo ´et al., 2007).”
§ Neurobiology of Disease Neurotoxic Activation of Microglia Is Promoted by a Nox1-Dependent NADPH Oxidase > Introduction
What the sources say
hedgedconditional- Asserted: passes — The authors put it forward as true.
- Checkable: passes — It can be checked against evidence.
- Load-bearing: fails — The paper’s conclusions may not depend on it.
- Based: passes — The paper gives a reason why it holds.
Probably not a substantial claim. The paper’s conclusions may not depend on it.
In the paper
“and gives rise to halide derivatives (Nauseef, 2007), which eventually destroy ingested bacteria or fungi.”
§ Neurobiology of Disease Neurotoxic Activation of Microglia Is Promoted by a Nox1-Dependent NADPH Oxidase > Discussion
What the sources say
- Not checked — no full text of the sourcecites Nauseef, 2007 source
plaindirect- Asserted: passes — The authors put it forward as true.
- Checkable: passes — It can be checked against evidence.
- Load-bearing: fails — The paper’s conclusions may not depend on it.
- Based: passes — The paper gives a reason why it holds.
Probably not a substantial claim. The paper’s conclusions may not depend on it.
A conclusion the paper draws from its own results — it cites no other source for it, so there is none to check. The quote shows it is in the paper.
In the paper
“Although quite low (20 -30% reduction in nitrite levels according to the experiments), this inhibitory effect suggested that not only Nox2 but also Nox1 promoted microglial production of NO⅐.”
§ Neurobiology of Disease Neurotoxic Activation of Microglia Is Promoted by a Nox1-Dependent NADPH Oxidase > Nox1 promotes microglial production of IL-1 and NO⅐
hedgeddirect- Asserted: passes — The authors put it forward as true.
- Checkable: passes — It can be checked against evidence.
- Load-bearing: passes — The paper’s conclusions depend on it.
- Based: passes — The paper gives a reason why it holds.
It may state two separate claims as one.
In the paper
“although this receptor is not required for LPS activation of microglial Nox2 (Qin et al., 2005).”
§ Neurobiology of Disease Neurotoxic Activation of Microglia Is Promoted by a Nox1-Dependent NADPH Oxidase > Discussion
What the sources say
- Not matchedcites Qin et al., 2005
Couldn’t be matched to a paper in Crossref, so it can’t be checked.
plain- Asserted: passes — The authors put it forward as true.
- Checkable: passes — It can be checked against evidence.
- Load-bearing: fails — The paper’s conclusions may not depend on it.
- Based: passes — The paper gives a reason why it holds.
Probably not a substantial claim. The paper’s conclusions may not depend on it.
- Not matched
In the paper
“It is therefore possible that microglial Nox1 contributes to an immune defense against microorganisms that threaten the CNS (Rock et al., 2004).”
§ Neurobiology of Disease Neurotoxic Activation of Microglia Is Promoted by a Nox1-Dependent NADPH Oxidase > Discussion
What the sources say
- Not checked — no full text of the sourcecites Rock et al., 2004 source
hedgedconditional- Asserted: passes — The authors put it forward as true.
- Checkable: passes — It can be checked against evidence.
- Load-bearing: fails — The paper’s conclusions may not depend on it.
- Based: passes — The paper gives a reason why it holds.
Probably not a substantial claim. The paper’s conclusions may not depend on it.
A conclusion the paper draws from its own results — it cites no other source for it, so there is none to check. The quote shows it is in the paper.
In the paper
“LPS treatments and zymosan phagocytosis therefore both activate Nox1 and Nox2 in microglia.”
§ Neurobiology of Disease Neurotoxic Activation of Microglia Is Promoted by a Nox1-Dependent NADPH Oxidase > Catalytic activity of Nox1 is stimulated by zymosan and LPS in microglia
plaindirect- Asserted: passes — The authors put it forward as true.
- Checkable: passes — It can be checked against evidence.
- Load-bearing: passes — The paper’s conclusions depend on it.
- Based: passes — The paper gives a reason why it holds.
It may state two separate claims as one.
A conclusion the paper draws from its own results — it cites no other source for it, so there is none to check. The quote shows it is in the paper.
In the paper
“Despite this common effect on NO⅐ production, the functions of Nox1 and Nox2 were not redundant, because microglial production of NO⅐ was reduced by inactivating either the Nox2 or Nox1 gene.”
§ Neurobiology of Disease Neurotoxic Activation of Microglia Is Promoted by a Nox1-Dependent NADPH Oxidase > Discussion
plaindirect- Asserted: passes — The authors put it forward as true.
- Checkable: passes — It can be checked against evidence.
- Load-bearing: passes — The paper’s conclusions depend on it.
- Based: passes — The paper gives a reason why it holds.
It may state two separate claims as one.
In the paper
“In Alzheimer's disease, loss of synaptic proteins has been correlated with neurological decline (Terry et al., 1991)”
§ Neurobiology of Disease Neurotoxic Activation of Microglia Is Promoted by a Nox1-Dependent NADPH Oxidase > Discussion
What the sources say
- Not checked — no full text of the sourcecites Terry et al., 1991 source
plaincorrelational- Asserted: passes — The authors put it forward as true.
- Checkable: passes — It can be checked against evidence.
- Load-bearing: fails — The paper’s conclusions may not depend on it.
- Based: passes — The paper gives a reason why it holds.
Probably not a substantial claim. The paper’s conclusions may not depend on it.
In the paper
“The O 2 ⅐Ϫ produced in phagolysosomes indirectly activates proteases (Reeves et al., 2002)”
§ Neurobiology of Disease Neurotoxic Activation of Microglia Is Promoted by a Nox1-Dependent NADPH Oxidase > Discussion
What the sources say
- Not checked — no full text of the sourcecites Reeves et al., 2002 source
plaindirect- Asserted: passes — The authors put it forward as true.
- Checkable: passes — It can be checked against evidence.
- Load-bearing: fails — The paper’s conclusions may not depend on it.
- Based: passes — The paper gives a reason why it holds.
Probably not a substantial claim. The paper’s conclusions may not depend on it.
In the paper
“TLR4 activates multi-ple intracellular signaling pathways leading to transcription of genes, such as iNOS and IL-1 (O'Neill and Bowie, 2007).”
§ Neurobiology of Disease Neurotoxic Activation of Microglia Is Promoted by a Nox1-Dependent NADPH Oxidase > Discussion
What the sources say
- Not checked — no full text of the sourcecites O'Neill and Bowie, 2007 source
plaindirect- Asserted: passes — The authors put it forward as true.
- Checkable: passes — It can be checked against evidence.
- Load-bearing: fails — The paper’s conclusions may not depend on it.
- Based: passes — The paper gives a reason why it holds.
Probably not a substantial claim. The paper’s conclusions may not depend on it.
In the paper
“the extensive formation of Ntyr in microglia suggests that activated microglia may cause oxidative damage to neighboring neurons through the diffusion of ONOO Ϫ , which is known to induce structural and functional alterations of synapse components (Zaidi and Michaelis, 1999).”
§ Neurobiology of Disease Neurotoxic Activation of Microglia Is Promoted by a Nox1-Dependent NADPH Oxidase > Discussion
What the sources say
- Not checked — no full text of the sourcecites Zaidi and Michaelis, 1999 source
hedgedconditional- Asserted: passes — The authors put it forward as true.
- Checkable: passes — It can be checked against evidence.
- Load-bearing: passes — The paper’s conclusions depend on it.
- Based: passes — The paper gives a reason why it holds.
It may state two separate claims as one.
In the paper
“This compound triggers the formation of nitrotyrosine residues (Ntyr), which provides a tissue marker for reactive nitrogen-related tissue damage (Torreilles et al., 1999).”
§ Neurobiology of Disease Neurotoxic Activation of Microglia Is Promoted by a Nox1-Dependent NADPH Oxidase > Nox1 deletion reduces tyrosine nitration and synapsin loss induced by intracerebral injection of LPS
What the sources say
- Not checked — no full text of the sourcecites Torreilles et al., 1999 source
plaindirect- Asserted: passes — The authors put it forward as true.
- Checkable: passes — It can be checked against evidence.
- Load-bearing: unclear — It is unclear whether the paper’s conclusions depend on it.
- Based: passes — The paper gives a reason why it holds.
It may state two separate claims as one.
A conclusion the paper draws from its own results — it cites no other source for it, so there is none to check. The quote shows it is in the paper.
In the paper
“Activation of microglial Nox1 may therefore contribute to immune defenses, neuroregressive events during neurogenesis, and the neural tissue damage that occurs in neurodegenerative or inflammatory diseases.”
§ Neurobiology of Disease Neurotoxic Activation of Microglia Is Promoted by a Nox1-Dependent NADPH Oxidase > Discussion
hedgedconditional- Asserted: passes — The authors put it forward as true.
- Checkable: passes — It can be checked against evidence.
- Load-bearing: passes — The paper’s conclusions depend on it.
- Based: passes — The paper gives a reason why it holds.
It may state two separate claims as one.
- Rests on an assumption: LPS injection into the mouse striatum produces a neuroinflammatory lesion that models the neural tissue damage occurring in human neurodegenerative or inflammatory diseases.
A claim is checked only against the cited paper’s full text, never its abstract, and none is available for its sources.
In the paper
“Nox1dependent increase of IL-1 and iNOS transcripts might result from the oxidative modulation of a variety of redox-sensitive signaling proteins, such as MAP kinase family members, Tyrosine protein phosphatases or transcription factors such as NFB or AP1 (Dro ¨ge, 2002;Veal et al., 2007).”
§ Neurobiology of Disease Neurotoxic Activation of Microglia Is Promoted by a Nox1-Dependent NADPH Oxidase > Discussion
What the sources say
hedgedconditional- Asserted: passes — The authors put it forward as true.
- Checkable: passes — It can be checked against evidence.
- Load-bearing: fails — The paper’s conclusions may not depend on it.
- Based: passes — The paper gives a reason why it holds.
Probably not a substantial claim. The paper’s conclusions may not depend on it.
In the paper
“It was previously shown with Nox inhibitors and ROS scavengers that Nox was implicated in LPS-triggered rat microglial production of NO⅐ (Pawate et al., 2004).”
§ Neurobiology of Disease Neurotoxic Activation of Microglia Is Promoted by a Nox1-Dependent NADPH Oxidase > Discussion
What the sources say
- Not checked — no full text of the sourcecites Pawate et al., 2004 source
plaincorrelational- Asserted: passes — The authors put it forward as true.
- Checkable: passes — It can be checked against evidence.
- Load-bearing: fails — The paper’s conclusions may not depend on it.
- Based: passes — The paper gives a reason why it holds.
Probably not a substantial claim. The paper’s conclusions may not depend on it.
None of the sources cited for this claim could be matched to a paper in Crossref, so there is nothing to check it against.
In the paper
“LPS-activated microglia kill neurons or oligodendrocyte progenitors directly in cell culture via microglial production of IL-1, NO⅐, or Nox2-derived ROS (Ma et al., 2002;Li et al., 2005).”
§ Neurobiology of Disease Neurotoxic Activation of Microglia Is Promoted by a Nox1-Dependent NADPH Oxidase > Discussion
What the sources say
- Not matchedcites Ma et al., 2002
Couldn’t be matched to a paper in Crossref, so it can’t be checked.
- Not matchedcites Li et al., 2005
Couldn’t be matched to a paper in Crossref, so it can’t be checked.
plaindirect- Asserted: passes — The authors put it forward as true.
- Checkable: passes — It can be checked against evidence.
- Load-bearing: passes — The paper’s conclusions depend on it.
- Based: passes — The paper gives a reason why it holds.
Probably not a substantial claim.
- Not matched
In the paper
“Recent studies in a mouse model of human ALS in which motoneurons progressively degenerate show that activated microglia accelerate disease progression (Boille ´e et al., 2006)”
§ Neurobiology of Disease Neurotoxic Activation of Microglia Is Promoted by a Nox1-Dependent NADPH Oxidase > Discussion
What the sources say
- Not matchedcites Boille´e et al., 2006
Couldn’t be matched to a paper in Crossref, so it can’t be checked.
plaindirect- Asserted: passes — The authors put it forward as true.
- Checkable: passes — It can be checked against evidence.
- Load-bearing: passes — The paper’s conclusions depend on it.
- Based: passes — The paper gives a reason why it holds.
Probably not a substantial claim.
- Not matched
None of the sources cited for this claim have been checked yet.
In the paper
“Tyrosine nitration, a marker of ONOO Ϫ activity, has been correlated with tissue damages in human neuropathologies such as multiple sclerosis, ALS, and Parkinson's and Alzheimer's diseases, as well as in animal models of these diseases, including LPS-triggered neuroinflammation (Torreilles et al., 1999;Hill et al., 2004;Toma ´s-Camardiel et al., 2004).”
§ Neurobiology of Disease Neurotoxic Activation of Microglia Is Promoted by a Nox1-Dependent NADPH Oxidase > Discussion
What the sources say
plaincorrelational- Asserted: passes — The authors put it forward as true.
- Checkable: passes — It can be checked against evidence.
- Load-bearing: fails — The paper’s conclusions may not depend on it.
- Based: passes — The paper gives a reason why it holds.
Probably not a substantial claim. The paper’s conclusions may not depend on it.
A conclusion the paper draws from its own results — it cites no other source for it, so there is none to check. The quote shows it is in the paper.
In the paper
“Altogether, microglial treatment with NADPH oxidase inhibitors provides evidence that Nox1 activity promotes the LPS-induced IL-1 secretion at the transcriptional level or enhances the stability of IL-1 transcript.”
§ Neurobiology of Disease Neurotoxic Activation of Microglia Is Promoted by a Nox1-Dependent NADPH Oxidase > Nox1 promotes microglial production of IL-1 and NO⅐
hedgeddirect- Asserted: passes — The authors put it forward as true.
- Checkable: passes — It can be checked against evidence.
- Load-bearing: passes — The paper’s conclusions depend on it.
- Based: passes — The paper gives a reason why it holds.
It may state two separate claims as one.
In the paper
“increasing evidence indicates that intracellular ROS signaling is spatially restricted by the compartmentalization of peroxide-decomposing enzymes such as catalase, glutathione peroxidase, and thioredoxin peroxidase (Veal et al., 2007).”
§ Neurobiology of Disease Neurotoxic Activation of Microglia Is Promoted by a Nox1-Dependent NADPH Oxidase > Discussion
What the sources say
- Not checked — no full text of the sourcecites Veal et al., 2007 source
hedgeddirect- Asserted: passes — The authors put it forward as true.
- Checkable: passes — It can be checked against evidence.
- Load-bearing: fails — The paper’s conclusions may not depend on it.
- Based: passes — The paper gives a reason why it holds.
Probably not a substantial claim. The paper’s conclusions may not depend on it.
The paper relies on this without support.
LPS injection into the mouse striatum produces a neuroinflammatory lesion that models the neural tissue damage occurring in human neurodegenerative or inflammatory diseases.
“causes synaptic damage in a LPS-triggered neuroinflammatory lesion.”
The paper relies on this without support.
Nox1-KO mice lack Nox1 function.
“we injected LPS unilaterally into the striatum of adult WT or Nox1-KO mice from the same litter”
The paper relies on this without support.
The anti-Ntyr antibody specifically detects tyrosine nitration.
“the proportion of microglial cells stained with anti-Ntyr”
The paper relies on this without support.
Decreased synapsin immunoreactivity reflects loss of synaptic proteins or synaptic damage.
“Synapsin immunoreactivity was decreased”
The paper relies on this without support.
The density of microglial cells counted in the cortical area reflects the overall microglial recruitment or activation.
“The density of microglial cells determined by counts in microscopic fields”
Self-check
Percentages, sums and reported differences re-computed from the paper’s own numbers.
Each contradiction between two passages listed here was confirmed by an independent check.
Rated major: it would touch a result — a value a result rests on, reported and recomputed p-values on opposite sides of the significance level, two passages that conflict with no sign which is right, or a cited work retracted before this paper was published.
In the paper
§ Neurobiology of Disease Neurotoxic Activation of Microglia Is Promoted by a Nox1-Dependent NADPH Oxidase > Microglial cell cultures.
“Microglial cells cultured in 8-well Labtek slides were incubated with hydroethidine (10 M, Molecular Probes) for 45 min, in the presence or the absence of LPS (1 g/ml) or opsonized zymosan (3 ϫ 10 6 particles per ml) with or without DPI (1 M).”
§ Neurobiology of Disease Neurotoxic Activation of Microglia Is Promoted by a Nox1-Dependent NADPH Oxidase > Catalytic activity of Nox1 is stimulated by zymosan and LPS in microglia
“LPS (100 ng/ml) induced a 15fold increase of hydroethidine oxidation throughout the cytoplasm of WT microglia, similar to levels reached in zymosanstimulated cells, but only a twofold increase in Nox2-KO microglia (Fig. 4 B).”
Rated minor: it would not touch a result — a value no result rests on, a p-value that stays on the same side of the significance level, or a conflict that is clerical, resolved elsewhere in the paper, or outside its own findings.
In the paper
§ Neurobiology of Disease Neurotoxic Activation of Microglia Is Promoted by a Nox1-Dependent NADPH Oxidase > Catalytic activity of Nox1 is stimulated by zymosan and LPS in microglia
“Engulfment of zymosan particles by WT microglia triggered a massive production of O 2 ⅐Ϫ in the phagosome lumen as shown by the strong fluorescence of oxidized hydroethidine in zymosan DNA counterstained with Hoechst dye (Fig. 3B).”
§ Neurobiology of Disease Neurotoxic Activation of Microglia Is Promoted by a Nox1-Dependent NADPH Oxidase > Discussion
“B, Red fluorescence emitted by oxidized hydroethidine (Ox-HE) in a Nox2-KO microglial cell (same cell as in Fig. 2 B) after a 45 min incubation with zymosan in the presence of cell-permeant hydroethidine.”
Citations
Cites
Free Radicals in the Physiological Control of Cell Function
Dröge, W. (2002) · Physiological Reviews · doi:10.1152/physrev.00018.2001 · Cited by 9,855
The NOX Family of ROS-Generating NADPH Oxidases: Physiology and Pathophysiology
Bedard, K., & Krause, K.-H. (2007) · Physiological Reviews · doi:10.1152/physrev.00044.2005 · Cited by 6,989
Self-citationTerry, R. D., Masliah, E., Salmon, D. P., Butters, N., DeTeresa, R., Hill, R., Hansen, L. A., & Katzman, R. (1991) · Annals of Neurology · doi:10.1002/ana.410300410 · Cited by 4,397
Microglia-mediated neurotoxicity: uncovering the molecular mechanisms
Block, M. L., Zecca, L., & Hong, J.-S. (2007) · Nature Reviews Neuroscience · doi:10.1038/nrn2038 · Cited by 4,110
Microglia: Active sensor and versatile effector cells in the normal and pathologic brain
Hanisch, U.-K., & Kettenmann, H. (2007) · Nature Neuroscience · doi:10.1038/nn1997 · Cited by 3,676
The family of five: TIR-domain-containing adaptors in Toll-like receptor signalling
O'Neill, L. A. J., & Bowie, A. G. (2007) · Nature Reviews Immunology · doi:10.1038/nri2079 · Cited by 2,667
Jung, S., Aliberti, J., Graemmel, P., Sunshine, M. J., Kreutzberg, G. W., Sher, A., & Littman, D. R. (2000) · Molecular and Cellular Biology · doi:10.1128/mcb.20.11.4106-4114.2000 · Cited by 2,632
Oxidative stress and neurodegeneration: where are we now?
Halliwell, B. (2006) · Journal of Neurochemistry · doi:10.1111/j.1471-4159.2006.03907.x · Cited by 2,614
Hunter, T. (2000) · Cell · doi:10.1016/s0092-8674(00)81688-8 · Cited by 2,586
Peroxynitrite: biochemistry, pathophysiology and development of therapeutics
Szabó, C., Ischiropoulos, H., & Radi, R. (2007) · Nature Reviews Drug Discovery · doi:10.1038/nrd2222 · Cited by 2,134
Cited by
Sorted by citations
Central sensitization: a generator of pain hypersensitivity by central neural plasticity
Latremoliere, A., & Woolf, C. J. (2009) · The Journal of Pain · doi:10.1016/j.jpain.2009.06.012 · Cited by 3,913
The Role of Oxidative Stress in Parkinson's Disease
Dias, V., Junn, E., & Mouradian, M. M. (2013) · Journal of Parkinson’s Disease · doi:10.3233/jpd-130230 · Cited by 1,845
Simpson, D. S. A., & Oliver, P. L. (2020) · Antioxidants · doi:10.3390/antiox9080743 · Cited by 1,044
“For example, NOX4 is induced in ischemia but cell-type expression is unknown [75] and the expression of NOX1 in microglia is likely an artefact of disruption of the Cx3cr1 locus [77,78].”
BackgroundMelatonin—A pleiotropic, orchestrating regulator molecule
Hardeland, R., Cardinali, D. P., Srinivasan, V., Spence, D. W., Brown, G. M., & Pandi-Perumal, S. R. (2011) · Progress in Neurobiology · doi:10.1016/j.pneurobio.2010.12.004 · Cited by 843
Nox proteins in signal transduction
Brown, D., & Griendling, K. K. (2009) · Free Radical Biology and Medicine · doi:10.1016/j.freeradbiomed.2009.07.023 · Cited by 837
NADPH Oxidases (NOX): An Overview from Discovery, Molecular Mechanisms to Physiology and Pathology
Vermot, A., Petit-Härtlein, I., Smith, S. M. E., & Fieschi, F. (2021) · Antioxidants · doi:10.3390/antiox10060890 · Cited by 766
Buendía, I., Michalska, P., Navarro, E., Gameiro‐Ros, I., Egea, J., & Leon, R. M. (2015) · Pharmacology & Therapeutics · doi:10.1016/j.pharmthera.2015.11.003 · Cited by 698
Savelieff, M. G., Nam, G., Kang, J., Lee, H. J., Lee, M., & Lim, M. H. (2018) · Chemical Reviews · doi:10.1021/acs.chemrev.8b00138 · Cited by 612
Park, J., Min, J.-S., Kim, B., Chae, U.-B., Yun, J. W., Choi, M.-S., Kong, I.-K., Chang, K.-T., & Lee, D.-S. (2015) · Neuroscience Letters · doi:10.1016/j.neulet.2014.10.016 · Cited by 529
Evolution of nadph oxidase inhibitors: Selectivity and mechanisms for target engagement
Altenhöfer, S., Radermacher, K. A., Kleikers, P. W. M., Wingler, K., & Schmidt, H. H. H. W. (2015) · Antioxidants & Redox Signaling · doi:10.1089/ars.2013.5814 · Cited by 521
Fischer, M. T., Sharma, R., Lim, J. L., Haider, L., Frischer, J. M., Drexhage, J., Mahad, D., Bradl, M., van Horssen, J., & Lassmann, H. (2012) · Brain · doi:10.1093/brain/aws012 · Cited by 507
NOX Enzymes in the Central Nervous System: From Signaling to Disease
Sorce, S., & Krause, K. (2009) · Antioxidants and Redox Signaling · doi:10.1089/ars.2009.2578 · Cited by 481
Self-citationNitric Oxide Signaling in Brain Function, Dysfunction, and Dementia
Steinert, J. R., Chernova, T., & Forsythe, I. D. (2010) · The Neuroscientist · doi:10.1177/1073858410366481 · Cited by 471
Involvement of ROS in BBB dysfunction
Pun, P. B. L., Lu, J., & Moochhala, S. (2009) · Free Radical Research · doi:10.1080/10715760902751902 · Cited by 469
NADPH oxidase in brain injury and neurodegenerative disorders
Ma, M. W., Wang, J., Zhang, Q., Wang, R., Dhandapani, K. M., Vadlamudi, R. K., & Brann, D. W. (2017) · Molecular Neurodegeneration · doi:10.1186/s13024-017-0150-7 · Cited by 432
Damage to dopaminergic neurons by oxidative stress in Parkinson's disease (Review)
Guo, J., Zhao, X., Li, Y., Li, G., & Liu, X. (2018) · International Journal of Molecular Medicine · doi:10.3892/ijmm.2018.3406 · Cited by 353
Niranjan, R. (2013) · Molecular Neurobiology · doi:10.1007/s12035-013-8483-x · Cited by 338
Microglial Cells Contribute to Endogenous Brain Defenses after Acute Neonatal Focal Stroke
Faustino, J. V., Wang, X., Johnson, C. E., Klibanov, A. L., Derugin, N., Wendland, M. F., & Vexler, Z. S. (2011) · Journal of Neuroscience · doi:10.1523/jneurosci.2102-11.2011 · Cited by 318
Brown, G. C., & Vilalta, A. (2015) · Brain Research · doi:10.1016/j.brainres.2015.08.031 · Cited by 322
Microglial phagocytosis of neurons in neurodegeneration, and its regulation
Butler, C. A., Popescu, A. S., Kitchener, E. J. A., Allendorf, D. H., Puigdellívol, M., & Brown, G. C. (2021) · Journal of Neurochemistry · doi:10.1111/jnc.15327 · Cited by 295
The molecular basis of neurodegeneration in multiple sclerosis
Lassmann, H., & van Horssen, J. (2011) · FEBS Letters · doi:10.1016/j.febslet.2011.08.004 · Cited by 308
New Insights on NOX Enzymes in the Central Nervous System
Nayernia, Z., Jaquet, V., & Krause, K.-H. (2014) · Antioxidants & Redox Signaling · doi:10.1089/ars.2013.5703 · Cited by 279
Self-citationPathophysiology of the cochlear intrastrial fluid-blood barrier (review)
Shi, X. (2016) · Hearing Research · doi:10.1016/j.heares.2016.01.010 · Cited by 254
Kaindl, A. M., Degos, V., Peineau, S., Gouadon, E., Chhor, V., Loron, G., Charpentier, T. L., Josserand, J., Ali, C., Vivien, D., et al. (2012) · Annals of Neurology · doi:10.1002/ana.23626 · Cited by 246
Redox signaling in cardiovascular health and disease
Madamanchi, N. R., & Runge, M. S. (2013) · Free Radical Biology and Medicine · doi:10.1016/j.freeradbiomed.2013.04.001 · Cited by 227
MFG-E8 Mediates Primary Phagocytosis of Viable Neurons during Neuroinflammation
Fricker, M., Neher, J. J., Zhao, J.-W., Théry, C., Tolkovsky, A. M., & Brown, G. C. (2012) · The Journal of Neuroscience · doi:10.1523/jneurosci.4837-11.2012 · Cited by 218
TLR4-activated microglia require IFN-γ to induce severe neuronal dysfunction and death in situ
Papageorgiou, I. E., Lewen, A., Galow, L. V., Cesetti, T., Scheffel, J., Regen, T., Hanisch, U., & Kann, O. (2015) · Proceedings of the National Academy of Sciences · doi:10.1073/pnas.1513853113 · Cited by 225
NADPH oxidases: novel therapeutic targets for neurodegenerative diseases
Gao, H., Zhou, H., & Hong, J. (2012) · Trends in Pharmacological Sciences · doi:10.1016/j.tips.2012.03.008 · Cited by 219
Béraud, D., Hathaway, H. A., Trecki, J., Chasovskikh, S., Johnson, D. A., Johnson, J. A., Federoff, H. J., Shimoji, M., Mhyre, T. R., & Maguire‐Zeiss, K. A. (2012) · Journal of Neuroimmune Pharmacology · doi:10.1007/s11481-012-9401-0 · Cited by 179
Haslund‐Vinding, J., McBean, G., Jaquet, V, & Vilhardt, F. (2017) · British Journal of Pharmacology · doi:10.1111/bph.13425 · Cited by 169
Update on Inflammatory Biomarkers and Treatments in Ischemic Stroke
Bonaventura, A., Liberale, L., Vecchié, A., Casula, M., Carbone, F., Dallegri, F., & Montecucco, F. (2016) · International Journal of Molecular Sciences · doi:10.3390/ijms17121967 · Cited by 170
Therapeutic potential of nadph oxidase 1/4 inhibitors
Teixeira, G., Szyndralewiez, C., Molango, S., Carnesecchi, S., Heitz, F., Wiesel, P., & Wood, J. M. (2017) · British Journal of Pharmacology · doi:10.1111/bph.13532 · Cited by 163
CCL11 enhances excitotoxic neuronal death by producing reactive oxygen species in microglia
Parajuli, B., Horiuchi, H., Mizuno, T., Takeuchi, H., & Suzumura, A. (2015) · Glia · doi:10.1002/glia.22892 · Cited by 163
Lee, D.-H., Gold, R., & Linker, R. A. (2012) · International Journal of Molecular Sciences · doi:10.3390/ijms130911783 · Cited by 163
NADPH oxidases in Parkinson’s disease: a systematic review
Bélarbi, K., Cuvelier, E., Destée, A., Gressier, B., & Chartier‐Harlin, M. (2017) · Molecular Neurodegeneration · doi:10.1186/s13024-017-0225-5 · Cited by 161
Schildknecht, S., Gerding, H. R., Karreman, C., Drescher, M., Lashuel, H. A., Outeiro, T. F., Di Monte, D. A., & Leist, M. (2013) · Journal of Neurochemistry · doi:10.1111/jnc.12226 · Cited by 148
Role of microglia in neuronal degeneration and regeneration
Walter, L. M., & Neumann, H. (2009) · Seminars in Immunopathology · doi:10.1007/s00281-009-0180-5 · Cited by 144
Microglia antioxidant systems and redox signalling
Vilhardt, F., Haslund-Vinding, J. L., Jaquet, V., & McBean, G. J. (2016) · British Journal of Pharmacology · doi:10.1111/bph.13426 · Cited by 139
From Flies to Men: ROS and the NADPH Oxidase in Phagocytes
Moghadam, Z. M., Henneke, P., & Kolter, J. (2021) · Frontiers in Cell and Developmental Biology · doi:10.3389/fcell.2021.628991 · Cited by 146
Redox regulation of NF ‐κB p50 and M1 polarization in microglia
Taetzsch, T., Levesque, S., McGraw, C., Brookins, S., Luqa, R., Bonini, M. G., Mason, R. P., Oh, U., & Block, M. L. (2014) · Glia · doi:10.1002/glia.22762 · Cited by 139
NADPH oxidases as therapeutic targets in ischemic stroke
Kahles, T., & Brandes, R. P. (2012) · Cellular and Molecular Life Sciences · doi:10.1007/s00018-012-1011-8 · Cited by 138
Nox/Duox Family of NADPH Oxidases: Lessons from Knockout Mouse Models
Sirokmány, G., Donkó, Á., & Geiszt, M. (2016) · Trends in Pharmacological Sciences · doi:10.1016/j.tips.2016.01.006 · Cited by 138
The role of microglial activation in disease progression
Correale, J. D. (2014) · Multiple Sclerosis Journal · doi:10.1177/1352458514533230 · Cited by 133
Sepsis-induced brain dysfunction
Adam, N., Kandelman, S., Mantz, J., Chrétien, F., & Sharshar, T. (2013) · Expert Review of Anti-infective Therapy · doi:10.1586/eri.12.159 · Cited by 136
Bozza, F. A., d’Avila, J. C., Ritter, C., Sonneville, R., Sharshar, T., & Dal‐Pizzol, F. (2013) · Shock · doi:10.1097/shk.0b013e31828fade1 · Cited by 131
Which NADPH Oxidase Isoform Is Relevant for Ischemic Stroke? The Case for Nox 2
Kahles, T., & Brandes, R. P. (2013) · Antioxidants & Redox Signaling · doi:10.1089/ars.2012.4721 · Cited by 125
Zhao, X., Gonzales, N. R., & Aronowski, J. A. (2014) · CNS Neuroscience & Therapeutics · doi:10.1111/cns.12350 · Cited by 122
Loane, D. J., Stoica, B. A., Pajoohesh‐Ganji, A., Byrnes, K. R., & Faden, A. I. (2009) · Journal of Biological Chemistry · doi:10.1074/jbc.m806139200 · Cited by 121
Reactive Oxygen Species from Human Astrocytes Induced Functional Impairment and Oxidative Damage
Sheng, W. S., Hu, S., Feng, A., & Rock, R. B. (2013) · Neurochemical Research · doi:10.1007/s11064-013-1123-z · Cited by 122
Histamine induces microglia activation and dopaminergic neuronal toxicity via H1 receptor activation
Rocha, S. M., Saraiva, T., Cristóvão, A. C., Ferreira, R., Santos, T., Esteves, M., Saraiva, C., Je, G., Cortes, L., Valero, J., et al. (2016) · Journal of Neuroinflammation · doi:10.1186/s12974-016-0600-0 · Cited by 124
Physiological roles of NOX/NADPH oxidase, the superoxide-generating enzyme
Katsuyama, M., Matsuno, K., & Yabe‐Nishimura, C. (2011) · Journal of Clinical Biochemistry and Nutrition · doi:10.3164/jcbn.11-06sr · Cited by 117
Microglial physiopathology: how to explain the dual role of microglia after acute neural disorders?
Gomes‐Leal, W. (2012) · Brain and Behavior · doi:10.1002/brb3.51 · Cited by 115
Maitra, U., Singh, N., Gan, L., Ringwood, L. A., & Li, L. (2009) · Journal of Biological Chemistry · doi:10.1074/jbc.m109.059501 · Cited by 116
Myeloperoxidase: Bridging the gap in neurodegeneration
Ray, R. S., & Katyal, A. (2016) · Neuroscience & Biobehavioral Reviews · doi:10.1016/j.neubiorev.2016.06.031 · Cited by 120
Schuh, C., Wimmer, I., Hametner, S., Haider, L., van Dam, A., Liblau, R., Smith, K. J., Probert, L., Binder, C. J., Bauer, J., et al. (2014) · Acta Neuropathologica · doi:10.1007/s00401-014-1263-5 · Cited by 115
Dual Role of Superoxide Dismutase 2 Induced in Activated Microglia
Ishihara, Y., Takemoto, T., Itoh, K., Ishida, A., & Yamazaki, T. (2015) · Journal of Biological Chemistry · doi:10.1074/jbc.m115.659151 · Cited by 113
Microglia and inflammation: conspiracy, controversy or control?
Fernandes, A., Miller-Fleming, L., & Pais, T. F. (2014) · Cellular and Molecular Life Sciences · doi:10.1007/s00018-014-1670-8 · Cited by 103
The Endotoxin-Induced Neuroinflammation Model of Parkinson's Disease
Tüfekçi, K. U., Genç, Ş., & Genç, K. (2011) · Parkinson s Disease · doi:10.4061/2011/487450 · Cited by 110
Shi, X. (2010) · Cell and Tissue Research · doi:10.1007/s00441-010-1040-2 · Cited by 109
Redox Signaling in Neurotransmission and Cognition During Aging
Kumar, A., Yegla, B., & Foster, T. C. (2017) · Antioxidants and Redox Signaling · doi:10.1089/ars.2017.7111 · Cited by 106
NADPH oxidases: redox regulation of cell homeostasis and disease
Kračun, D., Lopes, L. R., Cifuentes-Pagano, E., & Pagano, P. J. (2025) · Physiological Reviews · doi:10.1152/physrev.00034.2023 · Cited by 114
Isoprenoids, small GTPases and Alzheimer's disease
Hooff, G. P., Wood, W. G., Müller, W. E., & Eckert, G. P. (2010) · Biochimica et Biophysica Acta (BBA) - Molecular and Cell Biology of Lipids · doi:10.1016/j.bbalip.2010.03.014 · Cited by 106
Mortadza, S. A. S., Sim, J. A., Neubrand, V. E., & Jiang, L. (2017) · Glia · doi:10.1002/glia.23265 · Cited by 102
Khayrullina, G., Bermudez, S., & Byrnes, K. R. (2015) · Journal of Neuroinflammation · doi:10.1186/s12974-015-0391-8 · Cited by 96
Fueling neurodegeneration: metabolic insights into microglia functions
Sadeghdoust, M., Das, A., & Kaushik, D. K. (2024) · Journal of Neuroinflammation · doi:10.1186/s12974-024-03296-0 · Cited by 107
Tracking CNS and systemic sources of oxidative stress during the course of chronic neuroinflammation
Mossakowski, A. A., Pohlan, J., Bremer, D., Lindquist, R. L., Millward, J. M., Bock, M., Pollok, K., Mothes, R., Viohl, L., Radbruch, M., et al. (2015) · Acta Neuropathologica · doi:10.1007/s00401-015-1497-x · Cited by 93
Traumatic brain injury enhances neuroinflammation and lesion volume in caveolin deficient mice
Niesman, I., Schilling, J., Shapiro, L. A., Kellerhals, S., Bonds, J. A., Kleschevnikov, A., Cui, W.-H., Voong, A., Krajewski, S., Ali, S., et al. (2014) · Journal of Neuroinflammation · doi:10.1186/1742-2094-11-39 · Cited by 84
Myeloperoxidase and Neurological Disorder: A Crosstalk
Pravalika, K., Sarmah, D., Kaur, H., Wanve, M., Saraf, J., Kalia, K., Borah, A., Yavagal, D. R., Dave, K. R., & Bhattacharya, P. (2018) · ACS Chemical Neuroscience · doi:10.1021/acschemneuro.7b00462 · Cited by 91
NADPH oxidase Nox1 contributes to ischemic injury in experimental stroke in mice
Kahles, T., Kohnen, A., Heumueller, S., Rappert, A., Bechmann, I., Liebner, S., Wittko, I. M., Neumann-Haefelin, T., Steinmetz, H., Schroeder, K., et al. (2010) · Neurobiology of Disease · doi:10.1016/j.nbd.2010.05.023 · Cited by 91
The Plasma Membrane: A Platform for Intra- and Intercellular Redox Signaling
Nordzieke, D. E., & Medraño-Fernandez, I. (2018) · Antioxidants · doi:10.3390/antiox7110168 · Cited by 90
von Leden, R. E., Yauger, Y. J., Khayrullina, G., & Byrnes, K. R. (2016) · Journal of Neurotrauma · doi:10.1089/neu.2016.4486 · Cited by 92
Sonar, S. A., & Lal, G. (2019) · Frontiers in Immunology · doi:10.3389/fimmu.2019.00710 · Cited by 86
Mead, E., Mosley, A. J., Eaton, S. D., Dobson, L., Heales, S., & Pocock, J. M. (2012) · Journal of Neurochemistry · doi:10.1111/j.1471-4159.2012.07659.x · Cited by 87
da Fonseca, A. C. C., Romão, L. F., do Amaral, R. F., Kahn, S. A., Lobo, D. S., Martins, S. C. D. S., de Souza, J. M., Moura‐Neto, V., & Lima, F. R. S. (2011) · Neuroscience · doi:10.1016/j.neuroscience.2011.10.025 · Cited by 85
Oxidative Stress in Genetic Mouse Models of Parkinson’s Disease
Varçin, M., Bentea, E., Michotte, Y. M., & Sarre, S. (2012) · Oxidative Medicine and Cellular Longevity · doi:10.1155/2012/624925 · Cited by 86
Microglia toxicity in preterm brain injury
Baburamani, A. A., Supramaniam, V. G., Hagberg, H., & Mallard, C. E. (2014) · Reproductive Toxicology · doi:10.1016/j.reprotox.2014.04.002 · Cited by 90
Little, J. W., Doyle, T. M., & Salvemini, D. (2010) · Amino Acids · doi:10.1007/s00726-010-0633-0 · Cited by 84
Li, B., Bedard, K., Sorce, S., Hinz, B., Dubois‐Dauphin, M., & Krause, K. (2009) · Journal of Innate Immunity · doi:10.1159/000235563 · Cited by 79
Self-citationROS Produced by NOX2 Controls In Vitro Development of Cerebellar Granule Neurons Development
Olguín‐Albuerne, M., & Morán, J. (2015) · ASN NEURO · doi:10.1177/1759091415578712 · Cited by 78
Delayed inflammatory mRNA and protein expression after spinal cord injury
Byrnes, K. R., Washington, P. M., Knoblach, S. M., Hoffman, E. P., & Faden, A. I. (2011) · Journal of Neuroinflammation · doi:10.1186/1742-2094-8-130 · Cited by 77
Luo, T., Wu, J., Kabadi, S. V., Sabirzhanov, B. E., Guanciale, K., Hanscom, M., Faden, J., Cardiff, K., Bengson, C. J., & Faden, A. I. (2013) · Anesthesiology · doi:10.1097/aln.0000000000000020 · Cited by 76
Mortadza, S. A. S., Sim, J. A., Stacey, M. A., & Jiang, L. (2017) · Scientific Reports · doi:10.1038/srep45032 · Cited by 73
The role of dopamine in NLRP3 inflammasome inhibition: Implications for neurodegenerative diseases
Possemato, E., Barbera, L. L., Nobili, A., Krashia, P., & D’Amelio, M. (2023) · Ageing Research Reviews · doi:10.1016/j.arr.2023.101907 · Cited by 76
Carbone, F., Teixeira, P. C., Braunersreuther, V., Mach, F., Vuilleumier, N., & Montecucco, F. (2014) · Antioxidants and Redox Signaling · doi:10.1089/ars.2013.5778 · Cited by 68
Fan, H., Wu, P., Zhang, L., Hu, Z., Wang, W., Guan, X., Luo, H., Ni, M., Yang, J., Li, M., et al. (2015) · Antioxidants and Redox Signaling · doi:10.1089/ars.2014.6022 · Cited by 66
The role of NADPH oxidases in neuronal development
Terzi, A., & Suter, D. M. (2020) · Free Radical Biology and Medicine · doi:10.1016/j.freeradbiomed.2020.04.027 · Cited by 68
Nicolas, S., Cazareth, J., Zarif, H., Guyon, A., Heurteaux, C., Chabry, J., & Petit-Paitel, A. (2017) · Frontiers in Cellular Neuroscience · doi:10.3389/fncel.2017.00352 · Cited by 68
Neuroprotection by Radical Avoidance: Search for Suitable Agents
Hardeland, R. (2009) · Molecules · doi:10.3390/molecules14125054 · Cited by 65
Vendrov, A. E., Sumida, A., Canugovi, C., Lozhkin, A. P., Hayami, T., Madamanchi, N. R., & Runge, M. S. (2018) · Redox Biology · doi:10.1016/j.redox.2018.11.021 · Cited by 63
Reformulating Pro-Oxidant Microglia in Neurodegeneration
García‐Revilla, J., Alonso-Bellido, I. M., Burguillos, M. Á., Herrera, A. J., Espinosa‐Oliva, A. M., Ruiz, R., Cruz-Hernández, L., García-Domínguez, I., Roca-Ceballos, M. A., Santiago, M., et al. (2019) · Journal of Clinical Medicine · doi:10.3390/jcm8101719 · Cited by 66
Protein Prenylation and Synaptic Plasticity: Implications for Alzheimer’s Disease
Hottman, D. A., & Li, L. (2014) · Molecular Neurobiology · doi:10.1007/s12035-013-8627-z · Cited by 65
A20 deficiency causes spontaneous neuroinflammation in mice
Guedes, R. P., Csizmadia, E., Moll, H. P., Ma, A. I., Ferran, C. J., & da Silva, C. G. (2014) · Journal of Neuroinflammation · doi:10.1186/1742-2094-11-122 · Cited by 63
Therapeutic targeting of microglia mediated oxidative stress after neurotrauma
Smith, A. N., Shaughness, M., Collier, S., Hopkins, D., & Byrnes, K. R. (2022) · Frontiers in Medicine · doi:10.3389/fmed.2022.1034692 · Cited by 63
Siddiqui, T. A., Lively, S. S., & Schlichter, L. C. (2016) · Journal of Neuroinflammation · doi:10.1186/s12974-016-0531-9 · Cited by 67
Inhibition of NADPH Oxidase by Apocynin Attenuates Progression of Atherosclerosis
Kinkade, K. J., Streeter, J., & Miller, F. J. (2013) · International Journal of Molecular Sciences · doi:10.3390/ijms140817017 · Cited by 57
McCann, S., & Roulston, C. L. (2013) · Brain Sciences · doi:10.3390/brainsci3020561 · Cited by 59
Fan, H., Bai, Q., Yang, Y., Shi, X., Du, G., Yan, J., Shi, J., & Wang, D. (2023) · European Journal of Pharmacology · doi:10.1016/j.ejphar.2023.175966 · Cited by 57
Lelli, A., Gervais, A., Colin, C., Chéret, C., de Almodóvar, C. R., Carmeliet, P., Krause, K., Boillée, S., & Mallat, M. (2013) · Glia · doi:10.1002/glia.22540 · Cited by 60
Self-citationBone marrow-derived mesenchymal stem cells modulate BV2 microglia responses to lipopolysaccharide
Ooi, Y. Y., Ramasamy, R., Rahmat, Z., Subramaiam, H., Tan, S. W., Abdullah, M., Israf, D. A., & Vidyadaran, S. (2010) · International Immunopharmacology · doi:10.1016/j.intimp.2010.09.001 · Cited by 55
Huang, W.-Y., Lin, S., Chen, H.-Y., Chen, Y., Chen, T.-Y., Hsu, K., & Wu, H. (2018) · Journal of Neuroinflammation · doi:10.1186/s12974-018-1186-5 · Cited by 54
Metadata
- Authors
- Chéret, C., Gervais, A., Lelli, A., Colin, C., Amar, L., Ravassard, P., Mallet, J., Cumano, A., Krause, K.-H., & Mallat, M.
- Affiliations
- Inserm (FR)
- Centre National de la Recherche Scientifique (FR)
- University of Geneva (CH)
- Venue
- The Journal of Neuroscience
- Publisher
- Society for Neuroscience
- Published
- 2008-11-12
- Volume
- 28
- Issue
- 46
- Pages
- 12039-12051
- ISSN
- 0270-6474 (ISSN-L)
- 1529-2401
- PMC
- PMC6671643
- OpenAlex
- W2091043188
- Cited by
- 225
- References
- 74
- Citations by year
- 2026: 4 · 2025: 9 · 2024: 10 · 2023: 9 · 2022: 9 · 2021: 10 · 2020: 10 · 2019: 6 · 2018: 15 · 2017: 17 · 2016: 20 · 2015: 11 · 2014: 20 · 2013: 18 · 2012: 19
- FWCI
- 8.31
- Type
- journal article
- Language
- en
- Open access
- hybrid
- doi.org
- Licence
- Locations
- Journal of Neuroscience (publishedVersion, cc-by-nc-sa)
- PubMed Central (publishedVersion)
- PubMed (publishedVersion)
- Archive ouverte UNIGE (University of Geneva) (acceptedVersion)
- HAL (submittedVersion, other-oa)
- Archive ouverte UNIGE (University of Geneva) (submittedVersion, cc-by)
- Funders
- Institut National de la Santé et de la Recherche Médicale
- Topics
- Life Sciences › Neuroscience › Neurology › Neuroinflammation and Neurodegeneration Mechanisms
- Life Sciences › Biochemistry, Genetics and Molecular Biology › Molecular Biology › Redox biology and oxidative stress
- Life Sciences › Immunology and Microbiology › Immunology › Neutrophil, Myeloperoxidase and Oxidative Mechanisms
- Keywords
- NOX1, NADPH oxidase, microglia, reactive oxygen species, superoxide, NOX2, neuroinflammation, microglial activation, nitric oxide, inducible nitric oxide synthase, IL-1β, phagosome, lipopolysaccharide, zymosan, striatum, neurotoxicity, presynaptic proteins, diphenyleneiodonium, apocynin
- MeSH terms
- NADPH Oxidase 1, NADPH Oxidase 2, Animals, Corpus Striatum, Cytochrome b Group, Encephalitis, Female, Gliosis, Lipopolysaccharides, Male, Membrane Glycoproteins, Mice, Inbred C57BL, NADH, NADPH Oxidoreductases, Neuropeptides, Neurotoxins, Nitrites, Proteins, Zymosan, Reactive Oxygen Species, Microglia, Mice, Knockout, Oxidative Stress, Inflammation Mediators, NADPH Oxidases, rac GTP-Binding Proteins, rac1 GTP-Binding Protein, Adaptor Proteins, Signal Transducing, Mice
About these checks
Registry, retraction, Cites and statistics results are computed, not judged, with one exception: a printed reference that no index lists is read once by a model before it counts as a citation error. Claims are extracted by a model and kept only when their quote appears verbatim in the text; each cited source is then checked, with a model’s help, for whether it says what the claim relies on. Those verdicts can be wrong — read the claim’s quote and the cited source before relying on one.
A language model drew the claims from the paper on 2026-11-02, under version 3 of the claim definition (model deepseek-v4.1-flash, prompt extract-v3).
A second model labelled each claim on 2026-11-02 (model jev-1.13-20260917, definition revision gold-guideline-v0.2).
Cited sources are checked with a language model’s help (gpt-6-sol).
Statistics and arithmetic are recomputed, not judged.
Confidence bands are shown only for fields calibrated on our annotated test set. None is calibrated yet, so no band is shown.
What counts as a claim ›How we measure confidence ›How we check this ›
Are you an author, or do you see a problem with this page? Request a review
