

Consumer-Based Wearable Activity Trackers Increase Physical Activity Participation: Systematic Review and Meta-Analysis
Open accessPublished version of a preprint
The DOI matches its Crossref record; 99 of the 99 references it cites were found in a registry or an index; 139 of the 166 sources its claims cite were checked for support.
Abstract
Background: The range of benefits associated with regular physical activity participation is irrefutable. Despite the well-known benefits, physical inactivity remains one of the major contributing factors to ill-health throughout industrialized countries. Traditional lifestyle interventions such as group education or telephone counseling are effective at increasing physical activity participation; however, physical activity levels tend to decline over time. Consumer-based wearable activity trackers that allow users to objectively monitor activity levels are now widely available and may offer an alternative method for assisting individuals to remain physically active. Objective: This review aimed to determine the effects of interventions utilizing consumer-based wearable activity trackers on physical activity participation and sedentary behavior when compared with interventions that do not utilize activity tracker feedback. Methods: A systematic review was performed searching the following databases for studies that included the use of a consumer-based wearable activity tracker to improve physical activity participation: Cochrane Controlled Register of Trials, MEDLINE, PubMed, Scopus, Web of Science, Cumulative Index of Nursing and Allied Health Literature, SPORTDiscus, and Health Technology Assessments. Controlled trials of adults comparing the use of a consumer-based wearable activity tracker with other nonactivity tracker–based interventions were included. The main outcome measures were physical activity participation and sedentary behavior. All studies were assessed for risk of bias, and the Grades of Recommendation, Assessment, Development, and Evaluation system was used to rank the quality of evidence. The guidelines of the Preferred Reporting Items for Systematic Reviews and Meta-Analyses statement were followed. A random-effects meta-analysis was completed on the included outcome measures to estimate the treatment effect of interventions that included an activity tracker compared with a control group. Results: There was a significant increase in daily step count (standardized mean difference [SMD] 0.24; 95% CI 0.16 to 0.33; P<.001), moderate and vigorous physical activity (SMD 0.27; 95% CI 0.15 to 0.39; P<.001), and energy expenditure (SMD 0.28; 95% CI 0.03 to 0.54; P=.03) and a nonsignificant decrease in sedentary behavior (SMD −0.20; 95% CI −0.43 to 0.03; P=.08) following the intervention versus control comparator across all studies in the meta-analyses. In general, included studies were at low risk of bias, except for performance bias. Heterogeneity varied across the included meta-analyses ranging from low (I2=3%) for daily step count through to high (I2=67%) for sedentary behavior. Conclusions: Utilizing a consumer-based wearable activity tracker as either the primary component of an intervention or as part of a broader physical activity intervention has the potential to increase physical activity participation. As the effects of physical activity interventions are often short term, the inclusion of a consumer-based wearable activity tracker may provide an effective tool to assist health professionals to provide ongoing monitoring and support.
Overview
CoChat Summary
TL;DR
This systematic review and meta-analysis found that interventions using consumer-based wearable activity trackers increased physical activity participation versus non-tracker controls, with significant effects on daily steps, moderate-to-vigorous physical activity (MVPA), and energy expenditure, but not sedentary behavior. Evidence quality was rated low to very low.
Key findings
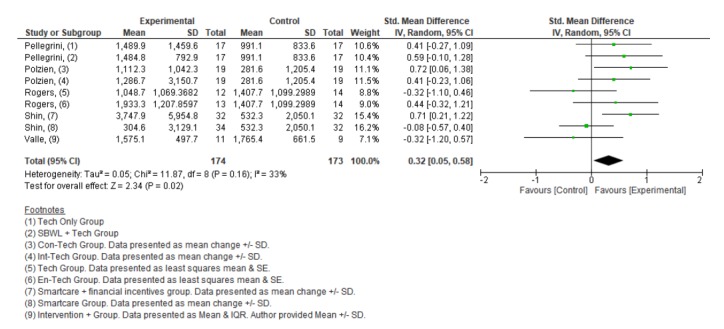
- Across 28 randomized controlled trials (3646 participants, 9 countries), the Results section reports significant increases versus control for daily steps (SMD 0.23; 95% CI 0.15–0.32; P<.001; ~627 steps/day), MVPA (SMD 0.28; 95% CI 0.14–0.41; P<.001; ~75 min/day), and energy expenditure (SMD 0.32; 95% CI 0.05–0.58; P=.02; ~300 kcal/week). The abstract reports slightly different SMDs for these outcomes (0.24, 0.27, and 0.28, respectively).
- Sedentary behavior showed a nonsignificant decrease (SMD −0.21; 95% CI −0.46 to 0.03; P=.09; ~37 min/day less), with moderate significant heterogeneity (I2=60%, P=.02); the abstract reports SMD −0.20, P=.08.
- Subgroup analyses found larger effects for multifaceted interventions than wearable-based-only interventions for steps (SMD 0.26 vs 0.20) and MVPA (SMD 0.33 vs 0.17, the latter nonsignificant); for sedentary behavior, wearable-based interventions showed a larger but nonsignificant decrease (SMD −0.60 vs −0.08).
- Quality of evidence was low for daily steps and energy expenditure and very low for MVPA and sedentary behavior; all studies were assessed as high risk of performance bias because blinding was not feasible.
Methods
- Systematic review and random-effects meta-analysis following PRISMA; databases searched from inception to March 15, 2017 included CENTRAL, MEDLINE, PubMed, Scopus, Web of Science, CINAHL, SPORTDiscus, and Health Technology Assessment.
- Included controlled trials of adults aged over 18 years comparing a consumer-based wearable activity tracker intervention with a non-tracker control; 28 RCTs were included, with 26 studies in the meta-analyses.
- Outcomes analyzed as standardized mean differences (SMD) for daily step count, MVPA, energy expenditure, and sedentary behavior; risk of bias was assessed across 7 domains and GRADE was used to rate evidence quality.
Limitations
- The paper states that the broad range of included interventions, comparators, populations, and settings created indirectness and heterogeneity, lowering the overall quality of evidence; comparator interventions also differed greatly, making synthesis difficult.
- The paper states that blinding of participants and personnel was not feasible, so all studies were at high risk of performance bias; publication bias could not be assessed for outcomes with fewer than 10 included studies.
- The text makes evident an inconsistency between the abstract and Results section for several effect estimates (e.g., steps SMD 0.24 vs 0.23; MVPA 0.27 vs 0.28; energy expenditure 0.28 vs 0.32; sedentary behavior −0.20 vs −0.21), which may complicate interpretation.
Model-written summary. Check it against the paper before relying on it.
Integrity signals
Registry
Cites
Statistics
Figures



Verification
Claims the paper makes
41 Valid · 5 Not valid · 9 Not checked · 82 Own results and interpretations
The cited sources support only part of this claim — read each source’s verdict below.
In the paper
“Blinding of outcome assessors (detection bias) was assessed as high risk for 7 studies [31,43,45-48,52] because of the use of subjective outcome measures.”
§ Consumer-Based Wearable Activity Trackers Increase Physical Activity Participation: Systematic Review and Meta-Analysis > Results > Risk of Bias
What the sources say
- Supportedcites [31] source
The Methods > Outcome measures section (page unavailable) describes this trial’s activity measures as participant-completed logs and questionnaires, and its wellness measure as responses to 103 self-statements. That supports citing this trial as one that used subjective outcome measures; the high-risk rating and count of seven studies are the citing authors’ assessment, not findings attributed to this trial. (LLM, conf=0.88)
- Supportedcites [43] source
The Methods and Procedures > Outcome measures section (page unavailable) describes questionnaire-based measures of physical activity, dietary intake, and eating behaviors, supporting the stated reason for the citing authors’ assessment. The high-risk detection-bias rating is the citing authors’ own assessment, not a rating the source paper needed to make. (LLM, conf=0.85)
- Partly supportedcites [45] sourceExperimental — accuracy not yet measured
The Assessments section (page unavailable) describes self-reported physical activity and questionnaire-based dietary intake, supporting the presence of subjective measures. It also says body weight was measured with a calibrated scale. The paper does not itself assess outcome-assessor blinding or classify the study as high risk of detection bias; that classification is the citing authors’ judgment. (LLM, conf=0.82)
- Supportedcites [46] source
The Methods > Outcome measures section (page unavailable) identifies participant-reported physical activity and questionnaire-based dietary intake and eating behaviors as outcomes, supporting this paper's inclusion among studies using subjective outcome measures. The high-risk detection-bias rating is the citing authors' assessment, not a finding attributed to this trial. (LLM, conf=0.86)
- Supportedcites [47] source
The Abstract describes this as an open-label randomized trial. The Measures and follow-up section lists questionnaire-based physical activity and diet measures, supporting its identification as a study with subjective outcome measures. The high-risk designation is the citing review’s assessment, not a finding the trial itself needs to report. (LLM, conf=0.85)
- Supportedcites [48] source
The Methods (Measurements; page unavailable) describe the primary physical-activity outcome as a participant-completed questionnaire. The Discussion (Limitations; page unavailable) explicitly says the primary outcome and some secondary outcomes were self-reported and prone to misreporting. This supports including this trial among studies using subjective outcome measures; the high-risk classification is the citing authors’ assessment. (LLM, conf=0.88)
- Partly supportedcites [52] sourceExperimental — accuracy not yet measured
The Discussion (page unavailable) identifies a lack of blinded outcome assessors as a limitation and says self-reported measures could bias some outcomes. The Methods > Measures section (page unavailable) also describes objectively measured outcomes, including weight. The paper therefore supports concerns about blinding and subjective measures in this trial, but it does not assess seven studies as high risk or say that its lack of blinding was high risk specifically because of subjective outcomes. (LLM, conf=0.86)
plain- Asserted: passes — The authors put it forward as true.
- Checkable: passes — It can be checked against evidence.
- Load-bearing: unclear — It is unclear whether the paper’s conclusions depend on it.
- Based: passes — The paper gives a reason why it holds.
- Supported
The cited sources support only part of this claim — read each source’s verdict below.
In the paper
“Randomized controlled trials have shown that these devices have promise in relation to increasing physical activity participation [21,22]”
§ Consumer-Based Wearable Activity Trackers Increase Physical Activity Participation: Systematic Review and Meta-Analysis > Introduction > Wearable Activity Trackers
What the sources say
- Supportedcites [21] source
The Results report increased physical activity in the Fitbit group, and the Discussion describes the Fitbit-based intervention as associated with increased activity. The Discussion also notes that between-group differences were not statistically significant and that the sample was small; the citing sentence’s cautious phrase “have promise” is consistent with those limits. (LLM, conf=0.90)
- Partly supportedcites [22] sourceExperimental — accuracy not yet measured
The Results > Mobility and Pain section (page unavailable) reports a significantly greater increase in daily steps in the intervention group, supporting the claim that this approach has promise. However, the Methods > Study Design section shows that patients received both a wearable tracker and a smartphone app, while the comparison group also wore a tracker without access to its data. The trial therefore does not establish an effect of consumer wearable trackers alone, and its participants were patients with knee osteoarthritis rather than a general population. (LLM, conf=0.86)
hedgedstates a possible cause- Asserted: passes — The authors put it forward as true.
- Checkable: passes — It can be checked against evidence.
- Load-bearing: passes — The paper’s conclusions depend on it.
- Based: passes — The paper gives a reason why it holds.
- Supported
The sources with a verdict support this claim; the rest weren’t checked yet, have no full text we could read, or their verdicts aren’t rated yet.
In the paper
“however, evidence regarding their long-term effectiveness is limited [15-17].”
§ Consumer-Based Wearable Activity Trackers Increase Physical Activity Participation: Systematic Review and Meta-Analysis > Introduction > Traditional Interventions to Increase Physical Activity Participation
What the sources say
- Supportedcites [15] source
The Authors’ Conclusions (Implications for practice) state that there is “only very limited evidence” of the long-term effectiveness of physical-activity interventions. The Discussion likewise says their long-term effectiveness is not established because most studies stopped after 12 months. (LLM, conf=0.90)
- Not checked — no full text of the sourcecites [16] source
- Not checked — no full text of the sourcecites [17] van der Bij, AK, 2002, Am J Prev Med source
plain- Asserted: passes — The authors put it forward as true.
- Checkable: passes — It can be checked against evidence.
- Load-bearing: passes — The paper’s conclusions depend on it.
- Based: passes — The paper gives a reason why it holds.
- Supported
Every source the paper cites for this claim was checked and supports it.
In the paper
“In addition, these types of interventions are often labor and resource intensive [18].”
§ Consumer-Based Wearable Activity Trackers Increase Physical Activity Participation: Systematic Review and Meta-Analysis > Introduction > Traditional Interventions to Increase Physical Activity Participation
What the sources say
- Supportedcites [18] Coughlin, SS, 2016, J Environ Health Sci source
The Introduction says established physical-activity and weight-loss interventions are resource-intensive and time-consuming. This directly supports the claim about traditional lifestyle interventions. (LLM, conf=0.94)
plain- Asserted: passes — The authors put it forward as true.
- Checkable: passes — It can be checked against evidence.
- Load-bearing: passes — The paper’s conclusions depend on it.
- Based: passes — The paper gives a reason why it holds.
- Supported
The cited sources support only part of this claim — read each source’s verdict below.
In the paper
“Interventions utilizing these methods have shown to be effective at increasing physical activity participation in the short term [12,14]”
§ Consumer-Based Wearable Activity Trackers Increase Physical Activity Participation: Systematic Review and Meta-Analysis > Introduction > Traditional Interventions to Increase Physical Activity Participation
What the sources say
- Partly supportedcites [12] sourceExperimental — accuracy not yet measured
The Conclusion reports that combined diet and physical activity interventions produced clinically meaningful HbA1c reductions at 3 and 6 months, supporting short-term effectiveness in adults with type 2 diabetes. It does not establish that the interventions increased physical activity participation; the reported outcome is glycaemic control. (LLM, conf=0.84)
- Not checked — no full text of the sourcecites [14] source
plainstates a cause- Asserted: passes — The authors put it forward as true.
- Checkable: passes — It can be checked against evidence.
- Load-bearing: unclear — It is unclear whether the paper’s conclusions depend on it.
- Based: passes — The paper gives a reason why it holds.
- Partly supported
53 more claims · 6 with their cited sources checked
Create a free account to see all 137 claims and to verify the 1 reference still open.
- Probably not a substantial claim. 54
- It may state two separate claims as one. 39
Claims other papers make about this one
Each is checked against this paper’s own text: does it say what the citing paper says it does?
The source backs part of the claim, not all of it — or backs it for a different population, condition or comparison.
In the citing paper
“They showed that the multifaceted interventions yielded effects around 50% larger than those using wearable activity trackers alone.”
From Effectiveness of wearable activity trackers to increase physical activity and improve health: a systematic review of systematic reviews and meta-analyses. (2022) · cites this paper as [8]
Experimental — accuracy not yet measuredThe cited source says what the claim attributes to it.
In the citing paper
“This is in contrast with a systematic review that showed a positive effect for CWATs, even when interventions were separated into CWAT-only and multifaceted interventions [74].”
The cited source says what the claim attributes to it.
In the citing paper
“However, a larger effect size for interventions that were multifaceted was found compared to CWAT-only interventions.”
The cited source says what the claim attributes to it.
In the citing paper
“their use has been associated with increased physical activity.[7][8][9]”
The cited source says what the claim attributes to it.
In the citing paper
“For step count, three meta-analyses of consumer activity trackers reported effect sizes 8,55,66 ranging from 0•23 (95% CI 0•15 to 0•32) to 0•33 (0•16 to 0•50; ie, small effects), all statistically significant (appendix p 35).”
3 more claims about this paper
Create a free account to see every claim other papers make about this one.
Self-check
Percentages, sums and reported differences re-computed from the paper’s own numbers.
Each contradiction between two passages listed here was confirmed by an independent check.
Rated major: it would touch a result — a value a result rests on, reported and recomputed p-values on opposite sides of the significance level, two passages that conflict with no sign which is right, or a cited work retracted before this paper was published.
In the paper
§ Consumer-Based Wearable Activity Trackers Increase Physical Activity Participation: Systematic Review and Meta-Analysis > Results > Physical Activity Participation
“These findings represent an approximate increase of 75 min (95% CI 42 to 109 min) per day of MVPA.”
§ Consumer-Based Wearable Activity Trackers Increase Physical Activity Participation: Systematic Review and Meta-Analysis > Methods > Data Synthesis
“Data presented as minutes of MVPA per day were multiplied by 7 to calculate minutes of MVPA per week to allow for greater transferability to current physical activity guidelines.”
Rated major: it would touch a result — a value a result rests on, reported and recomputed p-values on opposite sides of the significance level, two passages that conflict with no sign which is right, or a cited work retracted before this paper was published.
In the paper
§ Consumer-Based Wearable Activity Trackers Increase Physical Activity Participation: Systematic Review and Meta-Analysis > Abstract > Results
“energy expenditure (SMD 0.28; 95% CI 0.03 to 0.54; P=.03)”
§ Consumer-Based Wearable Activity Trackers Increase Physical Activity Participation: Systematic Review and Meta-Analysis > Results > Physical Activity Participation
“A random effects meta-analysis using SMD performed on the five included studies showed a significant increase in energy expenditure following the intervention versus control comparator (SMD 0.32; 95%CI 0.05 to 0.58; P=.02; Figure 5)”
Rated major: it would touch a result — a value a result rests on, reported and recomputed p-values on opposite sides of the significance level, two passages that conflict with no sign which is right, or a cited work retracted before this paper was published.
In the paper
§ Consumer-Based Wearable Activity Trackers Increase Physical Activity Participation: Systematic Review and Meta-Analysis > Discussion > Principal Findings
“The results show a significant improvement in all measures of physical activity participation when compared with control groups, even when interventions were separated into wearable-based and multifaceted.”
§ Consumer-Based Wearable Activity Trackers Increase Physical Activity Participation: Systematic Review and Meta-Analysis > Results > Physical Activity Participation
“There was a nonsignificant increase in minutes per day spent in MVPA following the intervention versus control comparator (SMD 0.17; 95% CI −0.00 to 0.34; P=.05; Figure 4) across studies included in the wearable-based meta-analysis”
Rated minor: it would not touch a result — a value no result rests on, a p-value that stays on the same side of the significance level, or a conflict that is clerical, resolved elsewhere in the paper, or outside its own findings.
In the paper
§ Consumer-Based Wearable Activity Trackers Increase Physical Activity Participation: Systematic Review and Meta-Analysis > Results > Physical Activity Participation
“Sedentary behavior was objectively measured except for 1 study [38], which utilized a self-reported questionnaire to obtain daily sitting time.”
§ Consumer-Based Wearable Activity Trackers Increase Physical Activity Participation: Systematic Review and Meta-Analysis > Results > Physical Activity Participation
“| Barwais et al, 2013 [31] | Sitting time (hours/day) | 7-day Sedentary and Light Intensity Physical Activity Log | Subjective |”
Rated minor: it would not touch a result — a value no result rests on, a p-value that stays on the same side of the significance level, or a conflict that is clerical, resolved elsewhere in the paper, or outside its own findings.
In the paper
§ Consumer-Based Wearable Activity Trackers Increase Physical Activity Participation: Systematic Review and Meta-Analysis > Abstract > Results
“moderate and vigorous physical activity (SMD 0.27; 95% CI 0.15 to 0.39; P<.001)”
§ Consumer-Based Wearable Activity Trackers Increase Physical Activity Participation: Systematic Review and Meta-Analysis > Results > Physical Activity Participation
“There was a significant increase in minutes per day spent in MVPA following the intervention versus control comparator (SMD 0.28; 95% CI 0.14 to 0.41; P<.001; Figure 4) across all studies in the meta-analysis”
7 more findings
Create a free account to see every finding of this check.
Citations
Cites
Ryan, R. M., & Deci, E. L. (2000) · American Psychologist · doi:10.1037//0003-066x.55.1.68 · Cited by 54,599 · cited 1×
“All studies included some form of behavioral change techniques ranging from basic techniques such as the provision of feedback and goal setting to interventions based on the Coventry, Aberdeen and London-Refined taxonomy [55], social cognitive theory [56], and social determination theory [57].”
Health benefits of physical activity: the evidence
Warburton, D. E. R. (2006) · Canadian Medical Association Journal · doi:10.1503/cmaj.051351 · Cited by 8,007
Global physical activity levels: surveillance progress, pitfalls, and prospects
Hallal, P. C., Andersen, L. B., Bull, F. C., Guthold, R., Haskell, W., & Ekelund, U. (2012) · The Lancet · doi:10.1016/s0140-6736(12)60646-1 · Cited by 5,711
Moral Identity and Developmental Theory
Lapsley, D. (2015) · Human Development · doi:10.1159/000435926 · Cited by 3,819
Sedentary Behavior Research Network (SBRN)—Terminology Consensus Project process and outcome
on behalf of SBRN Terminology Consensus Project Participants, Tremblay, M. S., Aubert, S., Barnes, J. D., Saunders, T. J., Carson, V., Latimer-Cheung, A. E., Chastin, S. F. M., Altenburg, T. M., & Chinapaw, M. J. M. (2017) · International Journal of Behavioral Nutrition and Physical Activity · doi:10.1186/s12966-017-0525-8 · Cited by 3,793
Lee, P. H., Macfarlane, D. J., Lam, T., & Stewart, S. M. (2011) · International Journal of Behavioral Nutrition and Physical Activity · doi:10.1186/1479-5868-8-115 · Cited by 3,370 · cited 1×
“Although the use of these types of questionnaires is widely accepted, self-reported questionnaires have been shown to be less robust in measuring energy expenditure and MVPA when compared with objective measures [98,99].”
Biswas, A., Oh, P. I., Faulkner, G. E., Bajaj, R. R., Silver, M. A., Mitchell, M. S., & Alter, D. A. (2015) · Annals of Internal Medicine · doi:10.7326/m14-1651 · Cited by 2,726 · cited 1×
“In addition, sedentary behavior, which is defined as any waking behavior while in a sitting, reclining, or lying position [7], is independently associated with poor health outcomes, including all-cause and cardiovascular disease mortality [8,9].”
The role and interpretation of pilot studies in clinical research
Leon, A. C., Davis, L. L., & Kraemer, H. C. (2011) · Journal of Psychiatric Research · doi:10.1016/j.jpsychires.2010.10.008 · Cited by 1,917 · cited 1×
“Potential reasons why other included studies did not find a significant intervention effect or observed a reduction in physical activity participation may be because of several of the studies being pilot studies [29,30,40,47,52], which often have insufficient power because of small sample sizes [93]; a moderate-to-hig…”
Bandura, A. (2008) · The International Encyclopedia of Communication · doi:10.1002/9781405186407.wbiecs053 · Cited by 1,902
Michie, S., Ashford, S., Sniehotta, F. F., Dombrowski, S. U., Bishop, A., & French, D. P. (2011) · Psychology & Health · doi:10.1080/08870446.2010.540664 · Cited by 1,756 · cited 1×
“All studies included some form of behavioral change techniques ranging from basic techniques such as the provision of feedback and goal setting to interventions based on the Coventry, Aberdeen and London-Refined taxonomy [55], social cognitive theory [56], and social determination theory [57].”
Research works printed but not linked: 3
- Higgins, JT, 2011, Cochrane Handbook for Systematic Reviews of Interventions Version 5.1.0
- Fu, R, 2013, Handling continuous outcomes in quantitative synthesis. Methods guide for comparative effectiveness reviews
- Schunemann, H, 2015, The GRADE Working Group, 2013
Cited by
2021 ESC Guidelines on cardiovascular disease prevention in clinical practice
Visseren, F. L. J., Mach, F., Smulders, Y. M., Carballo, D., Koskinas, K. C., Bäck, M., Benetos, A., Biffi, A., Boavida, J.-M., Capodanno, D., et al. (2021) · European Heart Journal · doi:10.1093/eurheartj/ehab484 · Cited by 6,485
2023 ESC guidelines for the management of cardiovascular disease in patients with diabetes.
Marx, N., Federici, M., Schütt, K., Müller-Wieland, D., Ajjan, R. A., Antunes, M. J., Christodorescu, R. M., Crawford, C., Di Angelantonio, E., Eliasson, B., et al. (2023) · European Heart Journal · doi:10.1093/eurheartj/ehad192 · Cited by 1,642
2021 ESC Guidelines on cardiovascular disease prevention in clinical practice
Visseren, F. L. J., Mach, F., Smulders, Y. M., Carballo, D., Koskinas, K. C., Bäck, M., Benetos, A., Biffi, A., Boavida, J.-M., Capodanno, D., et al. (2022) · European Journal of Preventive Cardiology · doi:10.1093/eurjpc/zwab154 · Cited by 542
Ferguson, T., Olds, T., Curtis, R., Blake, H., Crozier, A. J., Dankiw, K., Dumuid, D., Kasai, D., O'Connor, E., Virgara, R., et al. (2022) · The Lancet Digital Health · doi:10.1016/s2589-7500(22)00111-x · Cited by 605
A Survey on Wearable Technology: History, State-of-the-Art and Current Challenges
Ometov, A., Shubina, V., Klus, L., Skibińska, J., Saafi, S., Pascacio, P., Flueratoru, L., Gaibor, D. Q., Chukhno, N., Chukhno, O., et al. (2021) · Computer Networks · doi:10.1016/j.comnet.2021.108074 · Cited by 506
Bushnell, C., Kernan, W. N., Sharrief, A. Z., Chaturvedi, S., Cole, J. W., Cornwell, W. K., Cosby-Gaither, C., Doyle, S., Goldstein, L. B., Lennon, O., et al. (2024) · Stroke · doi:10.1161/str.0000000000000475 · Cited by 360
Laranjo, L., Ding, D., Heleno, B., Kocaballi, B., Quiroz, J. C., Tong, H. L., Chahwan, B., Neves, A. L., Gabarron, E., Dao, K. P., et al. (2021) · British Journal of Sports Medicine · doi:10.1136/bjsports-2020-102892 · Cited by 400
Wearable Devices in Cardiovascular Medicine
Hughes, A., Shandhi, M. M. H., Master, H., Dunn, J., & Brittain, E. (2023) · Circulation Research · doi:10.1161/circresaha.122.322389 · Cited by 291
Yun, J.-S., & Ko, S.-H. (2021) · Metabolism · doi:10.1016/j.metabol.2021.154838 · Cited by 292
Chandrasekaran, R., Katthula, V., & Moustakas, E. (2020) · Journal of Medical Internet Research · doi:10.2196/22443 · Cited by 278
Fitbit-based interventions for healthy lifestyle outcomes: systematic review and meta-analysis
Ringeval, M., Wagner, G., Denford, J., Paré, G., & Kitsiou, S. (2020) · Journal of Medical Internet Research · doi:10.2196/23954 · Cited by 225
Wearable Devices: Implications for Precision Medicine and the Future of Health Care
Babu, M., Lautman, Z., Lin, X., Sobota, M. H. B., & Snyder, M. P. (2024) · Annual Review of Medicine · doi:10.1146/annurev-med-052422-020437 · Cited by 181
Chaudhry, U. A. R., Wahlich, C., Fortescue, R., Cook, D. G., Knightly, R., & Harris, T. (2020) · International Journal of Behavioral Nutrition and Physical Activity · doi:10.1186/s12966-020-01020-8 · Cited by 193
Franssen, W. M. A., Franssen, G. H. L. M., Spaas, J., Solmi, F., & Eijnde, B. O. (2020) · International Journal of Behavioral Nutrition and Physical Activity · doi:10.1186/s12966-020-00955-2 · Cited by 193
Mönninghoff, A., Kramer, J. N., Hess, A. J., Ismailova, K., Teepe, G. W., Tudor Car, L., Müller-Riemenschneider, F., & Kowatsch, T. (2021) · Journal of Medical Internet Research · doi:10.2196/26699 · Cited by 183
The Influence of Wearables on Health Care Outcomes in Chronic Disease: Systematic Review
Mattison, G., Canfell, O., Forrester, D., Dobbins, C., Smith, D., Töyräs, J., & Sullivan, C. (2022) · Journal of Medical Internet Research · doi:10.2196/36690 · Cited by 171
Xu, L., Shi, H., Shen, M., Ni, Y., Zhang, X., Pang, Y., Yu, T., Lian, X., Yu, T., Yang, X., et al. (2022) · JMIR mHealth and uHealth · doi:10.2196/27794 · Cited by 161
Wearable inertial sensors for human movement analysis: a five-year update
Picerno, P., Iosa, M., D’Souza, C., Benedetti, M. G., Paolucci, S., & Morone, G. (2021) · Expert Review of Medical Devices · doi:10.1080/17434440.2021.1988849 · Cited by 174
Fitch, A., & Bays, H. E. (2022) · Obesity Pillars · doi:10.1016/j.obpill.2021.100004 · Cited by 163
Tang, M. S. S., Moore, K., McGavigan, A., Clark, R. A., & Ganesan, A. N. (2020) · JMIR mhealth and uhealth · doi:10.2196/15576 · Cited by 134
Johnston, W., Júdice, P. B., Molina‐García, P., Mühlen, J. M., Skovgaard, E. L., Stang, J. S., Schumann, M., Cheng, S., Bloch, W., Brønd, J. C., et al. (2020) · British Journal of Sports Medicine · doi:10.1136/bjsports-2020-103147 · Cited by 140
Singh, B., Zopf, E. M., & Howden, E. J. (2021) · Journal of sport and health science/Journal of Sport and Health Science · doi:10.1016/j.jshs.2021.07.008 · Cited by 138
Kwan, R. Y. C., Lee, D., Lee, P. H., Tse, M. Y. M., Cheung, D. S. K., Thiamwong, L., & Choi, K. (2020) · JMIR mhealth and uhealth · doi:10.2196/16596 · Cited by 134
Hodkinson, A., Kontopantelis, E., Adeniji, C., van Marwijk, H., McMillian, B., Bower, P., & Panagioti, M. (2021) · JAMA Network Open · doi:10.1001/jamanetworkopen.2021.16382 · Cited by 127
The Use of Wearables in Clinical Trials During Cancer Treatment: Systematic Review
Beauchamp, U. L., Pappot, H., & Holländer-Mieritz, C. (2020) · JMIR mHealth and uHealth · doi:10.2196/22006 · Cited by 110
Wearables in cardiology: Here to stay
Dagher, L., Shi, H., Zhao, Y., & Marrouche, N. F. (2020) · Heart Rhythm · doi:10.1016/j.hrthm.2020.02.023 · Cited by 107
Lang, C. E., Barth, J., Holleran, C. L., Konrad, J. D., & Bland, M. D. (2020) · Sensors · doi:10.3390/s20205744 · Cited by 117
Handelsman, Y., Butler, J., Bakris, G. L., DeFronzo, R. A., Fonarow, G. C., Green, J. B., Grunberger, G., Januzzi, J. L., Klein, S., Kushner, P. R., et al. (2023) · Journal of Diabetes and its Complications · doi:10.1016/j.jdiacomp.2022.108389 · Cited by 118
Effectiveness of physical activity monitors in adults: systematic review and meta-analysis
Larsen, R. T., Wagner, V., Korfitsen, C. B., Keller, C., Juhl, C. B., Langberg, H., & Christensen, J. (2022) · BMJ · doi:10.1136/bmj-2021-068047 · Cited by 115
Nieste, I., Franssen, W. M. A., Spaas, J., Bruckers, L. M., Savelberg, H. H. C. M., & Eijnde, B. O. (2021) · Preventive Medicine · doi:10.1016/j.ypmed.2021.106593 · Cited by 105
Creaser, A. V., Clemes, S. A., Costa, S., Hall, J., Ridgers, N. D., Barber, S., & Bingham, D. D. (2021) · International Journal of Environmental Research and Public Health · doi:10.3390/ijerph18126211 · Cited by 112
Handelsman, Y., Anderson, J. E., Bakris, G. L., Ballantyne, C. M., Bhatt, D. L., Bloomgarden, Z. T., Bozkurt, B., Budoff, M. J., Butler, J., Cherney, D. Z. I., et al. (2024) · Metabolism · doi:10.1016/j.metabol.2024.155931 · Cited by 103
Liu, J. Y. W., Kor, P. P. K., Chan, C. P.-Y., Kwan, R. Y. C., & Cheung, D. S. K. (2020) · Archives of Gerontology and Geriatrics · doi:10.1016/j.archger.2020.104211 · Cited by 96
Casado-Robles, C., Viciana, J., Guijarro-Romero, S., & Mayorga-Vega, D. (2022) · Sports Medicine - Open · doi:10.1186/s40798-021-00407-6 · Cited by 106
Wang, W., Cheng, J., Song, W., & Shen, Y. (2022) · JMIR mhealth and uhealth · doi:10.2196/32435 · Cited by 106
Wearable Devices to Improve Physical Activity and Reduce Sedentary Behaviour: An Umbrella Review
Longhini, J., Marzaro, C., Bargeri, S., Palese, A., Dell’Isola, A., Turolla, A., Pillastrini, P., Battista, S., Castellini, G., Cook, C. E., et al. (2024) · Sports Medicine - Open · doi:10.1186/s40798-024-00678-9 · Cited by 109
Lugones-Sanchez, C., Recio-Rodriguez, J. I., Agudo-Conde, C., Repiso-Gento, I., G Adalia, E., Ramirez-Manent, J. I., Sanchez-Calavera, M. A., Rodriguez-Sanchez, E., Gomez-Marcos, M. A., Garcia-Ortiz, L., et al. (2022) · Journal of Medical Internet Research · doi:10.2196/30416 · Cited by 85
“…interventions are effective for increasing physical activity among chronic disease populations [20], making activity tracker wristbands a good option for inclusion in lifestyle interventions, as wearable activity trackers have the potential to increase physical activity participation [21].”
World Heart Federation Roadmap for Digital Health in Cardiology
Tromp, J., Jindal, D., Redfern, J., Bhatt, A. B., Séverin, T., Banerjee, A., Ge, J., Itchhaporia, D., Jaarsma, T., Lanas, F. T., et al. (2022) · Global Heart · doi:10.5334/gh.1141 · Cited by 96
Guía ESC 2021 sobre la prevención de la enfermedad cardiovascular en la práctica clínica
Visseren, F. L. J., Mach, F., Smulders, Y. M., Carballo, D., Koskinas, K. C., Bäck, M., Bénétos, A., Biffi, A., Boavida, J. M., Capodanno, D., et al. (2022) · Revista Española de Cardiología · doi:10.1016/j.recesp.2021.10.016 · Cited by 123
Habit Formation in Wearable Activity Tracker Use Among Older Adults: Qualitative Study
Peng, W., Li, L., Kononova, A. G., Cotten, S. R., Kamp, K., & Bowen, M. (2020) · JMIR mhealth and uhealth · doi:10.2196/22488 · Cited by 87
Au, W. W., Recchia, F., Fong, D., Wong, S. H., Chan, D. K. C., Capio, C. M., Yu, C. C.-W., Wong, S. W. S., Sit, C. H. P., Ip, P., et al. (2024) · The Lancet Digital Health · doi:10.1016/s2589-7500(24)00139-0 · Cited by 96
Digital biomarkers: 3PM approach revolutionizing chronic disease management — EPMA 2024 position
Smokovski, I., Steinle, N., Behnke, A., Bhaskar, S. M. M., Grech, G., Richter, K., Niklewski, G., Birkenbihl, C., Parini, P., Andrews, R. J., et al. (2024) · The EPMA Journal · doi:10.1007/s13167-024-00364-6 · Cited by 88
Wearable activity trackers for promoting physical activity: A systematic meta-analytic review
Li, C., Chen, X., & Bi, X. (2021) · International Journal of Medical Informatics · doi:10.1016/j.ijmedinf.2021.104487 · Cited by 85
Digital Health Innovations to Improve Cardiovascular Disease Care
Santo, K., & Redfern, J. (2020) · Current Atherosclerosis Reports · doi:10.1007/s11883-020-00889-x · Cited by 83
Tailored physical activity behavior change interventions: challenges and opportunities
Ma, J. K., Floegel, T. A., LI, L. C., Leese, J., Vera, M. A. D., Beauchamp, M. R., Taunton, J., Liu-Ambrose, T. Y. L., & Allen, K. D. (2021) · Translational Behavioral Medicine · doi:10.1093/tbm/ibab106 · Cited by 80
Vetrovsky, T., Borowiec, A., Juřík, R., Wahlich, C., Śmigielski, W., Steffl, M., Tufano, J. J., Drygas, W., Stastny, P., Harris, T., et al. (2022) · British Journal of Sports Medicine · doi:10.1136/bjsports-2021-105198 · Cited by 68
Digital Biomarker–Based Studies: Scoping Review of Systematic Reviews
Motahari-Nezhad, H., Fgaier, M., Abid, M. M., Péntek, M., Gulàcsi, L., & Zrubka, Z. (2022) · JMIR mhealth and uhealth · doi:10.2196/35722 · Cited by 75
Muggeridge, D. J., Hickson, K. A., Davies, A. V., Giggins, O. M., Megson, I. L., Gorely, T., & Crabtree, D. R. (2021) · JMIR mhealth and uhealth · doi:10.2196/25313 · Cited by 76
Zahrt, O. H., Evans, K. M., Murnane, E. L., Santoro, E., Baiocchi, M., Landay, J. A., Delp, S. L., & Crum, A. J. (2022) · Journal of Medical Internet Research · doi:10.2196/40529 · Cited by 73
Handelsman, Y., Anderson, J. E., Bakris, G. L., Ballantyne, C. M., Beckman, J. A., Bhatt, D. L., Bloomgarden, Z. T., Bozkurt, B., Budoff, M. J., Butler, J., et al. (2022) · Journal of Diabetes and its Complications · doi:10.1016/j.jdiacomp.2021.108101 · Cited by 64
“23 Ambulatory and home BP monitoring can help distinguish between normotension and masked hypertension and between white coat and sustained hypertension.”
Paolillo, E. W., Lee, S. Y., VandeBunte, A. M., Djukic, N. A., Fonseca, C. S., Kramer, J. H., & Casaletto, K. B. (2022) · Frontiers in Digital Health · doi:10.3389/fdgth.2022.884208 · Cited by 77
Smartphone applications for physical activity promotion from physical education
Gil‐Espinosa, F. J., Rodríguez, A. N., Romance, R., & Burgueño, R. (2022) · Education and Information Technologies · doi:10.1007/s10639-022-11108-2 · Cited by 62
Alexander, L., Christensen, S. M., Richardson, L., Ingersoll, A. B., Burridge, K., Golden, A., Karjoo, S., Cortez, D., Shelver, M., & Bays, H. E. (2022) · Obesity Pillars · doi:10.1016/j.obpill.2021.100005 · Cited by 61
Degroote, L., Hamerlinck, G., Poels, K., Maher, C., Crombez, G., De Bourdeaudhuij, I., Vandendriessche, A., Curtis, R. G., & DeSmet, A. (2020) · JMIR mhealth and uhealth · doi:10.2196/16674 · Cited by 60
Hutchesson, M. J., Gough, C., Müller, A. M., Short, C. E., Whatnall, M. C., Ahmed, M., Pearson, N., Yin, Z., Ashton, L. M., Maher, C., et al. (2021) · Obesity Reviews · doi:10.1111/obr.13295 · Cited by 60
Why Users Comply with Wearables: The Role of Contextual Self-Efficacy in Behavioral Change
Rieder, A., Eseryel, U. Y., Lehrer, C., & Jung, R. (2020) · International Journal of Human-Computer Interaction · doi:10.1080/10447318.2020.1819669 · Cited by 77
Lynch, C., Bird, S., Lythgo, N., & Selva-Raj, I. (2020) · American Journal of Health Promotion · doi:10.1177/0890117119895204 · Cited by 58
Smartwatch interventions in healthcare: A systematic review of the literature
Triantafyllidis, A. K., Kondylakis, H., Katehakis, D. G., Kouroubali, A., Alexiadis, A., Segkouli, S., Votis, K., & Tzovaras, D. K. (2024) · International Journal of Medical Informatics · doi:10.1016/j.ijmedinf.2024.105560 · Cited by 75
Blair, C. K., Harding, E., Wiggins, C. L., Kang, H., Schwartz, M., Tarnower, A. C., Du, R., & Kinney, A. Y. (2021) · JMIR Cancer · doi:10.2196/18819 · Cited by 64
Sousa, A. C., Ferrinho, S. N., & Travassos, B. F. R. (2023) · International Journal of Environmental Research and Public Health · doi:10.3390/ijerph20043402 · Cited by 73
Hodkinson, A., Kontopantelis, E., Adeniji, C., van Marwijk, H., McMillan, B., Bower, P., & Panagioti, M. (2019) · JAMA Network Open · doi:10.1001/jamanetworkopen.2019.12895 · Cited by 55
RetractedDoherty, C., Baldwin, M., Lambe, R., Altini, M., & Caulfield, B. (2025) · npj Digital Medicine · doi:10.1038/s41746-025-01757-1 · Cited by 55
Polar Vantage and Oura Physical Activity and Sleep Trackers: Validation and Comparison Study
Henriksen, A., Svartdal, F., Grimsgaard, S., Hartvigsen, G., & Hopstock, L. A. (2022) · JMIR Formative Research · doi:10.2196/27248 · Cited by 63
Musculoskeletal Pain: Current and Future Directions of Physical Therapy Practice
Fullen, B. M., Wittink, H. M., Groef, A. D., Hoegh, M., McVeigh, J. G., Martin, D., & Smart, K. M. (2023) · Archives of Rehabilitation Research and Clinical Translation · doi:10.1016/j.arrct.2023.100258 · Cited by 84
Constantinescu, D. S., Pavlis, W., Rizzo, M. G., Berge, D. V., Barnhill, S. W., & Hernandez, V. H. (2022) · EFORT Open Reviews · doi:10.1530/eor-21-0115 · Cited by 57
Ross, G. M. S., Zhao, Y., Bosman, A. J., Geballa-Koukoula, A., Zhou, H., Elliott, C. T., Nielen, M. W. F., Rafferty, K., & Salentijn, G. I. (2022) · TrAC Trends in Analytical Chemistry · doi:10.1016/j.trac.2022.116863 · Cited by 65
Electronic wearable device and physical activity among US adults: An analysis of 2019 HINTS data
Xie, Z., Jo, A., & Hong, Y. (2020) · International Journal of Medical Informatics · doi:10.1016/j.ijmedinf.2020.104297 · Cited by 57
Behavior Change Techniques Incorporated in Fitness Trackers: Content Analysis
Chia, G. L. C., Anderson, A., & McLean, L. A. (2019) · JMIR mHealth and uHealth · doi:10.2196/12768 · Cited by 50
Lewis, Z. H., Pritting, L., Picazo, A.-L. L., & JeanMarie-Tucker, M. (2020) · Digital Health · doi:10.1177/2055207619900059 · Cited by 55
Molina‐García, P., Notbohm, H. L., Schumann, M., Argent, R., Hetherington‐Rauth, M., Stang, J. S., Bloch, W., Cheng, S., Ekelund, U., Sardinha, L. B., et al. (2022) · Sports Medicine · doi:10.1007/s40279-021-01639-y · Cited by 62
Brickwood, K.-J., Ahuja, K., Watson, G., O’Brien, J., & Williams, A. D. (2020) · JMIR mhealth and uhealth · doi:10.2196/18686 · Cited by 52
“Although previous research has suggested that the use of ATs either as part of a broader intervention or as a stand-alone intervention can significantly improve daily step counts [11], this is the first study to investigate the use of ATs to assist in the maintenance of physical activity over a 12-month period followi…”
Self-citationRising, C. J., Gaysynsky, A., Blake, K. D., Jensen, R. E., & Oh, A. (2021) · JMIR mhealth and uhealth · doi:10.2196/29190 · Cited by 57
“Wearables may improve health and behavioral outcomes, such as physical activity participation [1,6] and weight status [7], by prompting users to set health goals, providing automated personalized feedback about health and activity data, motivating healthy habit formation, and encouraging social data sharing and compet…”
Wu, S., Li, G., Du, L., Chen, S., Zhang, X., & He, Q. (2023) · Digital Health · doi:10.1177/20552076231176705 · Cited by 62
Brickwood, K.-J., Williams, A. D., Watson, G., & O’Brien, J. (2020) · Digital Health · doi:10.1177/2055207620921678 · Cited by 59
Self-citationBehavior Change Techniques in Wrist-Worn Wearables to Promote Physical Activity: Content Analysis
Düking, P., Tafler, M., Wallmann-Sperlich, B., Sperlich, B., & Kleih, S. C. (2020) · JMIR mhealth and uhealth · doi:10.2196/20820 · Cited by 57
Tong, H. L., Maher, C. A., Parker, K. E., Pham, T., Neves, A. L., Riordan, B. C., Chow, C. K., Laranjo, L., & Quiroz, J. C. (2022) · PLOS Digital Health · doi:10.1371/journal.pdig.0000087 · Cited by 54
Rising, C. J., Jensen, R. E., Moser, R. P., & Oh, A. (2020) · Journal of Medical Internet Research · doi:10.2196/16299 · Cited by 50
Kris-Etherton, P. M., Petersen, K. S., Després, J.-P., Braun, L., de Ferranti, S. D., Furie, K. L., Lear, S. A., Lobelo, F., Morris, P. B., Sacks, F. M., et al. (2021) · Circulation · doi:10.1161/cir.0000000000001014 · Cited by 43
Jung, J.-Y., & Cho, I. (2022) · JMIR mhealth and uhealth · doi:10.2196/30682 · Cited by 51
Obesity Hurts: The Why and How of Integrating Weight Reduction With Chronic Pain Management
Malfliet, A., Marnef, A. Q., Nijs, J., Clarys, P., Huybrechts, I., Elma, Ö., Yılmaz, S. T., & Deliens, T. (2021) · Physical Therapy · doi:10.1093/ptj/pzab198 · Cited by 43
Chrononutrition in Cardiometabolic Health
Katsi, V. K., Papakonstantinou, I. P., Σουλαϊδόπουλος, Σ., Katsiki, N., & Tsioufis, K. P. (2022) · Journal of Clinical Medicine · doi:10.3390/jcm11020296 · Cited by 50
Torregrosa, C., Chorin, F., Beltran, E. E. M., Neuzillet, C., & Cardot‐Ruffino, V. (2022) · Cancers · doi:10.3390/cancers14215402 · Cited by 54
Saarikko, J., Niela‐Vilén, H., Ekholm, E. M. K., Hamari, L., Azimi, I., Liljeberg, P., Rahmani, A. M., Löyttyniemi, E., & Axelin, A. (2020) · JMIR Formative Research · doi:10.2196/12417 · Cited by 49
Quantified Self-Using Consumer Wearable Device: Predicting Physical and Mental Health
Pardamean, B., Soeparno, H., Budiarto, A., Mahesworo, B., & Baurley, J. W. (2020) · Healthcare Informatics Research · doi:10.4258/hir.2020.26.2.83 · Cited by 44
Identifying goals in patients with chronic pain: A European survey
Goudman, L., Smedt, A. D., Linderoth, B., Eldabe, S. S., Witkam, R. L., Henssen, D. J. H. A., & Moens, M. (2021) · European Journal of Pain · doi:10.1002/ejp.1814 · Cited by 47
Hinman, R. S., Hall, M., Comensoli, S., & Bennell, K. L. (2022) · Journal of science and medicine in sport · doi:10.1016/j.jsams.2022.11.003 · Cited by 46
Wang, X., Wu, Y., Meng, Z., Li, J., Li, X., Sun, X., & Zang, S. (2023) · Journal of Medical Internet Research · doi:10.2196/44225 · Cited by 41
Lobo, P. L. S., Morais, P., Murray, P., & Vilaça, J. L. (2024) · Sensors · doi:10.3390/s24247973 · Cited by 53
Carrier, B., Barrios, B., Jolley, B. D., & Navalta, J. W. (2020) · Technologies · doi:10.3390/technologies8040070 · Cited by 47
Leigh, J. W., Gerber, B. S., Gans, C. P., Kansal, M. M., & Kitsiou, S. (2021) · JMIR Cardio · doi:10.2196/31982 · Cited by 43
Huffman, K. F., Ambrose, K., Nelson, A. E., Allen, K. D., Golightly, Y. M., & Callahan, L. F. (2023) · The Journal of Rheumatology · doi:10.3899/jrheum.2023-0819 · Cited by 45
Browne, J. D., Boland, D. M., Baum, J. T., Ikemiya, K., Harris, Q., Phillips, M., Neufeld, E. V., Gómez, D., Goldman, P., & Dolezal, B. A. (2021) · Frontiers in Physiology · doi:10.3389/fphys.2021.777874 · Cited by 47
Chan, C., Sounderajah, V., Normahani, P., Acharya, A., Markar, S. R., Darzi, A. W., Bicknell, C. D., & Riga, C. (2021) · European Journal of Vascular and Endovascular Surgery · doi:10.1016/j.ejvs.2020.11.044 · Cited by 38
Knudsen, S. D. P., Alomairah, S. A., Roland, C. B., Jessen, A. D., Hergel, I.-M., Clausen, T. D., Larsen, J. E., van Hall, G., Jensen, A. K., Mølsted, S., et al. (2022) · Journal of Medical Internet Research · doi:10.2196/37699 · Cited by 40
Silver Nanoparticle-Decorated Multiwalled Carbon Nanotube Ink for Advanced Wearable Devices
Pillai, A. S., Chandran, A., & Peethambharan, S. K. (2022) · ACS Applied Materials & Interfaces · doi:10.1021/acsami.2c14482 · Cited by 35
Exercise in Pregnant Women with Diabetes
Peters, T. M., & Brazeau, A. (2019) · Current Diabetes Reports · doi:10.1007/s11892-019-1204-8 · Cited by 40
Health Habits and Wearable Activity Tracker Devices: Analytical Cross-Sectional Study
Tricás-Vidal, H. J., Lucha-López, M. O., Hidalgo-García, C., Vidal-Peracho, M. C., Monti-Ballano, S., & Tricás-Moreno, J. M. (2022) · Sensors · doi:10.3390/s22082960 · Cited by 40
Evaluation of Digital Interventions for Physical Activity Promotion: Scoping Review
Santis, K. K. D., Jahnel, T., Matthias, K., Mergenthal, L., Khayyal, H. A., & Zeeb, H. (2022) · JMIR Public Health and Surveillance · doi:10.2196/37820 · Cited by 45
Idiographic artificial intelligence to explain students' self-regulation: Toward precision education
Saqr, M., Cheng, R., López‐Pernas, S., & Beck, E. D. (2024) · Learning and Individual Differences · doi:10.1016/j.lindif.2024.102499 · Cited by 46
Wang, M., Xu, J., Zhou, X., Li, X., & Zheng, Y. (2025) · JMIR Serious Games · doi:10.2196/68151 · Cited by 50
Metadata
- Authors
- Brickwood, K.-J., Watson, G., O'Brien, J., & Williams, A. D.
- Affiliations
- University of Tasmania (AU)
- Corresponding author
- Brickwood, Katie-Jane
- Venue
- JMIR mHealth and uHealth
- Publisher
- JMIR Publications Inc.
- Published
- 2019-04-12
- Volume
- 7
- Issue
- 4
- Pages
- e11819
- ISSN
- 2291-5222 (ISSN-L)
- PMC
- PMC6484266
- OpenAlex
- W2913335608
- Cited by
- 689
- References
- 99
- Citations by year
- 2026: 96 · 2025: 91 · 2024: 90 · 2023: 100 · 2022: 117 · 2021: 114 · 2020: 65 · 2019: 14
- FWCI
- 10.66
- Type
- journal article
- Language
- en
- Open access
- gold
- doi.org
- Licence
- cc-by
- Locations
- JMIR mhealth and uhealth (publishedVersion, cc-by)
- PubMed Central (publishedVersion, cc-by)
- PubMed (publishedVersion)
- UTAS Research Repository (acceptedVersion)
- Murdoch University Research Portal (submittedVersion, cc-by)
- QUT ePrints (Queensland University of Technology) (submittedVersion, cc-by)
- DOAJ (DOAJ: Directory of Open Access Journals) (submittedVersion, cc-by-sa)
- Figshare (submittedVersion, cc-by)
- Topics
- Health Sciences › Medicine › Public Health, Environmental and Occupational Health › Physical Activity and Health
- Health Sciences › Health Professions › General Health Professions › Mobile Health and mHealth Applications
- Physical Sciences › Computer Science › Computer Vision and Pattern Recognition › Context-Aware Activity Recognition Systems
- Keywords
- wearable activity trackers, physical activity participation, sedentary behavior, step count, moderate-to-vigorous physical activity, energy expenditure, physical inactivity, lifestyle intervention, adults, self-monitoring, performance bias, risk of bias, heterogeneity, quality of evidence, GRADE, risk of bias assessment
- MeSH terms
- Fitness Trackers, Humans, Patient Participation, Quality of Life, Exercise, Sedentary Behavior
About these checks
Registry, retraction, Cites and statistics results are computed, not judged, with one exception: a printed reference that no index lists is read once by a model before it counts as a citation error. Claims are extracted by a model and kept only when their quote appears verbatim in the text; each cited source is then checked, with a model’s help, for whether it says what the claim relies on. Those verdicts can be wrong — read the claim’s quote and the cited source before relying on one.
The claim verdicts this report counts are experimental: their accuracy is not yet measured.
A language model drew the claims from the paper on 2026-10-09, under version 3 of the claim definition (model deepseek-v4.1-flash, prompt extract-v3).
A second model labelled each claim on 2026-10-09 (model jev-1.13-20260917, definition revision gold-guideline-v0.2).
Cited sources are checked with a language model’s help (gpt-6-sol).
Statistics and arithmetic are recomputed, not judged.
Confidence bands are shown only for fields calibrated on our annotated test set. None is calibrated yet, so no band is shown.
What counts as a claim ›How we measure confidence ›How we check this ›
Are you an author, or do you see a problem with this page? Request a review
Data sources
Bibliographic data: Semantic Scholar, OpenAlex, Crossref.
Contains information from the Semantic Scholar Academic Graph Datasets, made available under the ODC Attribution License (ODC-BY 1.0).
Semantic Scholar’s data is described in: Kinney, R., et al. (2023). The Semantic Scholar Open Data Platform. arXiv:2301.10140.
