

The DOI matches its Crossref record; 91 of the 91 references it cites were found in a registry or an index; 3 of the 58 sources its claims cite were checked for support.
The evolution of drug resistance in clinical isolates of Candida albicans.
Open accessAbstract
Candida albicans is both a member of the healthy human microbiome and a major pathogen in immunocompromised individuals. Infections are typically treated with azole inhibitors of ergosterol biosynthesis often leading to drug resistance. Studies in clinical isolates have implicated multiple mechanisms in resistance, but have focused on large-scale aberrations or candidate genes, and do not comprehensively chart the genetic basis of adaptation. Here, we leveraged next-generation sequencing to analyze 43 isolates from 11 oral candidiasis patients. We detected newly selected mutations, including single-nucleotide polymorphisms (SNPs), copy-number variations and loss-of-heterozygosity (LOH) events. LOH events were commonly associated with acquired resistance, and SNPs in 240 genes may be related to host adaptation. Conversely, most aneuploidies were transient and did not correlate with drug resistance. Our analysis also shows that isolates also varied in adherence, filamentation, and virulence. Our work reveals new molecular mechanisms underlying the evolution of drug resistance and host adaptation.
Overview
AI snapshot
Written from the paper’s full text.
TL;DR
Genome sequencing of 43 serial Candida albicans isolates from 11 oral candidiasis patients shows that loss-of-heterozygosity events, not aneuploidies, are commonly associated with acquired azole resistance. The study also identifies 240 recurrently mutated genes and evolved changes in adhesion, filamentation, and virulence.
Key findings
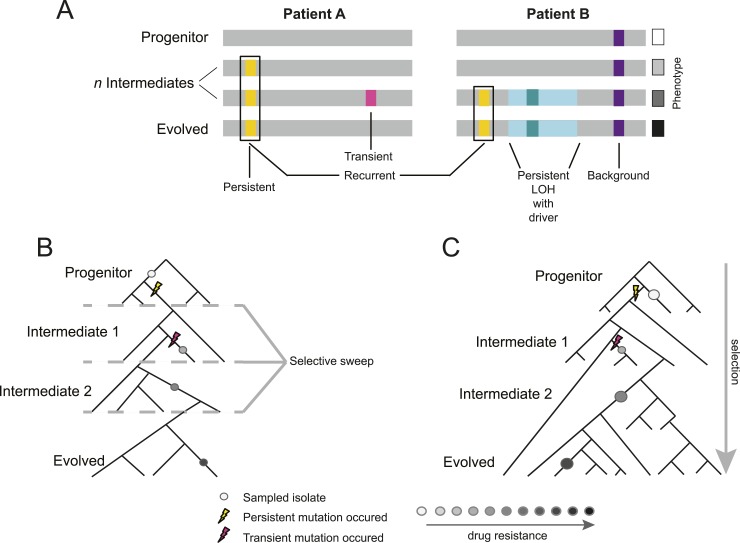
- LOH events were detected in all series, were often persistent and recurrent, and coincided with increased fluconazole MIC; highly recurrent LOH occurred on chromosome 3 right arm (Patients 1, 9, 14, 16, 42, 59; p < 5 × 10⁻⁴) and chromosome 5 left arm (Patients 1, 14, 15, 43; p < 0.01), regions containing CDR1/CDR2/MRR1 and ERG11/TAC1.
- Aneuploidies appeared in at least one isolate from 80% (8/10) of clonal patient series, most often chromosome 5 (6 of 8 patients with an aneuploid isolate), but were mostly transient and did not consistently correlate with MIC changes.
- Persistent nonsynonymous SNPs outside LOH tracts occurred in 1470 genes; applying recurrence across three or more patient series identified 240 polymorphic genes, enriched for fungal-type cell wall (18 genes, p < 0.0012) and cell surface genes (24 genes, p < 0.00012). Polymorphisms in 166 of the 240 genes appeared with an increase in MIC.
- Isolates varied in adherence, filamentation, and virulence; increased in vitro fitness generally correlated with virulence traits, but drug resistance often initially reduced fitness in the absence of drug while increasing fitness in its presence.
Methods
- Illumina paired-end sequencing of 43 colony-purified serial clinical isolates from 11 HIV-infected patients with oropharyngeal candidiasis, plus reference strain SC5314; coverage was 53–283X (103X average). SNP calls were validated by Sequenom iPLEX: 1853/1973 calls concordant (93.9%).
- Genetic analyses included GATK SNP calling, sliding-window LOH detection, copy-number/ploidy analysis with flow cytometry, maximum-parsimony phylogenetics in PAUP*, persistence/recurrence filtering, and NMF clustering of co-occurring mutations.
- Phenotypic assays included fluconazole E-test MICs, in vitro competition fitness with and without fluconazole, C. elegans survival, filamentation on Spider agar, and adhesion; 23 recurrently mutated loci with available homozygous deletion mutants were profiled for MIC and fitness.
Limitations
- Stated: because each clinical sample was purified from a single colony, the study cannot assess population structure at any single time point; formally distinguishing de novo mutation followed by selection from selection on pre-existing variation is not possible with the samples and data at hand; ordering of events cannot be definitively inferred from singly sampled isolates; substantial additional sampling per time point is required to fully interpret fitness patterns.
- Stated: some endpoint-only changes were treated as persistent because several time courses had only two or three isolates.
- Evident: the clonal analysis rests on 10 patient series and 43 isolates, with some series containing only two isolates; deletion-mutant testing covered only 23 loci and used loss-of-function mutants, whereas known fluconazole resistance mechanisms are often gain-of-function.
Model-written summary. Check it against the paper before relying on it.
Integrity signals
Registry
Cites
Statistics
Figures
Verification
Claims the paper makes
61 Own result · 35 Not checked yet · 25 Own interpretation · 5 No basis given · 4 Own method · 2 Partly supported · accuracy not yet measured
The cited sources support only part of this claim — read each source’s verdict below.
In the paper
“Third, C. albicans lab isolates likely undergo a stress-induced elevation of mutation and mitotic recombination rates (Ponder et al., 2005; Forche et al., 2011; Rosenberg, 2011)”
§ The evolution of drug resistance in clinical isolates of Candida albicans > Discussion
What the sources say
- Not checked yetcites Ponder et al., 2005 source
- Partly supportedcites Forche et al., 2011 sourceExperimental — accuracy not yet measured
The Abstract and Results report elevated loss-of-heterozygosity rates in laboratory C. albicans strains exposed to stress, including increased recombination under oxidative stress. The paper does not show that stress elevates point-mutation rates; its discussion compares point-mutation and LOH rates without reporting a stress-induced increase in point mutations. (LLM, conf=0.87)
- Partly supportedcites Rosenberg, 2011 sourceExperimental — accuracy not yet measured
The Commentary reports that stress increased loss of heterozygosity in C. albicans reporter strains and identifies most LOH events as homologous-recombination events. It discusses stress-induced mutagenesis as a likely implication for yeast, but does not report an elevated mutation rate in C. albicans lab isolates. (LLM, conf=0.84)
hedgedconditional- Asserted: passes — The authors put it forward as true.
- Checkable: passes — It can be checked against evidence.
- Load-bearing: passes — The paper’s conclusions depend on it.
- Based: passes — The paper gives a reason why it holds.
The cited sources support only part of this claim — read each source’s verdict below.
In the paper
“whereas the previously identified mechanisms of fluconazole resistance are ‘gain of function’, resulting in the increase in the amount or activity level of Erg11 (Asai et al., 1999; Oliver et al., 2007) or the efflux of drug transporters (Coste et al., 2006; Dunkel et al., 2008).”
§ The evolution of drug resistance in clinical isolates of Candida albicans > Results > Candidate mutated genes associated with drug resistance or virulence
What the sources say
- Partly supportedcites Asai et al., 1999 sourceExperimental — accuracy not yet measured
The paper’s introductory passage lists increased cellular CYP51 (Erg11) content as a proposed fluconazole-resistance mechanism. It does not support increased Erg11 activity as the mechanism in its own isolates: the Discussion reports reduced drug affinity with normal catalytic activity and a lower CYP51 level in DUMC136. (LLM, conf=0.86)
- Not checked yetcites Oliver et al., 2007 source
- Not checked yetcites Coste et al., 2006 source
plaindirect- Asserted: passes — The authors put it forward as true.
- Checkable: passes — It can be checked against evidence.
- Load-bearing: passes — The paper’s conclusions depend on it.
- Based: passes — The paper gives a reason why it holds.
- Partly supported
A result the paper reports from its own data — it cites no other source for it, so there is none to check. The quote shows it is in the paper.
In the paper
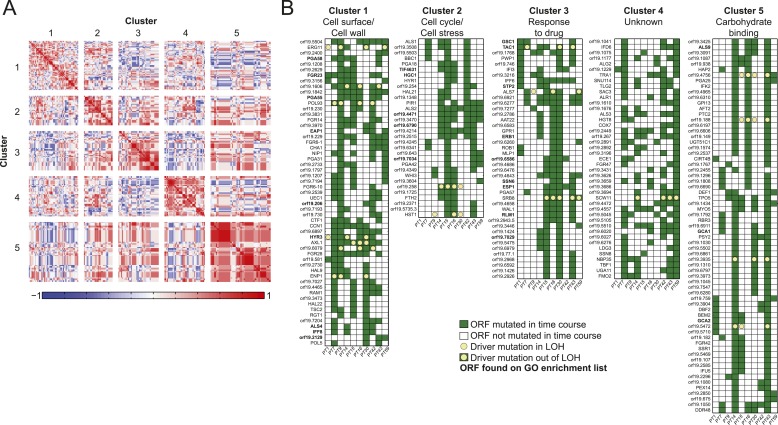
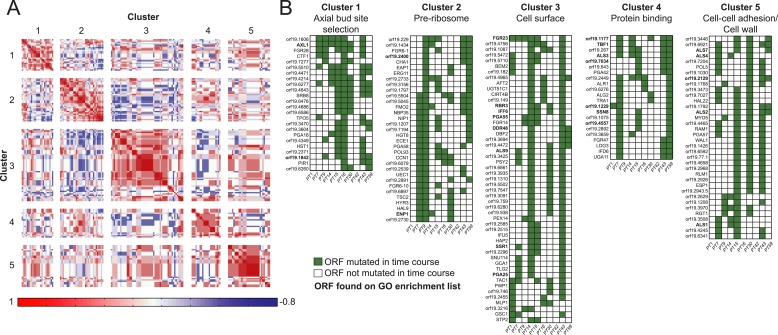
“Co-occurrence of nonsynonymous substitutions across isolates reveals functional clusters.”
§ The evolution of drug resistance in clinical isolates of Candida albicans > Results > LOH events are commonly associated with increased resistance
plaincorrelationaln = 3- Asserted: passes — The authors put it forward as true.
- Checkable: passes — It can be checked against evidence.
- Load-bearing: passes — The paper’s conclusions depend on it.
- Based: passes — The paper gives a reason why it holds.
A result the paper reports from its own data — it cites no other source for it, so there is none to check. The quote shows it is in the paper.
In the paper
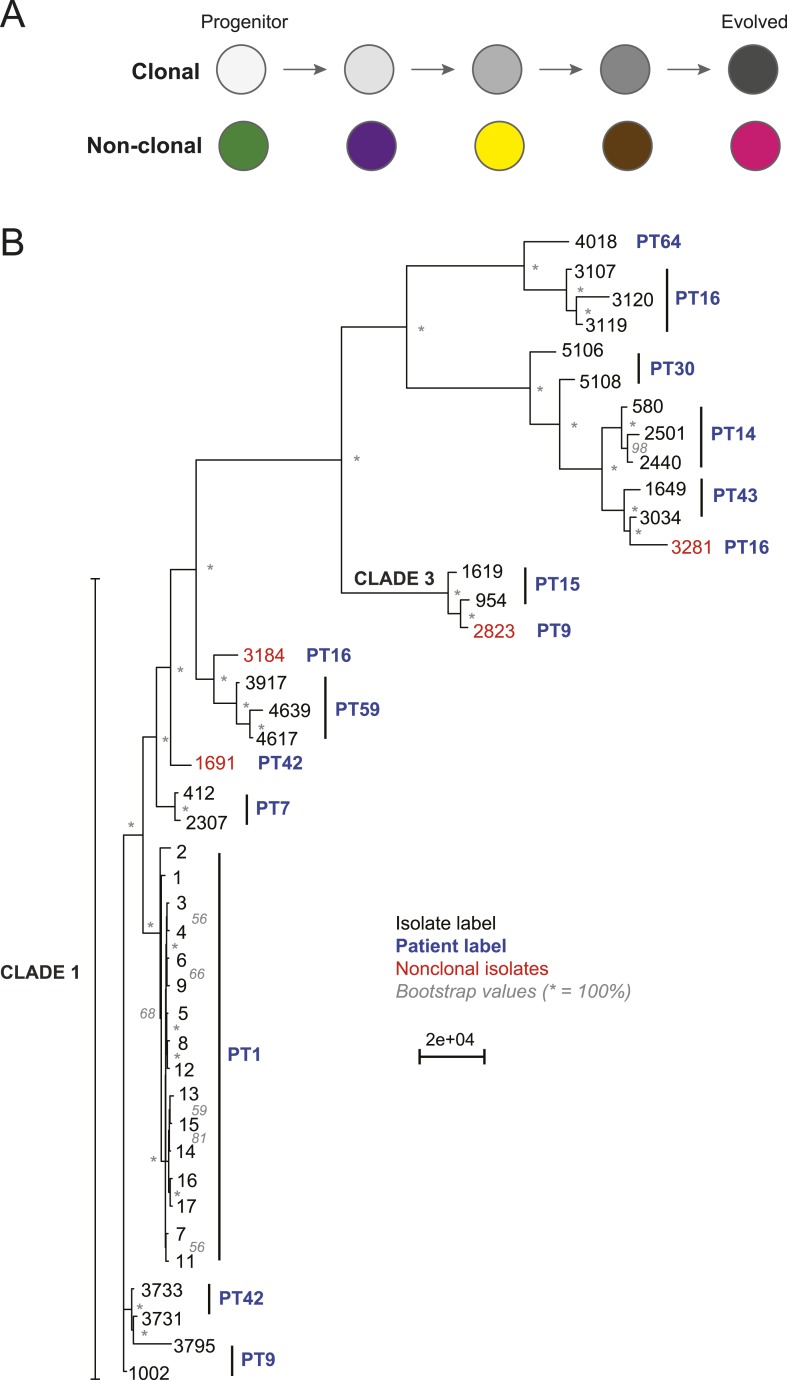
“Despite these clonal relationships, the distance between isolates indicated significant genetic diversity within each patient series (Figure 2B), typically with each isolate differing by several thousand SNPs from its ‘progenitor’ isolate (Figure 2—source data 1).”
§ The evolution of drug resistance in clinical isolates of Candida albicans > Results > Most series are clonal, but there is significant genetic diversity between isolates
hedgedcorrelational- Asserted: passes — The authors put it forward as true.
- Checkable: passes — It can be checked against evidence.
- Load-bearing: passes — The paper’s conclusions depend on it.
- Based: passes — The paper gives a reason why it holds.
A result the paper reports from its own data — it cites no other source for it, so there is none to check. The quote shows it is in the paper.
In the paper
“We clustered the resulting patient-by-gene matrix using NMF clustering to reveal five coherent clusters (correlation matrix of the clusters left; red: positive correlation; blue: negative correlation; white: no correlation).”
§ The evolution of drug resistance in clinical isolates of Candida albicans > Results > LOH events are commonly associated with increased resistance
plain- Asserted: passes — The authors put it forward as true.
- Checkable: passes — It can be checked against evidence.
- Load-bearing: passes — The paper’s conclusions depend on it.
- Based: passes — The paper gives a reason why it holds.
A result the paper reports from its own data — it cites no other source for it, so there is none to check. The quote shows it is in the paper.
In the paper
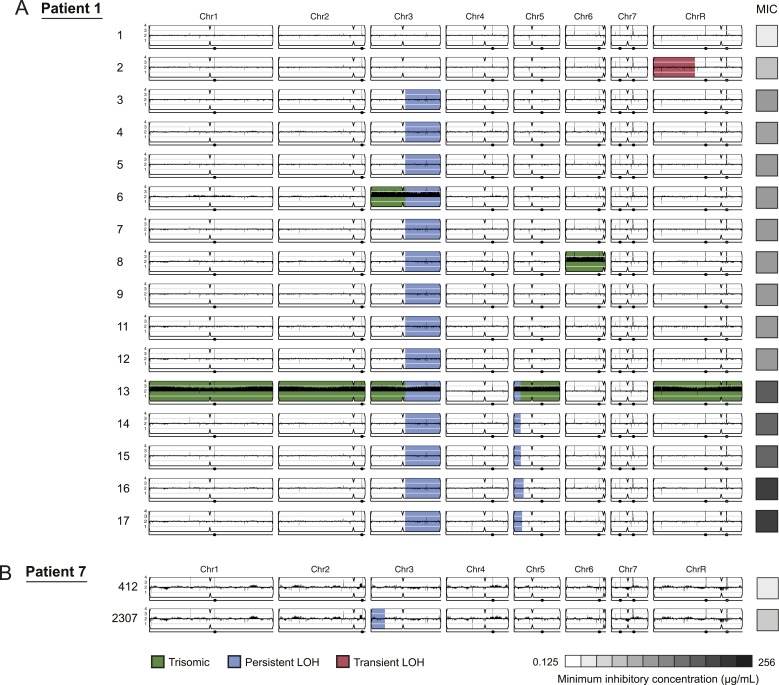
“In contrast to the persistence of most LOH events, persistent aneuploidies were rarer”
§ The evolution of drug resistance in clinical isolates of Candida albicans > Results > Aneuploidies are not predictive of MIC, but may facilitate the appearance of drug resistance
plain- Asserted: passes — The authors put it forward as true.
- Checkable: passes — It can be checked against evidence.
- Load-bearing: passes — The paper’s conclusions depend on it.
- Based: passes — The paper gives a reason why it holds.
In the paper
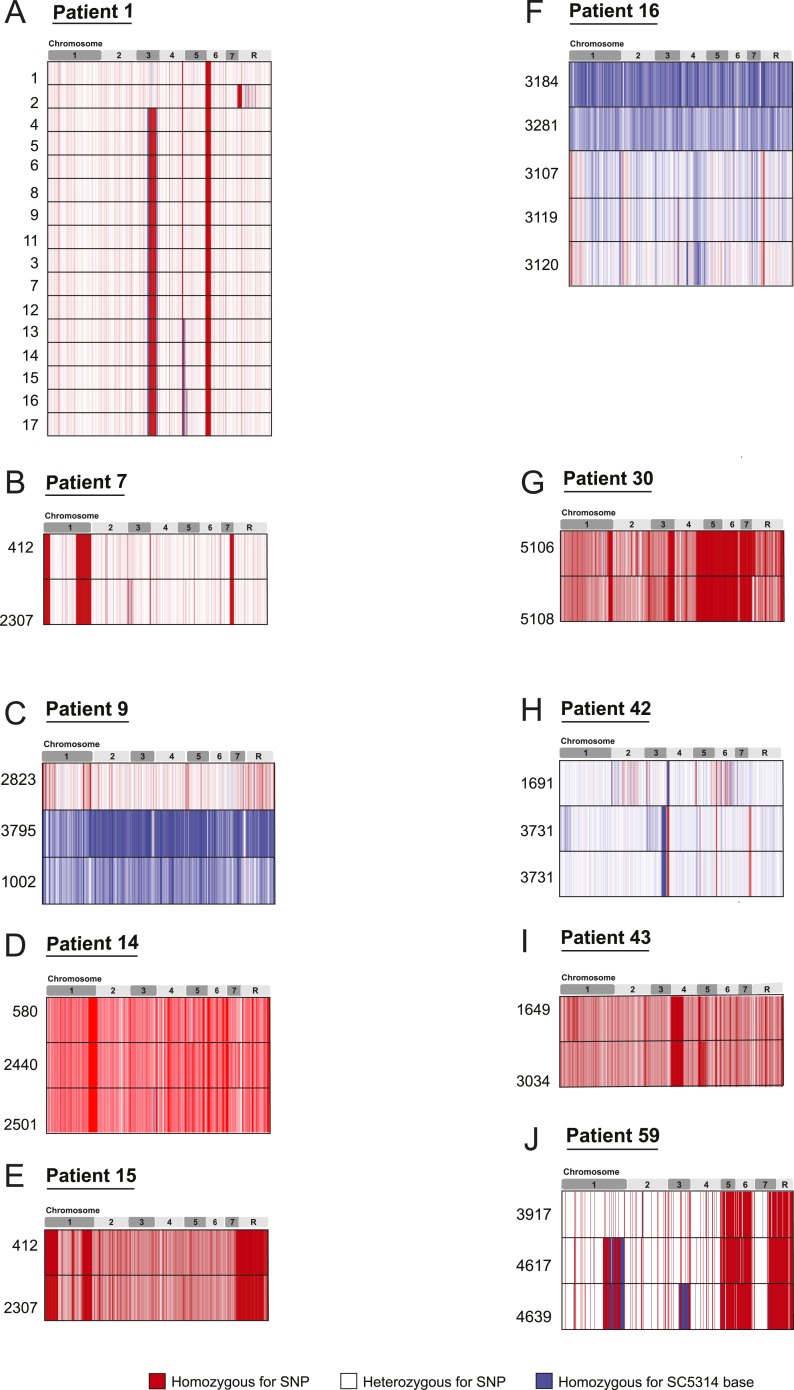
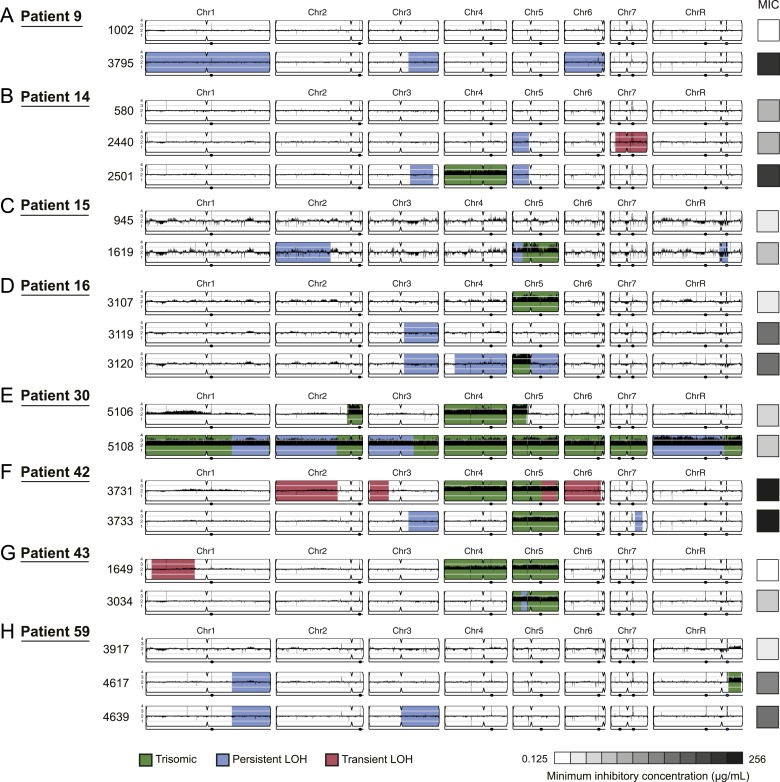
“In another example, the persistent and recurrent LOH on the right arm of chromosome 3 in Patients 9 and 16 (Figure 4A,D) was associated with the presence of a homozygous mutation in MRR1 (Schubert et al., 2011), a regulator of MDR1 expression.”
§ The evolution of drug resistance in clinical isolates of Candida albicans > Results > LOH events are commonly associated with increased resistance
What the sources say
- Not checked yetcites Schubert et al., 2011 source
plaincorrelationaln = 3- Asserted: passes — The authors put it forward as true.
- Checkable: passes — It can be checked against evidence.
- Load-bearing: unclear — It is unclear whether the paper’s conclusions depend on it.
- Based: passes — The paper gives a reason why it holds.
A result the paper reports from its own data — it cites no other source for it, so there is none to check. The quote shows it is in the paper.
In the paper
“The progenitor isolates were more sensitive to fluconazole than subsequent isolates, as defined by the minimum inhibitory concentration (MIC) (Table 1, ‘Materials and methods’).”
§ The evolution of drug resistance in clinical isolates of Candida albicans > Results > Whole genome sequencing of 43 serial clinical isolates from 11 patients
plaincorrelational- Asserted: passes — The authors put it forward as true.
- Checkable: passes — It can be checked against evidence.
- Load-bearing: passes — The paper’s conclusions depend on it.
- Based: passes — The paper gives a reason why it holds.
A result the paper reports from its own data — it cites no other source for it, so there is none to check. The quote shows it is in the paper.
In the paper
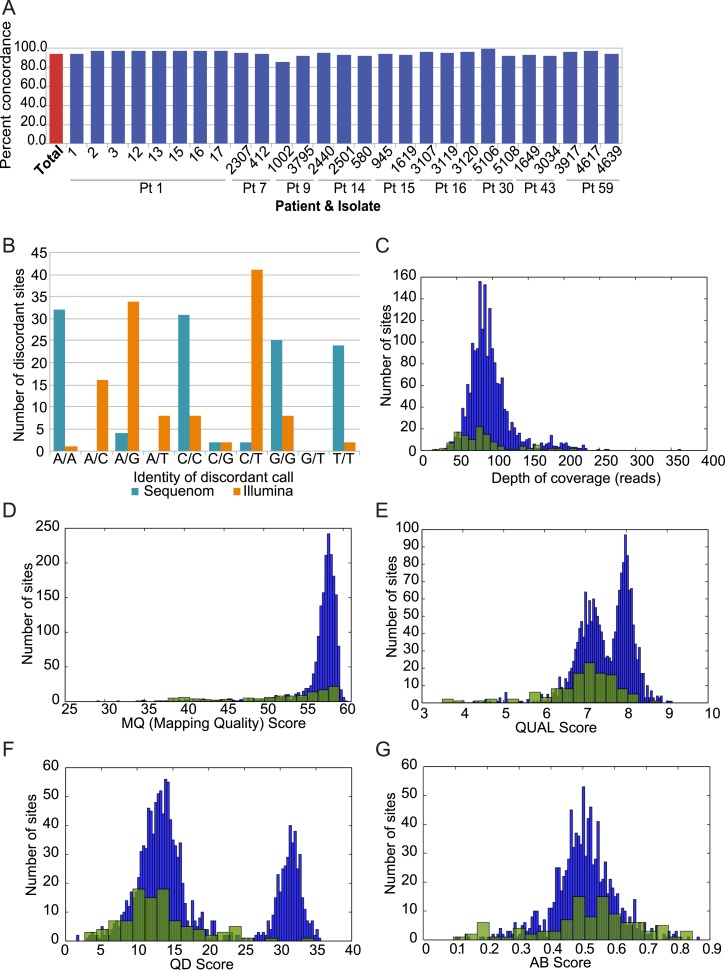
“We interrogated 1973 SNPs in 27 isolates from nine clinical series and found that the iPlex base calls matched 1853 (93.9%, Figure 1—figure supplement 1A, Table 2) of the calls from our computational analysis of the sequencing data.”
§ The evolution of drug resistance in clinical isolates of Candida albicans > Results > Whole genome sequencing of 43 serial clinical isolates from 11 patients
plaincorrelational- Asserted: passes — The authors put it forward as true.
- Checkable: passes — It can be checked against evidence.
- Load-bearing: passes — The paper’s conclusions depend on it.
- Based: passes — The paper gives a reason why it holds.
A result the paper reports from its own data — it cites no other source for it, so there is none to check. The quote shows it is in the paper.
In the paper
“There were 131 such mutations in 86 ORFs from 18 LOH regions from the 10 clonal patient series (Table 1 and Figure 5; Figure 5—source data 1B,C).”
§ The evolution of drug resistance in clinical isolates of Candida albicans > Results > LOH events are commonly associated with increased resistance
plainn = 10- Asserted: passes — The authors put it forward as true.
- Checkable: passes — It can be checked against evidence.
- Load-bearing: passes — The paper’s conclusions depend on it.
- Based: passes — The paper gives a reason why it holds.
A result the paper reports from its own data — it cites no other source for it, so there is none to check. The quote shows it is in the paper.
In the paper
“We detected newly selected mutations, including single-nucleotide polymorphisms (SNPs), copy-number variations and loss-of-heterozygosity (LOH) events.”
§ The evolution of drug resistance in clinical isolates of Candida albicans > Abstract
plainn = 11- Asserted: passes — The authors put it forward as true.
- Checkable: passes — It can be checked against evidence.
- Load-bearing: passes — The paper’s conclusions depend on it.
- Based: passes — The paper gives a reason why it holds.
A result the paper reports from its own data — it cites no other source for it, so there is none to check. The quote shows it is in the paper.
In the paper
“Aneuploidies, either whole chromosomal or segmental, were evident in at least one isolate from 80% (8/10) of the clonal patient series”
§ The evolution of drug resistance in clinical isolates of Candida albicans > Results > Aneuploidies are not predictive of MIC, but may facilitate the appearance of drug resistance
plainn = 8- Asserted: passes — The authors put it forward as true.
- Checkable: passes — It can be checked against evidence.
- Load-bearing: passes — The paper’s conclusions depend on it.
- Based: passes — The paper gives a reason why it holds.
A result the paper reports from its own data — it cites no other source for it, so there is none to check. The quote shows it is in the paper.
In the paper
“with the most prevalent aneuploidies involving Chromosome 5 (6 of 8 patients with at least one aneuploid isolate; Figure 3A and Figure 4B–G, green).”
§ The evolution of drug resistance in clinical isolates of Candida albicans > Results > Aneuploidies are not predictive of MIC, but may facilitate the appearance of drug resistance
plainn = 8- Asserted: passes — The authors put it forward as true.
- Checkable: passes — It can be checked against evidence.
- Load-bearing: unclear — It is unclear whether the paper’s conclusions depend on it.
- Based: passes — The paper gives a reason why it holds.
A result the paper reports from its own data — it cites no other source for it, so there is none to check. The quote shows it is in the paper.
In the paper
“and were not consistently associated with adaptive increases in MIC levels (Figures 3 and 4).”
§ The evolution of drug resistance in clinical isolates of Candida albicans > Results > Aneuploidies are not predictive of MIC, but may facilitate the appearance of drug resistance
plaincorrelational- Asserted: passes — The authors put it forward as true.
- Checkable: passes — It can be checked against evidence.
- Load-bearing: passes — The paper’s conclusions depend on it.
- Based: passes — The paper gives a reason why it holds.
A result the paper reports from its own data — it cites no other source for it, so there is none to check. The quote shows it is in the paper.
In the paper
“For example, filtering for both persistence and recurrence across at least three series reduced the number of polymorphisms for patient 1 from 13,562 polymorphisms in 5022 genes to 23 recurrent genes (Figure 2—source data 1, Figure 5—source data 1A).”
§ The evolution of drug resistance in clinical isolates of Candida albicans > Results > Genetic alterations absent from the progenitor isolate, persistent within a patient, and recurrent across patients are likely adaptive
plaindirectSingle case- Asserted: passes — The authors put it forward as true.
- Checkable: passes — It can be checked against evidence.
- Load-bearing: passes — The paper’s conclusions depend on it.
- Based: passes — The paper gives a reason why it holds.
A result the paper reports from its own data — it cites no other source for it, so there is none to check. The quote shows it is in the paper.
In the paper
“In three of these cases, ERG11, located on the region of Chromosome 5 with LOH, was mutated.”
§ The evolution of drug resistance in clinical isolates of Candida albicans > Results > Aneuploidies are not predictive of MIC, but may facilitate the appearance of drug resistance
plaincorrelationaln = 3- Asserted: passes — The authors put it forward as true.
- Checkable: passes — It can be checked against evidence.
- Load-bearing: unclear — It is unclear whether the paper’s conclusions depend on it.
- Based: passes — The paper gives a reason why it holds.
A result the paper reports from its own data — it cites no other source for it, so there is none to check. The quote shows it is in the paper.
In the paper
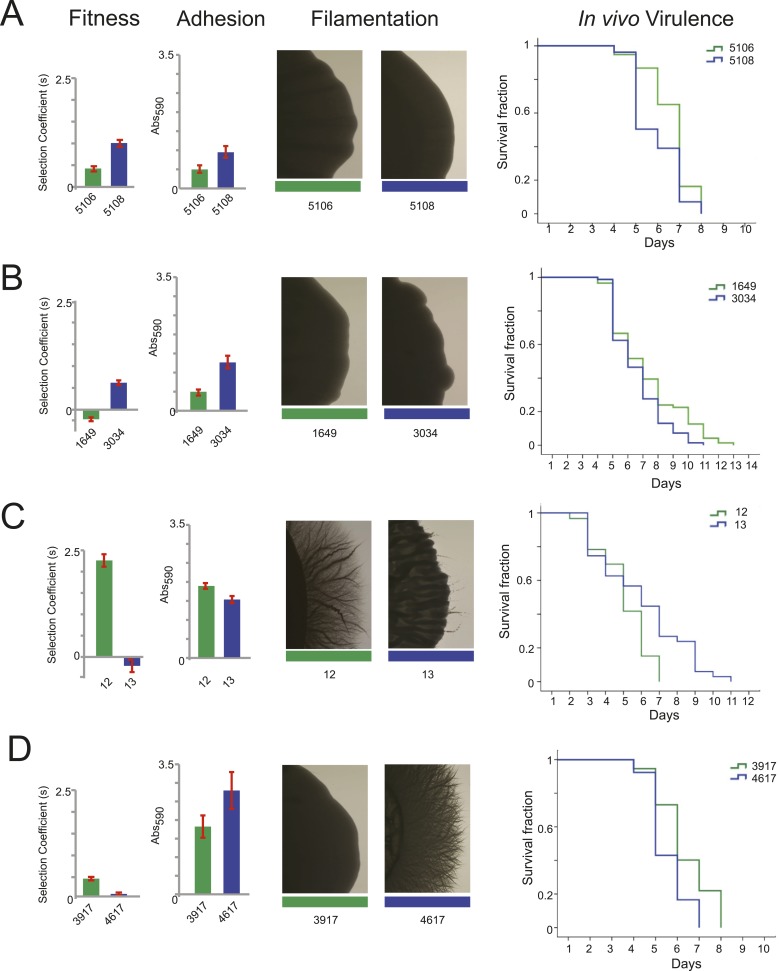
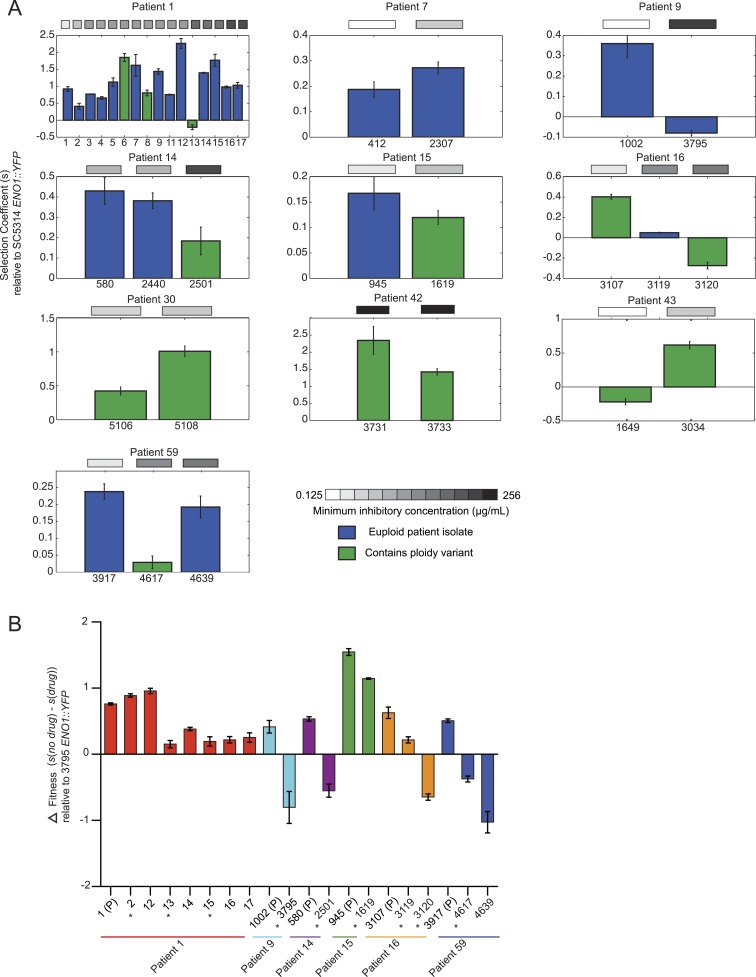
“When MIC increases first appeared, they were usually accompanied by a decrease in fitness in the absence of drug (Patient 1, isolates 2, 13, and 16, Patients 9, 14, 15 16, and 59, Figure 7A).”
§ The evolution of drug resistance in clinical isolates of Candida albicans > Results > Changes in virulence phenotypes in evolved drug-resistant isolates
hedgedcorrelational- Asserted: passes — The authors put it forward as true.
- Checkable: passes — It can be checked against evidence.
- Load-bearing: passes — The paper’s conclusions depend on it.
- Based: passes — The paper gives a reason why it holds.
None of the sources cited for this claim have been checked yet.
In the paper
“In addition, seven members of the FGR genes (Uhl et al., 2003), involved in filamentous growth and specifically expanded in C. albicans (Butler et al., 2009), are also among the 240 genes”
§ The evolution of drug resistance in clinical isolates of Candida albicans > Results > Persistent SNPs in 240 recurrently polymorphic genes identify targets likely associated with drug resistance and host adaptation
What the sources say
plain- Asserted: passes — The authors put it forward as true.
- Checkable: passes — It can be checked against evidence.
- Load-bearing: unclear — It is unclear whether the paper’s conclusions depend on it.
- Based: passes — The paper gives a reason why it holds.
A result the paper reports from its own data — it cites no other source for it, so there is none to check. The quote shows it is in the paper.
In the paper
“Initially in a series, drug resistance (MIC) and in vitro fitness (in the absence of drug) were inversely related”
§ The evolution of drug resistance in clinical isolates of Candida albicans > Results > Changes in virulence phenotypes in evolved drug-resistant isolates
plaincorrelational- Asserted: passes — The authors put it forward as true.
- Checkable: passes — It can be checked against evidence.
- Load-bearing: passes — The paper’s conclusions depend on it.
- Based: passes — The paper gives a reason why it holds.
A result the paper reports from its own data — it cites no other source for it, so there is none to check. The quote shows it is in the paper.
In the paper
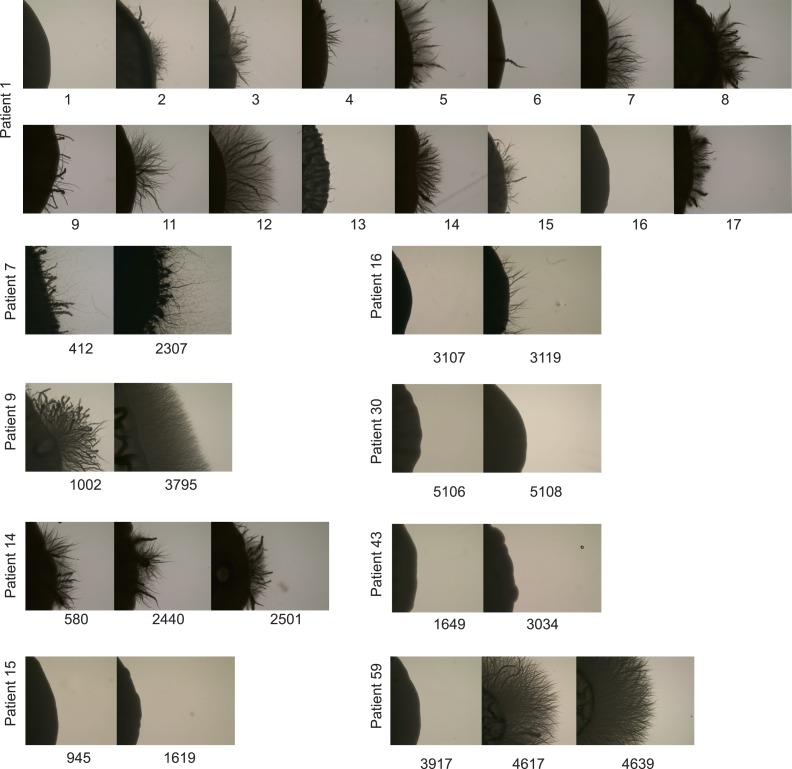
“We found substantial variation in many of these phenotypes between isolates in the same series (Figure 6 and Figure 7)”
§ The evolution of drug resistance in clinical isolates of Candida albicans > Results > Changes in virulence phenotypes in evolved drug-resistant isolates
plain- Asserted: passes — The authors put it forward as true.
- Checkable: passes — It can be checked against evidence.
- Load-bearing: passes — The paper’s conclusions depend on it.
- Based: passes — The paper gives a reason why it holds.
A result the paper reports from its own data — it cites no other source for it, so there is none to check. The quote shows it is in the paper.
In the paper
“Applying the recurrence filter (i.e., persistent nonsynonymous SNPs that appeared in the same ORFs in three or more patient series), we identified 240 polymorphic genes that are more likely to have contributed to adaptation (Figure 5—source data 1A).”
§ The evolution of drug resistance in clinical isolates of Candida albicans > Results > Persistent SNPs in 240 recurrently polymorphic genes identify targets likely associated with drug resistance and host adaptation
hedgedconditionaln = 3- Asserted: passes — The authors put it forward as true.
- Checkable: passes — It can be checked against evidence.
- Load-bearing: passes — The paper’s conclusions depend on it.
- Based: passes — The paper gives a reason why it holds.
A result the paper reports from its own data — it cites no other source for it, so there is none to check. The quote shows it is in the paper.
In the paper
“Additionally, isolates in 2 of the 7 patients with a Chromosome 3 LOH were trisomic for this chromosome.”
§ The evolution of drug resistance in clinical isolates of Candida albicans > Results > Aneuploidies are not predictive of MIC, but may facilitate the appearance of drug resistance
plainn = 7- Asserted: passes — The authors put it forward as true.
- Checkable: passes — It can be checked against evidence.
- Load-bearing: unclear — It is unclear whether the paper’s conclusions depend on it.
- Based: passes — The paper gives a reason why it holds.
A result the paper reports from its own data — it cites no other source for it, so there is none to check. The quote shows it is in the paper.
In the paper
“A notable exception was patient 59, where fitness in vitro decreased while virulence phenotypes increased in a later isolate (Figures 6D and Figure 7).”
§ The evolution of drug resistance in clinical isolates of Candida albicans > Results > Changes in virulence phenotypes in evolved drug-resistant isolates
plaincorrelationalSingle case- Asserted: passes — The authors put it forward as true.
- Checkable: passes — It can be checked against evidence.
- Load-bearing: unclear — It is unclear whether the paper’s conclusions depend on it.
- Based: passes — The paper gives a reason why it holds.
A result the paper reports from its own data — it cites no other source for it, so there is none to check. The quote shows it is in the paper.
In the paper
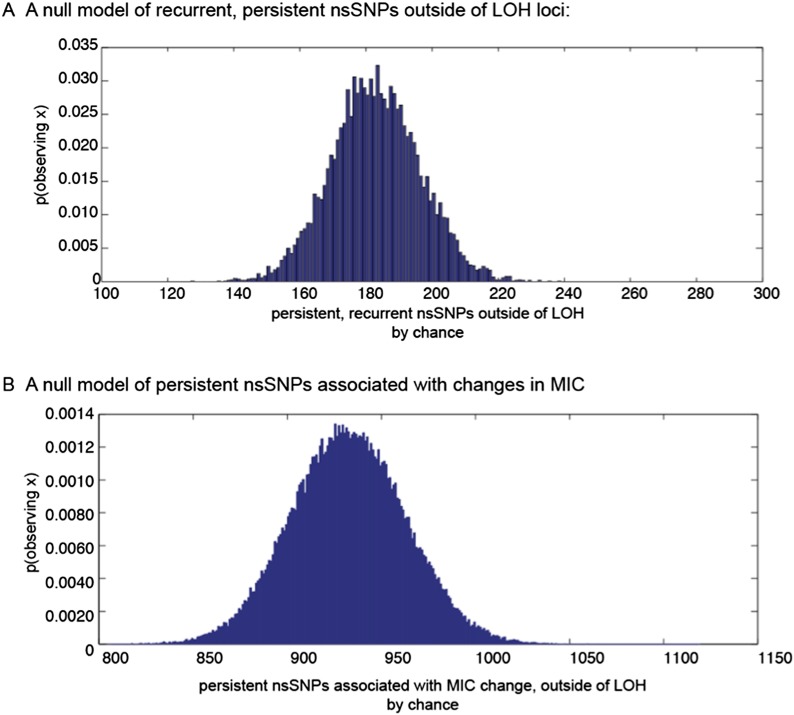
“These correlations are significantly higher than expected in a null model (p < 5.2 × 10−182, permutation test, ‘Materials and methods’).”
§ The evolution of drug resistance in clinical isolates of Candida albicans > Results > Persistent SNPs in 240 recurrently polymorphic genes identify targets likely associated with drug resistance and host adaptation
plaincorrelational- Asserted: passes — The authors put it forward as true.
- Checkable: passes — It can be checked against evidence.
- Load-bearing: passes — The paper’s conclusions depend on it.
- Based: passes — The paper gives a reason why it holds.
A result the paper reports from its own data — it cites no other source for it, so there is none to check. The quote shows it is in the paper.
In the paper
“The most recurrently mutated gene outside of an LOH region was AXL1 that encodes a putative endoprotease”
§ The evolution of drug resistance in clinical isolates of Candida albicans > Results > Persistent SNPs in 240 recurrently polymorphic genes identify targets likely associated with drug resistance and host adaptation
plain- Asserted: passes — The authors put it forward as true.
- Checkable: passes — It can be checked against evidence.
- Load-bearing: unclear — It is unclear whether the paper’s conclusions depend on it.
- Based: passes — The paper gives a reason why it holds.
A result the paper reports from its own data — it cites no other source for it, so there is none to check. The quote shows it is in the paper.
In the paper
“This number of genes is higher than expected by chance (empirical p < 10−4 based on a Poisson model of background mutation, ‘Materials and methods’).”
§ The evolution of drug resistance in clinical isolates of Candida albicans > Results > Persistent SNPs in 240 recurrently polymorphic genes identify targets likely associated with drug resistance and host adaptation
plain- Asserted: passes — The authors put it forward as true.
- Checkable: passes — It can be checked against evidence.
- Load-bearing: passes — The paper’s conclusions depend on it.
- Based: passes — The paper gives a reason why it holds.
A result the paper reports from its own data — it cites no other source for it, so there is none to check. The quote shows it is in the paper.
In the paper
“followed by ten genes mutated in seven series (Figure 5—source data 1A).”
§ The evolution of drug resistance in clinical isolates of Candida albicans > Results > Persistent SNPs in 240 recurrently polymorphic genes identify targets likely associated with drug resistance and host adaptation
plain- Asserted: passes — The authors put it forward as true.
- Checkable: passes — It can be checked against evidence.
- Load-bearing: unclear — It is unclear whether the paper’s conclusions depend on it.
- Based: passes — The paper gives a reason why it holds.
In the paper
“including several members in each of three cell wall gene families important for biofilm formation and virulence (Hoyer et al., 2008): the Hyr/Iff proteins (HYR1 and 3, IFF8 and 6), the ALS adhesins (ALS1-4,7,9), and the PGA-30-like proteins (seven genes)”
§ The evolution of drug resistance in clinical isolates of Candida albicans > Results > Persistent SNPs in 240 recurrently polymorphic genes identify targets likely associated with drug resistance and host adaptation
What the sources say
- Not checked yetcites Hoyer et al., 2008 source
plain- Asserted: passes — The authors put it forward as true.
- Checkable: passes — It can be checked against evidence.
- Load-bearing: unclear — It is unclear whether the paper’s conclusions depend on it.
- Based: passes — The paper gives a reason why it holds.
A result the paper reports from its own data — it cites no other source for it, so there is none to check. The quote shows it is in the paper.
In the paper
“In general, increased fitness in vitro (in the absence of drug) correlated with an increase in traits associated with virulence (adhesion, filamentation, and virulence in nematode).”
§ The evolution of drug resistance in clinical isolates of Candida albicans > Results > Changes in virulence phenotypes in evolved drug-resistant isolates
plaincorrelational- Asserted: passes — The authors put it forward as true.
- Checkable: passes — It can be checked against evidence.
- Load-bearing: passes — The paper’s conclusions depend on it.
- Based: passes — The paper gives a reason why it holds.
A result the paper reports from its own data — it cites no other source for it, so there is none to check. The quote shows it is in the paper.
In the paper
“Finally, polymorphisms in 166 of the 240 genes appeared together with an increase in MIC”
§ The evolution of drug resistance in clinical isolates of Candida albicans > Results > Persistent SNPs in 240 recurrently polymorphic genes identify targets likely associated with drug resistance and host adaptation
hedgedcorrelational- Asserted: passes — The authors put it forward as true.
- Checkable: passes — It can be checked against evidence.
- Load-bearing: passes — The paper’s conclusions depend on it.
- Based: passes — The paper gives a reason why it holds.
A result the paper reports from its own data — it cites no other source for it, so there is none to check. The quote shows it is in the paper.
In the paper
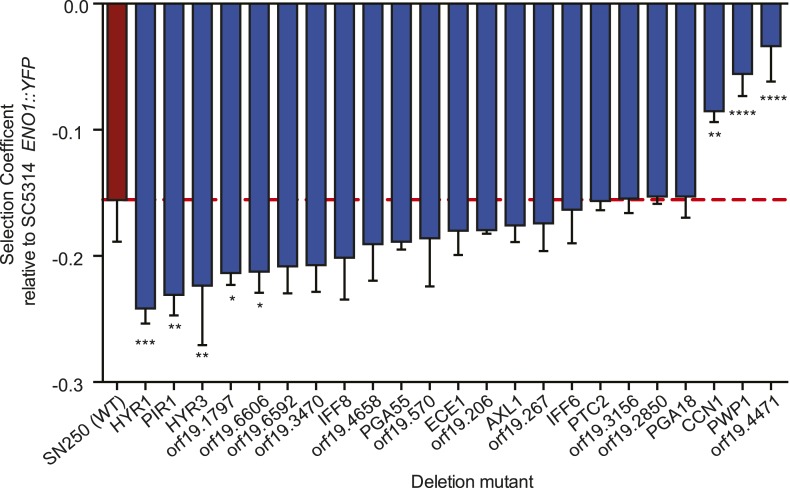
“Consistent with a role in host adaptation, 5 of the 22 deletion mutants reduced in vitro fitness in a culture medium thought to approximate in vivo conditions (Figure 8, ‘Materials and methods’).”
§ The evolution of drug resistance in clinical isolates of Candida albicans > Results > Candidate mutated genes associated with drug resistance or virulence
plaindirect- Asserted: passes — The authors put it forward as true.
- Checkable: passes — It can be checked against evidence.
- Load-bearing: passes — The paper’s conclusions depend on it.
- Based: passes — The paper gives a reason why it holds.
- Rests on an assumption: The culture medium used for in vitro fitness assays approximates in vivo conditions.
A result the paper reports from its own data — it cites no other source for it, so there is none to check. The quote shows it is in the paper.
In the paper
“Though the coding sequence for these 240 recurrent genes is longer than average (2.21 ± 1.53 kb vs 1.83 ± 1.29 kb for non-recurrent persistent genes, p < 3.68 × 10⁻⁵, t-test)”
§ The evolution of drug resistance in clinical isolates of Candida albicans > Results > Persistent SNPs in 240 recurrently polymorphic genes identify targets likely associated with drug resistance and host adaptation
plaincorrelational- Asserted: passes — The authors put it forward as true.
- Checkable: passes — It can be checked against evidence.
- Load-bearing: unclear — It is unclear whether the paper’s conclusions depend on it.
- Based: passes — The paper gives a reason why it holds.
In the paper
“Among the least fit were cell wall protein genes (HYR1, HYR3, and PIR1; De Groot et al., 2003).”
§ The evolution of drug resistance in clinical isolates of Candida albicans > Results > Candidate mutated genes associated with drug resistance or virulence
What the sources say
- Not checked yetcites De Groot et al., 2003 source
plaincorrelational- Asserted: passes — The authors put it forward as true.
- Checkable: passes — It can be checked against evidence.
- Load-bearing: unclear — It is unclear whether the paper’s conclusions depend on it.
- Based: passes — The paper gives a reason why it holds.
A result the paper reports from its own data — it cites no other source for it, so there is none to check. The quote shows it is in the paper.
In the paper
“whereas, a decrease in fitness in isolate 13 of patient 1 was accompanied by a decrease in virulence (Figures 6C and Figure 7).”
§ The evolution of drug resistance in clinical isolates of Candida albicans > Results > Changes in virulence phenotypes in evolved drug-resistant isolates
plaincorrelationalSingle case- Asserted: passes — The authors put it forward as true.
- Checkable: passes — It can be checked against evidence.
- Load-bearing: unclear — It is unclear whether the paper’s conclusions depend on it.
- Based: passes — The paper gives a reason why it holds.
The paper states this without a source or data behind it here, so there is nothing to check it against. The quote shows it is in the paper.
In the paper
“Consistent with subsequent selection of strains with compensatory variations, isolates from later time points were often more fit than those from earlier time points (measured in vitro, in the absence of drug) without further changes in MIC (e.g., patient 1, isolates 5-7, isolate 14, Figure 7A), with notable exceptions (e.g., isolates 8 and 11).”
§ The evolution of drug resistance in clinical isolates of Candida albicans > Results > Changes in virulence phenotypes in evolved drug-resistant isolates
plaincorrelational- Asserted: passes — The authors put it forward as true.
- Checkable: passes — It can be checked against evidence.
- Load-bearing: passes — The paper’s conclusions depend on it.
- Based: passes — The paper gives a reason why it holds.
A result the paper reports from its own data — it cites no other source for it, so there is none to check. The quote shows it is in the paper.
In the paper
“in 4 of the 6 patients with a Chromosome 5 LOH, the isolate with an LOH event also harbors a Chromosome 5 trisomy or is preceded by an isolate with a Chromosome 5 trisomy.”
§ The evolution of drug resistance in clinical isolates of Candida albicans > Results > Aneuploidies are not predictive of MIC, but may facilitate the appearance of drug resistance
plaincorrelationaln = 6- Asserted: passes — The authors put it forward as true.
- Checkable: passes — It can be checked against evidence.
- Load-bearing: passes — The paper’s conclusions depend on it.
- Based: passes — The paper gives a reason why it holds.
A result the paper reports from its own data — it cites no other source for it, so there is none to check. The quote shows it is in the paper.
In the paper
“Next, we partitioned the 240 recurrently mutated genes into 5 ‘co-occurrence clusters’ based on the correlation in their mutation occurrence patterns (Figure 5, Figure 5—source data 1A).”
§ The evolution of drug resistance in clinical isolates of Candida albicans > Results > Persistent SNPs in 240 recurrently polymorphic genes identify targets likely associated with drug resistance and host adaptation
plaincorrelational- Asserted: passes — The authors put it forward as true.
- Checkable: passes — It can be checked against evidence.
- Load-bearing: passes — The paper’s conclusions depend on it.
- Based: passes — The paper gives a reason why it holds.
A result the paper reports from its own data — it cites no other source for it, so there is none to check. The quote shows it is in the paper.
In the paper
“Consistent with the elevated MIC, these isolates exhibited increased relative fitness in the presence of the drug (Figure 7B).”
§ The evolution of drug resistance in clinical isolates of Candida albicans > Results > Changes in virulence phenotypes in evolved drug-resistant isolates
plaincorrelational- Asserted: passes — The authors put it forward as true.
- Checkable: passes — It can be checked against evidence.
- Load-bearing: passes — The paper’s conclusions depend on it.
- Based: passes — The paper gives a reason why it holds.
The paper states this without a source or data behind it here, so there is nothing to check it against. The quote shows it is in the paper.
In the paper
“The addition of the YFP marker reduced the fitness of the strain relative to the unaltered one”
§ The evolution of drug resistance in clinical isolates of Candida albicans > Materials and methods > Competition assay to assess fitness with and without fluconazole
plaindirectSingle case- Asserted: passes — The authors put it forward as true.
- Checkable: passes — It can be checked against evidence.
- Load-bearing: unclear — It is unclear whether the paper’s conclusions depend on it.
- Based: passes — The paper gives a reason why it holds.
A result the paper reports from its own data — it cites no other source for it, so there is none to check. The quote shows it is in the paper.
In the paper
“There were two strains from patient 42 (3731 and 3733) with a higher MIC”
§ The evolution of drug resistance in clinical isolates of Candida albicans > Materials and methods > Competition assay to assess fitness with and without fluconazole
plainn = 2- Asserted: passes — The authors put it forward as true.
- Checkable: passes — It can be checked against evidence.
- Load-bearing: passes — The paper’s conclusions depend on it.
- Based: passes — The paper gives a reason why it holds.
A result the paper reports from its own data — it cites no other source for it, so there is none to check. The quote shows it is in the paper.
In the paper
“Notably, the cell wall deletion mutants (HYR1, HYR3, and PIR1) were among the least fit in vitro (Figure 8).”
§ The evolution of drug resistance in clinical isolates of Candida albicans > Discussion
plain- Asserted: passes — The authors put it forward as true.
- Checkable: passes — It can be checked against evidence.
- Load-bearing: unclear — It is unclear whether the paper’s conclusions depend on it.
- Based: passes — The paper gives a reason why it holds.
In the paper
“Aneuploidies appeared frequently within the drug-resistant isolates, consistent with previous reports (Selmecki et al., 2006).”
§ The evolution of drug resistance in clinical isolates of Candida albicans > Discussion
What the sources say
- Not checked yetcites Selmecki et al., 2006 source
plaincorrelational- Asserted: passes — The authors put it forward as true.
- Checkable: passes — It can be checked against evidence.
- Load-bearing: passes — The paper’s conclusions depend on it.
- Based: passes — The paper gives a reason why it holds.
In the paper
“In particular, there was strong enrichment for cell wall gene families thought to be critical determinants of the transition from commensalism to pathogenesis (Gow and Hube, 2012).”
§ The evolution of drug resistance in clinical isolates of Candida albicans > Discussion
What the sources say
- Not checked yetcites Gow and Hube, 2012 source
boostedcorrelational- Asserted: passes — The authors put it forward as true.
- Checkable: passes — It can be checked against evidence.
- Load-bearing: passes — The paper’s conclusions depend on it.
- Based: passes — The paper gives a reason why it holds.
A conclusion the paper draws from its own results — it cites no other source for it, so there is none to check. The quote shows it is in the paper.
In the paper
“The large number of SNPs detected suggests that isolates from later time points in a series are not simply direct descendants of the earlier isolate; however, since mutation and mitotic recombination rates can be elevated under stressful conditions (e.g., drug treatment Galhardo et al., 2007; Forche et al., 2011), we cannot rule out the possibility that some of the variation may be due to de novo”
§ The evolution of drug resistance in clinical isolates of Candida albicans > Results > Most series are clonal, but there is significant genetic diversity between isolates
hedgedcorrelational- Asserted: passes — The authors put it forward as true.
- Checkable: passes — It can be checked against evidence.
- Load-bearing: passes — The paper’s conclusions depend on it.
- Based: passes — The paper gives a reason why it holds.
None of the sources cited for this claim have been checked yet.
In the paper
“Indeed, the genomes of drug-resistant strains isolated following clinical treatment often exhibit large-scale changes, such as loss of heterozygosity (LOH) (Coste et al., 2006; Dunkel and Morschhauser, 2011), copy-number variation (CNV), including short segmental CNV, and whole chromosome aneuploidy (Selmecki et al., 2010) accompanied by point mutations.”
§ The evolution of drug resistance in clinical isolates of Candida albicans > Introduction
What the sources say
plaincorrelational- Asserted: passes — The authors put it forward as true.
- Checkable: passes — It can be checked against evidence.
- Load-bearing: passes — The paper’s conclusions depend on it.
- Based: passes — The paper gives a reason why it holds.
A conclusion the paper draws from its own results — it cites no other source for it, so there is none to check. The quote shows it is in the paper.
In the paper
“The recurrence of LOH events that coincide with changes in MIC suggests that they have been positively selected to rise in frequency relative to the progenitor strain.”
§ The evolution of drug resistance in clinical isolates of Candida albicans > Results > LOH events are commonly associated with increased resistance
hedgedconditionaln = 4- Asserted: passes — The authors put it forward as true.
- Checkable: passes — It can be checked against evidence.
- Load-bearing: passes — The paper’s conclusions depend on it.
- Based: passes — The paper gives a reason why it holds.
In the paper
“We validated our pipeline for detection of point mutations using Sequenom iPlex genotyping (Storm et al., 2003) (‘Materials and methods’).”
§ The evolution of drug resistance in clinical isolates of Candida albicans > Results > Whole genome sequencing of 43 serial clinical isolates from 11 patients
What the sources say
- Not checked yetcites Storm et al., 2003
plain- Asserted: passes — The authors put it forward as true.
- Checkable: passes — It can be checked against evidence.
- Load-bearing: passes — The paper’s conclusions depend on it.
- Based: passes — The paper gives a reason why it holds.
None of the sources cited for this claim have been checked yet.
In the paper
“First, increased activity or level of the enzymes of the ergosterol pathway (e.g., ERG11) reduces direct impact of the drug on its target (Asai et al., 1999; Oliver et al., 2007).”
§ The evolution of drug resistance in clinical isolates of Candida albicans > Introduction
What the sources say
plaindirect- Asserted: passes — The authors put it forward as true.
- Checkable: passes — It can be checked against evidence.
- Load-bearing: passes — The paper’s conclusions depend on it.
- Based: passes — The paper gives a reason why it holds.
In the paper
“Studies of clinical isolates of C. albicans suggest that drug resistance can increase during an infection through the acquisition of aneuploidies (Selmecki et al., 2009) due to genomic plasticity and rapid evolutionary selection during infection.”
§ The evolution of drug resistance in clinical isolates of Candida albicans > Introduction
What the sources say
- Not checked yetcites Selmecki et al., 2009 source
hedgeddirect- Asserted: passes — The authors put it forward as true.
- Checkable: passes — It can be checked against evidence.
- Load-bearing: passes — The paper’s conclusions depend on it.
- Based: passes — The paper gives a reason why it holds.
A conclusion the paper draws from its own results — it cites no other source for it, so there is none to check. The quote shows it is in the paper.
In the paper
“Putative driver mutations (defined above as non-synonymous SNPs that were homozygous for a genotype not found in the progenitor strain that persisted in the subsequent isolates; e.g., G/T > A/A) in these regions are suggestive of a point mutation followed by an LOH of the mutant allele that confers an advantage.”
§ The evolution of drug resistance in clinical isolates of Candida albicans > Results > LOH events are commonly associated with increased resistance
hedgedconditionaln = 10- Asserted: passes — The authors put it forward as true.
- Checkable: passes — It can be checked against evidence.
- Load-bearing: passes — The paper’s conclusions depend on it.
- Based: passes — The paper gives a reason why it holds.
A conclusion the paper draws from its own results — it cites no other source for it, so there is none to check. The quote shows it is in the paper.
In the paper
“Thus, we conclude that a population of related but divergent genotypes of the same lineage exists within a given patient.”
§ The evolution of drug resistance in clinical isolates of Candida albicans > Results > Most series are clonal, but there is significant genetic diversity between isolates
boosted- Asserted: passes — The authors put it forward as true.
- Checkable: passes — It can be checked against evidence.
- Load-bearing: passes — The paper’s conclusions depend on it.
- Based: passes — The paper gives a reason why it holds.
None of the sources cited for this claim have been checked yet.
In the paper
“Second, increased efflux of the drug from cells by ABC transporters (encoded by CDR1 and CDR2) (Coste et al., 2006) or by the major facilitator superfamily efflux pump (encoded by MDR1) (Dunkel et al., 2008) reduces the effective intracellular drug concentration.”
§ The evolution of drug resistance in clinical isolates of Candida albicans > Introduction
What the sources say
plaindirect- Asserted: passes — The authors put it forward as true.
- Checkable: passes — It can be checked against evidence.
- Load-bearing: passes — The paper’s conclusions depend on it.
- Based: passes — The paper gives a reason why it holds.
A conclusion the paper draws from its own results — it cites no other source for it, so there is none to check. The quote shows it is in the paper.
In the paper
“Our work reveals new molecular mechanisms underlying the evolution of drug resistance and host adaptation.”
§ The evolution of drug resistance in clinical isolates of Candida albicans > Abstract
plaindirectn = 11- Asserted: passes — The authors put it forward as true.
- Checkable: passes — It can be checked against evidence.
- Load-bearing: passes — The paper’s conclusions depend on it.
- Based: passes — The paper gives a reason why it holds.
In the paper
“Epidemiological data suggest that the intensity of fluconazole use is driving the appearance of resistant isolates (Pfaller et al., 1998).”
§ The evolution of drug resistance in clinical isolates of Candida albicans > Introduction
What the sources say
- Not checked yetcites Pfaller et al., 1998 source
hedgeddirect- Asserted: passes — The authors put it forward as true.
- Checkable: passes — It can be checked against evidence.
- Load-bearing: unclear — It is unclear whether the paper’s conclusions depend on it.
- Based: passes — The paper gives a reason why it holds.
None of the sources cited for this claim have been checked yet.
In the paper
“suggesting that compensatory mutations may subsequently arise to offset the major fitness cost of mutations conferring drug”
§ The evolution of drug resistance in clinical isolates of Candida albicans > Results > Changes in virulence phenotypes in evolved drug-resistant isolates
What the sources say
hedgedconditional- Asserted: passes — The authors put it forward as true.
- Checkable: passes — It can be checked against evidence.
- Load-bearing: passes — The paper’s conclusions depend on it.
- Based: passes — The paper gives a reason why it holds.
In the paper
“and exposure to a mammalian host results in elevated frequencies of LOH and aneuploidy (Forche et al. 2009).”
§ The evolution of drug resistance in clinical isolates of Candida albicans > Discussion
What the sources say
- Not checked yetcites Forche et al. 2009 source
plaindirect- Asserted: passes — The authors put it forward as true.
- Checkable: passes — It can be checked against evidence.
- Load-bearing: passes — The paper’s conclusions depend on it.
- Based: passes — The paper gives a reason why it holds.
None of the sources cited for this claim have been checked yet.
In the paper
“Thus, C. albicans like S. cerevisiae (Gresham et al., 2008; Pavelka et al., 2010; Yona et al., 2012; Chang et al., 2013) generates large scale genetic variation as a means of adaptation.”
§ The evolution of drug resistance in clinical isolates of Candida albicans > Discussion
What the sources say
plaindirect- Asserted: passes — The authors put it forward as true.
- Checkable: passes — It can be checked against evidence.
- Load-bearing: passes — The paper’s conclusions depend on it.
- Based: passes — The paper gives a reason why it holds.
A conclusion the paper draws from its own results — it cites no other source for it, so there is none to check. The quote shows it is in the paper.
In the paper
“suggesting that these are competing selective pressures.”
§ The evolution of drug resistance in clinical isolates of Candida albicans > Results > Changes in virulence phenotypes in evolved drug-resistant isolates
hedgedcorrelational- Asserted: passes — The authors put it forward as true.
- Checkable: passes — It can be checked against evidence.
- Load-bearing: passes — The paper’s conclusions depend on it.
- Based: passes — The paper gives a reason why it holds.
A conclusion the paper draws from its own results — it cites no other source for it, so there is none to check. The quote shows it is in the paper.
In the paper
“The analysis of clinical isolates identified a range of new candidate genes that may affect drug resistance, fitness, and/or virulence.”
§ The evolution of drug resistance in clinical isolates of Candida albicans > Results > Candidate mutated genes associated with drug resistance or virulence
hedgedconditional- Asserted: passes — The authors put it forward as true.
- Checkable: passes — It can be checked against evidence.
- Load-bearing: passes — The paper’s conclusions depend on it.
- Based: passes — The paper gives a reason why it holds.
A conclusion the paper draws from its own results — it cites no other source for it, so there is none to check. The quote shows it is in the paper.
In the paper
“supporting the notion that the isolates are samples from a broad range of genetic variants within clonal (single infection) populations.”
§ The evolution of drug resistance in clinical isolates of Candida albicans > Results > Changes in virulence phenotypes in evolved drug-resistant isolates
hedged- Asserted: passes — The authors put it forward as true.
- Checkable: passes — It can be checked against evidence.
- Load-bearing: passes — The paper’s conclusions depend on it.
- Based: passes — The paper gives a reason why it holds.
A conclusion the paper draws from its own results — it cites no other source for it, so there is none to check. The quote shows it is in the paper.
In the paper
“Thus, it is possible that C. albicans isolates within the human host also undergo elevated levels of LOH and of point mutations to generate a wider range of diversity.”
§ The evolution of drug resistance in clinical isolates of Candida albicans > Discussion
hedgedconditional- Asserted: passes — The authors put it forward as true.
- Checkable: passes — It can be checked against evidence.
- Load-bearing: unclear — It is unclear whether the paper’s conclusions depend on it.
- Based: passes — The paper gives a reason why it holds.
A conclusion the paper draws from its own results — it cites no other source for it, so there is none to check. The quote shows it is in the paper.
In the paper
“the absence of the extra chromosomes resulted in improved overall fitness.”
§ The evolution of drug resistance in clinical isolates of Candida albicans > Results > Changes in virulence phenotypes in evolved drug-resistant isolates
plaindirectSingle case- Asserted: passes — The authors put it forward as true.
- Checkable: passes — It can be checked against evidence.
- Load-bearing: passes — The paper’s conclusions depend on it.
- Based: passes — The paper gives a reason why it holds.
A conclusion the paper draws from its own results — it cites no other source for it, so there is none to check. The quote shows it is in the paper.
In the paper
“and are thus stronger candidates for making a significant functional contribution to resistance (Figure 5—figure supplement 1, Figure 5—source data 1D, empirical p < 10−5 based a binomial model, ‘Materials and methods’).”
§ The evolution of drug resistance in clinical isolates of Candida albicans > Results > Persistent SNPs in 240 recurrently polymorphic genes identify targets likely associated with drug resistance and host adaptation
boostedcorrelational- Asserted: passes — The authors put it forward as true.
- Checkable: passes — It can be checked against evidence.
- Load-bearing: passes — The paper’s conclusions depend on it.
- Based: passes — The paper gives a reason why it holds.
In the paper
“This is also consistent with a recent study (Sasse et al., 2012) showing that resistance conferred in C. albicans by gain-of-function mutations in the transcription factors Mrr1, Tac1, and Upc2 is associated with reduced fitness under non-selective conditions in vitro as well as in vivo during colonization of a mammalian host.”
§ The evolution of drug resistance in clinical isolates of Candida albicans > Results > Changes in virulence phenotypes in evolved drug-resistant isolates
What the sources say
- Not checked yetcites Sasse et al., 2012 source
plaincorrelational- Asserted: passes — The authors put it forward as true.
- Checkable: passes — It can be checked against evidence.
- Load-bearing: unclear — It is unclear whether the paper’s conclusions depend on it.
- Based: passes — The paper gives a reason why it holds.
In the paper
“This is consistent with the observations of Noble and co-workers that in vitro fitness is not always a reflection of virulence (Noble et al., 2010).”
§ The evolution of drug resistance in clinical isolates of Candida albicans > Results > Changes in virulence phenotypes in evolved drug-resistant isolates
What the sources say
- Not checked yetcites Noble et al., 2010 source
plainSingle case- Asserted: passes — The authors put it forward as true.
- Checkable: passes — It can be checked against evidence.
- Load-bearing: passes — The paper’s conclusions depend on it.
- Based: passes — The paper gives a reason why it holds.
In the paper
“In this context, it appears that aneuploidies (Figure 7A, green), while largely transient, may be an important intermediate giving rise to more stable adaptive genotypes in some cases”
§ The evolution of drug resistance in clinical isolates of Candida albicans > Results > Changes in virulence phenotypes in evolved drug-resistant isolates
What the sources say
- Not checked yetcites Yona et al., 2012 source
hedgedconditional- Asserted: passes — The authors put it forward as true.
- Checkable: passes — It can be checked against evidence.
- Load-bearing: unclear — It is unclear whether the paper’s conclusions depend on it.
- Based: passes — The paper gives a reason why it holds.
In the paper
“Mutations can be more readily assimilated in a diploid than in a haploid organism, since deleterious mutations are potentially buffered by a functional version (Thompson et al., 2006).”
§ The evolution of drug resistance in clinical isolates of Candida albicans > Discussion
What the sources say
- Not checked yetcites Thompson et al., 2006 source
plaindirect- Asserted: passes — The authors put it forward as true.
- Checkable: passes — It can be checked against evidence.
- Load-bearing: passes — The paper’s conclusions depend on it.
- Based: passes — The paper gives a reason why it holds.
A conclusion the paper draws from its own results — it cites no other source for it, so there is none to check. The quote shows it is in the paper.
In the paper
“The evolution of drug resistance in C. albicans has many parallels with the somatic evolution of cancer cells undergoing chemotherapy or treated with specific inhibitors.”
§ The evolution of drug resistance in clinical isolates of Candida albicans > Discussion
plaincorrelational- Asserted: passes — The authors put it forward as true.
- Checkable: passes — It can be checked against evidence.
- Load-bearing: unclear — It is unclear whether the paper’s conclusions depend on it.
- Based: passes — The paper gives a reason why it holds.
None of the sources cited for this claim have been checked yet.
In the paper
“Indeed, several recent studies have shown a similar spectrum of genetic alterations to those observed here during the somatic evolution of cancers in patients undergoing chemotherapy (Podlaha et al., 2012; Landau et al., 2013) or treated with specific inhibitors (Ding et al., 2012) to those observed here.”
§ The evolution of drug resistance in clinical isolates of Candida albicans > Discussion
What the sources say
boostedcorrelational- Asserted: passes — The authors put it forward as true.
- Checkable: passes — It can be checked against evidence.
- Load-bearing: unclear — It is unclear whether the paper’s conclusions depend on it.
- Based: passes — The paper gives a reason why it holds.
A conclusion the paper draws from its own results — it cites no other source for it, so there is none to check. The quote shows it is in the paper.
In the paper
“In addition, a substantial number of persistent and recurrent SNPs, and clusters of co-occurring SNPs, implicate a broad range of pathways and functions that likely provide some growth advantage in the presence of the complex selective pressures found in the host.”
§ The evolution of drug resistance in clinical isolates of Candida albicans > Discussion
hedgedconditional- Asserted: passes — The authors put it forward as true.
- Checkable: passes — It can be checked against evidence.
- Load-bearing: passes — The paper’s conclusions depend on it.
- Based: passes — The paper gives a reason why it holds.
- It may state two separate claims as one. 51
- Probably not a substantial claim. 18
In the paper
“For example, a nonsynonymous homozygous change in the fluconazole drug target ERG11 was associated with the formation of the persistent LOH on the left arm of chromosome 5 in Patient 1 (Figure 3A), consistent with previous reports (White, 1997b), as was TAC1 in Patient 42.”
§ The evolution of drug resistance in clinical isolates of Candida albicans > Results > LOH events are commonly associated with increased resistance
What the sources say
- Not checked yetcites White, 1997b
plaincorrelational- Asserted: passes — The authors put it forward as true.
- Checkable: passes — It can be checked against evidence.
- Load-bearing: passes — The paper’s conclusions depend on it.
- Based: passes — The paper gives a reason why it holds.
It may state two separate claims as one.
A result the paper reports from its own data — it cites no other source for it, so there is none to check. The quote shows it is in the paper.
In the paper
“Additionally, we detected at least one non-clonal C. albicans isolate in three of the remaining ten patient series (PT 9,16, 42; Figure 2B, red), indicating that at least ∼36% of the 11 patients sampled carried more than one unrelated Candida strain.”
§ The evolution of drug resistance in clinical isolates of Candida albicans > Results > Most series are clonal, but there is significant genetic diversity between isolates
hedgedn = 10- Asserted: passes — The authors put it forward as true.
- Checkable: passes — It can be checked against evidence.
- Load-bearing: unclear — It is unclear whether the paper’s conclusions depend on it.
- Based: passes — The paper gives a reason why it holds.
It may state two separate claims as one.
A result the paper reports from its own data — it cites no other source for it, so there is none to check. The quote shows it is in the paper.
In the paper
“Conversely, most aneuploidies were transient and did not correlate with drug resistance.”
- Also stated in: § Introduction · hedged
“aneuploidies were prevalent in the isolates, yet they were more likely to be transient, and aneuploidy, per se, did not correlate with changes in drug resistance.”
§ The evolution of drug resistance in clinical isolates of Candida albicans > Abstract
plain- Asserted: passes — The authors put it forward as true.
- Checkable: passes — It can be checked against evidence.
- Load-bearing: passes — The paper’s conclusions depend on it.
- Based: passes — The paper gives a reason why it holds.
It may state two separate claims as one.
- Also stated in: § Introduction · hedged
A result the paper reports from its own data — it cites no other source for it, so there is none to check. The quote shows it is in the paper.
In the paper
“The extent of persistence and recurrence of these two LOH events is statistically significant under a naïve binary model (p < 5 × 10⁻⁴ for the Chr3R LOH; p < 0.01 for the Chr5L LOH).”
§ The evolution of drug resistance in clinical isolates of Candida albicans > Results > LOH events are commonly associated with increased resistance
plaincorrelational- Asserted: passes — The authors put it forward as true.
- Checkable: passes — It can be checked against evidence.
- Load-bearing: passes — The paper’s conclusions depend on it.
- Based: passes — The paper gives a reason why it holds.
It may state two separate claims as one.
A result the paper reports from its own data — it cites no other source for it, so there is none to check. The quote shows it is in the paper.
In the paper
“SNPs in 240 genes may be related to host adaptation.”
- Also stated in: § Introduction · hedged
“We found 240 genes that recurrently contain persistent SNPs, many of which may be related not only to antifungal exposure but also to the complex process of adaptation to the host and antifungal exposure.”
§ The evolution of drug resistance in clinical isolates of Candida albicans > Abstract
hedgedcorrelationaln = 11- Asserted: passes — The authors put it forward as true.
- Checkable: passes — It can be checked against evidence.
- Load-bearing: passes — The paper’s conclusions depend on it.
- Based: passes — The paper gives a reason why it holds.
It may state two separate claims as one.
- Also stated in: § Introduction · hedged
A result the paper reports from its own data — it cites no other source for it, so there is none to check. The quote shows it is in the paper.
In the paper
“For example, three of four LOH events in Patient 1 were persistent and associated with an increase in MIC and both of these events were recurrent, such that LOH events in these genomic regions coincided with increases in MIC in other patients.”
§ The evolution of drug resistance in clinical isolates of Candida albicans > Results > LOH events are commonly associated with increased resistance
plaincorrelationalSingle case- Asserted: passes — The authors put it forward as true.
- Checkable: passes — It can be checked against evidence.
- Load-bearing: unclear — It is unclear whether the paper’s conclusions depend on it.
- Based: passes — The paper gives a reason why it holds.
It may state two separate claims as one.
A result the paper reports from its own data — it cites no other source for it, so there is none to check. The quote shows it is in the paper.
In the paper
“However, the role of pre-existing diversity is supported by the observation that different isolates collected on the same day from the same patient (patient 14 [2440 and 2501] and patient 16 [3107 and 3119]) differed by 9668 and 18,291 SNPs, respectively (Figure 2—source data 1) and had very different fluconazole MIC levels (Table 1) and different fitness phenotypes (see below), although in each”
§ The evolution of drug resistance in clinical isolates of Candida albicans > Results > Most series are clonal, but there is significant genetic diversity between isolates
plaincorrelational- Asserted: passes — The authors put it forward as true.
- Checkable: passes — It can be checked against evidence.
- Load-bearing: passes — The paper’s conclusions depend on it.
- Based: passes — The paper gives a reason why it holds.
It may state two separate claims as one.
A result the paper reports from its own data — it cites no other source for it, so there is none to check. The quote shows it is in the paper.
In the paper
“We have overlaid recurrent driver mutations (e.g., G/T > A/A) (n = 17) occurring outside of LOH regions (yellow circle, green box) and inside LOH regions (yellow circle, white box).”
§ The evolution of drug resistance in clinical isolates of Candida albicans > Results > LOH events are commonly associated with increased resistance
plainn = 17- Asserted: passes — The authors put it forward as true.
- Checkable: passes — It can be checked against evidence.
- Load-bearing: fails — The paper’s conclusions may not depend on it.
- Based: passes — The paper gives a reason why it holds.
Probably not a substantial claim. The paper’s conclusions may not depend on it.
A result the paper reports from its own data — it cites no other source for it, so there is none to check. The quote shows it is in the paper.
In the paper
“LOH events were commonly associated with acquired resistance”
- Also stated in: § Introduction · plain
“we found that LOH events were recurrent across patients' series and were associated with increased drug resistance”
- Also stated in: § LOH events are commonly associated with increased resistance · plain
“LOH events were detected in all of the series and were often persistent, recurrent, and associated with increased drug resistance”
§ The evolution of drug resistance in clinical isolates of Candida albicans > Abstract
plaincorrelationaln = 11- Asserted: passes — The authors put it forward as true.
- Checkable: passes — It can be checked against evidence.
- Load-bearing: passes — The paper’s conclusions depend on it.
- Based: passes — The paper gives a reason why it holds.
It may state two separate claims as one.
- Also stated in: § Introduction · plain
A result the paper reports from its own data — it cites no other source for it, so there is none to check. The quote shows it is in the paper.
In the paper
“Most isolates from each individual patient were highly related, suggesting a clonal population structure and facilitating the identification of variation.”
- Also stated in: § Most series are clonal, but there is significant genetic diversity between isolates · hedged
“isolates within most series were clonally related, suggesting a single (primary) infection source”
§ The evolution of drug resistance in clinical isolates of Candida albicans > Introduction
hedgedcorrelationaln = 10- Asserted: passes — The authors put it forward as true.
- Checkable: passes — It can be checked against evidence.
- Load-bearing: passes — The paper’s conclusions depend on it.
- Based: passes — The paper gives a reason why it holds.
It may state two separate claims as one.
- Also stated in: § Most series are clonal, but there is significant genetic diversity between isolates · hedged
A result the paper reports from its own data — it cites no other source for it, so there is none to check. The quote shows it is in the paper.
In the paper
“Highly recurrent LOH events occurred on the right arm of chromosome 3 (in Patients 1, 9, 14, 16, 42, and 59; Figure 3A, Figure 4A,B,D,F,H, Figure 3—source data 1) and on the left arm of chromosome 5 (in Patients 1, 14, 15, and 43; Figure 3A, Figure 4B,C,G, Figure 3—source data 1).”
§ The evolution of drug resistance in clinical isolates of Candida albicans > Results > LOH events are commonly associated with increased resistance
plain- Asserted: passes — The authors put it forward as true.
- Checkable: passes — It can be checked against evidence.
- Load-bearing: passes — The paper’s conclusions depend on it.
- Based: passes — The paper gives a reason why it holds.
It may state two separate claims as one.
A result the paper reports from its own data — it cites no other source for it, so there is none to check. The quote shows it is in the paper.
In the paper
“Our analysis also shows that isolates also varied in adherence, filamentation, and virulence.”
§ The evolution of drug resistance in clinical isolates of Candida albicans > Abstract
plain- Asserted: passes — The authors put it forward as true.
- Checkable: passes — It can be checked against evidence.
- Load-bearing: unclear — It is unclear whether the paper’s conclusions depend on it.
- Based: passes — The paper gives a reason why it holds.
It may state two separate claims as one.
A result the paper reports from its own data — it cites no other source for it, so there is none to check. The quote shows it is in the paper.
In the paper
“Notably, 17 persistent recurrently polymorphic genes also had driver-like polymorphisms, eight of which were also homozygosed in an LOH tract in at least one patient series (Figure 5, Figure 5—source data 1A,B,C).”
§ The evolution of drug resistance in clinical isolates of Candida albicans > Results > Persistent SNPs in 240 recurrently polymorphic genes identify targets likely associated with drug resistance and host adaptation
plaincorrelational- Asserted: passes — The authors put it forward as true.
- Checkable: passes — It can be checked against evidence.
- Load-bearing: unclear — It is unclear whether the paper’s conclusions depend on it.
- Based: passes — The paper gives a reason why it holds.
It may state two separate claims as one.
A result the paper reports from its own data — it cites no other source for it, so there is none to check. The quote shows it is in the paper.
In the paper
“Likewise HYR3, a known virulence gene, was persistently mutated in nine of the patients, three of which occurred in LOH tracts, including one in which a new allele was homozygosed”
§ The evolution of drug resistance in clinical isolates of Candida albicans > Results > Persistent SNPs in 240 recurrently polymorphic genes identify targets likely associated with drug resistance and host adaptation
plainn = 9- Asserted: passes — The authors put it forward as true.
- Checkable: passes — It can be checked against evidence.
- Load-bearing: unclear — It is unclear whether the paper’s conclusions depend on it.
- Based: passes — The paper gives a reason why it holds.
It may state two separate claims as one.
In the paper
“Our study identified substantial genetic diversity in each series, in contrast to the report of only 26 SNPs detected in a single clinical series of Candida glabrata isolates that spanned a 10-month period (Singh-Babak et al., 2012).”
§ The evolution of drug resistance in clinical isolates of Candida albicans > Discussion
What the sources say
- Not checked yetcites Singh-Babak et al., 2012 source
plain- Asserted: passes — The authors put it forward as true.
- Checkable: passes — It can be checked against evidence.
- Load-bearing: passes — The paper’s conclusions depend on it.
- Based: passes — The paper gives a reason why it holds.
It may state two separate claims as one.
A result the paper reports from its own data — it cites no other source for it, so there is none to check. The quote shows it is in the paper.
In the paper
“This approach allowed us to distinguish (and remove from further analysis) isolates that were non-clonal and to estimate that at least ∼30% of the patients (3/10) carried at least one non-clonal strain of C. albicans.”
§ The evolution of drug resistance in clinical isolates of Candida albicans > Discussion
hedged- Asserted: passes — The authors put it forward as true.
- Checkable: passes — It can be checked against evidence.
- Load-bearing: passes — The paper’s conclusions depend on it.
- Based: passes — The paper gives a reason why it holds.
It may state two separate claims as one.
A result the paper reports from its own data — it cites no other source for it, so there is none to check. The quote shows it is in the paper.
In the paper
“Deletion of one gene (orf19.4658) caused a twofold decrease in MIC, whereas the other 22 mutants tested did have no significant effect on MIC (data not shown).”
§ The evolution of drug resistance in clinical isolates of Candida albicans > Results > Candidate mutated genes associated with drug resistance or virulence
plaindirect- Asserted: passes — The authors put it forward as true.
- Checkable: passes — It can be checked against evidence.
- Load-bearing: passes — The paper’s conclusions depend on it.
- Based: passes — The paper gives a reason why it holds.
It may state two separate claims as one.
A result the paper reports from its own data — it cites no other source for it, so there is none to check. The quote shows it is in the paper.
In the paper
“For example, the later isolates in the series from patients 30 and 43 had increased fitness and higher virulence by all three measures (Figure 6A,B, Figure 7)”
§ The evolution of drug resistance in clinical isolates of Candida albicans > Results > Changes in virulence phenotypes in evolved drug-resistant isolates
plaincorrelational- Asserted: passes — The authors put it forward as true.
- Checkable: passes — It can be checked against evidence.
- Load-bearing: unclear — It is unclear whether the paper’s conclusions depend on it.
- Based: passes — The paper gives a reason why it holds.
It may state two separate claims as one.
A result the paper reports from its own data — it cites no other source for it, so there is none to check. The quote shows it is in the paper.
In the paper
“We identified persistent nonsynonymous coding SNPs within 1470 genes outside LOH tracts, 167 of them harboring 336 driver-like polymorphisms (Figure 5—source data 1B).”
§ The evolution of drug resistance in clinical isolates of Candida albicans > Results > Persistent SNPs in 240 recurrently polymorphic genes identify targets likely associated with drug resistance and host adaptation
plain- Asserted: passes — The authors put it forward as true.
- Checkable: passes — It can be checked against evidence.
- Load-bearing: passes — The paper’s conclusions depend on it.
- Based: passes — The paper gives a reason why it holds.
It may state two separate claims as one.
A result the paper reports from its own data — it cites no other source for it, so there is none to check. The quote shows it is in the paper.
In the paper
“For example, in Patient 1 isolate 13, an increase in MIC and a trisomy of 5 of 8 chromosomes accompanies a large decrease in fitness (in the absence of drug) relative to the preceding isolate 12 (Figure 7A) but has increased fitness in the presence of drug (Figure 7B).”
§ The evolution of drug resistance in clinical isolates of Candida albicans > Results > Changes in virulence phenotypes in evolved drug-resistant isolates
plaincorrelationalSingle case- Asserted: passes — The authors put it forward as true.
- Checkable: passes — It can be checked against evidence.
- Load-bearing: passes — The paper’s conclusions depend on it.
- Based: passes — The paper gives a reason why it holds.
It may state two separate claims as one.
A result the paper reports from its own data — it cites no other source for it, so there is none to check. The quote shows it is in the paper.
In the paper
“ERG11, which encodes the drug target of fluconazole, was affected in 70% (7/10) of the patient series with persistent SNPs in four series (Patients 9, 14, 30, and 59) and mutations in the LOH events in three series (Patients 1, 15, and 43)”
§ The evolution of drug resistance in clinical isolates of Candida albicans > Results > Persistent SNPs in 240 recurrently polymorphic genes identify targets likely associated with drug resistance and host adaptation
plain- Asserted: passes — The authors put it forward as true.
- Checkable: passes — It can be checked against evidence.
- Load-bearing: passes — The paper’s conclusions depend on it.
- Based: passes — The paper gives a reason why it holds.
It may state two separate claims as one.
A result the paper reports from its own data — it cites no other source for it, so there is none to check. The quote shows it is in the paper.
In the paper
“The set of 240 recurrently mutated genes was enriched for fungal-type cell wall (18 genes, p < 0.0012) and cell surface genes (24 genes, p < 0.00012)”
§ The evolution of drug resistance in clinical isolates of Candida albicans > Results > Persistent SNPs in 240 recurrently polymorphic genes identify targets likely associated with drug resistance and host adaptation
plaincorrelational- Asserted: passes — The authors put it forward as true.
- Checkable: passes — It can be checked against evidence.
- Load-bearing: passes — The paper’s conclusions depend on it.
- Based: passes — The paper gives a reason why it holds.
It may state two separate claims as one.
In the paper
“Three were significantly more fit than the WT parental strain (SN250, red, Figure 8), including CCN1, that encodes a G1 cyclin required for hyphal growth maintenance (Loeb et al., 1999) and orf19.4471, an ortholog of Saccharomyces cerevisiae VPS64”
§ The evolution of drug resistance in clinical isolates of Candida albicans > Results > Candidate mutated genes associated with drug resistance or virulence
What the sources say
- Not checked yetcites Loeb et al., 1999 source
plaindirect- Asserted: passes — The authors put it forward as true.
- Checkable: passes — It can be checked against evidence.
- Load-bearing: unclear — It is unclear whether the paper’s conclusions depend on it.
- Based: passes — The paper gives a reason why it holds.
It may state two separate claims as one.
A result the paper reports from its own data — it cites no other source for it, so there is none to check. The quote shows it is in the paper.
In the paper
“The gene is persistently mutated in eight series, (three of which were driver mutations)”
§ The evolution of drug resistance in clinical isolates of Candida albicans > Results > Persistent SNPs in 240 recurrently polymorphic genes identify targets likely associated with drug resistance and host adaptation
plain- Asserted: passes — The authors put it forward as true.
- Checkable: passes — It can be checked against evidence.
- Load-bearing: passes — The paper’s conclusions depend on it.
- Based: passes — The paper gives a reason why it holds.
It may state two separate claims as one.
A result the paper reports from its own data — it cites no other source for it, so there is none to check. The quote shows it is in the paper.
In the paper
“The characterized genes in most of the clusters have coherent functions. Cluster 1 is enriched for cell wall and cell surface genes, Cluster 2 for cell cycle and stress genes, Cluster 3 for genes involved in drug response, and Cluster 5 for carbohydrate binding”
§ The evolution of drug resistance in clinical isolates of Candida albicans > Results > Persistent SNPs in 240 recurrently polymorphic genes identify targets likely associated with drug resistance and host adaptation
plaincorrelational- Asserted: passes — The authors put it forward as true.
- Checkable: passes — It can be checked against evidence.
- Load-bearing: unclear — It is unclear whether the paper’s conclusions depend on it.
- Based: passes — The paper gives a reason why it holds.
It may state two separate claims as one.
A result the paper reports from its own data — it cites no other source for it, so there is none to check. The quote shows it is in the paper.
In the paper
“These again include ERG11 in patients 9, 14, 30, and 59 and TAC1 in patients 1, 7, 14, 15, 30 and 43 (Figure 5).”
§ The evolution of drug resistance in clinical isolates of Candida albicans > Results > Persistent SNPs in 240 recurrently polymorphic genes identify targets likely associated with drug resistance and host adaptation
plainn = 59- Asserted: passes — The authors put it forward as true.
- Checkable: passes — It can be checked against evidence.
- Load-bearing: unclear — It is unclear whether the paper’s conclusions depend on it.
- Based: passes — The paper gives a reason why it holds.
It may state two separate claims as one.
A result the paper reports from its own data — it cites no other source for it, so there is none to check. The quote shows it is in the paper.
In the paper
“More generally, 171 of the 240 genes were also mutated in an LOH tract in at least one additional patient (15/171 in three or more additional patients and 34/171 in two additional patients).”
§ The evolution of drug resistance in clinical isolates of Candida albicans > Results > Persistent SNPs in 240 recurrently polymorphic genes identify targets likely associated with drug resistance and host adaptation
plainn = 3- Asserted: passes — The authors put it forward as true.
- Checkable: passes — It can be checked against evidence.
- Load-bearing: passes — The paper’s conclusions depend on it.
- Based: passes — The paper gives a reason why it holds.
It may state two separate claims as one.
A result the paper reports from its own data — it cites no other source for it, so there is none to check. The quote shows it is in the paper.
In the paper
“Isolate 14 has a similar MIC phenotype to isolate 13 but is euploid (Figure 3) and is much more fit (Figure 7A).”
§ The evolution of drug resistance in clinical isolates of Candida albicans > Results > Changes in virulence phenotypes in evolved drug-resistant isolates
plaincorrelationalSingle case- Asserted: passes — The authors put it forward as true.
- Checkable: passes — It can be checked against evidence.
- Load-bearing: passes — The paper’s conclusions depend on it.
- Based: passes — The paper gives a reason why it holds.
It may state two separate claims as one.
A result the paper reports from its own data — it cites no other source for it, so there is none to check. The quote shows it is in the paper.
In the paper
“In the ten patients studied here, LOH was commonly observed and was associated with changes in MIC.”
§ The evolution of drug resistance in clinical isolates of Candida albicans > Discussion
plaincorrelationaln = 10- Asserted: passes — The authors put it forward as true.
- Checkable: passes — It can be checked against evidence.
- Load-bearing: passes — The paper’s conclusions depend on it.
- Based: passes — The paper gives a reason why it holds.
It may state two separate claims as one.
A result the paper reports from its own data — it cites no other source for it, so there is none to check. The quote shows it is in the paper.
In the paper
“and slightly reduced the fluconazole MIC as measured by the E-strip test.”
§ The evolution of drug resistance in clinical isolates of Candida albicans > Materials and methods > Competition assay to assess fitness with and without fluconazole
plaindirectSingle case- Asserted: passes — The authors put it forward as true.
- Checkable: passes — It can be checked against evidence.
- Load-bearing: fails — The paper’s conclusions may not depend on it.
- Based: passes — The paper gives a reason why it holds.
Probably not a substantial claim. The paper’s conclusions may not depend on it.
The paper states this without a source or data behind it here, so there is nothing to check it against. The quote shows it is in the paper.
In the paper
“This strain was chosen since it was a euploid strain with the highest MIC.”
§ The evolution of drug resistance in clinical isolates of Candida albicans > Materials and methods > Competition assay to assess fitness with and without fluconazole
plainSingle case- Asserted: passes — The authors put it forward as true.
- Checkable: passes — It can be checked against evidence.
- Load-bearing: passes — The paper’s conclusions depend on it.
- Based: passes — The paper gives a reason why it holds.
It may state two separate claims as one.
In the paper
“a derivative of the fluconazole-resistant (128 μg/ml) isolate 3795 from patient 9 (Table 1)”
§ The evolution of drug resistance in clinical isolates of Candida albicans > Materials and methods > Competition assay to assess fitness with and without fluconazole
What the sources say
- Not checked yetcites Table 1
plainSingle case- Asserted: passes — The authors put it forward as true.
- Checkable: passes — It can be checked against evidence.
- Load-bearing: passes — The paper’s conclusions depend on it.
- Based: passes — The paper gives a reason why it holds.
It may state two separate claims as one.
A result the paper reports from its own data — it cites no other source for it, so there is none to check. The quote shows it is in the paper.
In the paper
“While our analysis focused on recurrent SNPs in ORFs, we nonetheless cataloged the many genetic alterations found in intergenic regions (Figure 2—source data 1), some of which could affect gene regulation.”
§ The evolution of drug resistance in clinical isolates of Candida albicans > Discussion
hedged- Asserted: passes — The authors put it forward as true.
- Checkable: passes — It can be checked against evidence.
- Load-bearing: unclear — It is unclear whether the paper’s conclusions depend on it.
- Based: passes — The paper gives a reason why it holds.
It may state two separate claims as one.
In the paper
“For example, the evolved isolate 4617 in patient 59 had a dramatic increase in filamentation relative to the progenitor, which was concomitant with the appearance of persistent SNPs in genes associated with filamentous growth: CHO1, MNN2, and 7 different FGR (filamentous growth regulator) genes (Uhl et al., 2003).”
§ The evolution of drug resistance in clinical isolates of Candida albicans > Discussion
What the sources say
- Not checked yetcites Uhl et al., 2003 source
plaincorrelationalSingle case- Asserted: passes — The authors put it forward as true.
- Checkable: passes — It can be checked against evidence.
- Load-bearing: unclear — It is unclear whether the paper’s conclusions depend on it.
- Based: passes — The paper gives a reason why it holds.
It may state two separate claims as one.
The paper states this without a source or data behind it here, so there is nothing to check it against. The quote shows it is in the paper.
In the paper
“but these strains are aneuploid”
§ The evolution of drug resistance in clinical isolates of Candida albicans > Materials and methods > Competition assay to assess fitness with and without fluconazole
plainSingle case- Asserted: passes — The authors put it forward as true.
- Checkable: passes — It can be checked against evidence.
- Load-bearing: passes — The paper’s conclusions depend on it.
- Based: passes — The paper gives a reason why it holds.
It may state two separate claims as one.
The paper states this without a source or data behind it here, so there is nothing to check it against. The quote shows it is in the paper.
In the paper
“Unlike LOH events, aneuploidies were often transient and not consistently correlated to increases in drug resistance.”
§ The evolution of drug resistance in clinical isolates of Candida albicans > Discussion
plain- Asserted: passes — The authors put it forward as true.
- Checkable: passes — It can be checked against evidence.
- Load-bearing: passes — The paper’s conclusions depend on it.
- Based: passes — The paper gives a reason why it holds.
It may state two separate claims as one.
None of the sources cited for this claim have been checked yet.
In the paper
“Infections are typically treated with azole inhibitors of ergosterol biosynthesis often leading to drug resistance.”
§ The evolution of drug resistance in clinical isolates of Candida albicans > Abstract
What the sources say
plaindirect- Asserted: passes — The authors put it forward as true.
- Checkable: passes — It can be checked against evidence.
- Load-bearing: passes — The paper’s conclusions depend on it.
- Based: passes — The paper gives a reason why it holds.
It may state two separate claims as one.
None of the sources cited for this claim have been checked yet.
In the paper
“These regions include key genes implicated in drug resistance: on Chromosome 3, genes encoding the Cdr1 and Cdr2 efflux pumps and the Mrr1 transcription factor that regulates the Mdr1 major facilitator superfamily efflux pump (Schubert et al., 2011), and on Chromosome 5, genes encoding the drug target Erg11, and Tac1, a transcription factor that positively regulates expression of CDR1 and CDR2 (”
§ The evolution of drug resistance in clinical isolates of Candida albicans > Results > LOH events are commonly associated with increased resistance
What the sources say
plain- Asserted: passes — The authors put it forward as true.
- Checkable: passes — It can be checked against evidence.
- Load-bearing: passes — The paper’s conclusions depend on it.
- Based: passes — The paper gives a reason why it holds.
It may state two separate claims as one.
A conclusion the paper draws from its own results — it cites no other source for it, so there is none to check. The quote shows it is in the paper.
In the paper
“These data are consistent with two different evolutionary scenarios: accumulation of de novo mutations followed by selection (Figure 1B), or selection acting on pre-existing variation to vary the frequency of different genotypes in the population (Figure 1C).”
§ The evolution of drug resistance in clinical isolates of Candida albicans > Results > Most series are clonal, but there is significant genetic diversity between isolates
hedgedcorrelational- Asserted: passes — The authors put it forward as true.
- Checkable: passes — It can be checked against evidence.
- Load-bearing: passes — The paper’s conclusions depend on it.
- Based: passes — The paper gives a reason why it holds.
It may state two separate claims as one.
A conclusion the paper draws from its own results — it cites no other source for it, so there is none to check. The quote shows it is in the paper.
In the paper
“We reasoned that such persistent changes will include those variants that were driven to sufficiently high frequency by selection to ensure repeated sampling (Figure 1B,C, yellow lightning bolt), whereas non-persistent (transient) ones do not (Figure 1B,C, pink lightning bolt).”
§ The evolution of drug resistance in clinical isolates of Candida albicans > Results > Genetic alterations absent from the progenitor isolate, persistent within a patient, and recurrent across patients are likely adaptive
plaindirect- Asserted: passes — The authors put it forward as true.
- Checkable: passes — It can be checked against evidence.
- Load-bearing: passes — The paper’s conclusions depend on it.
- Based: passes — The paper gives a reason why it holds.
Probably not a substantial claim. It may state two separate claims as one.
None of the sources cited for this claim have been checked yet.
In the paper
“Studies in clinical isolates have implicated multiple mechanisms in resistance, but have focused on large-scale aberrations or candidate genes, and do not comprehensively chart the genetic basis of adaptation.”
- Also stated in: § Introduction · plain
“Studies in evolved isolates have implicated multiple mechanisms in drug resistance, but have focused on large-scale aberrations such as aneuploidies and LOH (Selmecki et al., 2008; 2009) or candidate genes (Perea et al., 2001; White et al., 2002), and do not comprehensively chart the genetic basis of adaptation.”
§ The evolution of drug resistance in clinical isolates of Candida albicans > Abstract
What the sources say
plain- Asserted: passes — The authors put it forward as true.
- Checkable: passes — It can be checked against evidence.
- Load-bearing: passes — The paper’s conclusions depend on it.
- Based: passes — The paper gives a reason why it holds.
It may state two separate claims as one.
- Also stated in: § Introduction · plain
A conclusion the paper draws from its own results — it cites no other source for it, so there is none to check. The quote shows it is in the paper.
In the paper
“Thus, the detection of known genes involved in drug resistance confirms the approach works and that detection of genes involved in processes implicated in virulence, suggests that these process are co-evolving.”
§ The evolution of drug resistance in clinical isolates of Candida albicans > Results > LOH events are commonly associated with increased resistance
hedgedcorrelational- Asserted: passes — The authors put it forward as true.
- Checkable: passes — It can be checked against evidence.
- Load-bearing: passes — The paper’s conclusions depend on it.
- Based: passes — The paper gives a reason why it holds.
It may state two separate claims as one.
A conclusion the paper draws from its own results — it cites no other source for it, so there is none to check. The quote shows it is in the paper.
In the paper
“Therefore, it is possible that the recurrent non-synonymous coding SNPs in the new loci, we identified in the clinical isolates confer resistance.”
§ The evolution of drug resistance in clinical isolates of Candida albicans > Results > Candidate mutated genes associated with drug resistance or virulence
hedgedconditional- Asserted: passes — The authors put it forward as true.
- Checkable: passes — It can be checked against evidence.
- Load-bearing: passes — The paper’s conclusions depend on it.
- Based: passes — The paper gives a reason why it holds.
Probably not a substantial claim.
A conclusion the paper draws from its own results — it cites no other source for it, so there is none to check. The quote shows it is in the paper.
In the paper
“Alternatively, these loci may not be involved in fluconazole resistance per se and may have a more general role in adaptation to the complex host environment.”
§ The evolution of drug resistance in clinical isolates of Candida albicans > Results > Candidate mutated genes associated with drug resistance or virulence
hedgedconditional- Asserted: passes — The authors put it forward as true.
- Checkable: passes — It can be checked against evidence.
- Load-bearing: fails — The paper’s conclusions may not depend on it.
- Based: passes — The paper gives a reason why it holds.
Probably not a substantial claim. The paper’s conclusions may not depend on it. It may state two separate claims as one.
A conclusion the paper draws from its own results — it cites no other source for it, so there is none to check. The quote shows it is in the paper.
In the paper
“Thus, the additional copy may increase the likelihood of an LOH event on that chromosome.”
§ The evolution of drug resistance in clinical isolates of Candida albicans > Results > Aneuploidies are not predictive of MIC, but may facilitate the appearance of drug resistance
hedgedconditionaln = 6- Asserted: passes — The authors put it forward as true.
- Checkable: passes — It can be checked against evidence.
- Load-bearing: passes — The paper’s conclusions depend on it.
- Based: passes — The paper gives a reason why it holds.
Probably not a substantial claim.
In the paper
“All three families are specifically expanded in the genomes of pathogenic Candida species (Butler et al., 2009).”
§ The evolution of drug resistance in clinical isolates of Candida albicans > Results > Persistent SNPs in 240 recurrently polymorphic genes identify targets likely associated with drug resistance and host adaptation
What the sources say
- Not checked yetcites Butler et al., 2009 source
plain- Asserted: passes — The authors put it forward as true.
- Checkable: passes — It can be checked against evidence.
- Load-bearing: fails — The paper’s conclusions may not depend on it.
- Based: passes — The paper gives a reason why it holds.
Probably not a substantial claim. The paper’s conclusions may not depend on it.
None of the sources cited for this claim have been checked yet.
In the paper
“LOH in several genes important for fluconazole resistance has been reported previously for ERG11 (Oliver et al., 2007), TAC1 (Coste et al., 2006), and MRR1 (Schubert et al., 2011)”
§ The evolution of drug resistance in clinical isolates of Candida albicans > Discussion
What the sources say
plain- Asserted: passes — The authors put it forward as true.
- Checkable: passes — It can be checked against evidence.
- Load-bearing: passes — The paper’s conclusions depend on it.
- Based: passes — The paper gives a reason why it holds.
Probably not a substantial claim.
What the paper did — it cites no source for this, so there is none to check. The quote shows it is in the paper.
In the paper
“and thus a larger target for mutation, our simulation accounts for gene length.”
§ The evolution of drug resistance in clinical isolates of Candida albicans > Results > Persistent SNPs in 240 recurrently polymorphic genes identify targets likely associated with drug resistance and host adaptation
plain- Asserted: passes — The authors put it forward as true.
- Checkable: passes — It can be checked against evidence.
- Load-bearing: passes — The paper’s conclusions depend on it.
- Based: passes — The paper gives a reason why it holds.
Probably not a substantial claim.
In the paper
“Consistent with the general negative effect of aneuploidy on fitness (Tang and Amon, 2013)”
§ The evolution of drug resistance in clinical isolates of Candida albicans > Results > Changes in virulence phenotypes in evolved drug-resistant isolates
What the sources say
- Not checked yetcites Tang and Amon, 2013
boosteddirect- Asserted: passes — The authors put it forward as true.
- Checkable: passes — It can be checked against evidence.
- Load-bearing: passes — The paper’s conclusions depend on it.
- Based: passes — The paper gives a reason why it holds.
Probably not a substantial claim.
In the paper
“whose transcript is upregulated in an RHE model of oral candidiasis and in clinical isolates from HIV+ patients with oral candidiasis (Zakikhany et al., 2007).”
§ The evolution of drug resistance in clinical isolates of Candida albicans > Results > Persistent SNPs in 240 recurrently polymorphic genes identify targets likely associated with drug resistance and host adaptation
What the sources say
- Not checked yetcites Zakikhany et al., 2007 source
plaincorrelational- Asserted: passes — The authors put it forward as true.
- Checkable: passes — It can be checked against evidence.
- Load-bearing: unclear — It is unclear whether the paper’s conclusions depend on it.
- Based: passes — The paper gives a reason why it holds.
It may state two separate claims as one.
A conclusion the paper draws from its own results — it cites no other source for it, so there is none to check. The quote shows it is in the paper.
In the paper
“This is consistent with the irreversibility of LOH events in the absence of mating highlights the reversible nature (instability) of aneuploidy chromosomes.”
§ The evolution of drug resistance in clinical isolates of Candida albicans > Results > Aneuploidies are not predictive of MIC, but may facilitate the appearance of drug resistance
plaindirect- Asserted: passes — The authors put it forward as true.
- Checkable: passes — It can be checked against evidence.
- Load-bearing: passes — The paper’s conclusions depend on it.
- Based: passes — The paper gives a reason why it holds.
It may state two separate claims as one.
A conclusion the paper draws from its own results — it cites no other source for it, so there is none to check. The quote shows it is in the paper.
In the paper
“Most of the genes in these clusters are not well characterized and represent new candidates involved drug resistance and adaptation to the host environment.”
§ The evolution of drug resistance in clinical isolates of Candida albicans > Results > Persistent SNPs in 240 recurrently polymorphic genes identify targets likely associated with drug resistance and host adaptation
plaincorrelational- Asserted: passes — The authors put it forward as true.
- Checkable: passes — It can be checked against evidence.
- Load-bearing: passes — The paper’s conclusions depend on it.
- Based: passes — The paper gives a reason why it holds.
It may state two separate claims as one.
What the paper did — it cites no source for this, so there is none to check. The quote shows it is in the paper.
In the paper
“Isolate 4380 aligned poorly to the SC5314 genome; however, this sequence aligned at high identity to the C. dubliniensis genome and was therefore removed from further analysis.”
§ The evolution of drug resistance in clinical isolates of Candida albicans > Materials and methods > Illumina sequencing
plaindirectSingle case- Asserted: passes — The authors put it forward as true.
- Checkable: passes — It can be checked against evidence.
- Load-bearing: fails — The paper’s conclusions may not depend on it.
- Based: passes — The paper gives a reason why it holds.
Probably not a substantial claim. The paper’s conclusions may not depend on it. It may state two separate claims as one.
A conclusion the paper draws from its own results — it cites no other source for it, so there is none to check. The quote shows it is in the paper.
In the paper
“Nevertheless, aneuploidies may cause increased frequencies of LOH events through whole chromosome loss, as well as by increasing the likelihood of recombination events.”
§ The evolution of drug resistance in clinical isolates of Candida albicans > Discussion
hedgedconditional- Asserted: passes — The authors put it forward as true.
- Checkable: passes — It can be checked against evidence.
- Load-bearing: fails — The paper’s conclusions may not depend on it.
- Based: fails — The paper may give no reason why it holds.
Probably not a substantial claim. The paper’s conclusions may not depend on it. The paper may give no reason why it holds. It may state two separate claims as one.
In the paper
“A transient role for aneuploidy is consistent with recent findings from in vitro evolution studies in S. cerevisiae (Yona et al., 2012) in which a transient aneuploidy was responsible for fitness at elevated temperature, but was eventually replaced by a more stable mutation.”
§ The evolution of drug resistance in clinical isolates of Candida albicans > Discussion
What the sources say
- Not checked yetcites Yona et al., 2012 source
plaindirect- Asserted: passes — The authors put it forward as true.
- Checkable: passes — It can be checked against evidence.
- Load-bearing: fails — The paper’s conclusions may not depend on it.
- Based: passes — The paper gives a reason why it holds.
Probably not a substantial claim. The paper’s conclusions may not depend on it.
What the paper did — it cites no source for this, so there is none to check. The quote shows it is in the paper.
In the paper
“1,853 predictions were confirmed as correct by Sequenom genotyping and 120 were discordant (Table 2), to a calling accuracy of 93.9%.”
§ The evolution of drug resistance in clinical isolates of Candida albicans > Materials and methods > Sequenom iPLEX genotyping assay
plainn = 9- Asserted: passes — The authors put it forward as true.
- Checkable: passes — It can be checked against evidence.
- Load-bearing: passes — The paper’s conclusions depend on it.
- Based: passes — The paper gives a reason why it holds.
It may state two separate claims as one.
What the paper did — it cites no source for this, so there is none to check. The quote shows it is in the paper.
In the paper
“Isolates were colony purified at collection and represent a single clone.”
§ The evolution of drug resistance in clinical isolates of Candida albicans > Materials and methods > Isolates
plain- Asserted: passes — The authors put it forward as true.
- Checkable: passes — It can be checked against evidence.
- Load-bearing: passes — The paper’s conclusions depend on it.
- Based: passes — The paper gives a reason why it holds.
Probably not a substantial claim. It may state two separate claims as one.
A conclusion the paper draws from its own results — it cites no other source for it, so there is none to check. The quote shows it is in the paper.
In the paper
“Our results suggest there may be complex population dynamics during the transition from commensal to pathogen and across the course of treatment.”
§ The evolution of drug resistance in clinical isolates of Candida albicans > Discussion
hedged- Asserted: passes — The authors put it forward as true.
- Checkable: fails — It may be too vague to check against evidence.
- Load-bearing: fails — The paper’s conclusions may not depend on it.
- Based: passes — The paper gives a reason why it holds.
Probably not a substantial claim. It may be too vague to check against evidence. The paper’s conclusions may not depend on it.
In the paper
“Variation in intragenic repeat number modulates phenotypic diversity in adhesion and biofilm formation (Verstrepen et al., 2005).”
§ The evolution of drug resistance in clinical isolates of Candida albicans > Discussion
What the sources say
- Not checked yetcites Verstrepen et al., 2005 source
plaindirect- Asserted: passes — The authors put it forward as true.
- Checkable: passes — It can be checked against evidence.
- Load-bearing: fails — The paper’s conclusions may not depend on it.
- Based: passes — The paper gives a reason why it holds.
Probably not a substantial claim. The paper’s conclusions may not depend on it.
In the paper
“This functional diversity of cell surface antigens has been proposed to allow rapid adaptation to the environment as well as evasion of the host immune system in fungi and other pathogens (Gemayel et al., 2010).”
§ The evolution of drug resistance in clinical isolates of Candida albicans > Discussion
What the sources say
- Not checked yetcites Gemayel et al., 2010 source
hedgedconditional- Asserted: passes — The authors put it forward as true.
- Checkable: passes — It can be checked against evidence.
- Load-bearing: fails — The paper’s conclusions may not depend on it.
- Based: passes — The paper gives a reason why it holds.
Probably not a substantial claim. The paper’s conclusions may not depend on it. It may state two separate claims as one.
A conclusion the paper draws from its own results — it cites no other source for it, so there is none to check. The quote shows it is in the paper.
In the paper
“and thus the potential loss of additional chromosomes during the course of the competition could alter fitness and confound our results.”
§ The evolution of drug resistance in clinical isolates of Candida albicans > Materials and methods > Competition assay to assess fitness with and without fluconazole
hedgedconditionaln = 2- Asserted: passes — The authors put it forward as true.
- Checkable: passes — It can be checked against evidence.
- Load-bearing: passes — The paper’s conclusions depend on it.
- Based: passes — The paper gives a reason why it holds.
Probably not a substantial claim. It may state two separate claims as one.
A conclusion the paper draws from its own results — it cites no other source for it, so there is none to check. The quote shows it is in the paper.
In the paper
“Indeed, many of the isolates evolved additional phenotypes, including changes in in vitro fitness, filamentation, adhesion, and in vivo virulence, and the data presented here points to candidate genes that underlie some of these evolved traits.”
§ The evolution of drug resistance in clinical isolates of Candida albicans > Discussion
hedgedcorrelational- Asserted: passes — The authors put it forward as true.
- Checkable: passes — It can be checked against evidence.
- Load-bearing: passes — The paper’s conclusions depend on it.
- Based: passes — The paper gives a reason why it holds.
It may state two separate claims as one.
The paper relies on this without support.
Fluconazole is fungistatic, such that many cells exposed to the drug arrest their growth but do not die.
“First, fluconazole, the antifungal drug used to treat the patients in our series, is fungistatic, such that many cells exposed to the drug arrest their growth but do not die.”
The paper relies on this without support.
C. albicans is a highly heterozygous diploid whereas C. glabrata is haploid.
“Second, C. albicans is a highly heterozygous diploid whereas C. glabrata is haploid.”
The paper relies on this without support.
The culture medium used for in vitro fitness assays approximates in vivo conditions.
“5 of the 22 deletion mutants reduced in vitro fitness in a culture medium thought to approximate in vivo conditions (Figure 8, ‘Materials and methods’).”
Claims other papers make about this one
Each is checked against this paper’s own text: does it say what the citing paper says it does?
The source backs part of the claim, not all of it — or backs it for a different population, condition or comparison.
In the citing paper
“Over the past 20 years, these strains have been extensively investigated at the genomic and transcriptomic levels to elucidate the mechanisms of resistance (25–35), revealing a combination of various resistance mechanisms among the resistant strains (Table 1).”
From Potential role of lysine acetylation in the stepwise adaptation of Candida albicans to fluconazole (2025) · cites this paper as [32]
Experimental — accuracy not yet measuredThe cited source says what the claim attributes to it.
In the citing paper
“These LOH events included homozygosis of a region of the left arm of chromosome 5 that includes a point mutation in ERG1155.”
From Drug resistance and tolerance in fungi. (2020) · cites this paper as [55]
The cited source says what the claim attributes to it.
In the citing paper
“Homozygosis of this ERG11 allele was persistent (retained in the infecting population for more than 8 months55), consistent with the notion that mutations in ERG11 promote pathogen survival under drug selection56.”
From Drug resistance and tolerance in fungi. (2020) · cites this paper as [55]
The cited source says what the claim attributes to it.
In the citing paper
“For example, in a series of clinical C. albicans isolates from the same patient with HIV treated with fluconazole54,55, LOH events that were retained in all subsequent isolates arose concomitant with the acquisition of bona fide resistance.”
From Drug resistance and tolerance in fungi. (2020) · cites this paper as [55]
In the citing paper
“Despite the usually clonal nature of clinical isolates obtained from the same patient, it is known that there exist significant variation within C. albicans samples, suggesting that selection to become more resistant to drugs can shape the genetic variation of infecting populations (Ford et al., 2015; Hirakawa et al., 2015).”
From Genome Comparisons of Candida glabrata Serial Clinical Isolates Reveal Patterns of Genetic Variation in Infecting Clonal Populations (2019) · cites this paper as Ford et al., 2015
In the citing paper
“Extra copies of hr3 (Perepnikhatka et al. 1999; Ford et al. 2015), Chr4 (Perepnikhatka et al. 1999; Anderson et al. 2017), and Chr5 (Coste et al. 2006; Selmecki et al. 2006, 2008; Ford et al. 2015; Todd et al. 2019) have previously been shown to confer increased resistance to FLC”
From Acquisition of cross-azole tolerance and aneuploidy in Candida albicans strains evolved to posaconazole (2022) · cites this paper as Ford et al. 2015
In the citing paper
“Recent analysis of large-scale genomic changes in 43 clinical isolates of C. albicans showed that, while loss-of-heterozygosity events were persistent and often associated with resistance, aneuploidies in clinical isolates were often transient and did not correlate with drug resistance.”
From Molecular and genetic basis of azole antifungal resistance in the opportunistic pathogenic fungus Candida albicans (2020) · cites this paper as [156]
Self-check
Percentages, sums and reported differences re-computed from the paper’s own numbers.
Each contradiction between two passages listed here was confirmed by an independent check.
Rated major: it would touch a result — a value a result rests on, reported and recomputed p-values on opposite sides of the significance level, two passages that conflict with no sign which is right, or a cited work retracted before this paper was published.
In the paper
§ The evolution of drug resistance in clinical isolates of Candida albicans > Materials and methods > Competition assay to assess fitness with and without fluconazole
“the reference strain used was a derivative of the drug-resistant isolate 4639 from patient 59 (Table 1) expressing ENO1::YFP”
§ The evolution of drug resistance in clinical isolates of Candida albicans > Materials and methods > Competition assay to assess fitness with and without fluconazole
“we constructed a derivative of the fluconazole-resistant (128 μg/ml) isolate 3795 from patient 9 (Table 1) that expresses ENO1::YFP to use as the reference for competitive fitness assays in the presence and absence of fluconazole”
Rated minor: it would not touch a result — a value no result rests on, a p-value that stays on the same side of the significance level, or a conflict that is clerical, resolved elsewhere in the paper, or outside its own findings.
In the paper
§ The evolution of drug resistance in clinical isolates of Candida albicans > Results > LOH events are commonly associated with increased resistance
“genes in which nonsynonymous persistent SNPs appear in more than three patients and are not within an LOH region”
§ The evolution of drug resistance in clinical isolates of Candida albicans > Results > Persistent SNPs in 240 recurrently polymorphic genes identify targets likely associated with drug resistance and host adaptation
“persistent nonsynonymous SNPs that appeared in the same ORFs in three or more patient series”
Rated minor: it would not touch a result — a value no result rests on, a p-value that stays on the same side of the significance level, or a conflict that is clerical, resolved elsewhere in the paper, or outside its own findings.
In the paper
§ The evolution of drug resistance in clinical isolates of Candida albicans > Results > Most series are clonal, but there is significant genetic diversity between isolates
“used as a heuristic a neighbor-joining algorithm to construct a phylogenetic tree from this distance metric”
§ The evolution of drug resistance in clinical isolates of Candida albicans > Materials and methods > Determination of relatedness to determine clonality
“A distance based tree was estimated using maximum parsimony with PAUP* (4.0)”
Rated minor: it would not touch a result — a value no result rests on, a p-value that stays on the same side of the significance level, or a conflict that is clerical, resolved elsewhere in the paper, or outside its own findings.
In the paper
§ The evolution of drug resistance in clinical isolates of Candida albicans > Results > Most series are clonal, but there is significant genetic diversity between isolates
“different isolates collected on the same day from the same patient (patient 14 [2440 and 2501] and patient 16 [3107 and 3119])”
§ The evolution of drug resistance in clinical isolates of Candida albicans > Results > Whole genome sequencing of 43 serial clinical isolates from 11 patients
“| | | 2440 | 1/3/96 | Fluconazole | 800 | 1.5 | 82.93 | 15,446,882 | 85.69% | | | | 2501* | 1/4/96 | Fluconazole | 800 | 96 | 88.59 | 17,480,274 | 81.98% |”
Rated minor: it would not touch a result — a value no result rests on, a p-value that stays on the same side of the significance level, or a conflict that is clerical, resolved elsewhere in the paper, or outside its own findings.
In the paper
§ The evolution of drug resistance in clinical isolates of Candida albicans > Results > Persistent SNPs in 240 recurrently polymorphic genes identify targets likely associated with drug resistance and host adaptation
“We identified persistent nonsynonymous coding SNPs within 1470 genes outside LOH tracts”
§ The evolution of drug resistance in clinical isolates of Candida albicans > Materials and methods > Classification of SNPs
“To determine if the number of persistent non-synonymous SNPs (nsSNPs) occurring in conjunction with changes in MIC was greater than expected, we developed a simple model to simulate the occurrence of nsSNPs outside of LOH regions at each time point. For each time point (i), a random variable Xi ∼ Pois(λi) was assigned, where λi represents the Poisson parameter for each time point:λi = m/T × ti;m = 1471, the number of ORFs with persistent nsSNP”
Citations
Cites
Fast and accurate short read alignment with Burrows-Wheeler transform
Li, H., & Durbin, R. (2009) · Bioinformatics · doi:10.1093/bioinformatics/btp324 · Cited by 58,607
The Genome Analysis Toolkit: A MapReduce framework for analyzing next-generation DNA sequencing data
McKenna, A., Hanna, M., Banks, E., Sivachenko, A., Cibulskis, K., Kernytsky, A., Garimella, K., Altshuler, D., Gabriel, S., Daly, M., et al. (2010) · Genome Research · doi:10.1101/gr.107524.110 · Cited by 27,895
Full-length transcriptome assembly from RNA-Seq data without a reference genome
Grabherr, M. G., Haas, B. J., Yassour, M., Levin, J. Z., Thompson, D. A., Amit, I., Adiconis, X., Fan, L., Raychowdhury, R., Zeng, Q., et al. (2011) · Nature Biotechnology · doi:10.1038/nbt.1883 · Cited by 21,201
Self-citationRobinson, J. T., Thorvaldsdóttir, H., Winckler, W., Guttman, M., Lander, E. S., Getz, G., & Mesirov, J. P. (2011) · Nature Biotechnology · doi:10.1038/nbt.1754 · Cited by 15,390
PAUP^* : Phylogenetic Analysis Using Parsimony (and other methods) 4.0b8
Swofford, D. L. (2001) · Cited by 12,789
Metagenes and molecular pattern discovery using matrix factorization
Brunet, J.-P., Tamayo, P., Golub, T. R., & Mesirov, J. P. (2004) · Proceedings of the National Academy of Sciences · doi:10.1073/pnas.0308531101 · Cited by 2,183
The impact of next-generation sequencing technology on genetics
Mardis, E. R. (2008) · Trends in Genetics · doi:10.1016/j.tig.2007.12.007 · Cited by 2,113
Reich, M. M., Liefeld, T., Gould, J., Lerner, J., Tamayo, P., & Mesirov, J. P. (2006) · Nature Genetics · doi:10.1038/ng0506-500 · Cited by 2,053
Clonal evolution in relapsed acute myeloid leukaemia revealed by whole-genome sequencing
Ding, L., Ley, T. J., Larson, D. E., Miller, C. A., Koboldt, D. C., Welch, J. S., Ritchey, J. K., Young, M. A., Lamprecht, T., McLellan, M. D., et al. (2012) · Nature · doi:10.1038/nature10738 · Cited by 1,993
Nonfilamentous C. albicans Mutants Are Avirulent
Lo, H.-J., Köhler, J. R., DiDomenico, B., Loebenberg, D., Cacciapuoti, A., & Fink, G. R. (1997) · Cell · doi:10.1016/s0092-8674(00)80358-x · Cited by 1,809
Cited by
Sorted by citations
Drug resistance and tolerance in fungi.
Berman, J., & Krysan, D. J. (2020) · Nature Reviews Microbiology · doi:10.1038/s41579-019-0322-2 · Cited by 642
Self-citationCandidiasis and Mechanisms of Antifungal Resistance
Bhattacharya, S., Sae-Tia, S., & Fries, B. C. (2020) · Antibiotics · doi:10.3390/antibiotics9060312 · Cited by 474
Molecular Evolution of Antifungal Drug Resistance
Robbins, N., Caplan, T., & Cowen, L. E. (2017) · Annual Review of Microbiology · doi:10.1146/annurev-micro-030117-020345 · Cited by 441
d’Enfert, C., Kaune, A.-K., Alaban, L. R., Chakraborty, S., Cole, N. L., Delavy, M., Kosmala, D., Marsaux, B., Fróis-Martins, R., Morelli, M., et al. (2020) · FEMS Microbiology Reviews · doi:10.1093/femsre/fuaa060 · Cited by 377
The genomic consequences of hybridization
Moran, B. M., Payne, C. Y., Langdon, Q. K., Powell, D. L., Brandvain, Y. J., & Schumer, M. E. (2021) · eLife · doi:10.7554/elife.69016 · Cited by 342
Metadata
- Authors
- Ford, C. B., Funt, J. M., Abbey, D., Issi, L., Guiducci, C., Martinez, D. A., Delorey, T., Li, B. Y., White, T. C., Cuomo, C., Rao, R. P., Berman, J., Thompson, D. A., & Regev, A.
- Affiliations
- Broad Institute (US)
- University of Minnesota (US)
- Worcester Polytechnic Institute (US)
- University of Missouri–Kansas City (US)
- Corresponding author
- Thompson, Dawn A
- Regev, Aviv
- ORCID
- Venue
- eLife
- Publisher
- eLife Sciences Publications, Ltd
- Published
- 2015-02-03
- Volume
- 4
- Pages
- e00662-e00662
- ISSN
- 2050-084X (ISSN-L)
- PMC
- PMC4383195
- OpenAlex
- W2089758228
- Semantic Scholar
- 874a0ac2f4bc41d9b2662f76f63140c6c7e49a5d
- Cited by
- 348
- References
- 91
- Citations by year
- 2026: 15 · 2025: 32 · 2024: 26 · 2023: 36 · 2022: 30 · 2021: 35 · 2020: 30 · 2019: 39 · 2018: 39 · 2017: 38 · 2016: 15 · 2015: 12
- FWCI
- 26.99
- Type
- journal article
- Language
- en
- Open access
- gold
- doi.org
- Licence
- Locations
- eLife (publishedVersion, cc-by)
- Europe PMC (PubMed Central) (publishedVersion, cc-by)
- PubMed Central (publishedVersion, cc-by)
- PubMed (publishedVersion)
- Digital WPI (submittedVersion, cc-by)
- DSpace@MIT (Massachusetts Institute of Technology) (submittedVersion, cc-by)
- DOAJ (DOAJ: Directory of Open Access Journals) (submittedVersion, cc-by-sa)
- Funders
- National Science Foundation (Graduate Student Fellowship)
- Howard Hughes Medical Institute (Full investigator)
- Helen Hay Whitney Foundation (Postdoctoral Fellowship)
- National Institutes of Health (8DP1CA174427, 2R01CA119176-01)
- Alfred P. Sloan Foundation
- Topics
- Health Sciences › Medicine › Infectious Diseases › Antifungal resistance and susceptibility
- Life Sciences › Biochemistry, Genetics and Molecular Biology › Molecular Biology › Fungal and yeast genetics research
- Life Sciences › Immunology and Microbiology › Microbiology › Yeasts and Rust Fungi Studies
- Keywords
- Candida albicans, drug resistance, azole resistance, ergosterol biosynthesis, oral candidiasis, loss of heterozygosity, copy number variation, single nucleotide polymorphisms, aneuploidy, host adaptation, fungal virulence, filamentation, cell adhesion, clinical isolates
- MeSH terms
- Adhesiveness, Aneuploidy, Candida albicans, Candidiasis, Humans, Microbial Sensitivity Tests, Mutation, Phenotype, Virulence, Fluconazole, Genome, Human, Sequence Analysis, DNA, Evolution, Molecular, Loss of Heterozygosity, Polymorphism, Single Nucleotide, Drug Resistance, Fungal, Host-Pathogen Interactions, Genetic Fitness
About these checks
Registry, retraction, Cites and statistics results are computed, not judged, with one exception: a printed reference that no index lists is read once by a model before it counts as a citation error. Claims are extracted by a model and kept only when their quote appears verbatim in the text; each cited source is then checked, with a model’s help, for whether it says what the claim relies on. Those verdicts can be wrong — read the claim’s quote and the cited source before relying on one.
A language model drew the claims from the paper on 2026-10-09, under version 3 of the claim definition (model deepseek-v4.1-flash, prompt extract-v3).
A second model labelled each claim on 2026-10-09 (model jev-1.13-20260917, definition revision gold-guideline-v0.2).
Cited sources are checked with a language model’s help (gpt-6-sol).
Statistics and arithmetic are recomputed, not judged.
Confidence bands are shown only for fields calibrated on our annotated test set. None is calibrated yet, so no band is shown.
What counts as a claim ›How we measure confidence ›How we check this ›
Are you an author, or do you see a problem with this page? Request a review
