

The DOI matches its Crossref record; 128 of the 131 references it cites were found in a registry or an index, and 1 are not checked yet.
Anterior insular cortex plays a critical role in interoceptive attention
Open accessPublished version of a preprint
Abstract
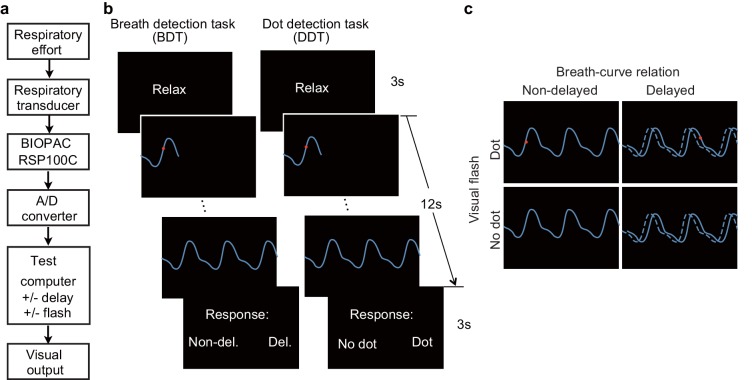
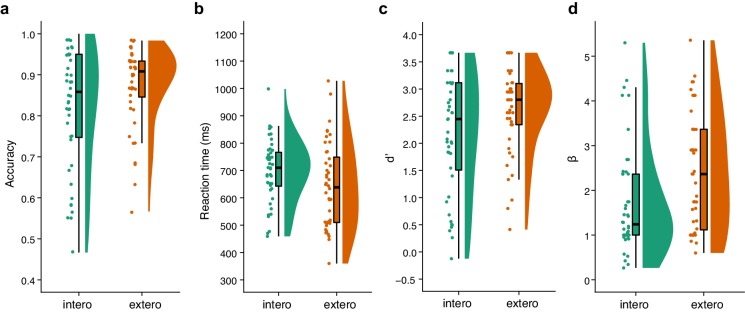
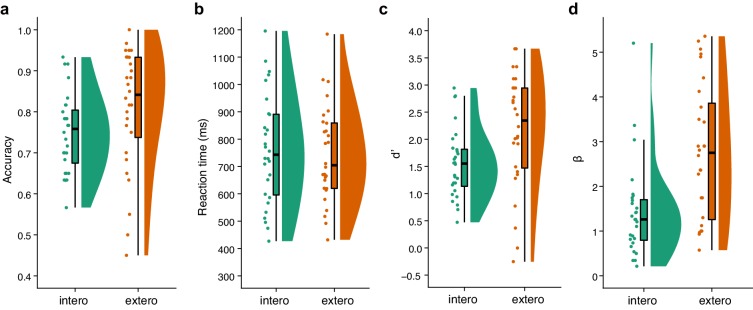
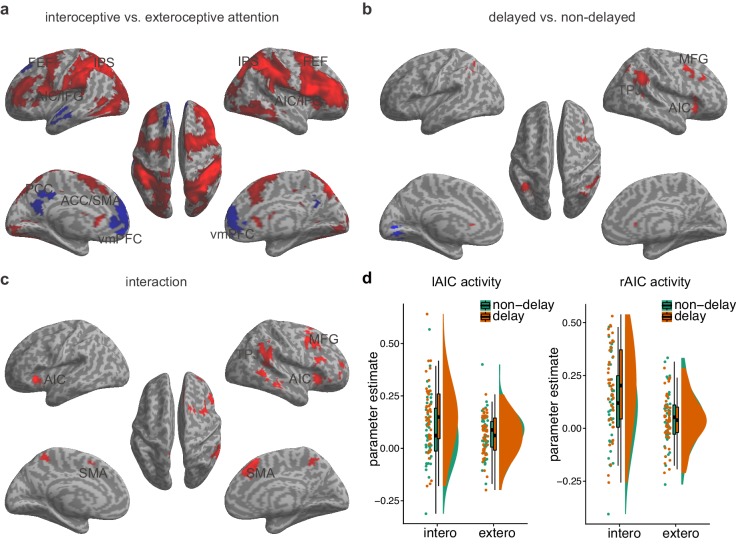
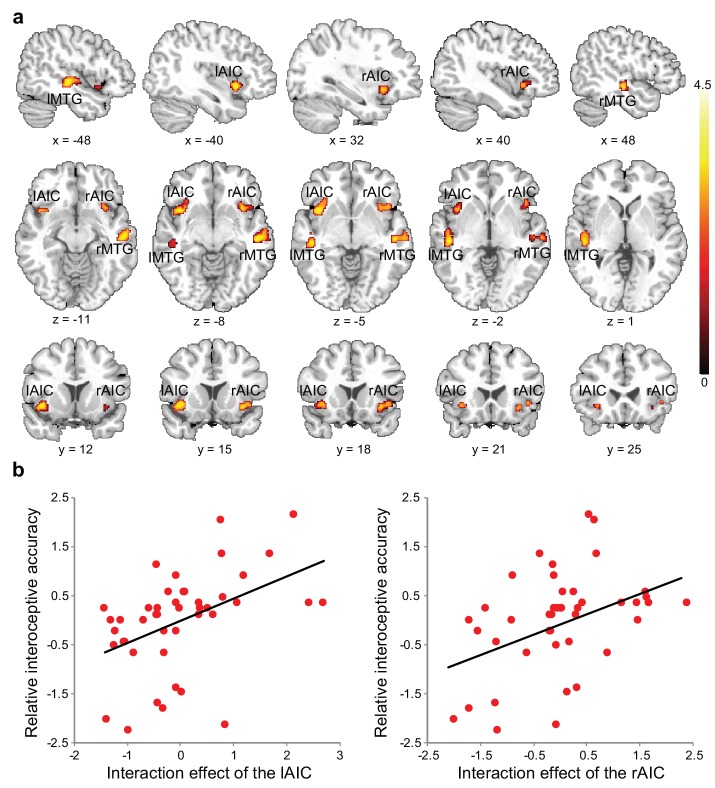
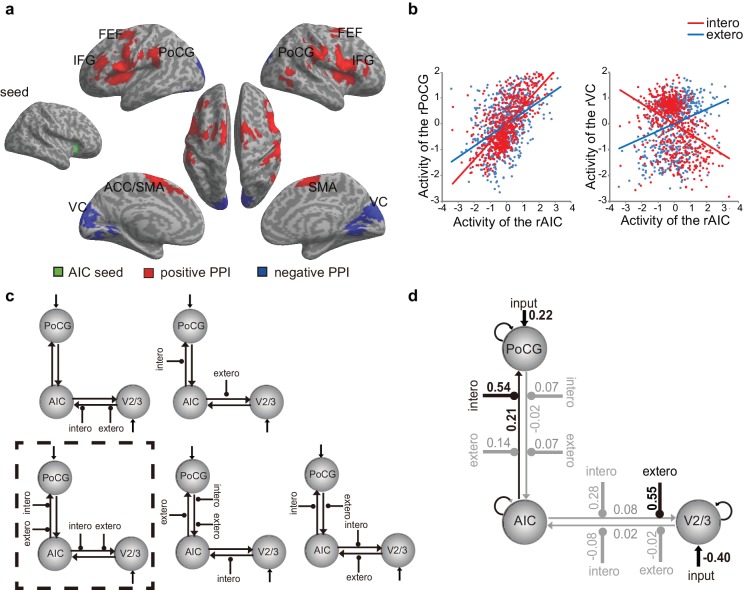
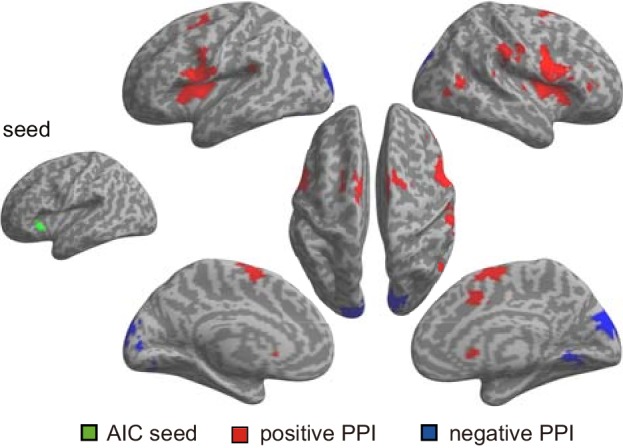
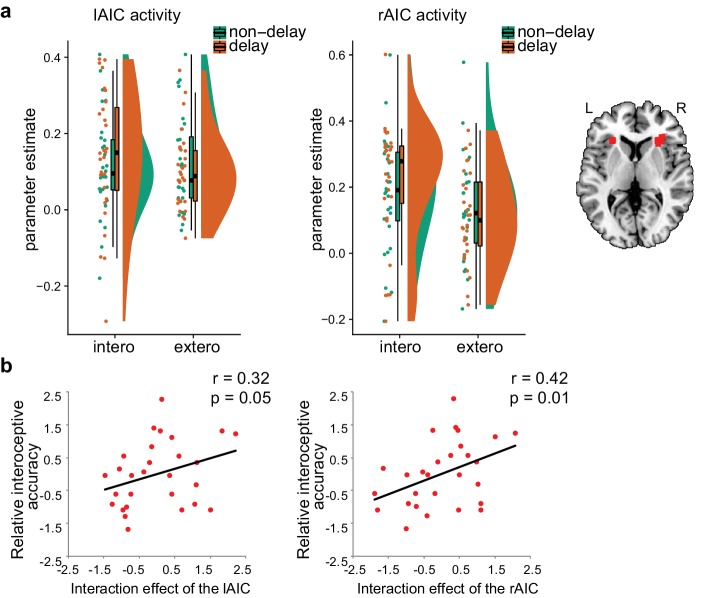
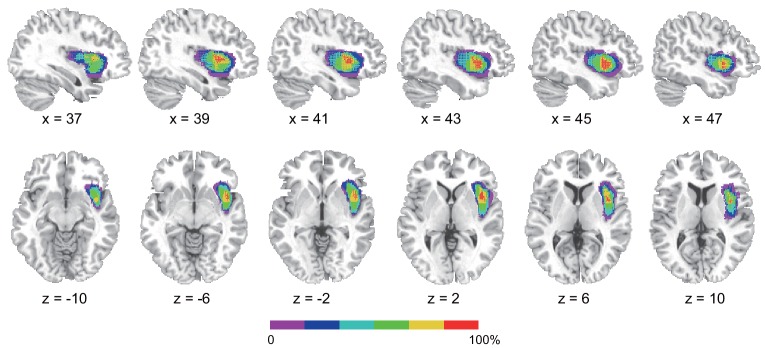
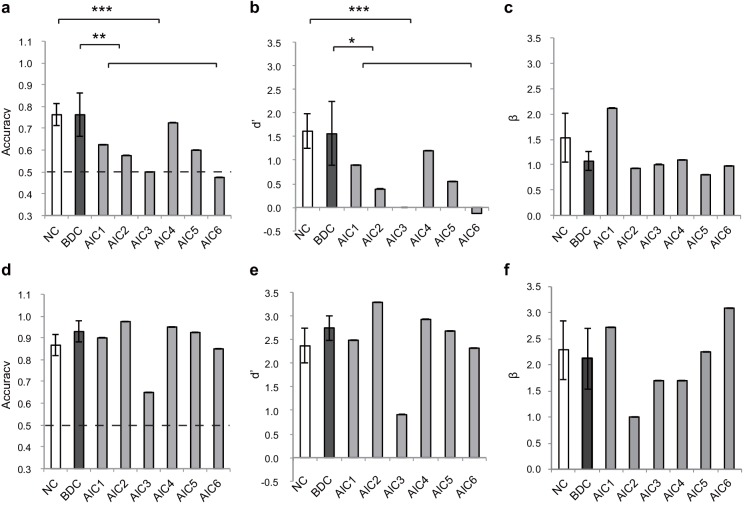
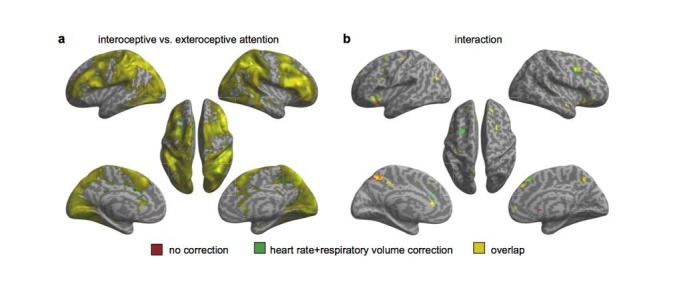
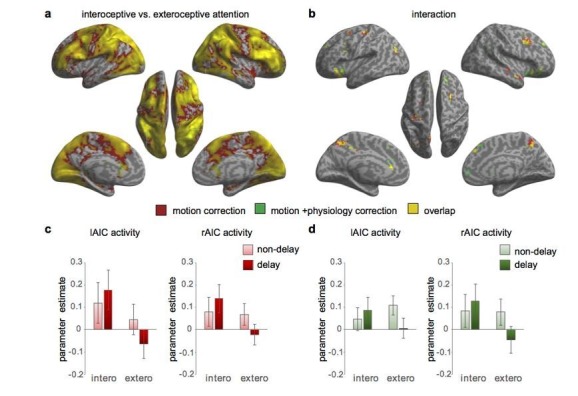
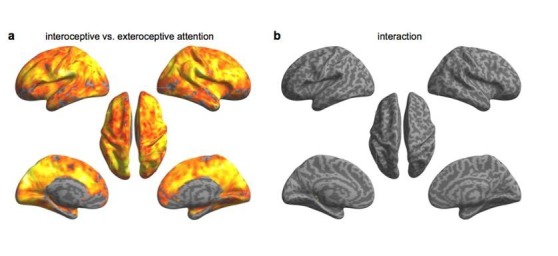
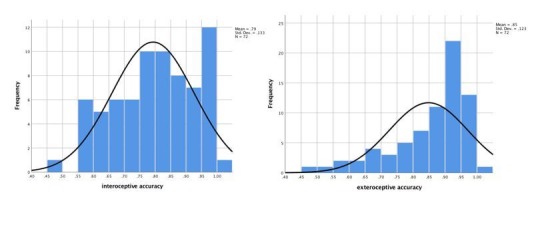
Accumulating evidence indicates that the anterior insular cortex (AIC) mediates interoceptive attention which refers to attention towards physiological signals arising from the body. However, the necessity of the AIC in this process has not been demonstrated. Using a novel task that directs attention toward breathing rhythm, we assessed the involvement of the AIC in interoceptive attention in healthy participants using functional magnetic resonance imaging and examined the necessity of the AIC in interoceptive attention in patients with AIC lesions. Results showed that interoceptive attention was associated with increased AIC activation, as well as enhanced coupling between the AIC and somatosensory areas along with reduced coupling between the AIC and visual sensory areas. In addition, AIC activation was predictive of individual differences in interoceptive accuracy. Importantly, AIC lesion patients showed disrupted interoceptive discrimination accuracy and sensitivity. These results provide compelling evidence that the AIC plays a critical role in interoceptive attention.
Overview
The claims and statistics of this paper haven’t been checked yet.
Run the check — free, no account needed. It reads the open-access text and checks the sources it cites.
Integrity signals
Registry
Cites
Statistics
Figures
Verification
Claims the paper makes
The claims and statistics of this paper haven’t been checked yet.
Run the check — free, no account needed. It reads the open-access text and checks the sources it cites.
Claims other papers make about this one
Each is checked against this paper’s own text: does it say what the citing paper says it does?
The cited source says what the claim attributes to it.
In the citing paper
“AIC, that plays a crucial role in mediating interoceptive awareness (Wang et al. 2019)”
From Neuroanatomical correlates of peripersonal space: bridging the gap between perception, action, emotion and social cognition (2024) · cites this paper as Wang et al. 2019
Self-check
Percentages, sums and reported differences re-computed from the paper’s own numbers.
The self-check needs the paper’s full text.
Citations
Cites
R: A Language and Environment for Statistical Computing
R Core Team (2000) · doi:10.32614/r.manuals · Cited by 355,893
Folstein, M. F., Folstein, S. E., & McHugh, P. R. (1975) · Journal of Psychiatric Research · doi:10.1016/0022-3956(75)90026-6 · Cited by 88,282
James, W. (1891) · Personality Culture Society · doi:10.1037/11059-000 · Cited by 25,876
Hirono, N., Mori, E., Ikejiri, Y., Imamura, T., Shimomura, T., Hashimoto, M., Yamashita, H., & Ikeda, M. (1997) · PubMed · Cited by 21,012
Kok, J. S., Berg, I. J., & Scherder, E. J. A. (2013) · Dementia and Geriatric Cognitive Disorders Extra · doi:10.1159/000353441 · Cited by 20,589
Older Adults' Reasons for Using Technology while Aging in Place
Peek, S. T. M., Luijkx, K. G., Rijnaard, M. D., Nieboer, M. E., van der Voort, C. S., Aarts, S., van Hoof, J., Vrijhoef, H. J., & Wouters, E. (2015) · Gerontology · doi:10.1159/000430949 · Cited by 19,852
Sensitivity and False Alarm Rate of a Fall Sensor in Long-Term Fall Detection in the Elderly
Kangas, M., Korpelainen, R., Vikman, I., Nyberg, L., & Jämsä, T. J. (2014) · Gerontology · doi:10.1159/000362720 · Cited by 19,007
Tzourio-Mazoyer, N., Landeau, B., Papathanassiou, D., Crivello, F., Etard, O., Delcroix, N., Mazoyer, B., & Joliot, M. (2002) · NeuroImage · doi:10.1006/nimg.2001.0978 · Cited by 16,319
A default mode of brain function
Raichle, M. E., MacLeod, A. M., Snyder, A. Z., Powers, W. J., Gusnard, D. A., & Shulman, G. L. (2001) · Proceedings of the National Academy of Sciences · doi:10.1073/pnas.98.2.676 · Cited by 12,190
Dissociable intrinsic connectivity networks for salience processing and executive control
Seeley, W. W., Menon, V., Schatzberg, A. F., Keller, J., Glover, G. H., Kenna, H., Reiss, A. L., & Greicius, M. D. (2007) · The Journal of Neuroscience · doi:10.1523/jneurosci.5587-06.2007 · Cited by 7,426
How do you feel — now? The anterior insula and human awareness
(Bud) Craig, A. D. (2009) · Nature Reviews Neuroscience · doi:10.1038/nrn2555 · Cited by 6,657 · cited 1×
“The AIC is a key node of the large-scale network that detects 700 information from multiple sources including objective visceral signals and generates 701 subjective awareness (Craig, 2009; Gu et al., 2012; Gu et al., 2015; Kleckner et al., 2017; 702 Seeley et al., 2007), as well as responding to the switch between ne…”
BackgroundHow do you feel? Interoception: The sense of the physiological condition of the body
Craig, A. D. (2002) · Nature Reviews Neuroscience · doi:10.1038/nrn894 · Cited by 6,006
Saliency, switching, attention and control: a network model of insula function
Menon, V., & Uddin, L. Q. (2010) · Brain Structure and Function · doi:10.1007/s00429-010-0262-0 · Cited by 5,592
Rao, R. P. N., & Ballard, D. H. (1999) · Nature Neuroscience · doi:10.1038/4580 · Cited by 5,483
Friston, K. J., Harrison, L., & Penny, W. (2003) · NeuroImage · doi:10.1016/s1053-8119(03)00202-7 · Cited by 4,583
Large-scale brain networks and psychopathology: a unifying triple network model
Menon, V. (2011) · Trends in Cognitive Sciences · doi:10.1016/j.tics.2011.08.003 · Cited by 4,168
The reorienting system of the human brain: from environment to theory of mind
Corbetta, M., Patel, G., & Shulman, G. L. (2008) · Neuron · doi:10.1016/j.neuron.2008.04.017 · Cited by 3,889
Large-scale automated synthesis of human functional neuroimaging data.
Yarkoni, T., Poldrack, R. A., Nichols, T. E., Van Essen, D. C., & Wager, T. D. (2011) · Nature Methods · doi:10.1038/nmeth.1635 · Cited by 3,686
Neural systems supporting interoceptive awareness
Critchley, H. D., Wiens, S., Rotshtein, P., Öhman, A., & Dolan, R. J. (2004) · Nature Neuroscience · doi:10.1038/nn1176 · Cited by 3,406 · cited 6×
“Relative interoceptive accuracy was defined as the difference in performance accuracy between the BDT and DDT to control for non-specific performance effects (Critchley et al., 2004).”
BackgroundMethodResultInfluentialPsychophysiological and Modulatory Interactions in Neuroimaging
Friston, K. J., Buechel, C., Fink, G. R., Morris, J., Rolls, E., & Dolan, R. J. (1997) · NeuroImage · doi:10.1006/nimg.1997.0291 · Cited by 3,097
Pragmatics of measuring recognition memory: Applications to dementia and amnesia.
Snodgrass, J. G., & Corwin, J. (1988) · Journal of Experimental Psychology General · doi:10.1037//0096-3445.117.1.34 · Cited by 3,093
Sridharan, D., Levitin, D. J., & Menon, V. (2008) · Proceedings of the National Academy of Sciences · doi:10.1073/pnas.0800005105 · Cited by 2,892
The somatic marker hypothesis and the possible functions of the prefrontal cortex
Damasio, A. R. (1996) · Philosophical Transactions of the Royal Society of London. Series B: Biological Sciences · doi:10.1098/rstb.1996.0125 · Cited by 2,847
Calculation of signal detection theory measures
Stanislaw, H., & Todorov, N. (1999) · Behavior Research Methods, Instruments, & Computers · doi:10.3758/bf03207704 · Cited by 2,673
Interoception: the sense of the physiological condition of the body
(Bud) Craig, A. (2003) · Current Opinion in Neurobiology · doi:10.1016/s0959-4388(03)00090-4 · Cited by 2,556
Pragmatics of measuring recognition memory: Applications to dementia and amnesia.
Snodgrass, J. G., & Corwin, J. (1988) · Journal of Experimental Psychology General · doi:10.1037/0096-3445.117.1.34 · Cited by 2,527
Canonical Microcircuits for Predictive Coding
Bastos, A. M., Usrey, W. M., Adams, R. A., Mangun, G. R., Fries, P., & Friston, K. J. (2012) · Neuron · doi:10.1016/j.neuron.2012.10.038 · Cited by 2,421 · cited 1×
“Our finding of a critical role of the AIC in interoceptive attention fits with a recent predictive coding account of the brain (Bastos et al., 2012; Friston and Kiebel, 2009; Rao and Ballard, 1999), Table 7.”
BackgroundSubcortical and cortical brain activity during the feeling of self-generated emotions
Damasio, A. R., Grabowski, T. J., Bechara, A., Damasio, H., Ponto, L. L. B., Parvizi, J., & Hichwa, R. D. (2000) · Nature Neuroscience · doi:10.1038/79871 · Cited by 2,117
Salience processing and insular cortical function and dysfunction
Uddin, L. Q. (2015) · Nature Reviews Neuroscience · doi:10.1038/nrn3857 · Cited by 2,083
Looking for Spinoza: Joy, Sorrow, and the Feeling Brain
Gross, H. S. (2004) · The Journal of Nervous and Mental Disease · doi:10.1097/01.nmd.0000130139.70393.da · Cited by 2,053
Using Bayes to get the most out of non-significant results
Dienes, Z. (2014) · Frontiers in Psychology · doi:10.3389/fpsyg.2014.00781 · Cited by 1,998
Emotion, cognition, and behavior
Dolan, R. J. (2002) · Science · doi:10.1126/science.1076358 · Cited by 1,979
Interoceptive inference, emotion, and the embodied self
Seth, A. K. (2013) · Trends in Cognitive Sciences · doi:10.1016/j.tics.2013.09.007 · Cited by 1,816 · cited 1×
“In addition, self-report of positive affective experience was positively 642 correlated with interoceptive accuracy (though not significant in the second fMRI 643 sample), which supports the notion that interoceptive attention is critical in emotional 644 awareness (Barrett, Quigley, Bliss-Moreau, & Aronson, 2004; Bec…”
BackgroundCircuitry and functional aspects of the insular lobe in primates including humans
AUGUSTINE, J. (1996) · Brain Research Reviews · doi:10.1016/s0165-0173(96)00011-2 · Cited by 1,776
Interoceptive predictions in the brain
Barrett, L. F., & Simmons, W. K. (2015) · Nature Reviews Neuroscience · doi:10.1038/nrn3950 · Cited by 1,766
Meditation experience is associated with increased cortical thickness
Lazar, S. W., Kerr, C. E., Wasserman, R. H., Gray, J. R., Greve, D. N., Treadway, M. T., McGarvey, M., Quinn, B. T., Dusek, J. A., Benson, H., et al. (2005) · NeuroReport · doi:10.1097/01.wnr.0000186598.66243.19 · Cited by 1,698
Knowing your own heart: Distinguishing interoceptive accuracy from interoceptive awareness
Garfinkel, S. N., Seth, A. K., Barrett, A. B., Suzuki, K., & Critchley, H. D. (2015) · Biological Psychology · doi:10.1016/j.biopsycho.2014.11.004 · Cited by 1,624
Mindfulness-based stress reduction for healthy individuals: A meta-analysis
Khoury, B., Sharma, M., Rush, S. E., & Fournier, C. (2015) · Journal of Psychosomatic Research · doi:10.1016/j.jpsychores.2015.03.009 · Cited by 1,617
Predictive coding under the free-energy principle
Friston, K., & Kiebel, S. (2009) · Philosophical Transactions of the Royal Society B: Biological Sciences · doi:10.1098/rstb.2008.0300 · Cited by 1,579
Bayesian model selection for group studies
Stephan, K. E., Penny, W. D., Daunizeau, J., Moran, R. J., & Friston, K. J. (2009) · NeuroImage · doi:10.1016/j.neuroimage.2009.03.025 · Cited by 1,423
Kurth, F., Zilles, K., Fox, P. T., Laird, A. R., & Eickhoff, S. B. (2010) · Brain Structure and Function · doi:10.1007/s00429-010-0255-z · Cited by 1,293
A common role of insula in feelings, empathy and uncertainty
Singer, T., Critchley, H. D., & Preuschoff, K. (2009) · Trends in Cognitive Sciences · doi:10.1016/j.tics.2009.05.001 · Cited by 1,270
Neural mechanisms of autonomic, affective, and cognitive integration
Critchley, H. D. (2005) · Journal of Comparative Neurology · doi:10.1002/cne.20749 · Cited by 1,214
Visceral influences on brain and behavior
Critchley, H. D., & Harrison, N. A. (2013) · Neuron · doi:10.1016/j.neuron.2013.02.008 · Cited by 1,177
Raincloud plots: a multi-platform tool for robust data visualization
Allen, M., Poggiali, D., Whitaker, K. J., Marshall, T. R., & Kievit, R. (2019) · Wellcome Open Research · doi:10.12688/wellcomeopenres.15191.1 · Cited by 1,125
Watson, D. (1988) · Journal of Personality and Social Psychology · doi:10.1037/0022-3514.54.6.1020 · Cited by 1,060
Interoception in anxiety and depression
Paulus, M. P., & Stein, M. B. (2010) · Brain Structure and Function · doi:10.1007/s00429-010-0258-9 · Cited by 952
An Interoceptive Predictive Coding Model of Conscious Presence
Seth, A. K., Suzuki, K., & Critchley, H. D. (2012) · Frontiers in Psychology · doi:10.3389/fpsyg.2011.00395 · Cited by 950 · cited 1×
“, 1991) for the embodied mind mediated by interoception (Garfinkel and Critchley, 2013), and the embodied predictive processing model (Allen et al., 2016; Allen and Friston, 2018; Barrett and Simmons, 2015; Seth, 2013; Seth and Critchley, 2013; Seth et al., 2011).”
BackgroundCritchley, H. D., & Garfinkel, S. N. (2017) · Current Opinion in Psychology · doi:10.1016/j.copsyc.2017.04.020 · Cited by 899
Mooney, C., & Duval, R. (1993) · doi:10.4135/9781412983532 · Cited by 893
The Relationship between Global and Local Changes in PET Scans
Friston, K. J., Frith, C., Liddle, P. F., Dolan, R. J., Lammertsma, A. A., & Frackowiak, R. S. J. (1990) · Journal of Cerebral Blood Flow & Metabolism · doi:10.1038/jcbfm.1990.88 · Cited by 858
Ten simple rules for dynamic causal modeling
Stephan, K. E., Penny, W. D., Moran, R. J., den Ouden, H. E. M., Daunizeau, J., & Friston, K. J. (2010) · NeuroImage · doi:10.1016/j.neuroimage.2009.11.015 · Cited by 803
Anterior insular cortex and emotional awareness
Gu, X., Hof, P. R., Friston, K. J., & Fan, J. (2013) · Journal of Comparative Neurology · doi:10.1002/cne.23368 · Cited by 712 · cited 2×
“In the context of interoceptive and embodied predictive coding (Allen and Friston, 2018; Gu et al., 2013), previous studies hypothesized that interoceptive predictions are computed within a network of brain regions with the AIC as the key node (Allen et al.”
BackgroundMethodSelf-citationNeural Systems for Visual Orienting and Their Relationships to Spatial Working Memory
Corbetta, M., Kincade, J. M., & Shulman, G. L. (2002) · Journal of Cognitive Neuroscience · doi:10.1162/089892902317362029 · Cited by 698
Somatic Markers and the Guidance of Behavior: Theory and Preliminary Testing
Damásio, A. R., Tranel, D., & Damásio, H. (1991) · Oxford University Press eBooks · doi:10.1093/oso/9780195062847.003.0011 · Cited by 690
Comparing families of dynamic causal models
Penny, W. D., Stephan, K. E., Daunizeau, J., Rosa, M. J., Friston, K. J., Schofield, T. M., & Leff, A. P. (2010) · PLoS Computational Biology · doi:10.1371/journal.pcbi.1000709 · Cited by 688
Influence of heart rate on the BOLD signal: The cardiac response function
Chang, C., Cunningham, J. P., & Glover, G. H. (2008) · NeuroImage · doi:10.1016/j.neuroimage.2008.09.029 · Cited by 682
Evidence for a large-scale brain system supporting allostasis and interoception in humans
Kleckner, I. R., Zhang, J., Touroutoglou, A., Chanes, L., Xia, C., Simmons, W. K., Quigley, K. S., Dickerson, B. C., & Feldman Barrett, L. (2017) · Nature Human Behaviour · doi:10.1038/s41562-017-0069 · Cited by 641
Craig, A. D. (. (2010) · Brain Structure and Function · doi:10.1007/s00429-010-0248-y · Cited by 600
Mindfulness meditation training alters cortical representations of interoceptive attention
Farb, N. A. S., Segal, Z. V., & Anderson, A. K. (2013) · Social Cognitive and Affective Neuroscience · doi:10.1093/scan/nss066 · Cited by 566
Retrospective estimation and correction of physiological fluctuation in functional MRI
Hu, X. P., Le, T. H., Parrish, T. B., & Erhard, P. (1995) · Magnetic Resonance in Medicine · doi:10.1002/mrm.1910340211 · Cited by 474
Avery, J. A., Drevets, W. C., Moseman, S. E., Bodurka, J., Barcalow, J. C., & Simmons, W. K. (2014) · Biological Psychiatry · doi:10.1016/j.biopsych.2013.11.027 · Cited by 442
Topological organization of the human brain functional connectome across the lifespan
Cao, M., Wang, J.-H., Dai, Z.-J., Cao, X.-Y., Jiang, L.-L., Fan, F.-M., Song, X.-W., Xia, M.-R., Shu, N., Dong, Q., et al. (2014) · Developmental Cognitive Neuroscience · doi:10.1016/j.dcn.2013.11.004 · Cited by 440
Interoceptive sensitivity and self-reports of emotional experience
Barrett, L. F., Quigley, K. S., Bliss-Moreau, E., & Aronson, K. R. (2004) · Journal of Personality and Social Psychology · doi:10.1037/0022-3514.87.5.684 · Cited by 432
Penny, W. D., & Holmes, A. J. (2007) · Elsevier eBooks · doi:10.1016/b978-012372560-8/50012-7 · Cited by 406
Autism, oxytocin and interoception
Quattrocki, E., & Friston, K. (2014) · Neuroscience & Biobehavioral Reviews · doi:10.1016/j.neubiorev.2014.09.012 · Cited by 393
The pathways of interoceptive awareness
Khalsa, S. S., Rudrauf, D., Feinstein, J. S., & Tranel, D. (2009) · Nature Neuroscience · doi:10.1038/nn.2411 · Cited by 387
Garfinkel, S. N., & Critchley, H. D. (2013) · Social Cognitive and Affective Neuroscience · doi:10.1093/scan/nss140 · Cited by 386
From cognitivism to autopoiesis: towards a computational framework for the embodied mind
Allen, M., & Friston, K. J. (2018) · Synthese · doi:10.1007/s11229-016-1288-5 · Cited by 386
Four reasons to prefer Bayesian analyses over significance testing
Dienes, Z. P., & McLatchie, N. M. (2017) · Psychonomic Bulletin & Review · doi:10.3758/s13423-017-1266-z · Cited by 368
Interoception in emotional experience
Wiens, S. (2005) · Current Opinion in Neurology · doi:10.1097/01.wco.0000168079.92106.99 · Cited by 356
Cohen, E. R., Uǧurbil, K., & Kim, S. (2002) · Journal of Cerebral Blood Flow & Metabolism · doi:10.1097/00004647-200209000-00002 · Cited by 354
On the relationship between interoceptive awareness, emotional experience, and brain processes
Pollatos, O., Kirsch, W., & Schandry, R. (2005) · Cognitive Brain Research · doi:10.1016/j.cogbrainres.2005.09.019 · Cited by 316
Towards a psychophysics of interoceptive processes: the measurement of heartbeat detection
Brener, J., & Ring, C. (2016) · Philosophical Transactions of the Royal Society B: Biological Sciences · doi:10.1098/rstb.2016.0015 · Cited by 307
Roles of the Insular Cortex in the Modulation of Pain: Insights from Brain Lesions
Starr, C. J., Sawaki, L. A., Wittenberg, G. F., Burdette, J. H., Oshiro, Y., de Quevedo, A. S., & Coghill, R. C. (2009) · Journal of Neuroscience · doi:10.1523/jneurosci.5173-08.2009 · Cited by 297
Persistence of feelings and sentience after bilateral damage of the insula
Damasio, A., Damasio, H., & Tranel, D. (2013) · Cerebral Cortex · doi:10.1093/cercor/bhs077 · Cited by 282
Anatomy of the insula functional and clinical correlates
Flynn, F. G. (1999) · Aphasiology · doi:10.1080/026870399402325 · Cited by 281
Beyond the Tripartite Cognition–Emotion–Interoception Model of the Human Insular Cortex
Uddin, L. Q., Kinnison, J., Pessoa, L., & Anderson, M. L. (2014) · Journal of Cognitive Neuroscience · doi:10.1162/jocn_a_00462 · Cited by 275
Ring, C., Brener, J., Knapp, K., & Mailloux, J. (2015) · Biological Psychology · doi:10.1016/j.biopsycho.2014.12.010 · Cited by 272
Functional neuroanatomy of the insular lobe
Stephani, C., Fernandez-Baca Vaca, G., Maciunas, R., Koubeissi, M., & Lüders, H. O. (2011) · Brain Structure and Function · doi:10.1007/s00429-010-0296-3 · Cited by 251
The human cortex responds to an interoceptive challenge
Critchley, H. D. (2004) · Proceedings of the National Academy of Sciences · doi:10.1073/pnas.0401510101 · Cited by 251
Physiological noise modelling for spinal functional magnetic resonance imaging studies
Brooks, J. C. W., Beckmann, C. F., Miller, K. L., Wise, R. G., Porro, C. A., Tracey, I., & Jenkinson, M. (2007) · NeuroImage · doi:10.1016/j.neuroimage.2007.09.018 · Cited by 243
Functional organization of the human anterior insular cortex
Mutschler, I., Wieckhorst, B., Kowalevski, S., Derix, J., Wentlandt, J., Schulze‐Bonhage, A., & Ball, T. (2009) · Neuroscience Letters · doi:10.1016/j.neulet.2009.03.101 · Cited by 238
Attentional modulation of primary interoceptive and exteroceptive cortices.
Farb, N. A. S., Segal, Z. V., & Anderson, A. K. (2013) · Cerebral Cortex · doi:10.1093/cercor/bhr385 · Cited by 235
The Unique Brain Anatomy of Meditation Practitioners: Alterations in Cortical Gyrification
Eileen Luders, A., Kurth, F., Mayer, E. A., Toga, A. W., Narr, K. L., & Gaser, C. (2012) · Frontiers in Human Neuroscience · doi:10.3389/fnhum.2012.00034 · Cited by 232
How does interoceptive awareness interact with the subjective experience of emotion? An fMRI Study
Terasawa, Y., Fukushima, H., & Umeda, S. (2013) · Human Brain Mapping · doi:10.1002/hbm.21458 · Cited by 228
Anterior insular cortex is necessary for empathetic pain perception
Gu, X., Gao, Z., Wang, X., Liu, X., Knight, R. T., Hof, P. R., & Fan, J. (2012) · Brain · doi:10.1093/brain/aws199 · Cited by 223
Self-citationClinical effects of insular damage in humans
Ibañez, A., Gleichgerrcht, E., & Manes, F. (2010) · Brain Structure and Function · doi:10.1007/s00429-010-0256-y · Cited by 217
An information theory account of cognitive control
Fan, J. (2014) · Frontiers in Human Neuroscience · doi:10.3389/fnhum.2014.00680 · Cited by 214
Self-citationCaruana, F., Jezzini, A., Sbriscia-Fioretti, B., Rizzolatti, G., & D, V. G. M. (2011) · Current Biology · doi:10.1016/j.cub.2010.12.042 · Cited by 205
García-Cordero, I., Sedeño, L., de la Fuente, L., Slachevsky, A., Forno, G., Klein, F., Lillo, P., Ferrari, J., Rodriguez, C., Bustin, J., et al. (2016) · Philosophical Transactions of the Royal Society B: Biological Sciences · doi:10.1098/rstb.2016.0006 · Cited by 199
Listening to your heart: Interoceptive awareness as a gateway to feeling
Bechara, A., & Naqvi, N. (2004) · Nature Neuroscience · doi:10.1038/nn0204-102 · Cited by 197
Interoceptive sensitivity predicts sensitivity to the emotions of others
Terasawa, Y., Moriguchi, Y., Tochizawa, S., & Umeda, S. (2014) · Cognition and Emotion · doi:10.1080/02699931.2014.888988 · Cited by 175
Cannon, W. B. (1987) · PubMed · Cited by 174
The insula: anatomic study and MR imaging display at 1.5 T.
Naidich, T. P., Kang, E., Fatterpekar, G. M., Delman, B. N., Gultekin, S. H., WOLFE, D. E., Ortiz, O. A., Yousry, I., Weismann, M., & Yousry, T. A. (2004) · PubMed · Cited by 169
Extending predictive processing to the body: Emotion as interoceptive inference
Seth, A. K., & Critchley, H. D. (2013) · Behavioral and Brain Sciences · doi:10.1017/s0140525x12002270 · Cited by 164
Ernst, J., Böker, H., Hättenschwiler, J., Schüpbach, D., Northoff, G., Seifritz, E., & Grimm, S. (2014) · Social Cognitive and Affective Neuroscience · doi:10.1093/scan/nst058 · Cited by 161
The activation of interactive attentional networks
Xuan, B., Mackie, M., Spagna, A., Wu, T., Tian, Y., Hof, P. R., & Fan, J. (2016) · NeuroImage · doi:10.1016/j.neuroimage.2016.01.017 · Cited by 157
Self-citationFace-selective Activation in a Congenital Prosopagnosic Subject
Hasson, U., Avidan, G., Deouell, L. Y., Shlomo Bentin, A., & Malach, R. (2003) · Journal of Cognitive Neuroscience · doi:10.1162/089892903321593135 · Cited by 150
Follow your breath: respiratory interoceptive accuracy in experienced meditators
Daubenmier, J., Sze, J., Kerr, C. E., Kemeny, M. E., & Mehling, W. (2013) · Psychophysiology · doi:10.1111/psyp.12057 · Cited by 148
Philippi, C. L., Feinstein, J. S., Khalsa, S. S., Damasio, A., Tranel, D., Landini, G., Williford, K., & Rudrauf, D. (2012) · PLoS ONE · doi:10.1371/journal.pone.0038413 · Cited by 144
Ramsay, S. C., Murphy, K., Shea, S. A., Friston, K. J., Lammertsma, A. A., Clark, J. C., Adams, L. M., Guz, A., & Frackowiak, R. S. J. (1993) · The Journal of Physiology · doi:10.1113/jphysiol.1993.sp019913 · Cited by 133
The insular cortex: a comparative perspective
Butti, C., & Hof, P. R. (2010) · Brain Structure and Function · doi:10.1007/s00429-010-0264-y · Cited by 125
Anterior insula coordinates hierarchical processing of tactile mismatch responses
Allen, M., Fardo, F., Dietz, M. J., Hillebrandt, H. F., Friston, K. J., Rees, G. E., & Roepstorff, A. (2015) · NeuroImage · doi:10.1016/j.neuroimage.2015.11.030 · Cited by 125
Methodological recommendations for a heartbeat detection-based measure of interoceptive sensitivity
Kleckner, I. R., Wormwood, J. B., Simmons, W. K., Barrett, L. F., & Quigley, K. S. (2015) · Psychophysiology · doi:10.1111/psyp.12503 · Cited by 124
The James-Lange Theory of Emotions: A Critical Examination and an Alternative Theory
Cannon, W. B. (1987) · The American Journal of Psychology · doi:10.2307/1422695 · Cited by 121
Brewer, R., Happé, F., Cook, R., & Bird, G. (2015) · Neuroscience & Biobehavioral Reviews · doi:10.1016/j.neubiorev.2015.07.006 · Cited by 117
Shany-Ur, T., Lin, N., Rosen, H., Sollberger, M., Miller, B., & Rankin, K. (2014) · Brain : a journal of neurology · doi:10.1093/brain/awu161 · Cited by 116
Interoceptive inference: homeostasis and decision-making
Gu, X., & FitzGerald, T. H. B. (2014) · Trends in Cognitive Sciences · doi:10.1016/j.tics.2014.02.001 · Cited by 108
Self-citationAnterior insular cortex is a bottleneck of cognitive control
Wu, T., Wang, X., Wu, Q., Spagna, A., Yang, J., Yuan, C., Wu, Y., Gao, Z., Hof, P. R., & Fan, J. (2019) · NeuroImage · doi:10.1016/j.neuroimage.2019.02.042 · Cited by 104
Self-citationRonchi, R., Bello‐Ruiz, J., Łukowska, M., Herbelin, B., Cabrilo, I., Schaller, K., & Blanke, O. (2015) · Neuropsychologia · doi:10.1016/j.neuropsychologia.2015.02.010 · Cited by 94
Nonparametric Tests for the Interaction in Two-way Factorial Designs Using R
Feys, J. (2016) · The R Journal · doi:10.32614/rj-2016-027 · Cited by 94
Dissociating beliefs about heart rates and actual heart rates in patients with cardiac pacemakers
Windmann, S., Schonecke, O. W., Fröhlig, G., & Maldener, G. (1999) · Psychophysiology · doi:10.1017/s0048577299980381 · Cited by 93
Gu, X., Wang, X., Hula, A., Wang, S., Xu, S., Lohrenz, T. M., Knight, R. T., Gao, Z., Dayan, P., & Montague, P. R. (2015) · Journal of Neuroscience · doi:10.1523/jneurosci.2906-14.2015 · Cited by 92
Self-citationEnter feelings: Somatosensory responses following early stages of visual induction of emotion
Rudrauf, D., Lachaux, J.-P., Damásio, A. R., Baillet, S., Hugueville, L., Martinerie, J. M., Damásio, H., & Renault, B. (2008) · International Journal of Psychophysiology · doi:10.1016/j.ijpsycho.2008.03.015 · Cited by 89
Wu, Q., Chang, C., Xi, S., Huang, I., Liu, Z., Juan, C.-H., Wu, Y., & Fan, J. (2015) · Human Brain Mapping · doi:10.1002/hbm.22919 · Cited by 83
Self-citationAttenuated sensitivity to the emotions of others by insular lesion
Terasawa, Y., Kurosaki, Y., Ibata, Y., Moriguchi, Y., & Umeda, S. (2015) · Frontiers in Psychology · doi:10.3389/fpsyg.2015.01314 · Cited by 78
Detection threshold for inspiratory resistive loads and respiratory-related evoked potentials
Davenport, P. W., Chan, P.-Y. S., Zhang, W., & Chou, Y. (2006) · Journal of Applied Physiology · doi:10.1152/japplphysiol.01436.2005 · Cited by 75
Hick–Hyman Law is Mediated by the Cognitive Control Network in the Brain
Wu, T., Dufford, A. J., Egan, L. J., Mackie, M., Chen, C., Yuan, C., Chen, C., Li, X., Liu, X., Hof, P. R., et al. (2017) · Cerebral Cortex · doi:10.1093/cercor/bhx127 · Cited by 63
Self-citationSome general population norms for the short form Beck Depression Inventory
Knight, R. G. (1984) · Journal of Clinical Psychology · doi:10.1002/1097-4679(198405)40:3 · Cited by 63
Verstynen, T., & Deshpande, V. S. (2011) · NeuroImage · doi:10.1016/j.neuroimage.2010.11.090 · Cited by 58
Allen, J. S., Emmorey, K. D., Bruss, J., & Damásio, H. (2013) · Frontiers in Neuroanatomy · doi:10.3389/fnana.2013.00026 · Cited by 58
A comparison of glycogen phosphorylase a and cytochrome oxidase histochemical staining in rat brain
Harley, C. W., & Bielajew, C. H. (1992) · The Journal of Comparative Neurology · doi:10.1002/cne.903220307 · Cited by 53
Decreased interoceptive awareness in patients with substance use disorders
Sönmez, M. B., Kılıç, E. K., Çöl, I. A., Görgülü, Y., & Çınar, R. K. (2016) · Journal of Substance Use · doi:10.3109/14659891.2016.1143048 · Cited by 45
RainCloudPlots tutorials and codebase
Whitaker, K. J., TomRhysMarshall, van Mourik, T., Martinez, P. A., Poggiali, D., Ye, H., & MariusKlug (2018) · Figshare · doi:10.5281/zenodo.1402958 · Cited by 24
Optimizing RetroICor and RetroKCor corrections for multi-shot 3D FMRI acquisitions
Tijssen, R. H. N., Jenkinson, M., Brooks, J. C. W., Jezzard, P., & Miller, K. L. (2013) · NeuroImage · doi:10.1016/j.neuroimage.2013.08.062 · Cited by 19
Recovery of empathetic function following resection of insular gliomas
Wang, X., Gu, X., Fan, J., Wang, S., Fu, Z., Hof, P. R., Liu, P., & Gao, Z. (2014) · Journal of Neuro-Oncology · doi:10.1007/s11060-014-1380-y · Cited by 13
Self-citationRaincloud plots: a multi-platform tool for robust data visualizationPreprint
Allen, M., Poggiali, D., Whitaker, K. J., Marshall, T. R., & Kievit, R. (2018) · doi:10.7287/peerj.preprints.27137 · Cited by 9
Glover (2000) · doi:10.1002/1522-2594(200007)44:1
Research works printed but not linked: 3
- Hamilton, 1976, Sourcebook of Adult Assessment: Applied Clinical Psychology, 154
- Porges, 1993, Body perception questionnaire, Laboratory of Developmental Assessment, University of Maryland
- Tranel, 1991, Somatic Markers and the Guidance of Behaviour: Theory and Preliminary Testing
Cited by
Sorted by citations
Chen, W. G., Schloesser, D., Arensdorf, A. M., Simmons, J. M., Cui, C., Valentino, R., Gnadt, J. W., Nielsen, L., Hillaire-Clarke, C. S., Spruance, V., et al. (2021) · Trends in Neurosciences · doi:10.1016/j.tins.2020.10.007 · Cited by 707
Volkow, N. D., & Blanco, C. (2023) · World psychiatry · doi:10.1002/wps.21073 · Cited by 503
Anterior insula as a gatekeeper of executive control
Molnar-Szakacs, I., & Uddin, L. Q. (2022) · Neuroscience & Biobehavioral Reviews · doi:10.1016/j.neubiorev.2022.104736 · Cited by 333
Heart–brain interactions shape somatosensory perception and evoked potentials
Al, E., Iliopoulos, F., Forschack, N., Nierhaus, T., Grund, M., Motyka, P., Gaebler, M., Nikulin, V. V., & Villringer, A. (2020) · Proceedings of the National Academy of Sciences · doi:10.1073/pnas.1915629117 · Cited by 276
In the body's eye: the computational anatomy of interoceptive inference
Allen, M., Levy, A., Parr, T., & Friston, K. J. (2022) · PLOS Computational Biology · doi:10.1371/journal.pcbi.1010490 · Cited by 185
Metadata
- Authors
- Wang, X., Wu, Q., Egan, L., Gu, X., Liu, P., Gu, H., Yang, Y., Luo, J., Wu, Y., Gao, Z., & Fan, J.
- Affiliations
- Capital Medical University (CN)
- Peking University (CN)
- Queens College, CUNY (US)
- James J. Peters VA Medical Center (US)
- National Institute on Drug Abuse (US)
- Capital Normal University (CN)
- Corresponding author
- Fan, Jin
- ORCID
- Venue
- eLife
- Publisher
- eLife Sciences Publications, Ltd
- Published
- 2019-04-15
- Volume
- 8
- ISSN
- 2050-084X (ISSN-L)
- PMC
- PMC6488299
- OpenAlex
- W2899948248
- Cited by
- 204
- References
- 131
- Citations by year
- 2026: 31 · 2025: 37 · 2024: 31 · 2023: 40 · 2022: 28 · 2021: 17 · 2020: 18 · 2019: 2
- FWCI
- 12.95
- Type
- journal article
- Language
- en
- Open access
- gold
- doi.org
- Licence
- Locations
- eLife (publishedVersion, cc-by)
- bioRxiv (Cold Spring Harbor Laboratory) (acceptedVersion, cc-by)
- Europe PMC (PubMed Central) (publishedVersion, public-domain)
- PubMed Central (publishedVersion, public-domain)
- PubMed (publishedVersion)
- DOAJ (DOAJ: Directory of Open Access Journals) (submittedVersion, cc-by-sa)
- Greater South Information System
- Funders
- Beijing Municipal Administration of Hospitals (Youth Program QML20170503)
- National Natural Science Foundation of China (81600931, 31771205, 61690205, 81328008, 81729001)
- Capital Health Development Research Project of Beijing (2016-4-1074)
- Brain Research Project of Beijing (Z16110002616014)
- China Postdoctoral Science Foundation (2016M600835)
- National Institute on Drug Abuse (1R01DA043695, Intramul Research Program)
- The Mental Illness Research, Education, and Clinical Center, James J. Peter Veterans Affairs Medical Center (MIRECC VISN 2)
- National Basic Research Program of China (973-2015CB351800)
- National Institute of Mental Health (R01MH094305)
- Topics
- Health Sciences › Medicine › Psychiatry and Mental health › Psychosomatic Disorders and Their Treatments
- Life Sciences › Neuroscience › Cognitive Neuroscience › Tactile and Sensory Interactions
- Health Sciences › Medicine › Cardiology and Cardiovascular Medicine › Heart Rate Variability and Autonomic Control
- Keywords
- anterior insula, interoceptive attention, interoception, respiratory rhythm, interoceptive accuracy, interoceptive sensitivity, somatosensory cortex, individual differences
- MeSH terms
- Attention, Brain Mapping, Cerebral Cortex, Humans, Magnetic Resonance Imaging, Healthy Volunteers, Interoception
About these checks
Registry, retraction, Cites and statistics results are computed, not judged, with one exception: a printed reference that no index lists is read once by a model before it counts as a citation error. Claims are extracted by a model and kept only when their quote appears verbatim in the text; each cited source is then checked, with a model’s help, for whether it says what the claim relies on. Those verdicts can be wrong — read the claim’s quote and the cited source before relying on one.
Statistics and arithmetic are recomputed, not judged.
Confidence bands are shown only for fields calibrated on our annotated test set. None is calibrated yet, so no band is shown.
What counts as a claim ›How we measure confidence ›How we check this ›
Are you an author, or do you see a problem with this page? Request a review
