

The DOI matches its Crossref record; 74 of the 75 references it cites were found in a registry or an index.
Microbiota-derived short chain fatty acids modulate microglia and promote Aβ plaque deposition
Open accessPublished version of a preprint
Abstract
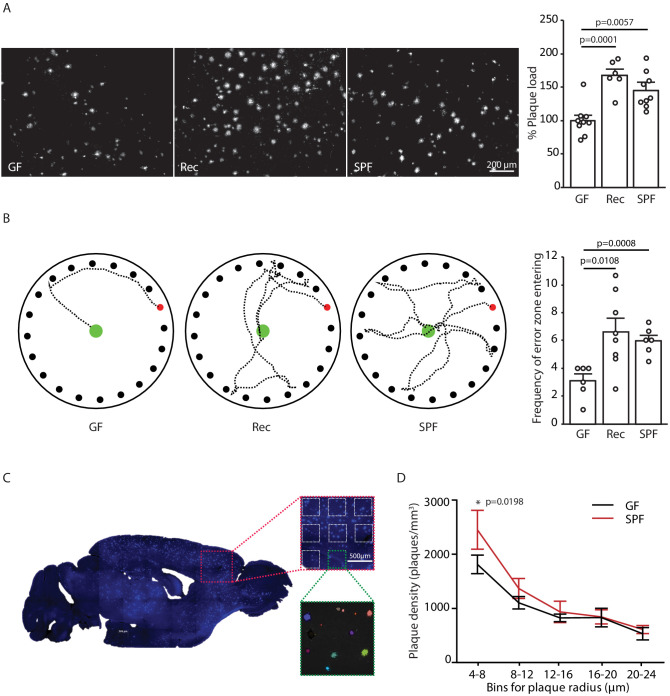
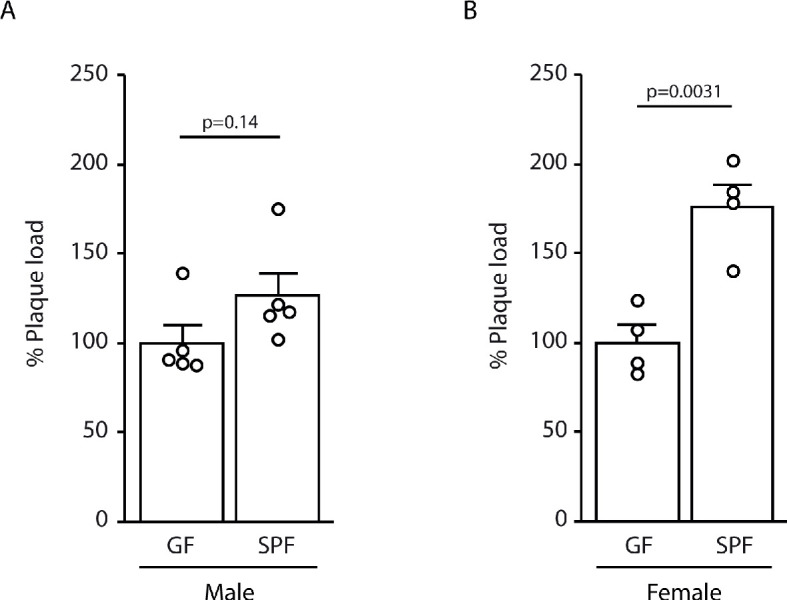
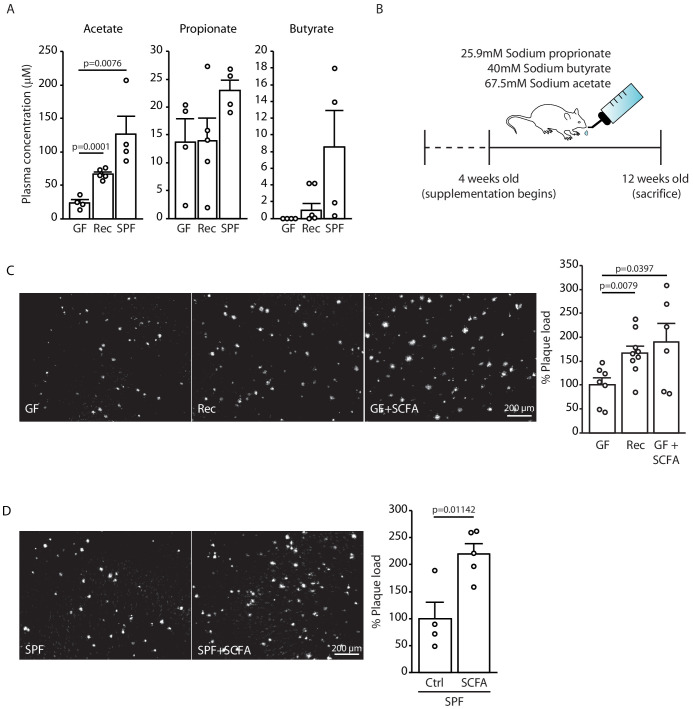
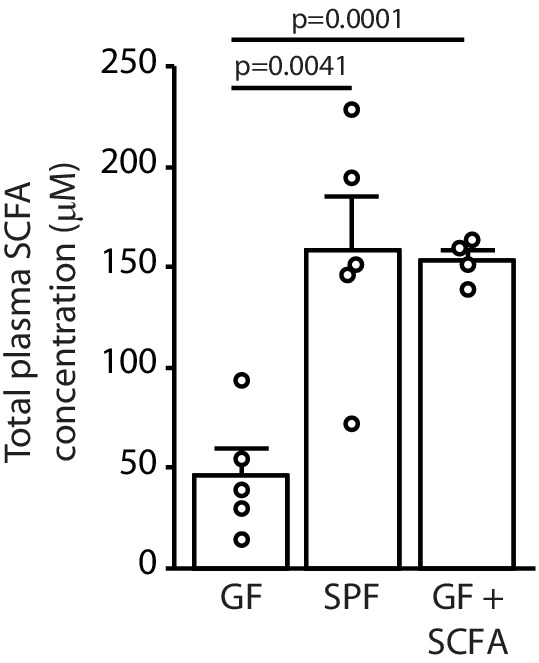
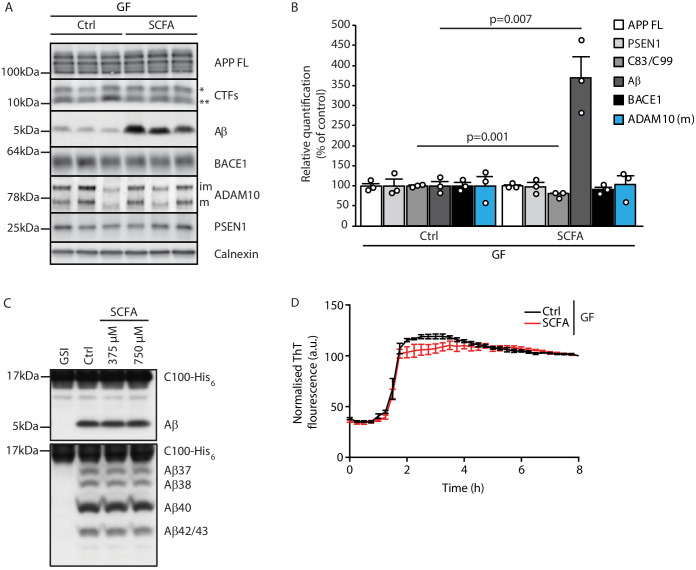
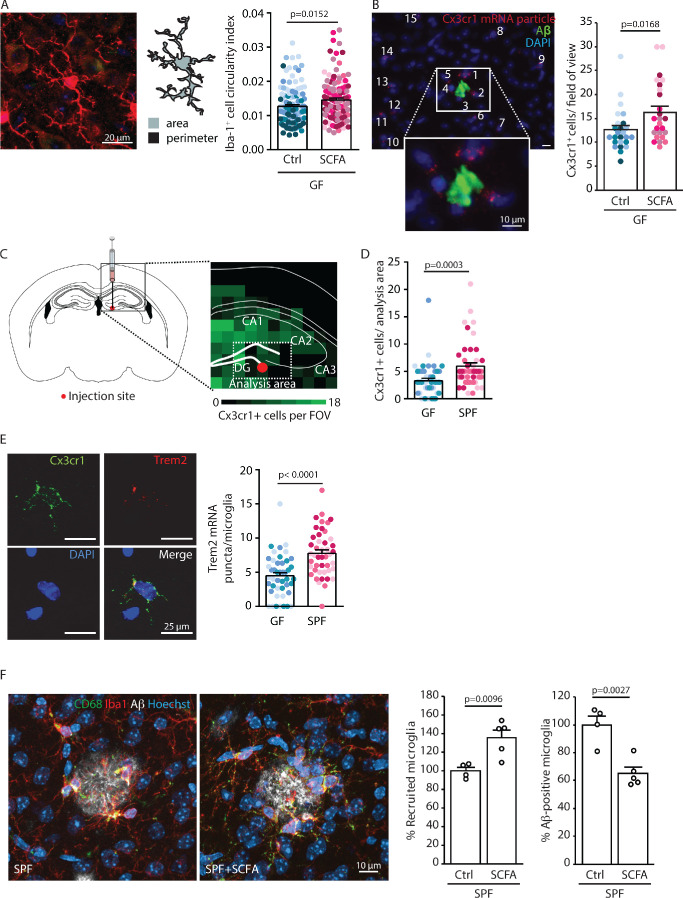
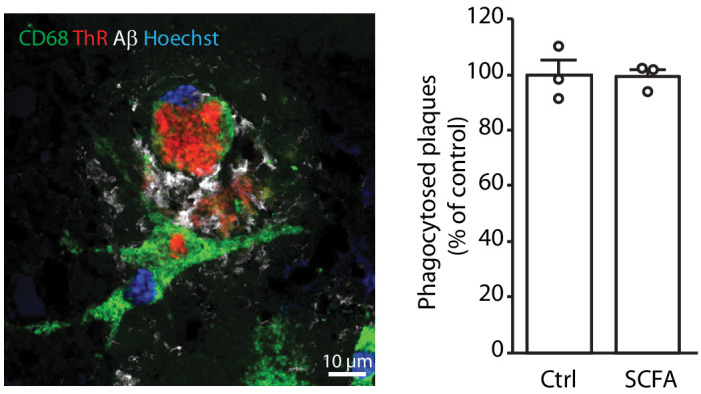
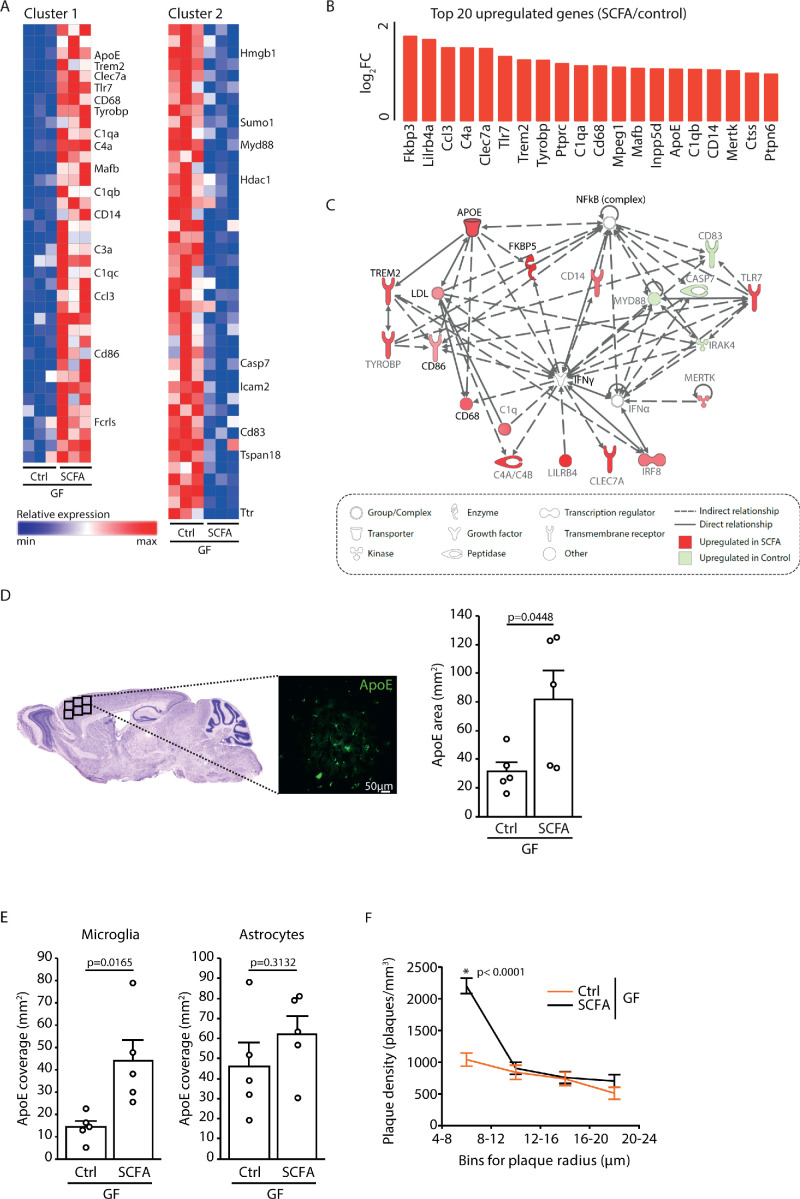
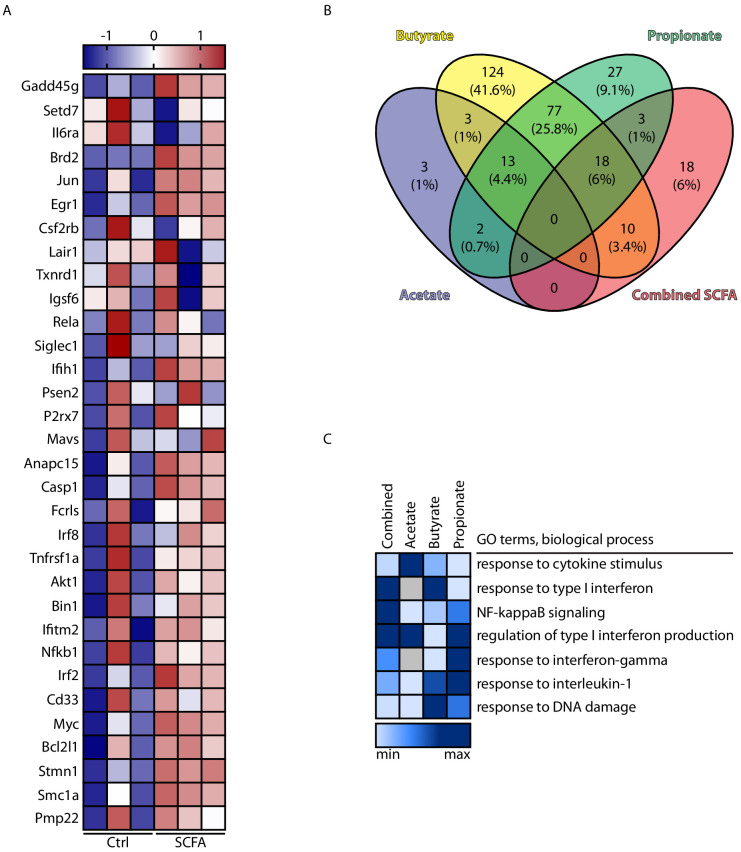
Previous studies have identified a crucial role of the gut microbiome in modifying Alzheimer’s disease (AD) progression. However, the mechanisms of microbiome–brain interaction in AD were so far unknown. Here, we identify microbiota-derived short chain fatty acids (SCFA) as microbial metabolites which promote Aβ deposition. Germ-free (GF) AD mice exhibit a substantially reduced Aβ plaque load and markedly reduced SCFA plasma concentrations; conversely, SCFA supplementation to GF AD mice increased the Aβ plaque load to levels of conventionally colonized (specific pathogen-free [SPF]) animals and SCFA supplementation to SPF mice even further exacerbated plaque load. This was accompanied by the pronounced alterations in microglial transcriptomic profile, including upregulation of ApoE. Despite increased microglial recruitment to Aβ plaques upon SCFA supplementation, microglia contained less intracellular Aβ. Taken together, our results demonstrate that microbiota-derived SCFA are critical mediators along the gut-brain axis which promote Aβ deposition likely via modulation of the microglial phenotype.
Overview
The claims and statistics of this paper haven’t been checked yet.
Run the check — free, no account needed. It reads the open-access text and checks the sources it cites.
Integrity signals
Registry
Cites
Statistics
Figures
Verification
Claims the paper makes
The claims and statistics of this paper haven’t been checked yet.
Run the check — free, no account needed. It reads the open-access text and checks the sources it cites.
Claims other papers make about this one
Each is checked against this paper’s own text: does it say what the citing paper says it does?
The source backs part of the claim, not all of it — or backs it for a different population, condition or comparison.
In the citing paper
“Gut microbiota imbalance induces intestinal inflammation and further leads to systemic inflammation through the release of immune-stimulating substances and metabolites into blood circulation.103”
From Role of neuroinflammation in neurodegeneration development (2023) · cites this paper as [103]
Experimental — accuracy not yet measuredIn the citing paper
“Interestingly, it has been demonstrated that SCFAs induce microglial activation and worsen Aβ pathology in both SPF and GF APP/PS1 mice.199”
From Microbiota–gut–brain axis and its therapeutic applications in neurodegenerative diseases (2024) · cites this paper as [199]
In the citing paper
“However, individual SCFA failed to achieve comparable effects as the combined SCFA treatment.199”
From Microbiota–gut–brain axis and its therapeutic applications in neurodegenerative diseases (2024) · cites this paper as [199]
In the citing paper
“On the other hand, a comparison between acetate, propionate, and butyrate in primary microglia has reported an abundant overlap between butyrate and propionate in microglial transcriptomic profile.”
From Microbiota–gut–brain axis and its therapeutic applications in neurodegenerative diseases (2024) · cites this paper as [199]
Self-check
Percentages, sums and reported differences re-computed from the paper’s own numbers.
The self-check needs the paper’s full text.
Citations
Cites
The gut microbiota as an environmental factor that regulates fat storage
Bäckhed, F., Ding, H., Wang, T., Hooper, L. V., Koh, G. Y., Nagy, A., Semenkovich, C. F., & Gordon, J. I. (2004) · Proceedings of the National Academy of Sciences · doi:10.1073/pnas.0407076101 · Cited by 6,245
The Microbial Metabolites, Short-Chain Fatty Acids, Regulate Colonic T reg Cell Homeostasis
Smith, P. M., Howitt, M. R., Panikov, N., Michaud, M., Gallini, C. A., Bohlooly-Y, M., Glickman, J. N., & Garrett, W. S. (2013) · Science · doi:10.1126/science.1241165 · Cited by 5,413
Cryan, J. F., O'Riordan, K. J., Cowan, C. S. M., Sandhu, K. V., Bastiaanssen, T. F. S., Boehme, M., Codagnone, M. G., Cussotto, S., Fulling, C., Golubeva, A. V., et al. (2019) · Physiological Reviews · doi:10.1152/physrev.00018.2018 · Cited by 5,286 · cited 2×
“Moreover, SCFA have been implicated in a wide range of brain disorders or physiological functions under cerebral control such as mood disorders, autism spectrum disease, or energy metabolism (Cryan et al., 2019; Li et al., 2018; van de Wouw et al., 2018).”
BackgroundFormation of short chain fatty acids by the gut microbiota and their impact on human metabolism
Morrison, D. J., & Preston, T. (2016) · Gut Microbes · doi:10.1080/19490976.2015.1134082 · Cited by 3,781
Metsalu, T., & Vilo, J. (2015) · Nucleic Acids Research · doi:10.1093/nar/gkv468 · Cited by 3,770
Gut microbiota regulate motor deficits and neuroinflammation in a model of Parkinson's disease
Sampson, T. R., Debelius, J. W., Thron, T., Janssen, S., Shastri, G. G., Ilhan, Z. E., Challis, C., Schretter, C. E., Rocha, S., Gradinaru, V., et al. (2016) · Cell · doi:10.1016/j.cell.2016.11.018 · Cited by 3,622
Host microbiota constantly control maturation and function of microglia in the CNS
Erny, D., Hrabě de Angelis, A. L., Jaitin, D., Wieghofer, P., Staszewski, O., David, E., Keren-Shaul, H., Mahlakoiv, T., Jakobshagen, K., Buch, T., et al. (2015) · Nature Neuroscience · doi:10.1038/nn.4030 · Cited by 3,569
The role of short-chain fatty acids in microbiota–gut–brain communication
Dalile, B., Van Oudenhove, L., Vervliet, B., & Verbeke, K. (2019) · Nature Reviews Gastroenterology & Hepatology · doi:10.1038/s41575-019-0157-3 · Cited by 3,357
Complement and microglia mediate early synapse loss in Alzheimer mouse models
Hong, S., Beja-Glasser, V. F., Nfonoyim, B. M., Frouin, A., Li, S., Ramakrishnan, S., Merry, K. M., Shi, Q., Rosenthal, A., Barres, B. A., et al. (2016) · Science · doi:10.1126/science.aad8373 · Cited by 3,343
Alzheimer Disease: An Update on Pathobiology and Treatment Strategies
Long, J. M., & Holtzman, D. M. (2019) · Cell · doi:10.1016/j.cell.2019.09.001 · Cited by 3,204
NLRP3 is activated in Alzheimer’s disease and contributes to pathology in APP/PS1 mice
Heneka, M. T., Kummer, M. P., Stutz, A., Delekate, A., Schwartz, S., Vieira-Saecker, A., Griep, A., Axt, D., Remus, A., Tzeng, T.-C., et al. (2013) · Nature · doi:10.1038/nature11729 · Cited by 2,898
Identification of a unique TGF-β–dependent molecular and functional signature in microglia
Butovsky, O., Jedrychowski, M. P., Moore, C. S., Cialic, R., Lanser, A. J., Gabriely, G., Koeglsperger, T., Dake, B., Wu, P. M., Doykan, C. E., et al. (2014) · Nature Neuroscience · doi:10.1038/nn.3599 · Cited by 2,543
Molecular Analysis of Commensal Host-Microbial Relationships in the Intestine
Hooper, L. V., Wong, M. H., Thelin, A., Hansson, L., Falk, P. G., & Gordon, J. I. (2001) · Science · doi:10.1126/science.291.5505.881 · Cited by 2,202
Gut microbiome alterations in Alzheimer’s disease
Vogt, N. M., Kerby, R. L., Dill-McFarland, K. A., Harding, S. J., Merluzzi, A. P., Johnson, S. C., Carlsson, C. M., Asthana, S., Zetterberg, H., Blennow, K., et al. (2017) · Scientific Reports · doi:10.1038/s41598-017-13601-y · Cited by 2,137
Bard, F., Cannon, C., Barbour, R., Burke, R.-L., Games, D., Grajeda, H., Guido, T., Hu, K., Huang, J., Johnson-Wood, K., et al. (2000) · Nature Medicine · doi:10.1038/78682 · Cited by 2,012
Microglia in Alzheimer’s disease
Hansen, D. V., Hanson, J. E., & Sheng, M. (2018) · Journal of Cell Biology · doi:10.1083/jcb.201709069 · Cited by 1,935 · cited 1×
“In particular, triggering microglial phagocytic clearance of Ab can reduce amyloid plaque pathology (Daria et al., 2017; Hansen et al., 2018).”
BackgroundThe Toll-like receptor 2 pathway establishes colonization by a commensal of the human microbiota
Round, J. L., Lee, S. M., Li, J., Tran, G., Jabri, B., Chatila, T. A., & Mazmanian, S. K. (2011) · Science · doi:10.1126/science.1206095 · Cited by 1,604
Inhibition of Histone Deacetylase Activity by Butyrate
Davie, J. R. (2003) · The Journal of Nutrition · doi:10.1093/jn/133.7.2485s · Cited by 1,515
Innate immune activation in neurodegenerative disease
Heneka, M. T., Kummer, M. P., & Latz, E. (2014) · Nature Reviews Immunology · doi:10.1038/nri3705 · Cited by 1,437
Lin, H. V., Frassetto, A., Kowalik Jr, E. J., Nawrocki, A. R., Lu, M. M., Kosinski, J. R., Hubert, J. A., Szeto, D., Yao, X., Forrest, G., et al. (2012) · PLoS ONE · doi:10.1371/journal.pone.0035240 · Cited by 1,378
Regulatory T cells are key cerebroprotective immunomodulators in acute experimental stroke
Liesz, A., Suri‐Payer, E., Veltkamp, C., Doerr, H., Sommer, C., Rivest, S., Giese, T., & Veltkamp, R. C. (2009) · Nature Medicine · doi:10.1038/nm.1927 · Cited by 1,137
Self-citationThe microbiome-gut-brain axis: from bowel to behavior
Cryan, J. F., & O’Mahony, S. M. (2011) · Neurogastroenterology & Motility · doi:10.1111/j.1365-2982.2010.01664.x · Cited by 990
Aβ42‐driven cerebral amyloidosis in transgenic mice reveals early and robust pathology
Radde, R., Bolmont, T., Kaeser, S. A., Coomaraswamy, J., Lindau, D., Stoltze, L., Calhoun, M. E., Jäggi, F., Wolburg, H., Gengler, S., et al. (2006) · The EMBO Reports · doi:10.1038/sj.embor.7400784 · Cited by 986
Self-citationMicroglia-derived ASC specks cross-seed amyloid-β in Alzheimer’s disease
Venegas, C., Kumar, S., Franklin, B. S., Dierkes, T., Brinkschulte, R., Tejera, D., Vieira-Saecker, A., Schwartz, S., Santarelli, F., Kummer, M. P., et al. (2017) · Nature · doi:10.1038/nature25158 · Cited by 983
Innate immune memory in the brain shapes neurological disease hallmarks
Wendeln, A.-C., Degenhardt, K., Kaurani, L., Gertig, M., Ulas, T., Jain, G., Wagner, J., Häsler, L. M., Wild, K., Skodras, A., et al. (2018) · Nature · doi:10.1038/s41586-018-0023-4 · Cited by 956
Spangenberg, E., Severson, P. L., Hohsfield, L. A., Crapser, J., Zhang, J., Burton, E. A., Zhang, Y., Spevak, W., Lin, J., Phan, N. Y., et al. (2019) · Nature Communications · doi:10.1038/s41467-019-11674-z · Cited by 939
Dietary fatty acids directly impact central nervous system autoimmunity via the small intestine
Haghikia, A., Jörg, S., Duscha, A., Berg, J., Manzel, A., Waschbisch, A., Hammer, A., Lee, D.-H., May, C., Wilck, N., et al. (2015) · Immunity · doi:10.1016/j.immuni.2015.09.007 · Cited by 927
Sala Frigerio, C., Wolfs, L., Fattorelli, N., Thrupp, N., Voytyuk, I., Schmidt, I., Mancuso, R., Chen, W.-T., Woodbury, M. E., Srivastava, G., et al. (2019) · Cell Reports · doi:10.1016/j.celrep.2019.03.099 · Cited by 926
Microglia in Alzheimer's disease
Sarlus, H., & Heneka, M. T. (2017) · Journal of Clinical Investigation · doi:10.1172/jci90606 · Cited by 911
Reduction of Abeta amyloid pathology in APPPS1 transgenic mice in the absence of gut microbiota
Harach, T., Marungruang, N., Duthilleul, N., Cheatham, V., Mc Coy, K. D., Frisoni, G., Neher, J. J., Fåk, F., Jucker, M., Lasser, T., et al. (2017) · Scientific Reports · doi:10.1038/srep41802 · Cited by 901
Microbiota Dysbiosis Controls the Neuroinflammatory Response after Stroke
Singh, V., Roth, S., Llovera, G., Sadler, R., Garzetti, D., Stecher, B., Dichgans, M., & Liesz, A. (2016) · Journal of Neuroscience · doi:10.1523/jneurosci.1114-16.2016 · Cited by 815
Self-citationvan de Wouw, M., Boehme, M., Lyte, J. M., Wiley, N., Strain, C., O'Sullivan, O., Clarke, G., Stanton, C., Dinan, T. G., & Cryan, J. F. (2018) · The Journal of Physiology · doi:10.1113/jp276431 · Cited by 789
Apolipoprotein E and Apolipoprotein E Receptors: Normal Biology and Roles in Alzheimer Disease
Holtzman, D. M., Herz, J., & Bu, G. (2012) · Cold Spring Harbor Perspectives in Medicine · doi:10.1101/cshperspect.a006312 · Cited by 782
Butyrate reduces appetite and activates brown adipose tissue via the gut-brain neural circuit
Li, Z., Yi, C.-X., Katiraei, S., Kooijman, S., Zhou, E., Chung, C. K., Gao, Y., van den Heuvel, J. K., Meijer, O. C., Berbée, J. F. P., et al. (2018) · Gut · doi:10.1136/gutjnl-2017-314050 · Cited by 674
Self-citationBohlen, C. J., Bennett, F. C., Tucker, A. F., Collins, H. Y., Mulinyawe, S. B., & Barres, B. A. (2017) · Neuron · doi:10.1016/j.neuron.2017.04.043 · Cited by 658
Minter, M. R., Zhang, C., Leone, V., Ringus, D. L., Zhang, X., Oyler-Castrillo, P., Musch, M. W., Liao, F., Ward, J. F., Holtzman, D. M., et al. (2016) · Scientific Reports · doi:10.1038/srep30028 · Cited by 655
Nagpal, R., Neth, B. J., Wang, S., Craft, S., & Yadav, H. (2019) · EBioMedicine · doi:10.1016/j.ebiom.2019.08.032 · Cited by 653
Interplay between innate immunity and Alzheimer disease: APOE and TREM2 in the spotlight
Shi, Y., & Holtzman, D. M. (2018) · Nature Reviews Immunology · doi:10.1038/s41577-018-0051-1 · Cited by 595
Loss of TREM2 function increases amyloid seeding but reduces plaque-associated ApoE
Parhizkar, S., Arzberger, T., Brendel, M., Kleinberger, G., Deussing, M., Focke, C., Nuscher, B., Xiong, M., Ghasemigharagoz, A., Katzmarski, N., et al. (2019) · Nature Neuroscience · doi:10.1038/s41593-018-0296-9 · Cited by 555
Self-citationThe gut microbiome in human neurological disease: A review
Tremlett, H., Bauer, K. C., Appel‐Cresswell, S., Finlay, B. B., & Waubant, E. (2017) · Annals of Neurology · doi:10.1002/ana.24901 · Cited by 535
Microbiome–microglia connections via the gut–brain axis
Abdel-Haq, R., Schlachetzki, J. C. M., Glass, C. K., & Mazmanian, S. K. (2019) · Journal of Experimental Medicine · doi:10.1084/jem.20180794 · Cited by 471 · cited 2×
“The microbiome plays an important role in microglial maturation during development and in adulthood (Abdel-Haq et al., 2019).”
BackgroundHaran, J. P., Bhattarai, S. K., Foley, S. E., Dutta, P., Ward, D. V., Bucci, V., & McCormick, B. A. (2019) · mBio · doi:10.1128/mbio.00632-19 · Cited by 412
Ho, L., Ono, K., Tsuji, M., Mazzola, P., Singh, R., & Pasinetti, G. M. (2018) · Expert Review of Neurotherapeutics · doi:10.1080/14737175.2018.1400909 · Cited by 376
Short chain fatty acids and their receptors: new metabolic targets
Layden, B. T., Angueira, A. R., Brodsky, M. R., Durai, V., & Lowe, W. L. (2012) · Translational research · doi:10.1016/j.trsl.2012.10.007 · Cited by 366
Loss of TREM2 function increases amyloid seeding but reduces plaque-associated ApoE
Parhizkar, S., Arzberger, T., Brendel, M., Kleinberger, G., Deußing, M., Focke, C., Nuscher, B., Xiong, M., Ghasemigharagoz, A., Katzmarski, N., et al. (2019) · doi:10.7892/boris.125653 · Cited by 352
Self-citationMarizzoni, M., Cattaneo, A., Mirabelli, P., Festari, C., Lopizzo, N., Nicolosi, V., Mombelli, E., Mazzelli, M., Luongo, D., Naviglio, D., et al. (2020) · Journal of Alzheimer s Disease · doi:10.3233/jad-200306 · Cited by 351
Short-Chain Fatty Acids Improve Poststroke Recovery via Immunological Mechanisms
Sadler, R., Cramer, J. V., Heindl, S., Kostidis, S., Betz, D., Zuurbier, K. R., Northoff, B. H., Heijink, M., Goldberg, M. P., Plautz, E. J., et al. (2019) · Journal of Neuroscience · doi:10.1523/jneurosci.1359-19.2019 · Cited by 347
Self-citationAltered Gut Microbiome Composition and Tryptic Activity of the 5xFAD Alzheimer’s Mouse Model
Brandscheid, C., Schuck, F., Reinhardt, S., Schäfer, K.-H., Pietrzik, C. U., Grimm, M., Hartmann, T., Schwiertz, A., & Endres, K. (2017) · Journal of Alzheimer s Disease · doi:10.3233/jad-160926 · Cited by 318
Minter, M. R., Hinterleitner, R., Meisel, M., Zhang, C., Leone, V., Zhang, X., Oyler-Castrillo, P., Zhang, X., Musch, M. W., Shen, X., et al. (2017) · Scientific Reports · doi:10.1038/s41598-017-11047-w · Cited by 292
Sex-specific effects of microbiome perturbations on cerebral Aβ amyloidosis and microglia phenotypes
Dodiya, H. B., Kuntz, T., Shaik, S. M., Baufeld, C., Leibowitz, J., Zhang, X., Gottel, N., Zhang, X., Butovsky, O., Gilbert, J. A., et al. (2019) · Journal of Experimental Medicine · doi:10.1084/jem.20182386 · Cited by 288
Regulation of microglial inflammatory response by sodium butyrate and short‐chain fatty acids
Huuskonen, J., Suuronen, T., Nuutinen, T., Kyrylenko, S., & Salminen, A. (2004) · British Journal of Pharmacology · doi:10.1038/sj.bjp.0705682 · Cited by 281
Patnala, R., Arumugam, T. V., Gupta, N., & Dheen, S. T. (2017) · Molecular Neurobiology · doi:10.1007/s12035-016-0149-z · Cited by 278
A 1H‐NMR thermometer suitable for cryoprobes
Findeisen, M., Brand, T., & Berger, S. T. A. (2006) · Magnetic Resonance in Chemistry · doi:10.1002/mrc.1941 · Cited by 273
Emerging Microglia Biology Defines Novel Therapeutic Approaches for Alzheimer’s Disease
Lewcock, J. W., Schlepckow, K., Di Paolo, G., Tahirovic, S., Monroe, K. M., & Haass, C. (2020) · Neuron · doi:10.1016/j.neuron.2020.09.029 · Cited by 221
Self-citationThe microbiome-gut-brain axis in acute and chronic brain diseases
Benakis, C., Martin‐Gallausiaux, C., Trezzi, J., Melton, P., Liesz, A., & Wilmes, P. (2019) · Current Opinion in Neurobiology · doi:10.1016/j.conb.2019.11.009 · Cited by 189
Self-citationAttar, A., Liu, T., Chan, W.-T. C., Hayes, J., Nejad, M., Lei, K., & Bitan, G. (2013) · PLoS ONE · doi:10.1371/journal.pone.0080355 · Cited by 177
Young microglia restore amyloid plaque clearance of aged microglia
Daria, A., Colombo, A., Llovera, G., Hampel, H., Willem, M., Liesz, A., Haass, C., & Tahirovic, S. (2017) · The EMBO Journal · doi:10.15252/embj.201694591 · Cited by 174
Self-citationFibrillar Aβ triggers microglial proteome alterations and dysfunction in Alzheimer mouse models
Sebastian Monasor, L., Müller, S. A., Colombo, A. V., Tanrioever, G., König, J., Roth, S., Liesz, A., Berghofer, A., Piechotta, A., Prestel, M., et al. (2020) · eLife · doi:10.7554/elife.54083 · Cited by 147
Self-citationHefendehl, J. K., Wegenast‐Braun, B. M., Liebig, C., Eicke, D., Milford, D., Calhoun, M. E., Kohsaka, S., Eichner, M., & Jucker, M. (2011) · Journal of Neuroscience · doi:10.1523/jneurosci.5147-10.2011 · Cited by 143
The gut microbiome primes a cerebroprotective immune response after stroke
Singh, V., Sadler, R., Heindl, S., Llovera, G., Roth, S., Benakis, C., & Liesz, A. (2018) · Journal of Cerebral Blood Flow & Metabolism · doi:10.1177/0271678x18780130 · Cited by 133
Self-citationGC-MS Analysis of Short-Chain Fatty Acids in Feces, Cecum Content, and Blood Samples
Hoving, L. R., Heijink, M., van Harmelen, V., van Dijk, K. W., & Giera, M. A. (2018) · Methods in molecular biology · doi:10.1007/978-1-4939-7592-1_17 · Cited by 126
Self-citationLoss of NPC1 enhances phagocytic uptake and impairs lipid trafficking in microglia
Colombo, A. V., Dinkel, L., Müller, S. A., Monasor, L. S., Schifferer, M., Cantuti‐Castelvetri, L., König, J., Vidatic, L., Brémovà-Ertl, T., Lieberman, A. P., et al. (2021) · Nature Communications · doi:10.1038/s41467-021-21428-5 · Cited by 115
Self-citationRapid pulse length determination in high-resolution NMR
Wu, P., & Otting, G. (2005) · Journal of Magnetic Resonance · doi:10.1016/j.jmr.2005.05.018 · Cited by 104
Winkler, E., Kamp, F., Scheuring, J., Ebke, A., Fukumori, A., & Steiner, H. (2012) · Journal of Biological Chemistry · doi:10.1074/jbc.m112.356659 · Cited by 102
Self-citationInnate Immunity Fights Alzheimer's Disease
Guillot‐Sestier, M., Doty, K. R., & Town, T. (2015) · Trends in Neurosciences · doi:10.1016/j.tins.2015.08.008 · Cited by 101
BACE1 inhibition more effectively suppresses initiation than progression of β-amyloid pathology
Peters, F., Salihoglu, H., Rodrigues, E. F., Herzog, É., Blume, T., Filser, S., Dorostkar, M. M., Shimshek, D. R., Brose, N., Neumann, U., et al. (2018) · Acta Neuropathologica · doi:10.1007/s00401-017-1804-9 · Cited by 86
Self-citationMoschén, I., Bröer, A., Galić, S., Lang, F. J. W., & Bröer, S. (2012) · Neurochemical Research · doi:10.1007/s11064-012-0857-3 · Cited by 84
Yamasaki, A., Eimer, S., Okochi, M., Smialowska, A., Kaether, C., Baumeister, R., Haass, C., & Steiner, H. (2006) · Journal of Neuroscience · doi:10.1523/jneurosci.5354-05.2006 · Cited by 79
Self-citationLiao, F., Zhang, T. J., Jiang, H., Lefton, K. B., Robinson, G. O., Vassar, R., Sullivan, P. M., & Holtzman, D. M. (2015) · Acta Neuropathologica Communications · doi:10.1186/s40478-015-0250-y · Cited by 77
Shirotani, K., Tomioka, M., Kremmer, E., Haass, C., & Steiner, H. (2007) · Neurobiology of Disease · doi:10.1016/j.nbd.2007.04.011 · Cited by 69
Self-citationMicrobiota differences between commercial breeders impacts the post-stroke immune response
Sadler, R., Singh, V., Benakis, C., Garzetti, D., Brea, D., Stecher, B., Anrather, J., & Liesz, A. (2017) · Brain Behavior and Immunity · doi:10.1016/j.bbi.2017.03.011 · Cited by 69
Self-citationT cells in the post-ischemic brain: Troopers or paramedics?
Cramer, J. V., Benakis, C., & Liesz, A. (2018) · Journal of Neuroimmunology · doi:10.1016/j.jneuroim.2018.11.006 · Cited by 44
Self-citationEmerging Role of Diet and Microbiota Interactions in Neuroinflammation
Janakiraman, M., & Krishnamoorthy, G. (2018) · Frontiers in Immunology · doi:10.3389/fimmu.2018.02067 · Cited by 39
KIMBLE: A versatile visual NMR metabolomics workbench in KNIME
Verhoeven, A., Giera, M. A., & Mayboroda, O. A. (2018) · Analytica Chimica Acta · doi:10.1016/j.aca.2018.07.070 · Cited by 25
Self-citation
Cited by
Sorted by citations
Role of neuroinflammation in neurodegeneration development
Zhang, W., Xiao, D., Mao, Q., & Xia, H. (2023) · Signal Transduction and Targeted Therapy · doi:10.1038/s41392-023-01486-5 · Cited by 1,668
“Gut microbiota imbalance induces intestinal inflammation and further leads to systemic inflammation through the release of immune-stimulating substances and metabolites into blood circulation.(103) Moreover, gut bacteria can also affect CNS inflammation by binding to specific receptors, such as the proinflammatory tac…”
BackgroundMicrobiota–gut–brain axis and its therapeutic applications in neurodegenerative diseases
Loh, J. S., Mak, W. Q., Tan, L. K. S., Ng, C. X., Chan, H. H., Yeow, S. H., Foo, J. B., Ong, Y. S., How, C. W., & Khaw, K. Y. (2024) · Signal Transduction and Targeted Therapy · doi:10.1038/s41392-024-01743-1 · Cited by 1,193
Short chain fatty acids: Microbial metabolites for gut-brain axis signalling
O’Riordan, K. J., Collins, M., Moloney, G. M., Knox, E. G., Aburto, M. R., Fülling, C., Morley, S. J., Clarke, G. A., Schellekens, H., & Cryan, J. F. (2022) · Molecular and Cellular Endocrinology · doi:10.1016/j.mce.2022.111572 · Cited by 788
The Microbiota–Gut–Brain Axis in Psychiatric Disorders
Góralczyk-Bińkowska, A., Szmajda‐Krygier, D., & Kozłowska, E. (2022) · International Journal of Molecular Sciences · doi:10.3390/ijms231911245 · Cited by 569
Microbiota-derived metabolites as drivers of gut–brain communication
Ahmed, H., Leyrolle, Q., Koistinen, V., Kärkkäinen, O., Layé, S., Delzenne, N., & Hanhineva, K. (2022) · Gut Microbes · doi:10.1080/19490976.2022.2102878 · Cited by 462
Metadata
- Authors
- Colombo, A. V., Sadler, R. K., Llovera, G., Singh, V., Roth, S., Heindl, S., Sebastian Monasor, L., Verhoeven, A., Peters, F., Parhizkar, S., Kamp, F., Gomez de Aguero, M., MacPherson, A. J., Winkler, E., Herms, J., Benakis, C., Dichgans, M., Steiner, H., Giera, M., Haass, C., Tahirovic, S., & Liesz, A.
- Affiliations
- German Center for Neurodegenerative Diseases (DE)
- Institut für Schlaganfall- und Demenzforschung (DE)
- German Center for Neurodegenerative Diseases (DZNE), Munich, Germany
- Leiden University Medical Center (NL)
- Ludwig-Maximilians-Universität München (DE)
- Maurice Müller Laboratories (DKF), Universitätsklinik für Viszerale Chirurgie und Medizin Inselspital, Bern, Switzerland
- University Hospital of Bern (CH)
- Munich Cluster for Systems Neurology (DE)
- Corresponding author
- Liesz, Arthur
- ORCID
- Colombo, Alessio Vittorio
- Sadler, Rebecca Katie
- Llovera, Gemma
- Singh, Vikramjeet
- Roth, Stefan
- Heindl, Steffanie
- Sebastian Monasor, Laura
- Verhoeven, Aswin
- Peters, Finn
- Parhizkar, Samira
- Kamp, Frits
- Gomez de Aguero, Mercedes
- MacPherson, Andrew J
- Herms, Jochen
- Benakis, Corinne
- Dichgans, Martin
- Steiner, Harald
- Giera, Martin
- Haass, Christian
- Tahirovic, Sabina
- Liesz, Arthur
- Venue
- eLife
- Publisher
- eLife Sciences Publications, Ltd
- Published
- 2021-04-13
- Volume
- 10
- ISSN
- 2050-084X (ISSN-L)
- PMC
- PMC8043748
- OpenAlex
- W3153691725
- Cited by
- 354
- References
- 75
- Citations by year
- 2026: 58 · 2025: 82 · 2024: 73 · 2023: 61 · 2022: 61 · 2021: 18
- FWCI
- 33.41
- Type
- journal article
- Language
- en
- Open access
- gold
- doi.org
- Licence
- Locations
- eLife (publishedVersion, cc-by)
- bioRxiv (Cold Spring Harbor Laboratory) (acceptedVersion)
- PubMed Central (publishedVersion, cc-by)
- PubMed (publishedVersion)
- Leiden Repository (Leiden University) (submittedVersion, cc-by)
- Data Archiving and Networked Services (DANS) (submittedVersion, other-oa)
- Bern Open Repository and Information System (University of Bern) (submittedVersion, cc-by)
- DOAJ (DOAJ: Directory of Open Access Journals) (submittedVersion, cc-by-sa)
- Open access LMU (Ludwid Maxmilian's Universitat Munchen) (submittedVersion, cc-by)
- DZNE Pub (submittedVersion, other-oa)
- Open Access CRIS of the University of Bern
- Funders
- Vascular Dementia Research Foundation
- Deutsche Forschungsgemeinschaft (STE847/6-1, HA1737/16-1, EXC 2145 SyNergy - ID 390857198, LI-2534/7-1)
- H2020 European Research Council (ERC-StG 802305, NMP-2015-686271)
- Helmholtz Association (Zukunftsthema "Immunology and Inflammation"))
- NCL Foundation
- Alzheimer Forschung Initiative (18014)
- Alzheimer's Association (ADSF-21-831226-C)
- Topics
- Life Sciences › Neuroscience › Cellular and Molecular Neuroscience › Alzheimer's disease research and treatments
- Life Sciences › Biochemistry, Genetics and Molecular Biology › Molecular Biology › Gut microbiota and health
- Life Sciences › Neuroscience › Neurology › Neuroinflammation and Neurodegeneration Mechanisms
- Keywords
- short-chain fatty acids, gut microbiota, Alzheimer's disease, amyloid plaques, microglia, gut-brain axis, germ-free mice, microbial metabolites, apolipoprotein E, microglial phenotype
- MeSH terms
- Gastrointestinal Microbiome, Alzheimer Disease, Animals, Fatty Acids, Volatile, Female, Male, Specific Pathogen-Free Organisms, Microglia, Mice, Plaque, Amyloid
About these checks
Registry, retraction, Cites and statistics results are computed, not judged, with one exception: a printed reference that no index lists is read once by a model before it counts as a citation error. Claims are extracted by a model and kept only when their quote appears verbatim in the text; each cited source is then checked, with a model’s help, for whether it says what the claim relies on. Those verdicts can be wrong — read the claim’s quote and the cited source before relying on one.
Statistics and arithmetic are recomputed, not judged.
Confidence bands are shown only for fields calibrated on our annotated test set. None is calibrated yet, so no band is shown.
What counts as a claim ›How we measure confidence ›How we check this ›
Are you an author, or do you see a problem with this page? Request a review
