Cited by 38

The DOI matches its Crossref record; 9 of the 9 references it cites were found in a registry or an index.

MicroRNA-138 controls hippocampal interneuron function and short-term memory in mice

Daswani, Reetu, Gilardi, Carlotta, Soutschek, Michael, Nanda, Prakruti, Weiss, Kerstin, Bicker, Silvia, Fiore, Roberto, Dieterich, Christoph, Germain, Pierre-Luc, Winterer, Jochen, Schratt, Gerhard·2022·eLife

Published version of a preprint

Abstract

The proper development and function of neuronal circuits rely on a tightly regulated balance between excitatory and inhibitory (E/I) synaptic transmission, and disrupting this balance can cause neurodevelopmental disorders, for example, schizophrenia. MicroRNA-dependent gene regulation in pyramidal neurons is important for excitatory synaptic function and cognition, but its role in inhibitory interneurons is poorly understood. Here, we identify miR138-5p as a regulator of short-term memory and inhibitory synaptic transmission in the mouse hippocampus. Sponge-mediated miR138-5p inactivation specifically in mouse parvalbumin (PV)-expressing interneurons impairs spatial recognition memory and enhances GABAergic synaptic input onto pyramidal neurons. Cellular and behavioral phenotypes associated with miR138-5p inactivation are paralleled by an upregulation of the schizophrenia (SCZ)-associated Erbb4 , which we validated as a direct miR138-5p target gene. Our findings suggest that miR138-5p is a critical regulator of PV interneuron function in mice, with implications for cognition and SCZ. More generally, they provide evidence that microRNAs orchestrate neural circuit development by fine-tuning both excitatory and inhibitory synaptic transmission.

Overview

The claims and statistics of this paper haven’t been checked yet.

Run the check — free, no account needed. It reads the open-access text and checks the sources it cites.

A few free checks a day · papers already verified open instantly · results are public

Integrity signals

Registry

Crossref · 10.7554/elife.74056

Cites

9 of 9 references verified0 citation errors · 0 not checkable

Statistics

Figures

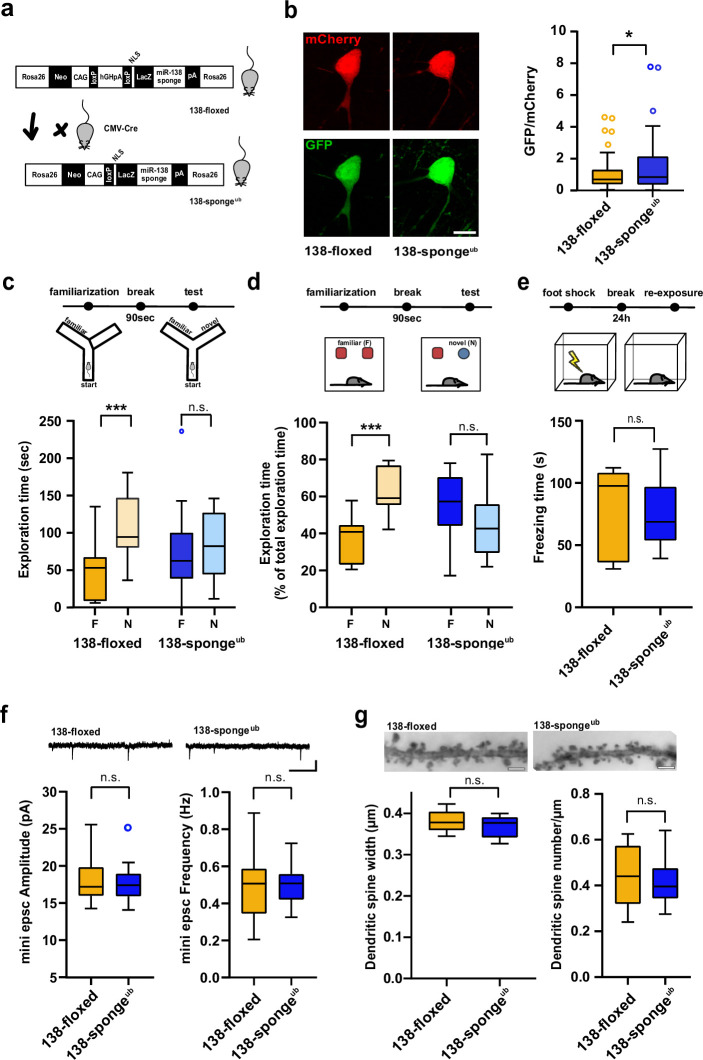
Figure 1. Impaired working memory in ubiquitous 138-sponge mice. (a) Schematic overview of the strategy for generating 138-spongeub mice. (b) Left: representative images of mCherry and GFP expression in hippocampal neurons from 138-floxed and 138-spongeub mice, respectively. Right: bar graphs of GFP/mCherry ratios from CA1 hippocampal neurons infected with a 138-pbds sensor construct; 138-floxed: n=105 cells from two mice, 138-spongeub: n=127 cells from three mice; p=0.02 (KS-test). (c) Upper panel: schematic representation of the Y-maze novelty preference task; lower panel: exploration time spent in familiar (F) and novel (N) arm; 138-floxed: n=12 mice; 138-spongeub: n=14 mice; ***p=0.005; n.s.=0.711 (Student’s two-tailed heteroscedastic t-test). (d) Upper panel: schematic representation of the novel object recognition task; lower panel: exploration time presented as percentage of total time spent with either novel or familiar object; 138-floxed: n=12 mice; 138-spongeub: n=12 mice; ****p<0.00002; n.s. p=0.11 (Student’s two-tailed heteroscedastic t-test). (e) Upper: schematic representation of the contextual fear conditioning task; lower: time (s) mice spent freezing 24 hr after the foot shock was administrated; 138-floxed: n=7 mice; 138-spongeub: n=7 mice; n.s. p=0.97 (Student’s two-tailed heteroscedastic t-test). (f) mEPSC recording in CA1 pyramidal neurons. Upper panel: example traces; scale bar: 20 pA, 500 ms. Lower panel left: mEPSC amplitude (138-floxed: range, from 14.3 to 25.6 pA; median, 17.2 pA; interquartile range [IQR], 3.9 pA. 138-spongeub: range, from 14.1 to 25.2 pA; median, 17.4 pA; IQR, 3.1 pA; n.s. p=0.74 Student’s two-tailed heteroscedastic t-test). Lower panel right: mEPSC frequency (138-floxed: range, from 0.2 to 0.9 Hz; median, 0.5 Hz; IQR, 0.2 Hz. 138-spongeub: range, from 0.3 to 0.7 Hz; median, 0.5 Hz; IQR, 0.1 Hz; n.s. p=0.91 Student’s two-tailed heteroscedastic t-test). 138-floxed: n=13 cells/4 mice; 138-spongeub: n=13 cells/3 mice. (g) Upper panel: representative images of Golgi-stained CA1 pyramidal neuron dendritic segments of the indicated genotypes. Lower panel: quantification of dendritic spine width (left) and density (number/μm; right) based on Golgi staining; 138-floxed: n=15 cells/3 mice (1312 spines total); 138-spongeub: n=18 cells/3 mice (1687 spines total) (n.s., p=0.25 (width); p=0.49 (density); Student’s two-tailed heteroscedastic t-test). mEPSC, miniature excitatory postsynaptic current.
Figure 1. Impaired working memory in ubiquitous 138-sponge mice. (a) Schematic overview of the strategy for generating 138-spongeub mice. (b) Left: representative images of mCherry and GFP expression in hippocampal neurons from 138-floxed and 138-spongeub mice, respectively. Right: bar graphs of GFP/mCherry ratios from CA1 hippocampal neurons infected with a 138-pbds sensor construct; 138-floxed: n=105 cells from two mice, 138-spongeub: n=127 cells from three mice; p=0.02 (KS-test). (c) Upper panel: schematic representation of the Y-maze novelty preference task; lower panel: exploration time spent in familiar (F) and novel (N) arm; 138-floxed: n=12 mice; 138-spongeub: n=14 mice; ***p=0.005; n.s.=0.711 (Student’s two-tailed heteroscedastic t-test). (d) Upper panel: schematic representation of the novel object recognition task; lower panel: exploration time presented as percentage of total time spent with either novel or familiar object; 138-floxed: n=12 mice; 138-spongeub: n=12 mice; ****p<0.00002; n.s. p=0.11 (Student’s two-tailed heteroscedastic t-test). (e) Upper: schematic representation of the contextual fear conditioning task; lower: time (s) mice spent freezing 24 hr after the foot shock was administrated; 138-floxed: n=7 mice; 138-spongeub: n=7 mice; n.s. p=0.97 (Student’s two-tailed heteroscedastic t-test). (f) mEPSC recording in CA1 pyramidal neurons. Upper panel: example traces; scale bar: 20 pA, 500 ms. Lower panel left: mEPSC amplitude (138-floxed: range, from 14.3 to 25.6 pA; median, 17.2 pA; interquartile range [IQR], 3.9 pA. 138-spongeub: range, from 14.1 to 25.2 pA; median, 17.4 pA; IQR, 3.1 pA; n.s. p=0.74 Student’s two-tailed heteroscedastic t-test). Lower panel right: mEPSC frequency (138-floxed: range, from 0.2 to 0.9 Hz; median, 0.5 Hz; IQR, 0.2 Hz. 138-spongeub: range, from 0.3 to 0.7 Hz; median, 0.5 Hz; IQR, 0.1 Hz; n.s. p=0.91 Student’s two-tailed heteroscedastic t-test). 138-floxed: n=13 cells/4 mice; 138-spongeub: n=13 cells/3 mice. (g) Upper panel: representative images of Golgi-stained CA1 pyramidal neuron dendritic segments of the indicated genotypes. Lower panel: quantification of dendritic spine width (left) and density (number/μm; right) based on Golgi staining; 138-floxed: n=15 cells/3 mice (1312 spines total); 138-spongeub: n=18 cells/3 mice (1687 spines total) (n.s., p=0.25 (width); p=0.49 (density); Student’s two-tailed heteroscedastic t-test). mEPSC, miniature excitatory postsynaptic current.CC BY · PubMed Central
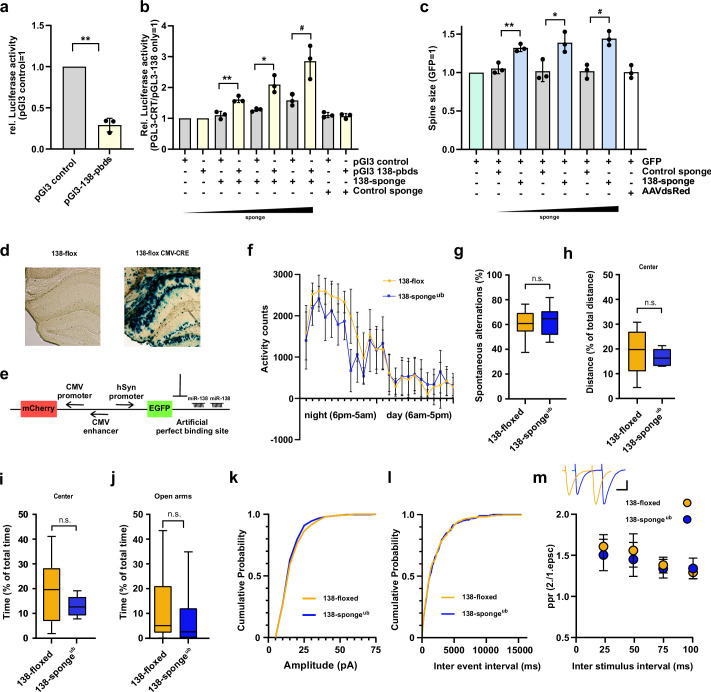
Figure 1—figure supplement 1. Validation, behavioural and electrophysiological characterization of ubiquitous miR-138 sponge mice. (a) Relative luciferase activity in hippocampal neurons (DIV 12–17) transfected with pGL3 CTR (control) or pGL3-138 pbds (sensor) constructs. pGL3-CTR=1. n=3 independent transfections. **p=0.0013 (One sample t-test). (b) Relative luciferase activity in hippocampal neurons (DIV 12–17) transfected as in (a), in addition with either control (100 ng) or increasing amounts of 138 sponge (25–100 ng). pGL3-CTR/pGL3-138 only =1. n=3 independent transfections, **p=0.005, *p=0.032, #p=0.045 (Student’s two-tailed heteroscedastic t-test). (c) Quantification of relative dendritic spine volume in rat hippocampal neurons (DIV10–18) transfected with GFP and increasing amounts (25–100 ng) of either control or 138 sponge. GFP only =1. n=3 independent transfections; each value represents at least 150 spines per cell, from six individual neurons per experiment. **p=0.006, *p=0.027, #p=0.004 (Student’s two-tailed heteroscedastic t-test). (d) Representative enzymatic b-Gal staining of hippocampal slices obtained from 138-floxed mice (P21) injected with either saline (left) or rAAV-CMV-CRE (right). (e) Schematic of the sensor principle. (f) Activity counts of mice from indicated genotypes monitored over 24 hr in their home cage; 138-floxed: n=7 mice, 138-spongeub: n=7 mice; data shown as mean ±s.d. (g) Percentage of spontaneous alternations in the Y-Maze. 138-floxed: n=14 mice; 138-spongeub: n=14 mice; p=0.43 (Student’s two-tailed heteroscedastic t-test). (h, i) Percentage of total distance travelled (h)/time spent (i) in the center of an open field arena during 30 min exploration by mice of the indicated genotypes; 138-floxed: n=14 mice; 138-spongeub: n=14 mice; (h) p=0.30, (i) p=0.054 (Student’s two-tailed heteroscedastic t-test). (j) Percentage of total time spent in the open arms of an elevated plus maze (EPM) during 5 min exploration by mice of the indicated genotypes; 138-floxed: n=14 mice; 138-spongeub: n=14 mice; p=0.50 (Mann-Whitney test). (k, l) Cumulative distribution mEPSC amplitude (p=0.65; Kolmogorov-Smirnov [KS] test) (k) and frequency (p=0.85; KS test) (l). (m) PPR of stimulated EPSCs in CA1 pyramidal neurons. Upper panel: example traces of PPR (inter stimulus interval of 50 ms) for 138-floxed (orange) and 138-spongeub (blue); scale bar: 100 pA, 20 ms. Lower panel: PPRs for different interstimulus intervals ranging from 25 ms to 100 ms (138-floxed vs. 138-spongeub [mean ±s.d.]: 25 ms, 1.6±0.1 vs. 1.5±0.2 [n=13]; 50 ms: 1.6±0.2 vs. 1.5±0.2 [n=13]; 75 ms: 1.4±0.1 vs. 1.3±0.1 [n=11]; 100 ms: 1.3±0.1 vs. 1.3±0.1 [n=11]. n.s. p=0.14, 0.09, 0.17, and 0.13 for 25, 50, 75, and 100 ms) inter stimulus intervals, respectively. Mann-Whitney test. PPR, paired-pulse ratio.
Figure 1—figure supplement 1. Validation, behavioural and electrophysiological characterization of ubiquitous miR-138 sponge mice. (a) Relative luciferase activity in hippocampal neurons (DIV 12–17) transfected with pGL3 CTR (control) or pGL3-138 pbds (sensor) constructs. pGL3-CTR=1. n=3 independent transfections. **p=0.0013 (One sample t-test). (b) Relative luciferase activity in hippocampal neurons (DIV 12–17) transfected as in (a), in addition with either control (100 ng) or increasing amounts of 138 sponge (25–100 ng). pGL3-CTR/pGL3-138 only =1. n=3 independent transfections, **p=0.005, *p=0.032, #p=0.045 (Student’s two-tailed heteroscedastic t-test). (c) Quantification of relative dendritic spine volume in rat hippocampal neurons (DIV10–18) transfected with GFP and increasing amounts (25–100 ng) of either control or 138 sponge. GFP only =1. n=3 independent transfections; each value represents at least 150 spines per cell, from six individual neurons per experiment. **p=0.006, *p=0.027, #p=0.004 (Student’s two-tailed heteroscedastic t-test). (d) Representative enzymatic b-Gal staining of hippocampal slices obtained from 138-floxed mice (P21) injected with either saline (left) or rAAV-CMV-CRE (right). (e) Schematic of the sensor principle. (f) Activity counts of mice from indicated genotypes monitored over 24 hr in their home cage; 138-floxed: n=7 mice, 138-spongeub: n=7 mice; data shown as mean ±s.d. (g) Percentage of spontaneous alternations in the Y-Maze. 138-floxed: n=14 mice; 138-spongeub: n=14 mice; p=0.43 (Student’s two-tailed heteroscedastic t-test). (h, i) Percentage of total distance travelled (h)/time spent (i) in the center of an open field arena during 30 min exploration by mice of the indicated genotypes; 138-floxed: n=14 mice; 138-spongeub: n=14 mice; (h) p=0.30, (i) p=0.054 (Student’s two-tailed heteroscedastic t-test). (j) Percentage of total time spent in the open arms of an elevated plus maze (EPM) during 5 min exploration by mice of the indicated genotypes; 138-floxed: n=14 mice; 138-spongeub: n=14 mice; p=0.50 (Mann-Whitney test). (k, l) Cumulative distribution mEPSC amplitude (p=0.65; Kolmogorov-Smirnov [KS] test) (k) and frequency (p=0.85; KS test) (l). (m) PPR of stimulated EPSCs in CA1 pyramidal neurons. Upper panel: example traces of PPR (inter stimulus interval of 50 ms) for 138-floxed (orange) and 138-spongeub (blue); scale bar: 100 pA, 20 ms. Lower panel: PPRs for different interstimulus intervals ranging from 25 ms to 100 ms (138-floxed vs. 138-spongeub [mean ±s.d.]: 25 ms, 1.6±0.1 vs. 1.5±0.2 [n=13]; 50 ms: 1.6±0.2 vs. 1.5±0.2 [n=13]; 75 ms: 1.4±0.1 vs. 1.3±0.1 [n=11]; 100 ms: 1.3±0.1 vs. 1.3±0.1 [n=11]. n.s. p=0.14, 0.09, 0.17, and 0.13 for 25, 50, 75, and 100 ms) inter stimulus intervals, respectively. Mann-Whitney test. PPR, paired-pulse ratio.CC BY · PubMed Central
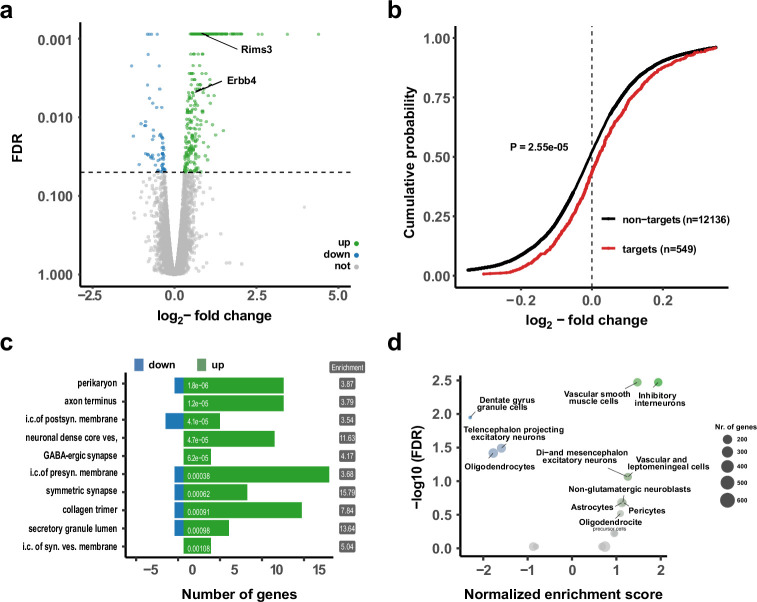
Figure 2. Upregulation of interneuron-enriched synaptic genes in ubiquitous miR-138 sponge mice. (a) Volcano plot of differentially expressed genes (DEGs) obtained from polyA-RNAseq of total hippocampal RNA from 138-flox and 138-spongeub mice. N=3. Genes with FDR <0.05 are labeled blue (downregulated) or green (upregulated). Rims3 and Erbb4 are indicated. (b) Cumulative distribution plots of log2-fold expression changes (138-spongeub/138-floxed) for genes either containing (targets, red curve) or not containing (non-targets, black curve) predicted miR-138 binding sites. p=2.55e–05 (KS-test). (c) Gene ontology (GO) term analysis for DEGs. Top ten enriched cellular component (CC) GO terms with less than 200 total genes are shown. (d) Enrichment analysis of DEGs in different brain cell types based on published single-cell RNA-seq data (Zeisel et al., 2018). Normalized enrichment score >0: upregulated in 138-spongeub mice. KS, Kolmogorov-Smirnov.
Figure 2. Upregulation of interneuron-enriched synaptic genes in ubiquitous miR-138 sponge mice. (a) Volcano plot of differentially expressed genes (DEGs) obtained from polyA-RNAseq of total hippocampal RNA from 138-flox and 138-spongeub mice. N=3. Genes with FDR <0.05 are labeled blue (downregulated) or green (upregulated). Rims3 and Erbb4 are indicated. (b) Cumulative distribution plots of log2-fold expression changes (138-spongeub/138-floxed) for genes either containing (targets, red curve) or not containing (non-targets, black curve) predicted miR-138 binding sites. p=2.55e–05 (KS-test). (c) Gene ontology (GO) term analysis for DEGs. Top ten enriched cellular component (CC) GO terms with less than 200 total genes are shown. (d) Enrichment analysis of DEGs in different brain cell types based on published single-cell RNA-seq data (Zeisel et al., 2018). Normalized enrichment score >0: upregulated in 138-spongeub mice. KS, Kolmogorov-Smirnov.CC BY · PubMed Central
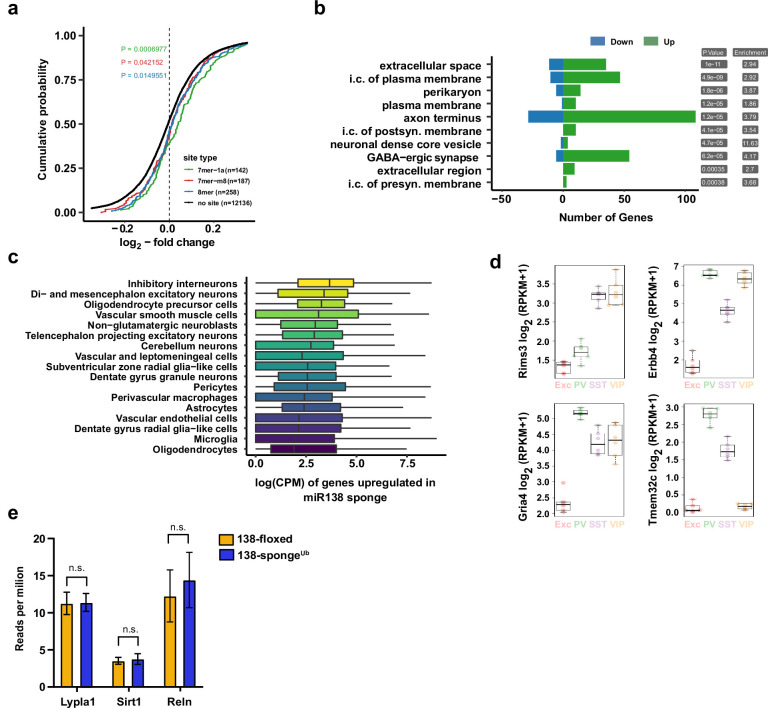
Figure 2—figure supplement 1. Gene expression analysis in ubiquitous miR-138 sponge mice. (a) Cumulative distribution plots of log2-fold expression changes (138-spongeub/138-floxed) for genes either containing 7mer-1a (green), 7mer-m8 (red), 8mer (blue), or no (no site, black curve) predicted miR-138 binding sites. P value is calculated compared to the no site population and indicated in the graph (KS-test). (b) Gene ontology (GO) term analysis for DEGs. Top ten enriched cellular component (CC) GO terms are shown. (c) Normalized expression levels, in single-cell clusters from Zeisel et al., 2018, of the genes upregulated in the miR-138 sponge. The genes are most abundantly expressed in inhibitory neurons. (d) Expression plots of selected miR-138 binding site containing transcripts in different neuronal subtypes. EXC: excitatory neurons; PV: parvalbumin+interneurons; SST: somatostatin +interneurons; VIP: Vasoactive intestinal peptide+interneurons based on http://research-pub.gene.com/NeuronSubtypeTranscriptomes/. (e) Expression of validated miR138-5p targets based on RNA-seq in 138-floxed and 138-spongeUb mice. n=3 mice. Lypla1 n.s. p=0.90; Sirt1 n.s. p=0.66; Reln n.s. p=0.50 (Student’s two-tailed heteroscedastic t-test). DEG, differentially expressed gene; KS, Kolmogorov-Smirnov.
Figure 2—figure supplement 1. Gene expression analysis in ubiquitous miR-138 sponge mice. (a) Cumulative distribution plots of log2-fold expression changes (138-spongeub/138-floxed) for genes either containing 7mer-1a (green), 7mer-m8 (red), 8mer (blue), or no (no site, black curve) predicted miR-138 binding sites. P value is calculated compared to the no site population and indicated in the graph (KS-test). (b) Gene ontology (GO) term analysis for DEGs. Top ten enriched cellular component (CC) GO terms are shown. (c) Normalized expression levels, in single-cell clusters from Zeisel et al., 2018, of the genes upregulated in the miR-138 sponge. The genes are most abundantly expressed in inhibitory neurons. (d) Expression plots of selected miR-138 binding site containing transcripts in different neuronal subtypes. EXC: excitatory neurons; PV: parvalbumin+interneurons; SST: somatostatin +interneurons; VIP: Vasoactive intestinal peptide+interneurons based on http://research-pub.gene.com/NeuronSubtypeTranscriptomes/. (e) Expression of validated miR138-5p targets based on RNA-seq in 138-floxed and 138-spongeUb mice. n=3 mice. Lypla1 n.s. p=0.90; Sirt1 n.s. p=0.66; Reln n.s. p=0.50 (Student’s two-tailed heteroscedastic t-test). DEG, differentially expressed gene; KS, Kolmogorov-Smirnov.CC BY · PubMed Central
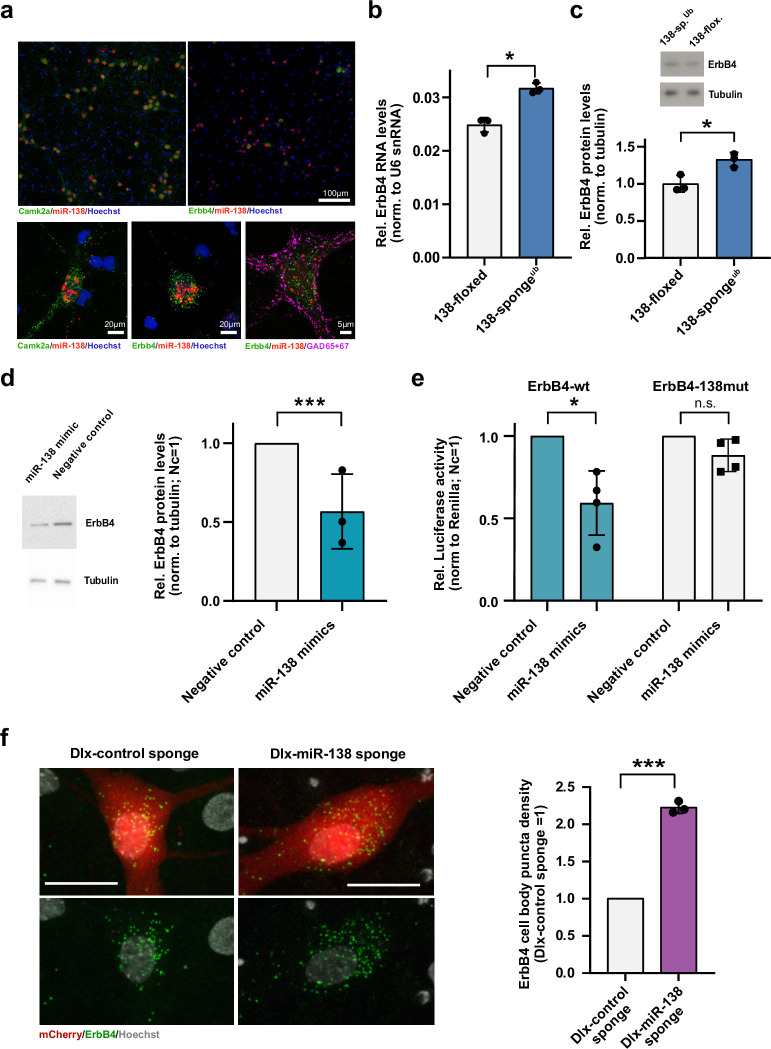
Figure 3. Erbb4 is a direct miR-138 target in rat hippocampal interneurons. (a) Single-molecule (Sm) FISH analysis of miR-138 (red) together with Camk2a or Erbb4 mRNA to label excitatory or inhibitory neurons, respectively. Hoechst was used to counterstain nuclei. GAD65/67 antibody staining was used to identify GABAergic neurons. Scale bar =100 μm (upper); 20 μm (lower left and center), 5 μm (lower right). (b) qPCR analysis of ErbB4 mRNA in total hippocampal RNA obtained from 138-floxed or 138-spongeub mice. U6 snRNA was used for normalization. n=3 mice; *p=0.003, (Student’s two-tailed heteroscedastic t-test). (c, d) Western blot analysis of Erbb4 protein in hippocampal lysates from 138-floxed or 138-spongeub mice (c) or lysates from rat hippocampal neurons (DIV12) transfected with miR-138 or control mimic (d). Tubulin was used for normalization. (c) n=3 mice; *p=0.025 (Student’s two-tailed heteroscedastic t-test); (d) n=3 independent transfections; ***p=0.0009 (one sample t-test). (e) Relative luciferase activity in rat cortical neurons (DIV9-12) transfected with Erbb4 3′UTR constructs with (138mut) or without (wt) a mutation in the miR-138 binding site, together with miR-138 or negative control mimics. Negative control mimic =1. n=4 independent transfections, *p=0.025, n.s. p=0.09 (Student’s two-tailed heteroscedastic t-test). (f) Sm FISH analysis of Erbb4 (green) in rat hippocampal interneurons infected with Dlx-control-sponge or miR-138-sponge. Left panel: representative neurons, scale bar =20 μm. Green: Erbb4 FISH; gray: DAPI (nuclei); red: mCherry (Dlx5/6 expressing interneurons). Right panel: Erbb4 FISH quantification. Control sponge =1. N=3 independent infections (10–12 cells per condition), ***p=0.0004 (one-sample t-test).
Figure 3. Erbb4 is a direct miR-138 target in rat hippocampal interneurons. (a) Single-molecule (Sm) FISH analysis of miR-138 (red) together with Camk2a or Erbb4 mRNA to label excitatory or inhibitory neurons, respectively. Hoechst was used to counterstain nuclei. GAD65/67 antibody staining was used to identify GABAergic neurons. Scale bar =100 μm (upper); 20 μm (lower left and center), 5 μm (lower right). (b) qPCR analysis of ErbB4 mRNA in total hippocampal RNA obtained from 138-floxed or 138-spongeub mice. U6 snRNA was used for normalization. n=3 mice; *p=0.003, (Student’s two-tailed heteroscedastic t-test). (c, d) Western blot analysis of Erbb4 protein in hippocampal lysates from 138-floxed or 138-spongeub mice (c) or lysates from rat hippocampal neurons (DIV12) transfected with miR-138 or control mimic (d). Tubulin was used for normalization. (c) n=3 mice; *p=0.025 (Student’s two-tailed heteroscedastic t-test); (d) n=3 independent transfections; ***p=0.0009 (one sample t-test). (e) Relative luciferase activity in rat cortical neurons (DIV9-12) transfected with Erbb4 3′UTR constructs with (138mut) or without (wt) a mutation in the miR-138 binding site, together with miR-138 or negative control mimics. Negative control mimic =1. n=4 independent transfections, *p=0.025, n.s. p=0.09 (Student’s two-tailed heteroscedastic t-test). (f) Sm FISH analysis of Erbb4 (green) in rat hippocampal interneurons infected with Dlx-control-sponge or miR-138-sponge. Left panel: representative neurons, scale bar =20 μm. Green: Erbb4 FISH; gray: DAPI (nuclei); red: mCherry (Dlx5/6 expressing interneurons). Right panel: Erbb4 FISH quantification. Control sponge =1. N=3 independent infections (10–12 cells per condition), ***p=0.0004 (one-sample t-test).CC BY · PubMed Central
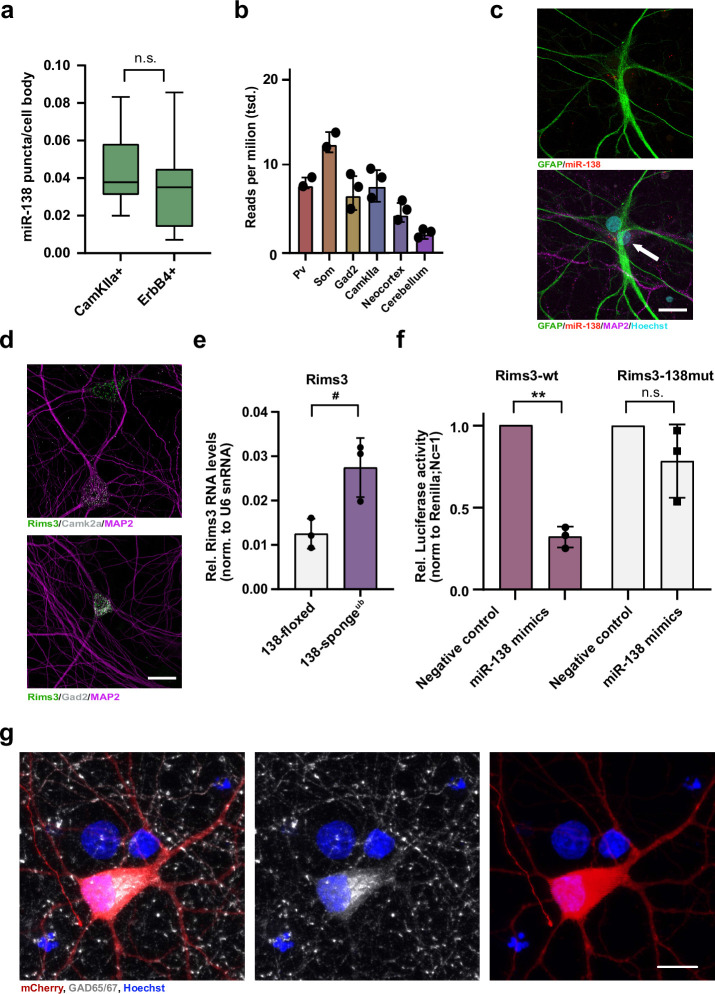
Figure 3—figure supplement 1. Validation of miR-138 target genes in rat hippocampal interneurons. (a) Quantification of miR138-5p smFISH in Camk2a- and Erbb4-positive neurons. Camk2a-positive n =10 cells; ErbB4-positive n=7 cells, p=0.48 (Student’s two-tailed heteroscedastic t-test). (b) Quantification of miR138-5p levels in mouse brain tissue based on small RNA-seq data from He et al., 2012. (c) Single-molecule FISH analysis of miR-138 (red) together with GFAP antibody stain (green) to label glia cells. Hoechst was used to counterstain nuclei. Arrow points to miR-138/MAP2 positive, GFAP-negative neuron adjacent to glial cell. Scale bar =20 µm. (d) Single-molecule FISH analysis of Rims3 mRNA (green) together with Camk2a (gray; left) or Gad2 (gray; right) mRNA to label glutamatergic and GABAergic neurons, respectively. Scale bar =20 µm. (e) qPCR analysis of Rims3 mRNA in total hippocampal RNA obtained from 138-floxed or 138-spongeub mice. U6 snRNA was used for normalization. n=3 mice; *p=0.04 (Student’s two-tailed heteroscedastic t-test). (f) Relative luciferase activity in rat cortical neurons (DIV9-12) transfected with Rims3 3′UTR constructs with (138mut) or without (wt) a mutation in the miR-138 binding site, together with miR-138 or negative control mimics. Negative control mimic =1. n=3 independent transfections, *p=0.002, n.s. p=0.23 (Student’s two-tailed heteroscedastic t-test). (g) Representative picture of primary rat hippocampal neurons infected with Dlx5/6-mCherry-138 sponge (red) and stained for GAD65/67 (gray) and Hoechst (blue). Scale bar =10 μm. smFISH, single-molecule fluorescence in situ hybridization.
Figure 3—figure supplement 1. Validation of miR-138 target genes in rat hippocampal interneurons. (a) Quantification of miR138-5p smFISH in Camk2a- and Erbb4-positive neurons. Camk2a-positive n =10 cells; ErbB4-positive n=7 cells, p=0.48 (Student’s two-tailed heteroscedastic t-test). (b) Quantification of miR138-5p levels in mouse brain tissue based on small RNA-seq data from He et al., 2012. (c) Single-molecule FISH analysis of miR-138 (red) together with GFAP antibody stain (green) to label glia cells. Hoechst was used to counterstain nuclei. Arrow points to miR-138/MAP2 positive, GFAP-negative neuron adjacent to glial cell. Scale bar =20 µm. (d) Single-molecule FISH analysis of Rims3 mRNA (green) together with Camk2a (gray; left) or Gad2 (gray; right) mRNA to label glutamatergic and GABAergic neurons, respectively. Scale bar =20 µm. (e) qPCR analysis of Rims3 mRNA in total hippocampal RNA obtained from 138-floxed or 138-spongeub mice. U6 snRNA was used for normalization. n=3 mice; *p=0.04 (Student’s two-tailed heteroscedastic t-test). (f) Relative luciferase activity in rat cortical neurons (DIV9-12) transfected with Rims3 3′UTR constructs with (138mut) or without (wt) a mutation in the miR-138 binding site, together with miR-138 or negative control mimics. Negative control mimic =1. n=3 independent transfections, *p=0.002, n.s. p=0.23 (Student’s two-tailed heteroscedastic t-test). (g) Representative picture of primary rat hippocampal neurons infected with Dlx5/6-mCherry-138 sponge (red) and stained for GAD65/67 (gray) and Hoechst (blue). Scale bar =10 μm. smFISH, single-molecule fluorescence in situ hybridization.CC BY · PubMed Central
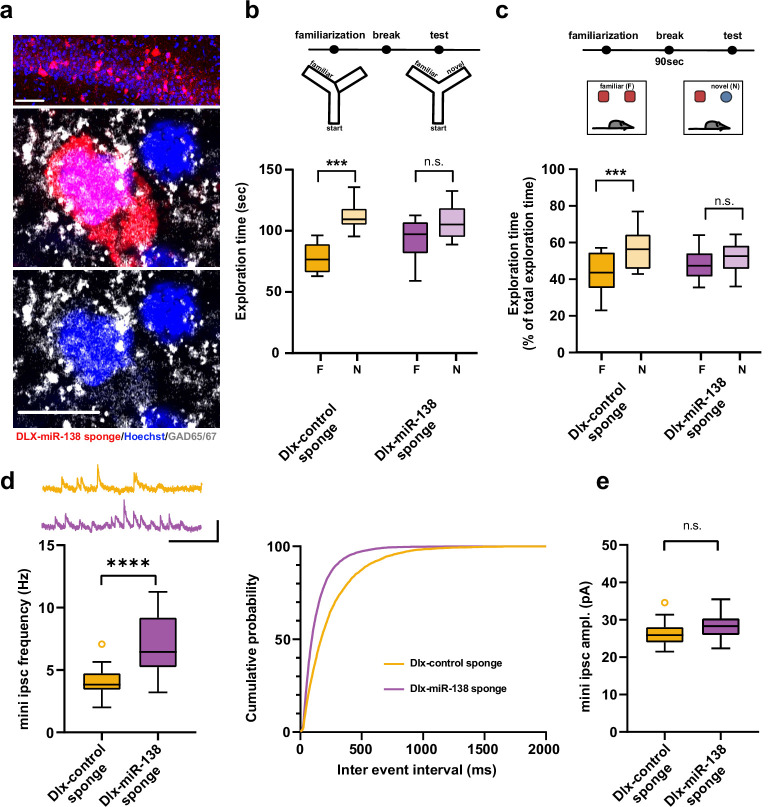
Figure 4. Impaired short-term memory and inhibitory synaptic transmission upon miR-138 inhibition in hippocampal interneurons. (a) Representative pictures of hippocampal interneurons in vivo infected with rAAV-Dlx-138-sponge. Upper panel: infected interneurons in hippocampal area CA1. Scale bar =50 μm. Middle and lower panels: neurons in hippocampal area CA1 at higher magnification. Left neuron: infected with rAAV-Dlx-138-sponge, expressing GAD65/67; right neuron: not infected, no GAD65/67 expression. Scale bar =10 μm. red: mCherry; gray: GAD65/67, blue: Hoechst nuclei. (b) Upper panel: schematic representation of the Y-maze novelty preference task; lower panel: exploration time spent in familiar (F) and novel (N) arm; Dlx-control sponge n=8 mice; Dlx-miR-138 sponge n=9 mice; ****p=0.00005; n.s.=0.079 (Student’s two-tailed heteroscedastic t-test). (c) Upper panel: schematic representation of the novel object recognition task; lower panel: exploration time presented as percentage of total time spent with either novel or familiar object; Dlx-control sponge n=9 mice; Dlx-miR-138 sponge n=10 mice; *p=0.03; n.s.=0.33 (Student’s two-tailed heteroscedastic t-test). (d) mIPSC frequency in CA1 pyramidal neurons. Upper panel left: example traces, Dlx-control sponge in orange, Dlx-miR-138 sponge in purple, scale bar: 50 pA, 200 ms. Lower panel left: mIPSC frequency (Dlx-control sponge: range, from 2.0 to 7.1 Hz; median, 3.8 Hz; IQR, 1.3 Hz. Dlx-miR-138 sponge: range, from 3.2 to 11.3 Hz; median, 6.4 Hz; IQR, 4.0 Hz; ****p<0.0001, Student’s two-tailed heteroscedastic t-test). Right panel: Cumulative distribution mIPSC frequency (p<0.0001; Kolmogorov-Smirnov test). (e) mIPSC amplitude in CA1 pyramidal neurons (Dlx-control sponge: range, from 21.5 to 34.6 pA; median, 25.9 pA; IQR, 4.0 pA. Dlx-miR-138 sponge: range, from 22.3 to 35.5 pA; median, 28.3 pA; IQR, 4.4 pA; n.s. p=0.13 Student’s two-tailed heteroscedastic t-test). Dlx-control sponge n=19 cells/2 mice; Dlx-miR-138 sponge n=19 cells/2 mice. IQR, interquartile range; mIPSC, miniature inhibitory postsynaptic current.
Figure 4. Impaired short-term memory and inhibitory synaptic transmission upon miR-138 inhibition in hippocampal interneurons. (a) Representative pictures of hippocampal interneurons in vivo infected with rAAV-Dlx-138-sponge. Upper panel: infected interneurons in hippocampal area CA1. Scale bar =50 μm. Middle and lower panels: neurons in hippocampal area CA1 at higher magnification. Left neuron: infected with rAAV-Dlx-138-sponge, expressing GAD65/67; right neuron: not infected, no GAD65/67 expression. Scale bar =10 μm. red: mCherry; gray: GAD65/67, blue: Hoechst nuclei. (b) Upper panel: schematic representation of the Y-maze novelty preference task; lower panel: exploration time spent in familiar (F) and novel (N) arm; Dlx-control sponge n=8 mice; Dlx-miR-138 sponge n=9 mice; ****p=0.00005; n.s.=0.079 (Student’s two-tailed heteroscedastic t-test). (c) Upper panel: schematic representation of the novel object recognition task; lower panel: exploration time presented as percentage of total time spent with either novel or familiar object; Dlx-control sponge n=9 mice; Dlx-miR-138 sponge n=10 mice; *p=0.03; n.s.=0.33 (Student’s two-tailed heteroscedastic t-test). (d) mIPSC frequency in CA1 pyramidal neurons. Upper panel left: example traces, Dlx-control sponge in orange, Dlx-miR-138 sponge in purple, scale bar: 50 pA, 200 ms. Lower panel left: mIPSC frequency (Dlx-control sponge: range, from 2.0 to 7.1 Hz; median, 3.8 Hz; IQR, 1.3 Hz. Dlx-miR-138 sponge: range, from 3.2 to 11.3 Hz; median, 6.4 Hz; IQR, 4.0 Hz; ****p<0.0001, Student’s two-tailed heteroscedastic t-test). Right panel: Cumulative distribution mIPSC frequency (p<0.0001; Kolmogorov-Smirnov test). (e) mIPSC amplitude in CA1 pyramidal neurons (Dlx-control sponge: range, from 21.5 to 34.6 pA; median, 25.9 pA; IQR, 4.0 pA. Dlx-miR-138 sponge: range, from 22.3 to 35.5 pA; median, 28.3 pA; IQR, 4.4 pA; n.s. p=0.13 Student’s two-tailed heteroscedastic t-test). Dlx-control sponge n=19 cells/2 mice; Dlx-miR-138 sponge n=19 cells/2 mice. IQR, interquartile range; mIPSC, miniature inhibitory postsynaptic current.CC BY · PubMed Central
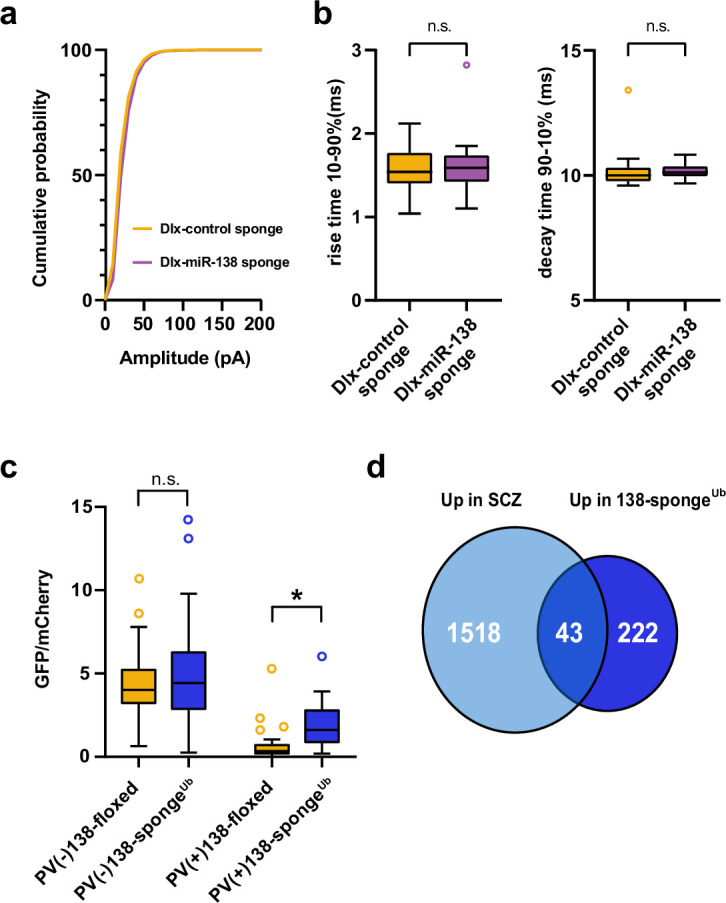
Figure 4—figure supplement 1. Inhibitory synaptic transmission upon miR-138 inhibition in hippocampal interneurons and validation of miR-138 sponge activity in PV-expressing hippocampal interneurons. (a) Cumulative distribution of mIPSC amplitude (p<0.0001; Kolmogorov-Smirnov test). (b) mIPSC rise (10%–90%) and decay (90%–10%) time. Left panel: mIPSC rise (10%–90%) time (Dlx control sponge: range, from 1.0 to 2.1 ms; median, 1.5 ms; IQR, 0.4 ms. Dlx miR-138 sponge: range, from 1.1 to 2.8 ms; median, 1.6 ms; IQR, 0.3 ms; n.s. p=0.76 Mann-Whitney test). Right panel: mIPSC decay (90%–10%) time (Dlx control sponge: range, from 9.6 to 13.4 ms; median, 10.0 ms; IQR, 0.6 ms. Dlx miR-138 sponge: range, from 9.7 to 10.8 ms; median, 10.1 ms; IQR, 0.4 ms; n.s. p=0.3 Mann-Whitney test). Dlx control sponge n=19 cells/2 mice; Dlx miR-138 sponge n=19 cells/2 mice. (c) Bar graphs of GFP/mCherry ratios from PV+ or PV− CA1 hippocampal neurons in 138-floxed or 138-spongeUb mice infected with a 138-pbds sensor construct; 138-floxed/PV+: n=32 (two mice); 138-floxed/PV−: n=40 (two mice); 138-sponge/PV+: n=32 (three mice); 138-sponge/PV−: n=42 (three mice); n.s. p=0.113; *p=3.6×10⁻⁶ (Kolmogorov-Smirnov-Test). (d) Venn diagram describing the overlap between transcripts upregulated in SCZ patients (Gandal et al., 2018) and miR-138 sponge mice (Figure 2a). Fold enrichment =1.43; p=0.00859 (Fisher test). IQR, interquartile range; mIPSC, miniature inhibitory postsynaptic current; SCZ, schizophrenia.
Figure 4—figure supplement 1. Inhibitory synaptic transmission upon miR-138 inhibition in hippocampal interneurons and validation of miR-138 sponge activity in PV-expressing hippocampal interneurons. (a) Cumulative distribution of mIPSC amplitude (p<0.0001; Kolmogorov-Smirnov test). (b) mIPSC rise (10%–90%) and decay (90%–10%) time. Left panel: mIPSC rise (10%–90%) time (Dlx control sponge: range, from 1.0 to 2.1 ms; median, 1.5 ms; IQR, 0.4 ms. Dlx miR-138 sponge: range, from 1.1 to 2.8 ms; median, 1.6 ms; IQR, 0.3 ms; n.s. p=0.76 Mann-Whitney test). Right panel: mIPSC decay (90%–10%) time (Dlx control sponge: range, from 9.6 to 13.4 ms; median, 10.0 ms; IQR, 0.6 ms. Dlx miR-138 sponge: range, from 9.7 to 10.8 ms; median, 10.1 ms; IQR, 0.4 ms; n.s. p=0.3 Mann-Whitney test). Dlx control sponge n=19 cells/2 mice; Dlx miR-138 sponge n=19 cells/2 mice. (c) Bar graphs of GFP/mCherry ratios from PV+ or PV− CA1 hippocampal neurons in 138-floxed or 138-spongeUb mice infected with a 138-pbds sensor construct; 138-floxed/PV+: n=32 (two mice); 138-floxed/PV−: n=40 (two mice); 138-sponge/PV+: n=32 (three mice); 138-sponge/PV−: n=42 (three mice); n.s. p=0.113; *p=3.6×10⁻⁶ (Kolmogorov-Smirnov-Test). (d) Venn diagram describing the overlap between transcripts upregulated in SCZ patients (Gandal et al., 2018) and miR-138 sponge mice (Figure 2a). Fold enrichment =1.43; p=0.00859 (Fisher test). IQR, interquartile range; mIPSC, miniature inhibitory postsynaptic current; SCZ, schizophrenia.CC BY · PubMed Central
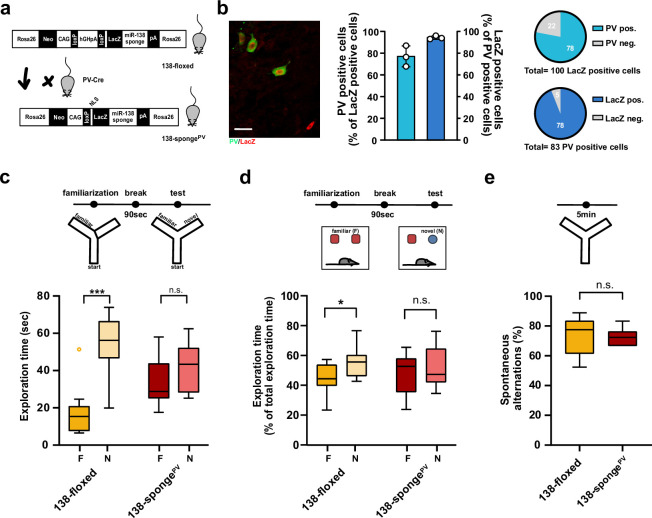
Figure 5. Impaired short-term memory in PV-expressing interneuron specific miR-138 sponge mice. (a) Schematic overview of the strategy for generating miR-138 spongePV mice. (b) Beta-gal expression is largely restricted to PV expressing interneuron. Left panel: representative picture from a CA1 region of a 138-spongePV hippocampal slice co-stained for the lacZ product beta-galactosidase (red) and PV (green). Scale bar =20 μm. Right panel: quantification of PV+/lacZ+ cells in 138-spongePV mice. n=3 mice. (c) Behavioral characterization of 138-spongePV mouse line, upper: schematic representation of the Y-maze novelty preference task; lower: exploration time spent in familiar (F) and novel (N) arm; 138-floxed n=10 mice; 138-spongePV n=10 mice; ***p=0.0002; n.s. p=0.19 (Mann-Whitney test). (d) Upper: schematic representation of the novel object recognition task; Lower: exploration time presented as percentage of total time spent with either novel or familiar object; 138-floxed n=10 mice; miR-138 sponge n=10 mice; *p=0.035, n.s. p=0.57 (Student’s two-tailed heteroscedastic t-test). (e) Percentage of spontaneous alternations in the Y-Maze. 138-floxed n=10; 138-spongePV n=10; n.s. p=0.90 (Student’s two-tailed heteroscedastic t-test). PV, parvalbumin.
Figure 5. Impaired short-term memory in PV-expressing interneuron specific miR-138 sponge mice. (a) Schematic overview of the strategy for generating miR-138 spongePV mice. (b) Beta-gal expression is largely restricted to PV expressing interneuron. Left panel: representative picture from a CA1 region of a 138-spongePV hippocampal slice co-stained for the lacZ product beta-galactosidase (red) and PV (green). Scale bar =20 μm. Right panel: quantification of PV+/lacZ+ cells in 138-spongePV mice. n=3 mice. (c) Behavioral characterization of 138-spongePV mouse line, upper: schematic representation of the Y-maze novelty preference task; lower: exploration time spent in familiar (F) and novel (N) arm; 138-floxed n=10 mice; 138-spongePV n=10 mice; ***p=0.0002; n.s. p=0.19 (Mann-Whitney test). (d) Upper: schematic representation of the novel object recognition task; Lower: exploration time presented as percentage of total time spent with either novel or familiar object; 138-floxed n=10 mice; miR-138 sponge n=10 mice; *p=0.035, n.s. p=0.57 (Student’s two-tailed heteroscedastic t-test). (e) Percentage of spontaneous alternations in the Y-Maze. 138-floxed n=10; 138-spongePV n=10; n.s. p=0.90 (Student’s two-tailed heteroscedastic t-test). PV, parvalbumin.CC BY · PubMed Central
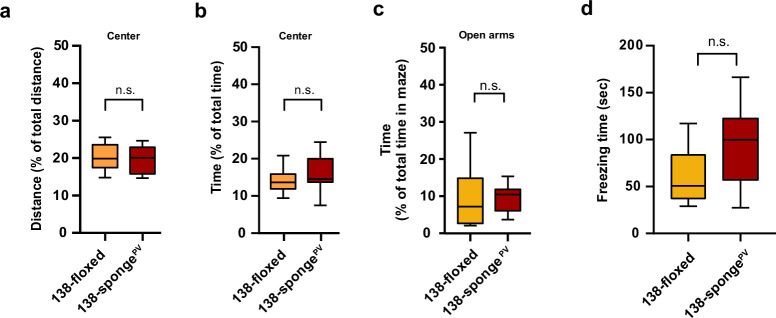
Figure 5—figure supplement 1. Behavioural characterization of PV-expressing interneuron specific miR-138 sponge mice. (a, b) Percentage of total distance travelled (a)/time spent (b) in the center of an open field arena during 30 min exploration by mice of the indicated genotypes; 138-floxed n=10 mice; 138-spongePV n=10 mice; (a) p=0.74 (b) p=0.28 (Student’s two-tailed heteroscedastic t-test). (c) Percentage of total time spent in the open arms of an elevated plus maze (EPM) during 5 min exploration by mice of the indicated genotypes; 138-floxed n=10 mice; 138-spongePV n=10 mice; p=0.53 (Mann-Whitney test). (d) Time (s) mice spent freezing 24 hr after the foot shock was administrated; 138-floxed n=9 mice; 138-spongePV n=9 mice; p=0.075 (Student’s two-tailed heteroscedastic t-test).
Figure 5—figure supplement 1. Behavioural characterization of PV-expressing interneuron specific miR-138 sponge mice. (a, b) Percentage of total distance travelled (a)/time spent (b) in the center of an open field arena during 30 min exploration by mice of the indicated genotypes; 138-floxed n=10 mice; 138-spongePV n=10 mice; (a) p=0.74 (b) p=0.28 (Student’s two-tailed heteroscedastic t-test). (c) Percentage of total time spent in the open arms of an elevated plus maze (EPM) during 5 min exploration by mice of the indicated genotypes; 138-floxed n=10 mice; 138-spongePV n=10 mice; p=0.53 (Mann-Whitney test). (d) Time (s) mice spent freezing 24 hr after the foot shock was administrated; 138-floxed n=9 mice; 138-spongePV n=9 mice; p=0.075 (Student’s two-tailed heteroscedastic t-test).CC BY · PubMed Central
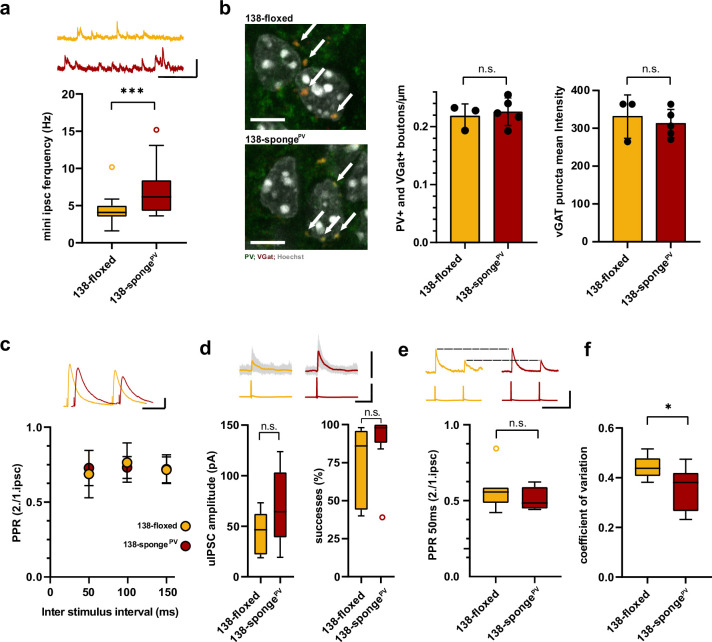
Figure 6. Enhanced inhibitory synaptic transmission onto hippcampal pyramidal neurons in PV-expressing interneuron specific miR-138 sponge mice. (a) mIPSC frequency in CA1 pyramidal neurons. Upper panel: example traces, 138-floxed in orange, 138-songePV in red, scale bar: 50 pA, 200 ms. Lower panel: mIPSC frequency (138-floxed: range, from 1.6 to 10.2 Hz; median, 4.1 Hz; IQR, 1.5 Hz. 138-spongePV: range, from 3.6 to 15.2 Hz; median, 6.2 Hz; IQR, 4.2 Hz; ***p=0.0002, Mann-Whitney test). 138-floxed n=22 cells/5 mice; 138-spongePV n=23 cells/5 mice. (b) PV+, VGAT+ bouton density. Left panel: representative pictures (arrows point the PV+; VGAT+ boutons). Middle panel: number of boutons per CA1 pyramidal neuron cell perimeter based on Hoechst counterstain. Right panel: VGAT puncta mean intensity; 138-floxed: n=73 cells/3 mice; 138-spongePV: n=95 cells/5 mice; data represents the average per mouse±s.d; n.s., p=0.65 (bouton density), n.s., p=0.59 (mean intensity) (Student’s two-tailed heteroscedastic t-test); (c) Paired pulse ratio (PPR) of stimulated IPSCs in CA1 pyramidal neurons. Upper panel: example traces of PPR (inter stimulus interval of 100 ms) for 138-floxed (orange) and 138-spongeub (red); scale bar: 100 pA, 50 ms. Lower panel: PPRs for different interstimulus intervals ranging from 50 to 150 ms (138-floxed vs. 138-spongePV [mean ±s.d.]: 50 ms, 0.7 ±0.2 vs. 0.7±0.1 [n=13]; 100 ms: 0.8±0.1 vs. 0.7±0.1 [n=13]; 150 ms: 0.7±0.1 [n=12] vs. 0.7±0.1. n.s. p=0.45, p=0.69, and p=0.89 for 50, 100, and 150 ms, respectively. Mann-Whitney test). (d) Unitary connections between presynaptic fast-spiking interneurons and postsynaptic CA1 pyramidal cells. Upper panel: example traces, 138-floxed: average of 50 sweeps in orange, 26 single sweeps in gray, 138-songePV: average of 50 sweeps in red, 26 single sweeps in gray; scale bar: 100 pA, 100 mV, 25 ms. Lower panel left: uIPSC amplitude (138-floxed: range, from 18.9 to 73.2 pA; median, 46.6 pA; IQR, 40.2 pA. 138-spongePV: range, from 19.3 to 123.8 pA; median, 64.5 pA; IQR, 64.4 pA; n.s. p=0.11 Student’s two-tailed heteroscedastic t-test). Lower panel right: Success rate (138-floxed: range, from 40% to 98%; median, 86%; IQR, 54%. 138-spongePV: range, from 38% to 100%; median, 98%; IQR, 12%; n.s. p=0.14 Mann-Whitney test). 138-floxed n=7 pairs/3 mice; 138-spongePV n=9 pairs/5 mice. (e) PPR of unitary connections. Upper panel: example traces, 138-floxed in orange, 138-songePV in red, uIPSCs are normalized to the first uIPSC, scale bar: 100 mV, 50 ms. Lower panel: PPR (2nd/1st uIPSC) (138-floxed: range, from 0.42 to 0.85; median, 0.56; IQR, 0.10. 138-spongePV: range, from 0.44 to 0.62; median, 0.49; IQR, 0.14; n.s. p=0.34 Student’s two-tailed heteroscedastic t-test). 138-floxed n=7 pairs/3 mice; 138-spongePV n=9 pairs/5 mice. (f) Coefficient of variation (138-floxed: range, from 0.38 to 0.52; median, 0.44; IQR, 0.07. 138-spongePV: range, from 0.23 to 0.47; median, 0.38; IQR, 0.15; *p=0.028, Student’s two-tailed heteroscedastic t-test). 138-floxed n=7 pairs/3 mice; 138-spongePV n=9 pairs/5 mice. IQR, interquartile range; mIPSC, miniature inhibitory postsynaptic current; uIPSC, unitary inhibitory postsynaptic current.
Figure 6. Enhanced inhibitory synaptic transmission onto hippcampal pyramidal neurons in PV-expressing interneuron specific miR-138 sponge mice. (a) mIPSC frequency in CA1 pyramidal neurons. Upper panel: example traces, 138-floxed in orange, 138-songePV in red, scale bar: 50 pA, 200 ms. Lower panel: mIPSC frequency (138-floxed: range, from 1.6 to 10.2 Hz; median, 4.1 Hz; IQR, 1.5 Hz. 138-spongePV: range, from 3.6 to 15.2 Hz; median, 6.2 Hz; IQR, 4.2 Hz; ***p=0.0002, Mann-Whitney test). 138-floxed n=22 cells/5 mice; 138-spongePV n=23 cells/5 mice. (b) PV+, VGAT+ bouton density. Left panel: representative pictures (arrows point the PV+; VGAT+ boutons). Middle panel: number of boutons per CA1 pyramidal neuron cell perimeter based on Hoechst counterstain. Right panel: VGAT puncta mean intensity; 138-floxed: n=73 cells/3 mice; 138-spongePV: n=95 cells/5 mice; data represents the average per mouse±s.d; n.s., p=0.65 (bouton density), n.s., p=0.59 (mean intensity) (Student’s two-tailed heteroscedastic t-test); (c) Paired pulse ratio (PPR) of stimulated IPSCs in CA1 pyramidal neurons. Upper panel: example traces of PPR (inter stimulus interval of 100 ms) for 138-floxed (orange) and 138-spongeub (red); scale bar: 100 pA, 50 ms. Lower panel: PPRs for different interstimulus intervals ranging from 50 to 150 ms (138-floxed vs. 138-spongePV [mean ±s.d.]: 50 ms, 0.7 ±0.2 vs. 0.7±0.1 [n=13]; 100 ms: 0.8±0.1 vs. 0.7±0.1 [n=13]; 150 ms: 0.7±0.1 [n=12] vs. 0.7±0.1. n.s. p=0.45, p=0.69, and p=0.89 for 50, 100, and 150 ms, respectively. Mann-Whitney test). (d) Unitary connections between presynaptic fast-spiking interneurons and postsynaptic CA1 pyramidal cells. Upper panel: example traces, 138-floxed: average of 50 sweeps in orange, 26 single sweeps in gray, 138-songePV: average of 50 sweeps in red, 26 single sweeps in gray; scale bar: 100 pA, 100 mV, 25 ms. Lower panel left: uIPSC amplitude (138-floxed: range, from 18.9 to 73.2 pA; median, 46.6 pA; IQR, 40.2 pA. 138-spongePV: range, from 19.3 to 123.8 pA; median, 64.5 pA; IQR, 64.4 pA; n.s. p=0.11 Student’s two-tailed heteroscedastic t-test). Lower panel right: Success rate (138-floxed: range, from 40% to 98%; median, 86%; IQR, 54%. 138-spongePV: range, from 38% to 100%; median, 98%; IQR, 12%; n.s. p=0.14 Mann-Whitney test). 138-floxed n=7 pairs/3 mice; 138-spongePV n=9 pairs/5 mice. (e) PPR of unitary connections. Upper panel: example traces, 138-floxed in orange, 138-songePV in red, uIPSCs are normalized to the first uIPSC, scale bar: 100 mV, 50 ms. Lower panel: PPR (2nd/1st uIPSC) (138-floxed: range, from 0.42 to 0.85; median, 0.56; IQR, 0.10. 138-spongePV: range, from 0.44 to 0.62; median, 0.49; IQR, 0.14; n.s. p=0.34 Student’s two-tailed heteroscedastic t-test). 138-floxed n=7 pairs/3 mice; 138-spongePV n=9 pairs/5 mice. (f) Coefficient of variation (138-floxed: range, from 0.38 to 0.52; median, 0.44; IQR, 0.07. 138-spongePV: range, from 0.23 to 0.47; median, 0.38; IQR, 0.15; *p=0.028, Student’s two-tailed heteroscedastic t-test). 138-floxed n=7 pairs/3 mice; 138-spongePV n=9 pairs/5 mice. IQR, interquartile range; mIPSC, miniature inhibitory postsynaptic current; uIPSC, unitary inhibitory postsynaptic current.CC BY · PubMed Central
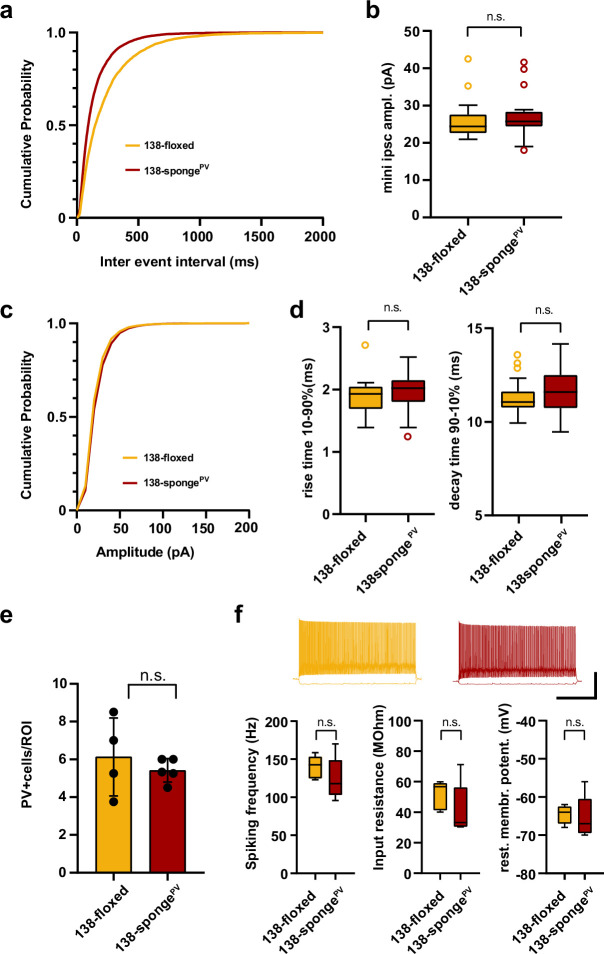
Figure 6—figure supplement 1. Electrophysiological characterization of hippocampal neurons in PV-expressing interneuron specific miR-138 sponge mice. (a–d) mIPSC in CA1 pyramidal neurons. (a) Cumulative distribution of mIPSCs frequency (p <0.0001; Kolmogorov-Smirnov [KS] test). (b) mIPSC amplitude (138-floxed: range, from 20.9 to 42.5 pA; median, 24.4 pA; IQR, 5.0 pA. 138-spongePV: range, from 18.0 to 41.6 pA; median, 25.7 pA; IQR, 4.0 pA; n.s. P = 0.22 Mann-Whitney test). (c) Cumulative distribution of mIPSCs amplitude (p<0.0001 KS test). 138-floxed n=22 cells/5 mice; 138-spongeub n=23 cells/5 mice. (d) mIPSC rise (10%–90%) and decay (90%–10%) time. Left panel: mIPSC rise (10%–90%) time (138-floxed: range, from 1.4 to 2.7 ms; median, 1.9 ms; IQR, 0.4 ms. 138-spongePV: range, from 1.3 to 2.5 ms; median, 2.0 ms; IQR, 0.4 ms; n.s. p=0.28 Mann-Whitney test). Right panel: mIPSC decay (90%–10%) time (138-floxed: range, from 9.9 to 13.6 ms; median, 11.1 ms; IQR, 0.9 ms. 138-spongePV: range, from 9.5 to 14.2 ms; median, 11.6 ms; IQR, 1.8 ms; n.s. p=0.20 Mann-Whitney test). 138-floxed n=22 cells/5 mice; 138-spongeub n=23 cells/5 mice. (e) Density of PV+ interneurons in CA1 hippocampus of mice with the indicated genotype. Values are expressed relative to a defined region of interest (ROI). 138-floxed: n=16 ROIs/4 mice; 138-spongePV: n=18 ROIs/5 mice; data represents the average per mouse±s.d.; n.s. p=0.8049 (Mann-Whitney test). (f) Properties of fast-spiking interneurons. Upper panel: example traces, 138-floxed in orange, 138-songePV in red, scale bar: 50 mV, 500 ms. Lower panel left: spiking frequency (138-floxed: range, from 123 to 159 Hz; median, 143 Hz; IQR, 29 Hz. 138-spongePV: range, from 96 to 170 Hz; median, 118 Hz; IQR, 46 Hz; n.s. p=0.31 Student’s two-tailed heteroscedastic t-test). Lower panel middle: input resistance (138-floxed: range, from 40 to 60 MΩ; median, 57 MΩ; IQR, 18 MΩ. 138-spongePV: range, from 30 to 71 MΩ; median, 33 MΩ; IQR, 26 MΩ; n.s. p=0.22 Mann-Whitney test). Lower panel right: resting membrane potential (138-floxed: range, from –68 to –62 mV; median, –64 mV; IQR, 4.5 mV. 138-spongePV: range, from –70 to –56 mV; median, –67 mV; IQR, 9 mV; n.s. p=0.78 Student’s two-tailed heteroscedastic t-test). 138-floxed n=5 cells/3 mice; 138-spongeub n=5 cells/5 mice. IQR, interquartile range; mIPSC, miniature inhibitory postsynaptic current.
Figure 6—figure supplement 1. Electrophysiological characterization of hippocampal neurons in PV-expressing interneuron specific miR-138 sponge mice. (a–d) mIPSC in CA1 pyramidal neurons. (a) Cumulative distribution of mIPSCs frequency (p <0.0001; Kolmogorov-Smirnov [KS] test). (b) mIPSC amplitude (138-floxed: range, from 20.9 to 42.5 pA; median, 24.4 pA; IQR, 5.0 pA. 138-spongePV: range, from 18.0 to 41.6 pA; median, 25.7 pA; IQR, 4.0 pA; n.s. P = 0.22 Mann-Whitney test). (c) Cumulative distribution of mIPSCs amplitude (p<0.0001 KS test). 138-floxed n=22 cells/5 mice; 138-spongeub n=23 cells/5 mice. (d) mIPSC rise (10%–90%) and decay (90%–10%) time. Left panel: mIPSC rise (10%–90%) time (138-floxed: range, from 1.4 to 2.7 ms; median, 1.9 ms; IQR, 0.4 ms. 138-spongePV: range, from 1.3 to 2.5 ms; median, 2.0 ms; IQR, 0.4 ms; n.s. p=0.28 Mann-Whitney test). Right panel: mIPSC decay (90%–10%) time (138-floxed: range, from 9.9 to 13.6 ms; median, 11.1 ms; IQR, 0.9 ms. 138-spongePV: range, from 9.5 to 14.2 ms; median, 11.6 ms; IQR, 1.8 ms; n.s. p=0.20 Mann-Whitney test). 138-floxed n=22 cells/5 mice; 138-spongeub n=23 cells/5 mice. (e) Density of PV+ interneurons in CA1 hippocampus of mice with the indicated genotype. Values are expressed relative to a defined region of interest (ROI). 138-floxed: n=16 ROIs/4 mice; 138-spongePV: n=18 ROIs/5 mice; data represents the average per mouse±s.d.; n.s. p=0.8049 (Mann-Whitney test). (f) Properties of fast-spiking interneurons. Upper panel: example traces, 138-floxed in orange, 138-songePV in red, scale bar: 50 mV, 500 ms. Lower panel left: spiking frequency (138-floxed: range, from 123 to 159 Hz; median, 143 Hz; IQR, 29 Hz. 138-spongePV: range, from 96 to 170 Hz; median, 118 Hz; IQR, 46 Hz; n.s. p=0.31 Student’s two-tailed heteroscedastic t-test). Lower panel middle: input resistance (138-floxed: range, from 40 to 60 MΩ; median, 57 MΩ; IQR, 18 MΩ. 138-spongePV: range, from 30 to 71 MΩ; median, 33 MΩ; IQR, 26 MΩ; n.s. p=0.22 Mann-Whitney test). Lower panel right: resting membrane potential (138-floxed: range, from –68 to –62 mV; median, –64 mV; IQR, 4.5 mV. 138-spongePV: range, from –70 to –56 mV; median, –67 mV; IQR, 9 mV; n.s. p=0.78 Student’s two-tailed heteroscedastic t-test). 138-floxed n=5 cells/3 mice; 138-spongeub n=5 cells/5 mice. IQR, interquartile range; mIPSC, miniature inhibitory postsynaptic current.CC BY · PubMed Central

Verification

Claims the paper makes

The claims and statistics of this paper haven’t been checked yet.

Run the check — free, no account needed. It reads the open-access text and checks the sources it cites.

A few free checks a day · papers already verified open instantly · results are public

Claims other papers make about this one

Each is checked against this paper’s own text: does it say what the citing paper says it does?

Self-check

Percentages, sums and reported differences re-computed from the paper’s own numbers.

The self-check needs the paper’s full text.

Citations

Cites

Show all 9 references

Research works printed but not linked: 46

  1. Agarwal, 2015, Predicting effective microRNA target sites in mammalian mRNAs, eLife, 4, 10.7554/eLife.05005 · DOI · Paper page
  2. Bartel, 2018, Metazoan MicroRNAs, Cell, 173, 20, 10.1016/j.cell.2018.03.006 · DOI · Paper page
  3. Beveridge, 2010, Schizophrenia is associated with an increase in cortical microRNA biogenesis, Molecular Psychiatry, 15, 1176, 10.1038/mp.2009.84 · DOI
  4. Boscher, 2020, MicroRNA-138 Overexpression Alters Abeta42 Levels and Behavior in Wildtype Mice, Frontiers in Neuroscience, 14, 10.3389/fnins.2020.591138 · DOI
  5. Cheng, 2018, Partial loss of psychiatric risk gene Mir137 in mice causes repetitive behavior and impairs sociability and learning via increased Pde10a, Nature Neuroscience, 21, 1689, 10.1038/s41593-018-0261-7 · DOI
  6. Christensen, 2010, Recombinant Adeno-Associated Virus-Mediated microRNA Delivery into the Postnatal Mouse Brain Reveals a Role for miR-134 in Dendritogenesis in Vivo, Frontiers in Neural Circuits, 3, 10.3389/neuro.04.016.2009 · DOI
  7. Crowell, 2020, muscat detects subpopulation-specific state transitions from multi-sample multi-condition single-cell transcriptomics data, Nature Communications, 11, 10.1038/s41467-020-19894-4 · DOI · Paper page
  8. Del Pino, 2018, Neural circuit dysfunction in mouse models of neurodevelopmental disorders, Current Opinion in Neurobiology, 48, 174, 10.1016/j.conb.2017.12.013 · DOI
  9. Ebert, 2010, MicroRNA sponges: progress and possibilities, RNA (New York, N.Y.), 16, 2043, 10.1261/rna.2414110 · DOI · Paper page
  10. Fuchs, 2007, Recruitment of parvalbumin-positive interneurons determines hippocampal function and associated behavior, Neuron, 53, 591, 10.1016/j.neuron.2007.01.031 · DOI · Paper page
  11. Giusti, 2014, MicroRNA-9 controls dendritic development by targeting REST, eLife, 3, 10.7554/eLife.02755 · DOI · Paper page
  12. Hájos, 2004, Spike timing of distinct types of GABAergic interneuron during hippocampal gamma oscillations in vitro, The Journal of Neuroscience, 24, 9127, 10.1523/JNEUROSCI.2113-04.2004 · DOI
  13. Konopka, 2010, MicroRNA loss enhances learning and memory in mice, The Journal of Neuroscience, 30, 14835, 10.1523/JNEUROSCI.3030-10.2010 · DOI · Paper page
  14. Korotkevich, 2021, Fast Gene Set Enrichment Analysis, 10.1101/060012 · DOI
  15. Kumar, 2010, A de novo 1p34.2 microdeletion identifies the synaptic vesicle gene RIMS3 as a novel candidate for autism, Journal of Medical Genetics, 47, 81, 10.1136/jmg.2008.065821 · DOI
  16. Lackinger, 2019, A placental mammal-specific microRNA cluster acts as a natural brake for sociability in mice, EMBO Reports, 20, 10.15252/embr.201846429 · DOI
  17. Leger, 2013, Object recognition test in mice, Nature Protocols, 8, 2531, 10.1038/nprot.2013.155 · DOI · Paper page
  18. Lovett-Barron, 2014, Dendritic inhibition in the hippocampus supports fear learning, Science (New York, N.Y.), 343, 857, 10.1126/science.1247485 · DOI · Paper page
  19. Markram, 2004, Interneurons of the neocortical inhibitory system, Nature Reviews. Neuroscience, 5, 793, 10.1038/nrn1519 · DOI · Paper page
  20. McNeill, 2012, MicroRNAs shape the neuronal landscape, Neuron, 75, 363, 10.1016/j.neuron.2012.07.005 · DOI · Paper page
  21. Moreau, 2011, Altered microRNA expression profiles in postmortem brain samples from individuals with schizophrenia and bipolar disorder, Biological Psychiatry, 69, 188, 10.1016/j.biopsych.2010.09.039 · DOI · Paper page
  22. Murray, 2011, Parvalbumin-positive CA1 interneurons are required for spatial working but not for reference memory, Nature Neuroscience, 14, 297, 10.1038/nn.2751 · DOI
  23. Nicodemus, 2006, Further evidence for association between ErbB4 and schizophrenia and influence on cognitive intermediate phenotypes in healthy controls, Molecular Psychiatry, 11, 1062, 10.1038/sj.mp.4001878 · DOI
  24. Pouille, 2001, Enforcement of temporal fidelity in pyramidal cells by somatic feed-forward inhibition, Science (New York, N.Y.), 293, 1159, 10.1126/science.1060342 · DOI · Paper page
  25. Qiu, 2020, microRNA Deficiency in VIP+ Interneurons Leads to Cortical Circuit Dysfunction, Cerebral Cortex (New York, N.Y, 30, 2229, 10.1093/cercor/bhz236 · DOI
  26. Que, 2021, Transcriptional and morphological profiling of parvalbumin interneuron subpopulations in the mouse hippocampus, Nature Communications, 12, 10.1038/s41467-020-20328-4 · DOI
  27. Rico, 2011, Neuregulin signaling, cortical circuitry development and schizophrenia, Current Opinion in Genetics & Development, 21, 262, 10.1016/j.gde.2010.12.010 · DOI
  28. Robinson, 2010, A scaling normalization method for differential expression analysis of RNA-seq data, Genome Biology, 11, 10.1186/gb-2010-11-3-r25 · DOI · Paper page
  29. Schratt, 2009, microRNAs at the synapse, Nature Reviews. Neuroscience, 10, 842, 10.1038/nrn2763 · DOI · Paper page
  30. Schröder, 2014, MicroRNA-138 is a potential regulator of memory performance in humans, Frontiers in Human Neuroscience, 8, 10.3389/fnhum.2014.00501 · DOI
  31. Siegel, 2009, A functional screen implicates microRNA-138-dependent regulation of the depalmitoylation enzyme APT1 in dendritic spine morphogenesis, Nature Cell Biology, 11, 705, 10.1038/ncb1876 · DOI · Paper page
  32. Siegert, 2015, The schizophrenia risk gene product miR-137 alters presynaptic plasticity, Nature Neuroscience, 18, 1008, 10.1038/nn.4023 · DOI · Paper page
  33. Sohal, 2019, Excitation-inhibition balance as a framework for investigating mechanisms in neuropsychiatric disorders, Molecular Psychiatry, 24, 1248, 10.1038/s41380-019-0426-0 · DOI · Paper page
  34. Takada, 2015, Rab3 interacting molecule 3 mutations associated with autism alter regulation of voltage-dependent Ca(2)(+) channels, Cell Calcium, 58, 296, 10.1016/j.ceca.2015.06.007 · DOI
  35. Tan, 2013, MicroRNA-128 governs neuronal excitability and motor behavior in mice, Science (New York, N.Y.), 342, 1254, 10.1126/science.1244193 · DOI · Paper page
  36. Tatro, 2013, Short-term recognition memory correlates with regional CNS expression of microRNA-138 in mice, The American Journal of Geriatric Psychiatry, 21, 461, 10.1016/j.jagp.2012.09.005 · DOI
  37. Tian, 2017, Down-Regulation of Neuregulin1/ErbB4 Signaling in the Hippocampus Is Critical for Learning and Memory, Molecular Neurobiology, 54, 3976, 10.1007/s12035-016-9956-5 · DOI
  38. Tian, 2018, MiR-138/SIRT1 axis is implicated in impaired learning and memory abilities of cerebral ischemia/reperfusion injured rats, Experimental Cell Research, 367, 232, 10.1016/j.yexcr.2018.03.042 · DOI · Paper page
  39. Tuncdemir, 2015, miRNAs are Essential for the Survival and Maturation of Cortical Interneurons, Cerebral Cortex (New York, N.Y, 25, 1842, 10.1093/cercor/bht426 · DOI
  40. Valluy, 2015, A coding-independent function of an alternative Ube3a transcript during neuronal development, Nature Neuroscience, 18, 666, 10.1038/nn.3996 · DOI
  41. Walgrave, 2021, Restoring miR-132 expression rescues adult hippocampal neurogenesis and memory deficits in Alzheimer’s disease, Cell Stem Cell, 28, 1805, 10.1016/j.stem.2021.05.001 · DOI · Paper page
  42. Wang, 2018, Genetic recovery of ErbB4 in adulthood partially restores brain functions in null mice, PNAS, 115, 13105, 10.1073/pnas.1811287115 · DOI · Paper page
  43. Watanabe, 2014, A rare MIR138-2 gene variation is associated with schizophrenia in a Japanese population, Psychiatry Research, 215, 801, 10.1016/j.psychres.2013.12.029 · DOI
  44. Wen, 2010, Neuregulin 1 regulates pyramidal neuron activity via ErbB4 in parvalbumin-positive interneurons, PNAS, 107, 1211, 10.1073/pnas.0910302107 · DOI
  45. Winterer, 2019, Single-cell RNA-Seq characterization of anatomically identified OLM interneurons in different transgenic mouse lines, The European Journal of Neuroscience, 50, 3750, 10.1111/ejn.14549 · DOI
  46. Zerbi, 2019, Rapid Reconfiguration of the Functional Connectome after Chemogenetic Locus Coeruleus Activation, Neuron, 103, 702, 10.1016/j.neuron.2019.05.034 · DOI

Cited by

Sorted by citations

Metadata

Authors
Daswani, R., Gilardi, C., Soutschek, M., Nanda, P., Weiss, K., Bicker, S., Fiore, R., Dieterich, C., Germain, P.-L., Winterer, J., & Schratt, G.
Affiliations
  • Lab of Systems Neuroscience, Institute for Neuroscience, Department of Health Science and Technology, Swiss Federal Institute of Technology ETH
  • Institute for Physiological Chemistry, Biochemical-Pharmacological Center Marburg, Philipps-University of Marburg
  • Section of Bioinformatics and Systems Cardiology, Department of Internal Medicine III and Klaus Tschira Institute for Integrative Computational Cardiology, University of Heidelberg
Venue
eLife
Published
2022-03-15
Volume
11
ISSN
2050-084X
Cited by
38
References
9
Language
en
Funders
  • Deutsche Forschungsgemeinschaft (SCHR 1136/4-2)
  • Eidgenössische Technische Hochschule Zürich (24 18-2 (NeuroSno))

About these checks

Registry, retraction, Cites and statistics results are computed, not judged, with one exception: a printed reference that no index lists is read once by a model before it counts as a citation error. Claims are extracted by a model and kept only when their quote appears verbatim in the text; each cited source is then checked, with a model’s help, for whether it says what the claim relies on. Those verdicts can be wrong — read the claim’s quote and the cited source before relying on one.

Statistics and arithmetic are recomputed, not judged.

Confidence bands are shown only for fields calibrated on our annotated test set. None is calibrated yet, so no band is shown.

What counts as a claim ›How we measure confidence ›How we check this ›

Are you an author, or do you see a problem with this page? Request a review