

The DOI matches its Crossref record; 249 of the 249 references it cites were found in a registry or an index.
Electrophysiological correlates of the BOLD signal for EEG-informed fMRI
Open accessAbstract
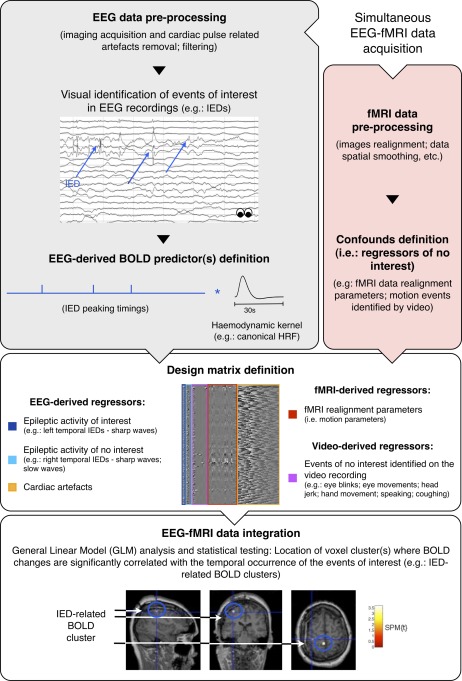
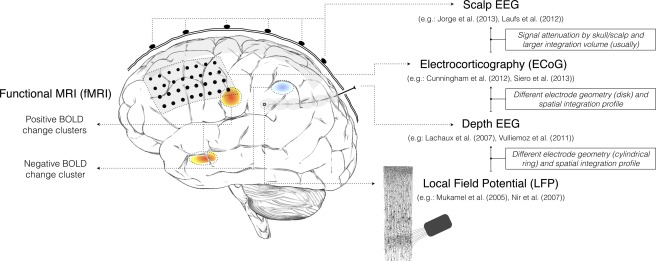
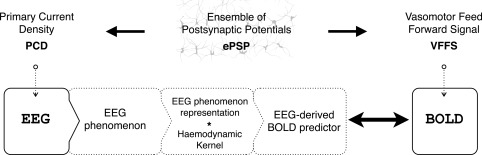
Electroencephalography (EEG) and functional magnetic resonance imaging (fMRI) are important tools in cognitive and clinical neuroscience. Combined EEG-fMRI has been shown to help to characterise brain networks involved in epileptic activity, as well as in different sensory, motor and cognitive functions. A good understanding of the electrophysiological correlates of the blood oxygen level-dependent (BOLD) signal is necessary to interpret fMRI maps, particularly when obtained in combination with EEG. We review the current understanding of electrophysiological-haemodynamic correlates, during different types of brain activity. We start by describing the basic mechanisms underlying EEG and BOLD signals and proceed by reviewing EEG-informed fMRI studies using fMRI to map specific EEG phenomena over the entire brain (EEG-fMRI mapping), or exploring a range of EEG-derived quantities to determine which best explain colocalised BOLD fluctuations (local EEG-fMRI coupling). While reviewing studies of different forms of brain activity (epileptic and nonepileptic spontaneous activity; cognitive, sensory and motor functions), a significant attention is given to epilepsy because the investigation of its haemodynamic correlates is the most common application of EEG-informed fMRI. Our review is focused on EEG-informed fMRI, an asymmetric approach of data integration. We give special attention to the invasiveness of electrophysiological measurements and the simultaneity of multimodal acquisitions because these methodological aspects determine the nature of the conclusions that can be drawn from EEG-informed fMRI studies. We emphasise the advantages of, and need for, simultaneous intracranial EEG-fMRI studies in humans, which recently became available and hold great potential to improve our understanding of the electrophysiological correlates of BOLD fluctuations.
Overview
The claims and statistics of this paper haven’t been checked yet.
Run the check — free, no account needed. It reads the open-access text and checks the sources it cites.
Integrity signals
Registry
Cites
Statistics
Figures
Verification
Claims the paper makes
The claims and statistics of this paper haven’t been checked yet.
Run the check — free, no account needed. It reads the open-access text and checks the sources it cites.
Claims other papers make about this one
Each is checked against this paper’s own text: does it say what the citing paper says it does?
The source backs part of the claim, not all of it — or backs it for a different population, condition or comparison.
In the citing paper
“In simultaneous EEG/fMRI studies, frontal theta activity is often inversely correlated with activity in DMN (Scheeringa et al. 2008;Murta et al. 2015), a brain network implicated in self-related thinking and mind wandering (Mason et al. 2007;Brewer et al. 2011).”
From Brain–Heart Interactions Underlying Traditional Tibetan Buddhist Meditation (2019) · cites this paper as Murta et al. 2015
Experimental — accuracy not yet measured
Self-check
Percentages, sums and reported differences re-computed from the paper’s own numbers.
The self-check needs the paper’s full text.
Citations
Cites
A default mode of brain function
Raichle, M. E., MacLeod, A. M., Snyder, A. Z., Powers, W. J., Gusnard, D. A., & Shulman, G. L. (2001) · Proceedings of the National Academy of Sciences · doi:10.1073/pnas.98.2.676 · Cited by 12,190
Event-related EEG/MEG synchronization and desynchronization: basic principles
Pfurtscheller, G., & Lopes da Silva, F. H. (1999) · Clinical Neurophysiology · doi:10.1016/s1388-2457(99)00141-8 · Cited by 7,328
Neuronal Oscillations in Cortical Networks
Buzsáki, G., & Draguhn, A. (2004) · Science · doi:10.1126/science.1099745 · Cited by 6,576
Neurophysiological investigation of the basis of the fMRI signal
Logothetis, N. K., Pauls, J., Augath, M., Trinath, T., & Oeltermann, A. (2001) · Nature · doi:10.1038/35084005 · Cited by 6,551
Brain magnetic resonance imaging with contrast dependent on blood oxygenation.
Ogawa, S., Lee, T. M., Kay, A. R., & Tank, D. W. (1990) · Proceedings of the National Academy of Sciences · doi:10.1073/pnas.87.24.9868 · Cited by 6,483
The origin of extracellular fields and currents — EEG, ECoG, LFP and spikes
Buzsáki, G., Anastassiou, C. A., & Koch, C. (2012) · Nature Reviews Neuroscience · doi:10.1038/nrn3241 · Cited by 4,225
Dynamic magnetic resonance imaging of human brain activity during primary sensory stimulation.
Kwong, K. K., Belliveau, J. W., Chesler, D. A., Goldberg, I. E., Weisskoff, R. M., Poncelet, B. P., Kennedy, D. N., Hoppel, B. E., Cohen, M. S., & Turner, R. (1992) · Proceedings of the National Academy of Sciences · doi:10.1073/pnas.89.12.5675 · Cited by 4,212
Interplay between Cortical Spreading Depolarization and Seizures
Kramer, D. R., Fujii, T., Ohiorhenuan, I. E., & Liu, C. Y. (2017) · Stereotactic and Functional Neurosurgery · doi:10.1159/000452841 · Cited by 3,721
Frequency Dependence of Signal Power and Spatial Reach of the Local Field Potential
Leski, S., Lindén, H., Tetzlaff, T., Pettersen, K. H., & Einevoll, G. T. (2013) · PubMed · doi:10.18154/rwth-conv-084442 · Cited by 3,667
What we can do and what we cannot do with fMRI
Logothetis, N. K. (2008) · Nature · doi:10.1038/nature06976 · Cited by 3,612
An Energy Budget for Signaling in the Grey Matter of the Brain
Attwell, D., & Laughlin, S. B. (2001) · Journal of Cerebral Blood Flow & Metabolism · doi:10.1097/00004647-200110000-00001 · Cited by 3,543
Dynamic predictions: Oscillations and synchrony in top–down processing
Engel, A. K., Fries, P., & Singer, W. (2001) · Nature Reviews Neuroscience · doi:10.1038/35094565 · Cited by 3,454
Electroencephalography—Basic principles, clinical applications and related fields
(1982) · Journal of the Autonomic Nervous System · doi:10.1016/0165-1838(82)90067-4 · Cited by 3,449
Neuronal ensemble control of prosthetic devices by a human with tetraplegia
Hochberg, L. R., Serruya, M. D., Friehs, G. M., Mukand, J. A., Saleh, M., Caplan, A. H., Branner, A., Chen, D., Penn, R. D., & Donoghue, J. P. (2006) · Nature · doi:10.1038/nature04970 · Cited by 3,295
Pascual-Marqui, R. D., Michel, C. M., & Lehmann, D. (1994) · International Journal of Psychophysiology · doi:10.1016/0167-8760(84)90014-x · Cited by 2,869
Probabilistic Independent Component Analysis for Functional Magnetic Resonance Imaging
Beckmann, C. F., & Smith, S. M. (2004) · IEEE Transactions on Medical Imaging · doi:10.1109/tmi.2003.822821 · Cited by 2,707
Electric Fields of the Brain: The Neurophysics of EEG
Nunez, P. L., & Harth, E. M. (1982) · Physics Today · doi:10.1063/1.2915137 · Cited by 2,257
Analysis of fMRI Time-Series Revisited—Again
Worsley, K. J., & Friston, K. J. (1995) · NeuroImage · doi:10.1006/nimg.1995.1023 · Cited by 2,198
Fox, P. T., & Raichle, M. E. (1986) · Proceedings of the National Academy of Sciences · doi:10.1073/pnas.83.4.1140 · Cited by 2,056
Electrophysiological signatures of resting state networks in the human brain
Mantini, D., Perrucci, M. G., Del Gratta, C., Romani, G. L., & Corbetta, M. (2007) · Proceedings of the National Academy of Sciences · doi:10.1073/pnas.0700668104 · Cited by 1,938
Electroencephalography: Basic Principles, Clinical Applications and Related Fields
Torres, F. (1983) · Archives of Neurology · doi:10.1001/archneur.1983.04050030085025 · Cited by 1,825
Nonoxidative Glucose Consumption During Focal Physiologic Neural Activity
Fox, P. T., Raichle, M. E., Mintun, M. A., & Dence, C. (1988) · Science · doi:10.1126/science.3260686 · Cited by 1,796
Michel, C., Murray, M. M., Lantz, G., Gonzalez, S., Spinelli, L., & de Peralta, R. G. (2004) · Clinical Neurophysiology · doi:10.1016/j.clinph.2004.06.001 · Cited by 1,771
Mitzdorf, U. (1985) · Physiological Reviews · doi:10.1152/physrev.1985.65.1.37 · Cited by 1,690
Dynamic Brain Sources of Visual Evoked Responses
Makeig, S., Westerfield, M., Jung, T.-P., Enghoff, S., Townsend, J., Courchesne, E., & Sejnowski, T. J. (2002) · Science · doi:10.1126/science.1066168 · Cited by 1,630
Raichle, M. E., & Mintun, M. A. (2006) · Annual Review of Neuroscience · doi:10.1146/annurev.neuro.29.051605.112819 · Cited by 1,630
Logothetis, N. K., & Wandell, B. A. (2004) · Annual Review of Physiology · doi:10.1146/annurev.physiol.66.082602.092845 · Cited by 1,568
Electric Fields of the Brain: The Neurophysics of EEG
Fermaglich, J. (1982) · JAMA · doi:10.1001/jama.1982.03320380071046 · Cited by 1,557
Brain magnetic resonance imaging with contrast-dependent oxygenation
Ogawa, S. (1990) · Medical Entomology and Zoology · Cited by 1,367
A Method for Removing Imaging Artifact from Continuous EEG Recorded during Functional MRI
Allen, P. J., Josephs, O., & Turner, R. (2000) · NeuroImage · doi:10.1006/nimg.2000.0599 · Cited by 1,301
The Variability of Human, BOLD Hemodynamic Responses
Aguirre, G. K., Zarahn, E., & D’Esposito, M. (1998) · NeuroImage · doi:10.1006/nimg.1998.0369 · Cited by 1,251
fMRI resting state networks define distinct modes of long-distance interactions in the human brain
De Luca, M., Beckmann, C. F., De Stefano, N., Matthews, P. M., & Smith, S. M. (2006) · NeuroImage · doi:10.1016/j.neuroimage.2005.08.035 · Cited by 1,241
Glial regulation of the cerebral microvasculature
Iadecola, C., & Nedergaard, M. (2007) · Nature Neuroscience · doi:10.1038/nn2003 · Cited by 1,153
Simultaneous EEG and fMRI of the alpha rhythm
Goldman, R. I., Stern, J. M., Engel, J., & Cohen, M. S. (2002) · Neuroreport · doi:10.1097/00001756-200212200-00022 · Cited by 1,131
Neural mechanisms underlying brain waves: from neural membranes to networks
Lopes da Silva, F. (1991) · Electroencephalography and Clinical Neurophysiology · doi:10.1016/0013-4694(91)90044-5 · Cited by 1,112
Debener, S., Ullsperger, M., Siegel, M., Fiehler, K., von Cramon, D. Y., & Engel, A. K. (2005) · Journal of Neuroscience · doi:10.1523/jneurosci.3286-05.2005 · Cited by 1,096
The Effects of Changes in Pa CO 2 Cerebral Blood Volume, Blood Flow, and Vascular Mean Transit Time
Grubb, R. L., Raichle, M. E., Eichling, J. O., & Ter‐Pogossian, M. M. (1974) · Stroke · doi:10.1161/01.str.5.5.630 · Cited by 1,044
Laufs, H., Krakow, K., Sterzer, P., Eger, E., Beyerle, A., Salek-Haddadi, A., & Kleinschmidt, A. (2003) · Proceedings of the National Academy of Sciences · doi:10.1073/pnas.1831638100 · Cited by 1,028
EEG-correlated fMRI of human alpha activity
Laufs, H., Kleinschmidt, A., Beyerle, A., Eger, E., Salek-Haddadi, A., Preibisch, C., & Krakow, K. (2003) · NeuroImage · doi:10.1016/s1053-8119(03)00286-6 · Cited by 1,025
The Underpinnings of the BOLD Functional Magnetic Resonance Imaging Signal
Logothetis, N. K. (2003) · Journal of Neuroscience · doi:10.1523/jneurosci.23-10-03963.2003 · Cited by 1,024
Coupling Between Neuronal Firing, Field Potentials, and fMRI in Human Auditory Cortex
Mukamel, R., Gelbard, H., Arieli, A., Hasson, U., Fried, I., & Malach, R. (2005) · Science · doi:10.1126/science.1110913 · Cited by 1,023
Handwerker, D. A., Ollinger, J. M., & D’Esposito, M. (2004) · NeuroImage · doi:10.1016/j.neuroimage.2003.11.029 · Cited by 993
The Temporal Structures and Functional Significance of Scale-free Brain Activity
He, B. J., Zempel, J. M., Snyder, A. Z., & Raichle, M. E. (2010) · Neuron · doi:10.1016/j.neuron.2010.04.020 · Cited by 990
Miezin, F. M., Maccotta, L., Ollinger, J. M., Petersen, S. E., & Buckner, R. L. (2000) · NeuroImage · doi:10.1006/nimg.2000.0568 · Cited by 961
The neural basis of functional brain imaging signals
Attwell, D., & Iadecola, C. (2002) · Trends in Neurosciences · doi:10.1016/s0166-2236(02)02264-6 · Cited by 957
Simultaneous EEG and fMRI of the alpha rhythm
Stern (2002) · Neuroreport · doi:10.1097/01.wnr.0000047685.08940.d0 · Cited by 945
Mazoyer, B., Zago, L., Mellet, E., Bricogne, S., Etard, O., Houdé, O., Crivello, F., Joliot, M., Petit, L., & Tzourio-Mazoyer, N. (2001) · Brain Research Bulletin · doi:10.1016/s0361-9230(00)00437-8 · Cited by 906
EEG and MEG: Relevance to Neuroscience
Lopes da Silva, F. (2013) · Neuron · doi:10.1016/j.neuron.2013.10.017 · Cited by 900
Shmuel, A., Augath, M., Oeltermann, A., & Logothetis, N. K. (2006) · Nature Neuroscience · doi:10.1038/nn1675 · Cited by 898
Scaling Brain Size, Keeping Timing: Evolutionary Preservation of Brain Rhythms
Buzsáki, G., Logothetis, N., & Singer, W. (2013) · Neuron · doi:10.1016/j.neuron.2013.10.002 · Cited by 886
Temporal structure in spatially organized neuronal ensembles: a role for interneuronal networks
Buzsáki, G., & Chrobak, J. J. (1995) · Current Opinion in Neurobiology · doi:10.1016/0959-4388(95)80012-3 · Cited by 878
Hasselmo, M. E., Bodelón, C., & Wyble, B. P. (2002) · Neural Computation · doi:10.1162/089976602317318965 · Cited by 875
Blume, W. T., Lüders, H. O., Mizrahi, E. M., Tassinari, C. A., Boas, W. V. E., & Engel, J. (2001) · Epilepsia · doi:10.1046/j.1528-1157.2001.22001.x · Cited by 865
Hemodynamic Signals Correlate Tightly with Synchronized Gamma Oscillations
Niessing, J., Ebisch, B., Schmidt, K. E., Niessing, M., Singer, W., & Galuske, R. A. W. (2005) · Science · doi:10.1126/science.1110948 · Cited by 806
Perivascular nerves and the regulation of cerebrovascular tone
Hamel, É. (2006) · Journal of Applied Physiology · doi:10.1152/japplphysiol.00954.2005 · Cited by 718
Engel, J. J. (2013) · Oxford University Press eBooks · doi:10.1093/med/9780195328547.001.0001 · Cited by 713
Evoked dipole source potentials of the human auditory cortex
Scherg, M., & CRAMON, D. V. (1986) · Electroencephalography and Clinical Neurophysiology/Evoked Potentials Section · doi:10.1016/0168-5597(86)90014-6 · Cited by 703
Fox, M. D., Snyder, A. Z., Zacks, J. M., & Raichle, M. E. (2006) · Nature Neuroscience · doi:10.1038/nn1616 · Cited by 660
Nir, Y., Fisch, L., Mukamel, R., Gelbard-Sagiv, H., Arieli, A., Fried, I., & Malach, R. (2007) · Current Biology · doi:10.1016/j.cub.2007.06.066 · Cited by 621
Correlates of alpha rhythm in functional magnetic resonance imaging and near infrared spectroscopy
Moosmann, M., Ritter, P., Krastel, I., den Brink, A. M.-V., Thees, S., Blankenburg, F., Taskin, B., Obrig, H., & Villringer, A. (2003) · NeuroImage · doi:10.1016/s1053-8119(03)00344-6 · Cited by 595
Gotman, J., Grova, C., Bagshaw, A. P., Kobayashi, E., Aghakhani, Y., & Dubeau, F. (2005) · Proceedings of the National Academy of Sciences · doi:10.1073/pnas.0504935102 · Cited by 586
How Local Is the Local Field Potential?
Kajikawa, Y., & Schroeder, C. E. (2011) · Neuron · doi:10.1016/j.neuron.2011.09.029 · Cited by 584
Neurophysiology of the BOLD fMRI Signal in Awake Monkeys
Goense, J. B. M., & Logothetis, N. K. (2008) · Current Biology · doi:10.1016/j.cub.2008.03.054 · Cited by 583
Impact of Network Activities on Neuronal Properties in Corticothalamic Systems
Steriade, M. (2001) · Journal of Neurophysiology · doi:10.1152/jn.2001.86.1.1 · Cited by 530
Decreased EEG synchronization in Alzheimer’s disease and mild cognitive impairment
Koenig, T. W., Prichep, L. S., Dierks, T., Hubl, D., Wahlund, L., John, E. R., & Jelić, V. (2004) · Neurobiology of Aging · doi:10.1016/j.neurobiolaging.2004.03.008 · Cited by 514
Interneuron Diversity series: Inhibitory interneurons and network oscillations in vitro
Whittington, M. A., & Traub, R. D. (2003) · Trends in Neurosciences · doi:10.1016/j.tins.2003.09.016 · Cited by 506
Interictal spikes in focal epileptogenesis
de Curtis, M., & AVANZINI, G. (2001) · Progress in Neurobiology · doi:10.1016/s0301-0082(00)00026-5 · Cited by 490
Hippocampal network patterns of activity in the mouse
Buzsáki, G., Buhl, D. L., Harris, K. D., Csicsvari, J., Czéh, B., & Morozov, A. (2003) · Neuroscience · doi:10.1016/s0306-4522(02)00669-3 · Cited by 486
EEG-brain dynamics : relation between EEG and Brain evoked potentials
Başar, E. (1980) · Elsevier eBooks · Cited by 484
Scheeringa, R., Fries, P., Petersson, K. M., Oostenveld, R., Grothe, I., Norris, D. G., Peter Hagoort, A., & BASTIAANSEN, M. C. M. (2011) · Neuron · doi:10.1016/j.neuron.2010.11.044 · Cited by 479
Intrinsic Coupling Modes: Multiscale Interactions in Ongoing Brain Activity
Engel, A. K., Gerloff, C., Hilgetag, C. C., & Nolte, G. (2013) · Neuron · doi:10.1016/j.neuron.2013.09.038 · Cited by 471
Uludağ, K., Müller-Bierl, B., & Uğurbil, K. (2009) · NeuroImage · doi:10.1016/j.neuroimage.2009.05.051 · Cited by 450
Astrocytes and the regulation of cerebral blood flow
Koehler, R. C., Roman, R. J., & Harder, D. R. (2009) · Trends in Neurosciences · doi:10.1016/j.tins.2008.11.005 · Cited by 439
Chatrian, G. E., Shaw, C., & Leffman, H. (1964) · Electroencephalography and Clinical Neurophysiology · doi:10.1016/0013-4694(64)90149-x · Cited by 431
Evidence of an inhibitory restraint of seizure activity in humans
Schevon, C. A., Weiss, S. A., McKhann, G. M., Goodman, R. R., Yuste, R., Emerson, R. G., & Trevelyan, A. J. (2012) · Nature Communications · doi:10.1038/ncomms2056 · Cited by 430
Belitski, A., Gretton, A., Magri, C., Murayama, Y., Montemurro, M. A., Logothetis, N. K., & Panzeri, S. (2008) · Journal of Neuroscience · doi:10.1523/jneurosci.0009-08.2008 · Cited by 420
Rapid synchronization through fast threshold modulation
Somers, D. C., & Kopell, N. (1993) · Biological Cybernetics · doi:10.1007/bf00198772 · Cited by 407
Monitoring the patient's EEG during echo planar MRI
Ives, J. R., Warach, S. J., Schmitt, F., Edelman, R. R., & Schomer, D. L. (1993) · Electroencephalography and Clinical Neurophysiology · doi:10.1016/0013-4694(93)90156-p · Cited by 403
Creutzfeldt, O. D., Watanabe, S., & Lux, H. D. (1966) · Electroencephalography and Clinical Neurophysiology · doi:10.1016/0013-4694(66)90136-2 · Cited by 401
Frontal theta EEG activity correlates negatively with the default mode network in resting state
Scheeringa, R., Bastiaansen, M. C. M., Petersson, K. M., Oostenveld, R., Norris, D. G., & Hagoort, P. (2008) · International Journal of Psychophysiology · doi:10.1016/j.ijpsycho.2007.05.017 · Cited by 400
Neuronal activity during the sleep-waking cycle
Steriade, M., & Hobson, J. A. (1976) · Progress in Neurobiology · doi:10.1016/0301-0082(76)90013-7 · Cited by 386
Mathiesen, C., Caesar, K., Akgören, N., & Lauritzen, M. (1998) · The Journal of Physiology · doi:10.1111/j.1469-7793.1998.555be.x · Cited by 375
Origin of Negative Blood Oxygenation Level—Dependent fMRI Signals
Harel, N., Lee, P., Nagaoka, T., Kim, D., & Kim, S. (2002) · Journal of Cerebral Blood Flow & Metabolism · doi:10.1097/00004647-200208000-00002 · Cited by 366
Kandel, A., & Buzsáki, G. (1997) · Journal of Neuroscience · doi:10.1523/jneurosci.17-17-06783.1997 · Cited by 357
Magri, C., Schridde, U., Murayama, Y., Panzeri, S., & Logothetis, N. K. (2012) · Journal of Neuroscience · doi:10.1523/jneurosci.3985-11.2012 · Cited by 356
Correlating the alpha rhythm to BOLD using simultaneous EEG/fMRI: Inter-subject variability
Goncalves, S. I., de Munck, J. C., Pouwels, P. J. W., Schoonhoven, R., Kuijer, J. P. A., Maurits, N. M., Hoogduin, J. M., Someren, E. J. W. V., Heethaar, R. M., & Lopes, F. H. D. S. (2005) · NeuroImage · doi:10.1016/j.neuroimage.2005.09.062 · Cited by 355
EEG correlates of time-varying BOLD functional connectivity
Chang, C., Liu, Z., Chen, M. C., Liu, X., & Duyn, J. H. (2013) · NeuroImage · doi:10.1016/j.neuroimage.2013.01.049 · Cited by 355
How and when the fMRI BOLD signal relates to underlying neural activity: The danger in dissociation
Ekstrom, A. D. (2009) · Brain Research Reviews · doi:10.1016/j.brainresrev.2009.12.004 · Cited by 349
Fast Oscillations in Cortical Circuits
Traub, R. D., Whittington, M. A., & Jefferys, J. G. R. (1999) · The MIT Press eBooks · doi:10.7551/mitpress/2962.001.0001 · Cited by 349
Cerebral energetics and spiking frequency: The neurophysiological basis of fMRI
Smith, A. J., Blumenfeld, H., Behar, K. L., Rothman, D. L., Shulman, R. G., & Hyder, F. (2002) · Proceedings of the National Academy of Sciences · doi:10.1073/pnas.132272199 · Cited by 349
Menéndez, R. G. D. P., Andino, S. L. G., Lantz, G., Michel, C. M., & Landis, T. (2001) · Brain Topography · doi:10.1023/a:1012944913650 · Cited by 347
Concurrent EEG/fMRI analysis by multiway Partial Least Squares
Martínez‐Montes, E., Valdes-Sosa, P. A., Miwakeichi, F., Goldman, R. I., & Cohen, M. S. (2004) · NeuroImage · doi:10.1016/j.neuroimage.2004.03.038 · Cited by 327
Organization of thalamic and cortical alpha rhythms: Spectra and coherences
Lopes, F. H. D. S., van Lierop, T. H. M. T., Schrijer, C. F., & van Leeuwen, W. S. (1973) · Electroencephalography and Clinical Neurophysiology · doi:10.1016/0013-4694(73)90216-2 · Cited by 326
Lachaux, J.-P., Fonlupt, P., Kahane, P., Minotti, L., Hoffmann, D., Bertrand, O., & Baciu, M. (2007) · Human Brain Mapping · doi:10.1002/hbm.20352 · Cited by 326
Recording of EEG during fMRI experiments: Patient safety
Lemieux, L., Allen, P. J., Franconi, F., Symms, M. R., & Fish, D. R. (1997) · Magnetic Resonance in Medicine · doi:10.1002/mrm.1910380614 · Cited by 311
Self-citationEichele, T., Specht, K., Moosmann, M., Jongsma, M. L. A., Quiroga, R. Q., Nordby, H., & Hugdahl, K. (2005) · Proceedings of the National Academy of Sciences · doi:10.1073/pnas.0505508102 · Cited by 308
Dynamic BOLD functional connectivity in humans and its electrophysiological correlates
Tagliazucchi, E., von Wegner, F., Morzelewski, A., Brodbeck, V., & Laufs, H. (2012) · Frontiers in Human Neuroscience · doi:10.3389/fnhum.2012.00339 · Cited by 300
Divergence of fMRI and neural signals in V1 during perceptual suppression in the awake monkey
Maier, A., Wilke, M., Aura, C. J., Zhu, C., Ye, F. Q., & Leopold, D. A. (2008) · Nature Neuroscience · doi:10.1038/nn.2173 · Cited by 291
Perivascular Potassium and pH as Determinants of Local Pial Arterial Diameter in Cats
Kuschinsky, W., Wahl, M., Bosse, O., & Thurau, K. (1972) · Circulation Research · doi:10.1161/01.res.31.2.240 · Cited by 287
BOLD correlates of EEG alpha phase-locking and the fMRI default mode network
Jann, K., Dierks, T., Boesch, C., Kottlow, M., Strik, W., & Koenig, T. (2009) · NeuroImage · doi:10.1016/j.neuroimage.2009.01.001 · Cited by 286 · cited 1×
“…diameter [Kuschinsky et al., 1972] and on CBF fluctuations [Dreier et al., 1995], rises significantly following ictal and interictal bursting [Jensen and Yaari, 1997]; and astrocytes, which play a relevant role in neurovascular coupling mechanisms [Ekstrom, 2010], are known to be an…”
BackgroundSalek‐Haddadi, A., Diehl, B., Hamandi, K., Merschhemke, M. B., Liston, A. D., Friston, K. J., Duncan, J. S., Fish, D. R., & Lemieux, L. (2006) · Brain Research · doi:10.1016/j.brainres.2006.02.098 · Cited by 280
Self-citationCombining EEG and fMRI: A multimodal tool for epilepsy research
Gotman, J., Kobayashi, E., Bagshaw, A. P., Bénar, C., & Dubeau, F. (2006) · Journal of Magnetic Resonance Imaging · doi:10.1002/jmri.20577 · Cited by 278
Evaluation of Methods for Three-Dimensional Localization of Electrical Sources in the Human Brain
Kavanagk, R. N., Darcey, T. M., Lehmann, D., & Fender, D. H. (1978) · IEEE Transactions on Biomedical Engineering · doi:10.1109/tbme.1978.326339 · Cited by 276
Functional magnetic resonance imaging of human absence seizures
Salek‐Haddadi, A., Lemieux, L., Merschhemke, M. B., Friston, K. J., Duncan, J. S., & Fish, D. R. (2003) · Annals of Neurology · doi:10.1002/ana.10586 · Cited by 272
Self-citationEEG–fMRI of idiopathic and secondarily generalized epilepsies
Hamandi, K., Salek‐Haddadi, A., Laufs, H., Liston, A. D., Friston, K. J., Fish, D. R., Duncan, J. S., & Lemieux, L. (2006) · NeuroImage · doi:10.1016/j.neuroimage.2006.02.016 · Cited by 272
Self-citationCreutzfeldt, O. D., Watanabe, S., & Lux, H. D. (1966) · Electroencephalography and Clinical Neurophysiology · doi:10.1016/0013-4694(66)90137-4 · Cited by 271
The hemodynamic response of the alpha rhythm: An EEG/fMRI study
de Munck, J. C., Goncalves, S. I., Huijboom, L., Kuijer, J. P. A., Pouwels, P. J. W., Heethaar, R. M., & Lopes, F. H. D. S. (2007) · NeuroImage · doi:10.1016/j.neuroimage.2007.01.022 · Cited by 260
Jensen, M. S., & Yaari, Y. (1997) · Journal of Neurophysiology · doi:10.1152/jn.1997.77.3.1224 · Cited by 256
Investigating neural–hemodynamic coupling and the hemodynamic response function in the awake rat
Martin, C. J., Martindale, J., Berwick, J., & Mayhew, J. E. (2006) · NeuroImage · doi:10.1016/j.neuroimage.2006.02.021 · Cited by 255
EEG-fMRI in the preoperative work-up for epilepsy surgery
Zijlmans, M., Huiskamp, G. J. M., Hersevoort, M., Seppenwoolde, J., van Huffelen, A. C., & Leijten, F. S. S. (2007) · Brain · doi:10.1093/brain/awm141 · Cited by 255
Dynamic models of BOLD contrast
Buxton, R. B. (2012) · NeuroImage · doi:10.1016/j.neuroimage.2012.01.012 · Cited by 251
Uludaǧ, K., Dubowitz, D. J., Yoder, E. J., Restom, K., Liu, T. T., & Buxton, R. B. (2004) · NeuroImage · doi:10.1016/j.neuroimage.2004.05.013 · Cited by 248
Neuronal Generators and the Problem of Localization in Electroencephalography
GLOOR, P. (1985) · Journal of Clinical Neurophysiology · doi:10.1097/00004691-198510000-00002 · Cited by 245
Negative BOLD with Large Increases in Neuronal Activity
Schridde, U., Khubchandani, M., Motelow, J. E., Sanganahalli, B. G., Hyder, F., & Blumenfeld, H. (2007) · Cerebral Cortex · doi:10.1093/cercor/bhm208 · Cited by 245
Transfer Function between EEG and BOLD Signals of Epileptic Activity
Leite, M., Leal, A., & Figueiredo, P. (2013) · Frontiers in Neurology · doi:10.3389/fneur.2013.00001 · Cited by 234
Self-citationNeural correlates of cross-modal binding
Bushara, K. O., Hanakawa, T., Immisch, I., Toma, K., Kansaku, K., & Hallett, M. (2003) · Nature Neuroscience · doi:10.1038/nn993 · Cited by 226
Fried, I., Wilson, C. L., Maidment, N. T., Engel, J., Behnke, E., Fields, T. A., Macdonald, K. A., Morrow, J. W., & Ackerson, L. C. (1999) · Journal of neurosurgery · doi:10.3171/jns.1999.91.4.0697 · Cited by 222
EEG Alpha Power Modulation of fMRI Resting-State Connectivity
Scheeringa, R., Petersson, K. M., Kleinschmidt, A. K., Jensen, O. B., & BASTIAANSEN, M. C. M. (2012) · Brain Connectivity · doi:10.1089/brain.2012.0088 · Cited by 221
The BOLD Response to Interictal Epileptiform Discharges
Bénar, C., Gross, D. W., Wang, Y., Petre, V., Pike, G. B., Dubeau, F., & Gotman, J. (2002) · NeuroImage · doi:10.1006/nimg.2002.1164 · Cited by 220
Interdependence of Multiple Theta Generators in the Hippocampus: a Partial Coherence Analysis
Kocsis, B., Bragin, A., & Buzsáki, G. (1999) · Journal of Neuroscience · doi:10.1523/jneurosci.19-14-06200.1999 · Cited by 218
Simultaneous EEG-fMRI during a Working Memory Task: Modulations in Low and High Frequency Bands
Michels, L., Bücher, K., Lüchinger, R., Klaver, P., Martin, E., Jeanmonod, D., & Brandeis, D. (2010) · PLoS ONE · doi:10.1371/journal.pone.0010298 · Cited by 217
Niedermeyer's Electroencephalography
Schomer, D. L., & da Silva, F. H. L. (2017) · doi:10.1093/med/9780190228484.001.0001 · Cited by 216
Simulated power spectral density (PSD) of background electrocorticogram (ECoG)
Freeman, W. J., & Zhai, J. (2008) · Cognitive Neurodynamics · doi:10.1007/s11571-008-9064-y · Cited by 213
Model driven EEG/fMRI fusion of brain oscillations
Valdes-Sosa, P. A., Sánchez‐Bornot, J. M., Sotero, R. C., Iturria‐Medina, Y., Alemán‐Gómez, Y., Bosch‐Bayard, J., Carbonell, F., & Ozaki, T. (2008) · Human Brain Mapping · doi:10.1002/hbm.20704 · Cited by 209
EEG-fMRI; Physiological Basis, Technique, and Applications
Mulert, C., & Lemieux, L. (2010) · doi:10.1007/978-3-540-87919-0 · Cited by 207
Self-citationDebener, S., Mullinger, K. J., Niazy, R. K., & Bowtell, R. W. (2007) · International Journal of Psychophysiology · doi:10.1016/j.ijpsycho.2007.05.015 · Cited by 206
Hemodynamic correlates of EEG: a heuristic
Kilner, J. M., Mattout, J., Henson, R., & Friston, K. J. (2005) · NeuroImage · doi:10.1016/j.neuroimage.2005.06.008 · Cited by 206
fMRI Activation in Continuous and Spike‐triggered EEG–fMRI Studies of Epileptic Spikes
Al-Asmi, A. R., Bénar, C., Gross, D. W., Khani, Y. A., Andermann, F., Pike, G. B., Dubeau, F., & Gotman, J. (2003) · Epilepsia · doi:10.1046/j.1528-1157.2003.01003.x · Cited by 203
Changes in activity of striato–thalamo–cortical network precede generalized spike wave discharges
Moeller, F., Siebner, H. R., Wolff, S., Muhle, H., Boor, R., Granert, O., Jansen, O., Stephani, U., & Siniatchkin, M. (2007) · NeuroImage · doi:10.1016/j.neuroimage.2007.10.058 · Cited by 201
Grouiller, F., Thornton, R. C., Groening, K., Spinelli, L., Duncan, J. S., Schaller, K., Siniatchkin, M., Lemieux, L., Seeck, M., Michel, C. M., et al. (2011) · Brain · doi:10.1093/brain/awr156 · Cited by 199
Self-citationEndogenous brain oscillations and related networks detected by surface EEG‐combined fMRI
Laufs, H. (2008) · Human Brain Mapping · doi:10.1002/hbm.20600 · Cited by 194 · cited 2×
“…timings (faster HRFs related to neuronal activity at the epileptic focus; slower HRFs related to propagated activity) [Kobayashi et al., 2009; Lemieux et al., 2008; LeVan et al., 2010b]; or spatially nonoverlapping EEG and BOLD signals [Disbrow et al., 2000; Jacobs et al., 2009; Laufs, 2008].”
Single‐trial analysis of oddball event‐related potentials in simultaneous EEG‐fMRI
Bénar, C., Schön, D., Grimault, S., Nazarian, B., Burle, B., Roth, M., Badier, J., Marquis, P., Liégeois‐Chauvel, C., & Anton, J. (2007) · Human Brain Mapping · doi:10.1002/hbm.20289 · Cited by 192
Neurophysiologic correlates of fMRI in human motor cortex
Hermes, D., Miller, K. J., Vansteensel, M. J., Aarnoutse, E. J., Leijten, F. S. S., & Ramsey, N. F. (2011) · Human Brain Mapping · doi:10.1002/hbm.21314 · Cited by 186
EEG–fMRI integration for the study of human brain function
Jorge, J., van der Zwaag, W., & Figueiredo, P. (2013) · NeuroImage · doi:10.1016/j.neuroimage.2013.05.114 · Cited by 185
Self-citationWidespread epileptic networks in focal epilepsies: EEG‐fMRI study
Fahoum, F., Lopes, R., Pittau, F., Dubeau, F., & Gotman, J. (2012) · Epilepsia · doi:10.1111/j.1528-1167.2012.03533.x · Cited by 182
EEG–fMRI of epileptic spikes: Concordance with EEG source localization and intracranial EEG
Bénar, C., Grova, C., Kobayashi, E., Bagshaw, A. P., Aghakhani, Y., Dubeau, F., & Gotman, J. (2006) · NeuroImage · doi:10.1016/j.neuroimage.2005.11.008 · Cited by 179
Conner, C. R., Ellmore, T. M., Pieters, T. A., Disano, M. A., & Tandon, N. (2011) · Journal of Neuroscience · doi:10.1523/jneurosci.1457-11.2011 · Cited by 177
Disbrow, E. A., Slutsky, D. A., Roberts, T. P. L., & Krubitzer, L. A. (2000) · Proceedings of the National Academy of Sciences · doi:10.1073/pnas.170205497 · Cited by 174
The influence of model parameters on EEG/MEG single dipole source estimation
Stok, C. J. (1987) · IEEE Transactions on Biomedical Engineering · doi:10.1109/tbme.1987.326090 · Cited by 172
Tyvaert, L., Hawco, C. S., Kobayashi, E., LeVan, P., Dubeau, F., & Gotman, J. (2008) · Brain · doi:10.1093/brain/awn145 · Cited by 171
Koenig, T. W., Lehmann, D., Saito, N. H., Kuginuki, T., Kinoshita, T., & Koukkou, M. (2001) · Schizophrenia Research · doi:10.1016/s0920-9964(00)00154-7 · Cited by 169
Temporal fluctuations in coherence of brain waves.
Bullock, T. H., McClune, M. C., Achimowicz, J. Z., Iragui‐Madoz, V., Duckrow, R. B., & Spencer, S. S. (1995) · Proceedings of the National Academy of Sciences · doi:10.1073/pnas.92.25.11568 · Cited by 163
The relationship of brain activity to scalp recordings of event-related potentials.
Vaughan, H. G. (2011) · doi:10.1037/13016-002 · Cited by 163
The Electroencephalogram: Autonomous Electrical Activity in Man and Animals
Lindsley, D. B., & Wicke, J. D. (1974) · Elsevier eBooks · doi:10.1016/b978-0-12-689402-8.50008-0 · Cited by 153
Bettus, G., Ranjeva, J., Wendling, F., Bénar, C., Sylviane Confort-gouny, A., Régis, J. M., Chauvel, P., Cozzone, P. J., Lemieux, L., Bartoloméi, F., et al. (2011) · PLoS ONE · doi:10.1371/journal.pone.0020071 · Cited by 153
Self-citationSimultaneous intracranial EEG and fMRI of interictal epileptic discharges in humans
Vulliémoz, S., Carmichael, D. W., Rosenkranz, K., Diehl, B., Rodionov, R., Walker, M. C., McEvoy, A. W., & Lemieux, L. (2010) · NeuroImage · doi:10.1016/j.neuroimage.2010.08.004 · Cited by 153
Self-citationInteractions between different EEG frequency bands and their effect on alpha - fMRI correlations
de Munck, J. C., Goncalves, S. I., Mammoliti, R., Heethaar, R. M., & Lopes, F. H. D. S. (2009) · NeuroImage · doi:10.1016/j.neuroimage.2009.04.029 · Cited by 150
Mulert, C., Seifert, C. L., Leicht, G., Kirsch, V., Ertl, M., Karch, S., Moosmann, M., Lutz, J., Möller, H., Hegerl, U., et al. (2008) · NeuroImage · doi:10.1016/j.neuroimage.2008.04.236 · Cited by 150
Functional interactions between intrinsic brain activity and behavior
Sadaghiani, S., & Kleinschmidt, A. (2013) · NeuroImage · doi:10.1016/j.neuroimage.2013.04.100 · Cited by 147
EEG correlated functional MRI and postoperative outcome in focal epilepsy
Thornton, R., Laufs, H., Rodionov, R., Cannadathu, S., Carmichael, D. W., Vulliémoz, S., Salek‐Haddadi, A., McEvoy, A. W., Smith, S. J. M., Lhatoo, S. D., et al. (2010) · Journal of Neurology Neurosurgery & Psychiatry · doi:10.1136/jnnp.2009.196253 · Cited by 145
Self-citationFolbergrová, J., Ingvar, M., & Siesjö, B. K. (1981) · Journal of Neurochemistry · doi:10.1111/j.1471-4159.1981.tb04673.x · Cited by 142
Scheeringa, R., Mazaheri, A., Bojak, I., Norris, D. G., & Kleinschmidt, A. K. (2011) · Journal of Neuroscience · doi:10.1523/jneurosci.4697-10.2011 · Cited by 141
Simultaneous EEG-Correlated Ictal fMRI
Salek‐Haddadi, A., Merschhemke, M. B., Lemieux, L., & Fish, D. R. (2002) · NeuroImage · doi:10.1006/nimg.2002.1073 · Cited by 136
Self-citationThornton, R., Vulliémoz, S., Rodionov, R., Carmichael, D. W., Chaudhary, U. J., Diehl, B., Laufs, H., Vollmar, C., McEvoy, A. W., Walker, M. C., et al. (2011) · Annals of Neurology · doi:10.1002/ana.22535 · Cited by 135
Self-citationEckhorn, R. (1994) · Progress in brain research · doi:10.1016/s0079-6123(08)60556-7 · Cited by 134
How Ongoing Neuronal Oscillations Account for Evoked fMRI Variability
Becker, R., Reinacher, M., Freyer, F., Villringer, A., & Ritter, P. (2011) · Journal of Neuroscience · doi:10.1523/jneurosci.0210-11.2011 · Cited by 134
BOLD changes occur prior to epileptic spikes seen on scalp EEG
Hawco, C. S., Bagshaw, A. P., Lu, Y., Dubeau, F., & Gotman, J. (2007) · NeuroImage · doi:10.1016/j.neuroimage.2006.12.042 · Cited by 133
Lopes, F. H. D. S. (2009) · Springer eBooks · doi:10.1007/978-3-540-87919-0_2 · Cited by 131
Spatial relationship between neuronal activity and BOLD functional MRI
Kim, D., Ronen, I., Olman, C. A., Kim, S., Uǧurbil, K., & Toth, L. J. (2004) · NeuroImage · doi:10.1016/j.neuroimage.2003.10.018 · Cited by 124
Jacobs, J., LeVan, P., Moeller, F., Boor, R., Stephani, U., Gotman, J., & Siniatchkin, M. (2009) · NeuroImage · doi:10.1016/j.neuroimage.2009.01.014 · Cited by 123
Huttunen, J. K., Gröhn, O. H. J., & Penttonen, M. (2007) · NeuroImage · doi:10.1016/j.neuroimage.2007.06.042 · Cited by 121
An, D., Fahoum, F., Hall, J. A., Olivier, A., Gotman, J., & Dubeau, F. (2013) · Epilepsia · doi:10.1111/epi.12434 · Cited by 112
A Comparison of Hemodynamic and Neural Responses in Cat Visual Cortex Using Complex Stimuli
Kayser, C. (2004) · Cerebral Cortex · doi:10.1093/cercor/bhh047 · Cited by 110
Moeller, F., Tyvaert, L., Nguyen, D. K., LeVan, P., Bouthillier, A., Kobayashi, E., Tampieri, D. I., Dubeau, F., & Gotman, J. (2009) · Neurology · doi:10.1212/wnl.0b013e3181c55d17 · Cited by 110
Feasibility of simultaneous intracranial EEG-fMRI in humans: A safety study
Carmichael, D. W., Thornton, J. S., Rodionov, R., Thornton, R., McEvoy, A. W., Ordidge, R. J., Allen, P. J., & Lemieux, L. (2009) · NeuroImage · doi:10.1016/j.neuroimage.2009.07.062 · Cited by 108
Self-citationMathiesen, C., Caesar, K., & Lauritzen, M. (2000) · The Journal of Physiology · doi:10.1111/j.1469-7793.2000.t01-1-00235.x · Cited by 107
Estimating the transfer function from neuronal activity to BOLD using simultaneous EEG-fMRI
Rosa, M. J., Kilner, J., Blankenburg, F., Josephs, O., & Penny, W. (2010) · NeuroImage · doi:10.1016/j.neuroimage.2009.09.011 · Cited by 105
Cross-Correlation Analysis of Electroencephalographic Potentials and Slow Membrane Transients
Klee, M. R., Offenloch, K., & Tigges, J. (1965) · Science · doi:10.1126/science.147.3657.519 · Cited by 104
A personalized history of EEG–fMRI integration
Laufs, H. (2012) · NeuroImage · doi:10.1016/j.neuroimage.2012.01.039 · Cited by 103
The electrical fields at the surface of the head during sleep
Brazier, M. A. B. (1949) · Electroencephalography and Clinical Neurophysiology · doi:10.1016/0013-4694(49)90176-5 · Cited by 102
Noncanonical spike‐related BOLD responses in focal epilepsy
Lemieux, L., Laufs, H., Carmichael, D. W., Paul, J. S., Walker, M. C., & Duncan, J. S. (2007) · Human Brain Mapping · doi:10.1002/hbm.20389 · Cited by 102
Self-citationNeurovascular Coupling and Epilepsy: Hemodynamic Markers for Localizing and Predicting Seizure Onset
Schwartz, T. H. (2007) · Epiliepsy currents/Epilepsy currents · doi:10.1111/j.1535-7511.2007.00183.x · Cited by 95
Imaging seizure activity: A combined EEG/EMG‐fMRI study in reading epilepsy
Salek‐Haddadi, A., Mayer, T., Hamandi, K., Symms, M. R., Josephs, O., Flügel, D., Woermann, F. G., Richardson, M. P., Noppeney, U., Wolf, P., et al. (2008) · Epilepsia · doi:10.1111/j.1528-1167.2008.01737.x · Cited by 94
Jacobs, J., Hawco, C. S., Kobayashi, E., Boor, R., LeVan, P., Stephani, U., Siniatchkin, M., & Gotman, J. (2008) · NeuroImage · doi:10.1016/j.neuroimage.2007.11.056 · Cited by 94
Salmon, É., Collette, F., Degueldre, C., Lemaire, C. F., & Franck, G. (2000) · Human Brain Mapping · doi:10.1002/(sici)1097-0193(200005)10:1 · Cited by 91
Self-citationMizuhara, H., Wang, L., KOBAYASHI, K., & Yamaguchi, Y. (2005) · NeuroImage · doi:10.1016/j.neuroimage.2005.04.030 · Cited by 90
Are the electroencephalograms mainly rhythmic? Assessment of periodicity in wide-band time series
Bullock, T. H., McClune, M. C., & Enright, J. T. (2003) · Neuroscience · doi:10.1016/s0306-4522(03)00208-2 · Cited by 89
Masterton, R. A. J., Harvey, A. S., Archer, J. S., Lillywhite, L. M., Abbott, D. F., Scheffer, I. E., & Jackson, G. D. (2010) · NeuroImage · doi:10.1016/j.neuroimage.2010.01.109 · Cited by 89
Handbook of Electroencephalography and Clinical Neurophysiology
Roth, B. (1977) · Electroencephalography and Clinical Neurophysiology · doi:10.1016/0013-4694(77)90272-3 · Cited by 88
Effects of simultaneous EEG recording on MRI data quality at 1.5, 3 and 7 tesla
Mullinger, K. J., Debener, S., Coxon, R., & Bowtell, R. W. (2007) · International Journal of Psychophysiology · doi:10.1016/j.ijpsycho.2007.06.008 · Cited by 87
Wan, X., Riera, J. J., Iwata, K., Takahashi, M. K., Wakabayashi, T., & Kawashima, R. (2006) · NeuroImage · doi:10.1016/j.neuroimage.2006.03.040 · Cited by 87
Using voxel-specific hemodynamic response function in EEG-fMRI data analysis
Lu, Y., Bagshaw, A. P., Grova, C., Kobayashi, E., Dubeau, F., & Gotman, J. (2006) · NeuroImage · doi:10.1016/j.neuroimage.2005.11.040 · Cited by 87
Noninvasive dynamic imaging of seizures in epileptic patients
Tyvaert, L., LeVan, P., Dubeau, F., & Gotman, J. (2009) · Human Brain Mapping · doi:10.1002/hbm.20824 · Cited by 86
Thornton, R. C., Rodionov, R., Laufs, H., Vulliémoz, S., Vaudano, A. E., Carmichael, D. W., Cannadathu, S., Guye, M., McEvoy, A. W., Lhatoo, S. D., et al. (2010) · NeuroImage · doi:10.1016/j.neuroimage.2010.05.064 · Cited by 83
Self-citationSingle-trial coupling of the gamma-band response and the corresponding BOLD signal
Mulert, C., Leicht, G., Hepp, P. G., Kirsch, V., Karch, S., Pogarell, O. M., Reiser, M. F., Hegerl, U., Jäger, L., Möller, H. ‐., et al. (2009) · NeuroImage · doi:10.1016/j.neuroimage.2009.10.058 · Cited by 81
Gsell, W., Burke, M., Wiedermann, D., Bonvento, G., Silva, A. C., Dauphin, F., Bührle, C., Hoehn, M., & Schwindt, W. (2006) · Journal of Neuroscience · doi:10.1523/jneurosci.4615-05.2006 · Cited by 81
Using patient-specific hemodynamic response functions in combined EEG-fMRI studies in epilepsy
Kang, J. K., Bénar, C., Al-Asmi, A. R., Aghakhani, Y., Pike, G. B., Dubeau, F., & Gotman, J. (2003) · NeuroImage · doi:10.1016/s1053-8119(03)00290-8 · Cited by 80
Evaluation of epileptogenic networks in children with tuberous sclerosis complex using EEG‐fMRI
Jacobs, J., Rohr, A., Moeller, F., Boor, R., Kobayashi, E., LeVan, P., Stephani, U., Gotman, J., & Siniatchkin, M. (2008) · Epilepsia · doi:10.1111/j.1528-1167.2007.01486.x · Cited by 79
Further nonlinearities in neurovascular coupling in rodent barrel cortex
Hewson-Stoate, N., Jones, M., Martindale, J., Berwick, J., & Mayhew, J. E. (2004) · NeuroImage · doi:10.1016/j.neuroimage.2004.08.040 · Cited by 78
Combined EEG-fMRI and tractography to visualise propagation of epileptic activity
Hamandi, K., Powell, R., Laufs, H., Symms, M. R., Barker, G. J., Parker, G. J. M., Lemieux, L., & Duncan, J. S. (2007) · Journal of Neurology Neurosurgery & Psychiatry · doi:10.1136/jnnp.2007.125401 · Cited by 77
Self-citationSimultaneous intracranial EEG–fMRI in humans: Protocol considerations and data quality
Carmichael, D. W., Vulliémoz, S., Rodionov, R., Thornton, J. S., McEvoy, A. W., & Lemieux, L. (2012) · NeuroImage · doi:10.1016/j.neuroimage.2012.05.056 · Cited by 76
Self-citationLeVan, P., Tyvaert, L., Moeller, F., & Gotman, J. (2009) · NeuroImage · doi:10.1016/j.neuroimage.2009.07.064 · Cited by 75
GLOOR, P., Vera, C. L., & Sperti, L. (1963) · Electroencephalography and Clinical Neurophysiology · doi:10.1016/0013-4694(63)90060-9 · Cited by 75
Analysis of the EEG–fMRI response to prolonged bursts of interictal epileptiform activity
Bagshaw, A. P., Hawco, C. S., Bénar, C., Kobayashi, E., Aghakhani, Y., Dubeau, F., Pike, G. B., & Gotman, J. (2005) · NeuroImage · doi:10.1016/j.neuroimage.2004.10.010 · Cited by 73
Nonlinear local electrovascular coupling. I: A theoretical model
Riera, J. J., Wan, X., Jiménez, J. C., & Kawashima, R. (2006) · Human Brain Mapping · doi:10.1002/hbm.20230 · Cited by 72
Moving Dipole Inverse ECG and EEG Solutions
Gulrajani, R. M., ROBERGE, F. A., & Savard, P. (1984) · IEEE Transactions on Biomedical Engineering · doi:10.1109/tbme.1984.325257 · Cited by 72
van Houdt, P. J., de Munck, J. C., Leijten, F. S. S., Huiskamp, G. J. M., Colon, A., Boon, P., & Ossenblok, P. (2013) · NeuroImage · doi:10.1016/j.neuroimage.2013.02.033 · Cited by 72
Chaudhary, U. J., Carmichael, D. W., Rodionov, R., Thornton, R. C., Bartlett, P., Vulliémoz, S., Micallef, C., McEvoy, A. W., Diehl, B., Walker, M. C., et al. (2012) · Brain · doi:10.1093/brain/aws302 · Cited by 71
Self-citationDiFrancesco, M. W., Holland, S. K., & Szaflarski, J. P. (2008) · Journal of Clinical Neurophysiology · doi:10.1097/wnp.0b013e3181879d56 · Cited by 70
Murayama, Y., Bieβmann, F., Meinecke, F. C., Müller, K., Augath, M. A., Oeltermann, A., & Logothetis, N. K. (2010) · Magnetic Resonance Imaging · doi:10.1016/j.mri.2009.12.016 · Cited by 68
Research works printed but not linked: 3
- Ritter, 2010, EEG quality: The image acquisiton artefact. In: Mulert C, Lemieux L, editors. EEG-fMRI Physiological Basis, Technique, and Applications
- Vaughn, 1974, Bioelectric Recording Tecniques, Part B. Electroencephalography and Human Brain Potentials, 158
- Villringer, 2010, EEG-fMRI Physiological Basis, Technique, and Applications
Cited by
Sorted by citations
Electrophysiological source imaging: A noninvasive window to brain dynamics
He, B., Sohrabpour, A., Brown, E., & Liu, Z. (2018) · Annual Review of Biomedical Engineering · doi:10.1146/annurev-bioeng-062117-120853 · Cited by 297
Dynamic causal modelling revisited
Friston, K. J., Preller, K. H., Mathys, C., Cagnan, H., Heinzle, J., Razi, A., & Zeidman, P. (2019) · NeuroImage · doi:10.1016/j.neuroimage.2017.02.045 · Cited by 271
EEG-Based Estimation and Classification of Mental Fatigue
Trejo, L. J., Kubitz, K. A., Rosipal, R., Kochavi, R., & Montgomery, L. D. (2015) · Psychology · doi:10.4236/psych.2015.65055 · Cited by 251
Functional ultrasound neuroimaging: a review of the preclinical and clinical state of the art
Deffieux, T., Demené, C., Pernot, M., & Tanter, M. (2018) · Current Opinion in Neurobiology · doi:10.1016/j.conb.2018.02.001 · Cited by 201
EEG-Informed fMRI: A Review of Data Analysis Methods
Abreu, R., Leal, A., & Figueiredo, P. (2018) · Frontiers in Human Neuroscience · doi:10.3389/fnhum.2018.00029 · Cited by 171
Self-citation
Metadata
- Authors
- Murta, T., Leite, M., Carmichael, D. W., Figueiredo, P., & Lemieux, L.
- Affiliations
- University of Lisbon (PT)
- University College London (GB)
- National Hospital for Neurology and Neurosurgery (GB)
- Corresponding author
- Murta, Teresa
- Venue
- Human Brain Mapping
- Publisher
- Wiley
- Published
- 2014-10-03
- Volume
- 36
- Issue
- 1
- Pages
- 391-414
- ISSN
- 1065-9471 (ISSN-L)
- PMC
- PMC4280889
- OpenAlex
- W1591966483
- Semantic Scholar
- 213e8a7e4f617a884af93681624845d67264d85a
- Cited by
- 165
- References
- 249
- Citations by year
- 2026: 16 · 2025: 12 · 2024: 7 · 2023: 4 · 2022: 11 · 2021: 17 · 2020: 20 · 2019: 21 · 2018: 26 · 2017: 10 · 2016: 13 · 2015: 8
- FWCI
- 1.61
- Type
- journal article
- Language
- en
- Open access
- bronze
- doi.org
- Locations
- Human Brain Mapping (publishedVersion)
- PubMed Central (publishedVersion, cc-by)
- PubMed (publishedVersion)
- UCL Discovery (University College London) (submittedVersion)
- Funders
- Department of Health's NIHR Biomedical Research Centres funding scheme
- Portuguese Science Foundation (FCT) (SFRH/BD/80421/2011 and PTDC/SAU-ENB/112294/2009)
- Action Medical Research (SP4646)
- Topics
- Health Sciences › Medicine › Radiology, Nuclear Medicine and Imaging › Advanced MRI Techniques and Applications
- Life Sciences › Neuroscience › Cognitive Neuroscience › EEG and Brain-Computer Interfaces
- Health Sciences › Medicine › Radiology, Nuclear Medicine and Imaging › Advanced Neuroimaging Techniques and Applications
- Keywords
- BOLD signal, epilepsy, hemodynamic response, spontaneous brain activity
- MeSH terms
- Brain, Brain Mapping, Electroencephalography, Humans, Image Processing, Computer-Assisted, Magnetic Resonance Imaging, Oxygen, Brain Waves
About these checks
Registry, retraction, Cites and statistics results are computed, not judged, with one exception: a printed reference that no index lists is read once by a model before it counts as a citation error. Claims are extracted by a model and kept only when their quote appears verbatim in the text; each cited source is then checked, with a model’s help, for whether it says what the claim relies on. Those verdicts can be wrong — read the claim’s quote and the cited source before relying on one.
Statistics and arithmetic are recomputed, not judged.
Confidence bands are shown only for fields calibrated on our annotated test set. None is calibrated yet, so no band is shown.
What counts as a claim ›How we measure confidence ›How we check this ›
Are you an author, or do you see a problem with this page? Request a review
