

A new criterion for assessing discriminant validity in variance-based structural equation modeling
Open accessThe DOI matches its Crossref record; 108 of the 112 references it cites were found in a registry or an index.
Abstract
Discriminant validity assessment has become a generally accepted prerequisite for analyzing relationships between latent variables. For variance-based structural equation modeling, such as partial least squares, the Fornell-Larcker criterion and the examination of cross-loadings are the dominant approaches for evaluating discriminant validity. By means of a simulation study, we show that these approaches do not reliably detect the lack of discriminant validity in common research situations. We therefore propose an alternative approach, based on the multitrait-multimethod matrix, to assess discriminant validity: the heterotrait-monotrait ratio of correlations. We demonstrate its superior performance by means of a Monte Carlo simulation study, in which we compare the new approach to the Fornell-Larcker criterion and the assessment of (partial) cross-loadings. Finally, we provide guidelines on how to handle discriminant validity issues in variance-based structural equation modeling.
Overview
The claims and statistics of this paper haven’t been checked yet.
Free: it reads the open-access text and checks the first 5 claims that cite a source we can check. Create a free account to check every claim.
Integrity signals
Registry
Cites
Statistics
Figures






Verification
Claims the paper makes
The claims and statistics of this paper haven’t been checked yet.
Free: it reads the open-access text and checks the first 5 claims that cite a source we can check. Create a free account to check every claim.
Claims other papers make about this one
Each is checked against this paper’s own text: does it say what the citing paper says it does?
The cited source doesn’t support the claim as written.
In the citing paper
“Ultimately, they did not recommend HTMT inference , given it failed to detect discriminant validity violations even when inter-construct correlations were as high as 0.95.”
From Reporting reliability, convergent and discriminant validity with structural equation modeling: A review and best-practice recommendations (2024) · cites this paper as Henseler et al. (2015)
Checked by a reasoning model — may be wrong.
Experimental — accuracy not yet measuredThe cited source doesn’t support the claim as written.
In the citing paper
“First, intending to estimate the disattenuated construct score correlation, Henseler et al.'s (2015, Eq. 6) HTMT equation is incorrect.”
From Reporting reliability, convergent and discriminant validity with structural equation modeling: A review and best-practice recommendations (2024) · cites this paper as Henseler et al. (2015)
Checked by a reasoning model — may be wrong.
Experimental — accuracy not yet measuredThe source backs part of the claim, not all of it — or backs it for a different population, condition or comparison.
In the citing paper
“While Henseler et al.'s (2015) HTMT equation uses inter-item correlations instead of inter-item covariances, that becomes the disattenuated correlation between two composite scores formed by averaging the standardized item scores.”
From Reporting reliability, convergent and discriminant validity with structural equation modeling: A review and best-practice recommendations (2024) · cites this paper as Henseler et al. (2015)
Experimental — accuracy not yet measuredThe source backs part of the claim, not all of it — or backs it for a different population, condition or comparison.
In the citing paper
“Third, the recommended HTMT threshold of 0.85 was based on the power of detecting a population correlation at 1.0 in a simulation study (Henseler et al., 2015).”
From Reporting reliability, convergent and discriminant validity with structural equation modeling: A review and best-practice recommendations (2024) · cites this paper as Henseler et al., 2015
Experimental — accuracy not yet measuredThe source backs part of the claim, not all of it — or backs it for a different population, condition or comparison.
In the citing paper
“Hence, unless the construct scores are calculated by averaging the standardized item scores, Henseler et al.'s HTMT equation provides a biased estimate of the disattenuated correlation between two composites.”
From Reporting reliability, convergent and discriminant validity with structural equation modeling: A review and best-practice recommendations (2024) · cites this paper as Henseler et al. (2015)
Experimental — accuracy not yet measured
38 more claims about this paper
Create a free account to see every claim other papers make about this one.
Self-check
Percentages, sums and reported differences re-computed from the paper’s own numbers.
The self-check needs the paper’s full text.
Citations
Cites
R: A Language and Environment for Statistical Computing
R Core Team (2025) · doi:10.32614/r.manuals · Cited by 352,181
Evaluating Structural Equation Models with Unobservable Variables and Measurement Error
Fornell, C., & Larcker, D. F. (1981) · Journal of Marketing Research · doi:10.2307/3151312 · Cited by 109,314
Evaluating structural equation models with unobservable variables and measurement error
Fornell, C., & Larcker, D. F. (1981) · Journal of Marketing Research · doi:10.1177/002224378101800104 · Cited by 109,190
Perceived usefulness, perceived ease of use, and user acceptance of information technology
Davis, F. D. (1989) · MIS Quarterly · doi:10.2307/249008 · Cited by 68,483 · cited 1×
“Take, for example, the technology acceptance model and its variations (Davis 1989; Venkatesh et al. 2003), which include the constructs intention to use and the actual use.”
BackgroundUser Acceptance of Information Technology: Toward A Unified View1
Venkatesh, V., Morris, M. G., Davis, G. B., & Davis, F. D. (2003) · MIS Quarterly · doi:10.2307/30036540 · Cited by 45,035 · cited 1×
“Take, for example, the technology acceptance model and its variations (Davis 1989; Venkatesh et al. 2003), which include the constructs intention to use and the actual use.”
BackgroundStructural equation modeling in practice: A review and recommended two-step approach
Anderson, J. C., & Gerbing, D. W. (1988) · Psychological Bulletin · doi:10.1037/0033-2909.103.3.411 · Cited by 41,941 · cited 1×
“That is, discriminant validity assessment using HTMTinference needs to adjust the upper and lower bounds of the confidence interval in each test to maintain the familywise error rate at a predefined α level (Anderson and Gerbing 1988).”
Method(1998) · Cited by 36,049
Herne, H., Cooley, W. W., & Lohnes, P. R. (1973) · Journal of the Royal Statistical Society. Series A (General) · doi:10.2307/2344428 · Cited by 35,697
Pls-Sem: indeed a silver bullet
Hair, J. F., Ringle, C. M., & Sarstedt, M. (2011) · Journal of Marketing Theory and Practice · doi:10.2753/mtp1069-6679190202 · Cited by 21,631
Self-citationA Simple Sequentially Rejective Multiple Test Procedure
(1979) · Scandinavian Journal of Statistics · doi:10.2307/4615733 · Cited by 21,526 · cited 1×
“Furthermore, Bonferroni is a rather conservative approach to maintain the familywise error rate at a predefined level (Hochberg 1988; Holm 1979).”
MethodA primer on partial least squares structural equation modeling (PLS-SEM)
Leguina, A. (2015) · International Journal of Research & Method in Education · doi:10.1080/1743727x.2015.1005806 · Cited by 18,921
Structural Equations with Latent Variables.
Clogg, C. C., & Bollen, K. A. (1991) · Contemporary Sociology · doi:10.2307/2072165 · Cited by 17,442
Structural Equations with Latent Variables
Bollen, K. A. (1989) · Wiley series in probability and statistics · doi:10.1002/9781118619179 · Cited by 17,277 · cited 1×
“For example, Bollen (1989) shows that high inter-construct correlations can cause a pronounced spurious correlation between a theoretically unrelated indicator and construct.”
BackgroundConvergent and discriminant validation by the multitrait-multimethod matrix.
Campbell, D. T., & Fiske, D. W. (1959) · Psychological Bulletin · doi:10.1037/h0046016 · Cited by 17,116 · cited 5×
“Thereby, researchers ensure that the measurement models in their studies capture what they intend to measure (Campbell and Fiske 1959).”
BackgroundMethodInfluential(2014) · DigitalCommons - Kennesaw State University (Kennesaw State University) · Cited by 12,785
Self-citation(1998) · Cited by 12,725
Review of Psychometric theory (2nd ed.).
SITGREAVES, R. (1979) · Contemporary Psychology: A Journal of Reviews · doi:10.1037/018882 · Cited by 11,425
The use of partial least squares path modeling in international marketing
Henseler, J., Ringle, C. M., & Sinkovics, R. R. (2009) · Advances in International Marketing · doi:10.1108/s1474-7979(2009)0000020014 · Cited by 10,926
Self-citationMultivariate Data Analysis, 6th ed
Tatham, R. L., Anderson, R. E., Babin, B. J., Black, W. C., & Hair, J. F. (2006) · Cited by 9,807
An assessment of the use of partial least squares structural equation modeling in marketing research
Hair, J. F., Sarstedt, M., Ringle, C. M., & Mena, J. A. (2012) · Journal of the Academy of Marketing Science · doi:10.1007/s11747-011-0261-6 · Cited by 8,088 · cited 8×
“For variance-based structural equation modeling, such as partial least squares, the FornellLarcker criterion and the examination of cross-loadings are the dominant approaches for evaluating discriminant validity.”
BackgroundMethodResultInfluentialSelf-citationConstructing validity: Basic issues in objective scale development.
Clark, L. A., & Watson, D. (1995) · Psychological Assessment · doi:10.1037/1040-3590.7.3.309 · Cited by 6,567
Modern Methods for Business Research
(1998) · doi:10.4324/9781410604385 · Cited by 6,534
Tenenhaus, M., Vinzi, V. E., Chatelin, Y.-M., & Lauro, C. (2005) · Computational Statistics & Data Analysis · doi:10.1016/j.csda.2004.03.005 · Cited by 6,312 · cited 1×
“For example, the marketing studies in Hair et al.'s (2012a) review that engage in some type of discriminant validity assessment use the Fornell-Larcker criterion (72.08%), cross-loadings (7.79%), or both (26.13%).”
BackgroundInfluentialO'fallon, W. M. (1973) · Technometrics · doi:10.1080/00401706.1973.10489095 · Cited by 6,289
Knowledge management: An organizational capabilities perspective
Gold, A. H., Malhotra, A., & Segars, A. H. (2001) · Journal of Management Information Systems · doi:10.1080/07421222.2001.11045669 · Cited by 6,233 · cited 2×
“Some authors suggest a threshold of 0.85 (Clark andWatson 1995; Kline 2011), whereas others propose a value of 0.90 (Gold et al. 2001; Teo et al. 2008).”
BackgroundInfluentialSimultaneous Statistical Inference
Miller, R. G. (1981) · Springer Series in Statistics · doi:10.1007/978-1-4613-8122-8 · Cited by 5,604
Detection Theory: A User's Guide
Macmillan, N. A., & Creelman, C. D. (1991) · Cited by 5,415
How to Write Up and Report PLS Analyses
Chin, W. W. (2010) · Handbook of Partial Least Squares · doi:10.1007/978-3-540-32827-8_29 · Cited by 5,013 · cited 4×
“…first to propose that each indicator loading should be greater than all of its cross-loadings.3Otherwise, “the measure in question is unable to discriminate as to whether it belongs to the construct it was intended tomeasure or to another (i.e., discriminant validity problem)” (Chin 2010, p. 671).”
BackgroundMethodResultInfluentialA sharper Bonferroni procedure for multiple tests of significance
HOCHBERG, Y. (1988) · Biometrika · doi:10.1093/biomet/75.4.800 · Cited by 4,829
The American Customer Satisfaction Index: Nature, Purpose, and Findings
Fornell, C., Johnson, M. D., Anderson, E. W., Cha, J., & Bryant, B. E. (1996) · Journal of Marketing · doi:10.2307/1251898 · Cited by 4,736
Ireland, R. D., Elfring, T., & Hmieleski, K. M. (2011) · In Search of Research Excellence · doi:10.4337/9781849807630.00017 · Cited by 4,553
Index Construction with Formative Indicators: An Alternative to Scale Development
Diamantopoulos, A., & Winklhofer, H. M. (2001) · Journal of Marketing Research · doi:10.1509/jmkr.38.2.269.18845 · Cited by 3,748
Conventional wisdom on measurement: A structural equation perspective.
Bollen, K., & Lennox, R. (1991) · Psychological Bulletin · doi:10.1037/0033-2909.110.2.305 · Cited by 3,618 · cited 2×
“Theoretical foundations and arguments should provide reasons for constructs correlating or not (Bollen and Lennox 1991).”
BackgroundTwo Structural Equation Models: LISREL and PLS Applied to Consumer Exit-Voice Theory
Fornell, C., & Bookstein, F. L. (1982) · Journal of Marketing Research · doi:10.2307/3151718 · Cited by 3,364 · cited 1×
“To begin with, many researchers view variance-based SEM as the natural approach when the model includes formatively measured constructs (Chin 1998; Fornell and Bookstein 1982; Hair et al. 2012a).”
BackgroundCommon Beliefs and Reality About PLS: Comments on Rönkkö and Evermann (2013)
Henseler, J., Dijkstra, T. K., Sarstedt, M., Ringle, C. M., Diamantopoulos, A., Straub, D. W., Ketchen, D. J., Hair, J. F., Hult, G. T. M., & Calantone, R. J. (2014) · Organizational Research Methods · doi:10.1177/1094428114526928 · Cited by 3,332 · cited 7×
“Variance-based structural equation modeling (SEM) is growing in popularity, which the plethora of recent developments and discussions (e.g., Henseler et al. 2014; Hwang et al. 2010; Lu et al. 2011; Rigdon 2014; Tenenhaus and Tenenhaus 2011), as well as its frequent application across different…”
BackgroundMethodInfluentialSelf-citationA practical guide to factorial validity using PLS-graph: tutorial and annotated example
Gefen, D., & Straub, D. (2005) · Communications of the Association for Information Systems · doi:10.17705/1cais.01605 · Cited by 3,280 · cited 1×
“…from one another (Milberg et al. 2000) and running separate confirmatory factor analyses prior to employing variance-based SEM (Cording et al. 2008; Pavlou et al. 2007; Ravichandran and Rai 2000) by using, for example, Anderson and Gerbing's (1988) test as the standard.1 While marketing…”
MethodAn empirical comparison of the efficacy of covariance-based and variance-based SEM
Reinartz, W., Haenlein, M., & Henseler, J. (2009) · International Journal of Research in Marketing · doi:10.1016/j.ijresmar.2009.08.001 · Cited by 2,906 · cited 4×
“Similar to the loadings, variance-based SEM methods generally underestimate structural model relationships (e.g., Reinartz et al. 2009; Marcoulides, Chin, and Saunders 2012).”
BackgroundMethodResultInfluentialSelf-citationConsistent Partial Least Squares Path Modeling1
Dijkstra, T. K., & Henseler, J. (2015) · MIS Quarterly · doi:10.25300/misq/2015/39.2.02 · Cited by 2,898 · cited 1×
“…basis differences and differential response biases), future research should also assess whether this study’s findings can be generalized to covariance-based SEM techniques, or the recently proposed consistent PLS (Dijkstra 2014; Dijkstra and Henseler 2014a, b), which mimics covariance-based SEM.”
MethodSelf-citationPavlou, P. A., Liang, H., & Xue, Y. (2007) · MIS Quarterly · doi:10.2307/25148783 · Cited by 2,646 · cited 2×
“…from one another (Milberg et al. 2000) and running separate confirmatory factor analyses prior to employing variance-based SEM (Cording et al. 2008; Pavlou et al. 2007; Ravichandran and Rai 2000) by using, for example, Anderson and Gerbing's (1988) test as the standard.1 While marketing…”
MethodHandbook of Partial Least Squares: Concepts, Methods and Applications
(2010) · Springer eBooks · doi:10.1007/978-3-540-32827-8 · Cited by 2,605
Self-citationHair, J. F., Sarstedt, M., Pieper, T. M., & Ringle, C. M. (2012) · Long Range Planning · doi:10.1016/j.lrp.2012.09.008 · Cited by 2,354 · cited 7×
“Reviews of PLS use suggest that these recommendations have been widely applied in published research in the fields of management information systems (Ringle et al. 2012), marketing (Hair et al. 2012a), and strategic management (Hair et al. 2012b).”
BackgroundMethodResultInfluentialSelf-citationLatent Variable Path Modeling with Partial Least Squares
Lohmöller, J.-B. (1989) · Physica-Verlag eBooks · doi:10.1007/978-3-642-52512-4 · Cited by 2,136 · cited 3×
“Variance-based SEM methods—such as partial least squares path modeling (PLS; Lohmöller 1989; Wold 1982), generalized structured component analysis (GSCA; Henseler 2012; Hwang and Takane 2004), regularized generalized canonical correlation analysis (Tenenhaus and Tenenhaus 2011), and best fitting…”
BackgroundMethodNetemeyer, R., Bearden, W., & Sharma, S. (2003) · Sage eBooks · doi:10.4135/9781412985772 · Cited by 2,118
(2003) · Cited by 2,093
Representing and Testing Organizational Theories: A Holistic Construal
Bagozzi, R. P., & Phillips, L. W. (1982) · Administrative Science Quarterly · doi:10.2307/2392322 · Cited by 2,064 · cited 5×
“…Magdeburg, Magdeburg, Germany M. Sarstedt (*) University of Newcastle, Newcastle, Australia e-mail: marko.sarstedt@ovgu.de In this paper, we focus on examining discriminant validity as one of the key building blocks of model evaluation (e.g.,Bagozzi and Phillips 1982; Hair et al. 2010).”
BackgroundMethodInfluentialShaffer, J. P. (1995) · Annual Review of Psychology · doi:10.1146/annurev.ps.46.020195.003021 · Cited by 1,960
Goodness-of-fit indices for partial least squares path modeling
Henseler, J., & Sarstedt, M. (2013) · Computational Statistics · doi:10.1007/s00180-012-0317-1 · Cited by 1,842 · cited 2×
“80, analogous to the loading patterns employed in previous simulation studies on variance-based SEM (e.g., Goodhue et al. 2012; Henseler and Sarstedt 2013; Reinartz et al. 2009).”
MethodInfluentialSelf-citationDiamantopoulos, A., Sarstedt, M., Fuchs, C., Wilczynski, P., & Kaiser, S. (2012) · Journal of the Academy of Marketing Science · doi:10.1007/s11747-011-0300-3 · Cited by 1,736 · cited 2×
“At least two expert coders should conduct this judgment independently to ensure a high degree of objectivity (Diamantopoulos et al. 2012).”
BackgroundSelf-citationA Beginner's Guide to Partial Least Squares Analysis
Haenlein, M., & Kaplan, A. M. (2004) · Understanding Statistics · doi:10.1207/s15328031us0304_4 · Cited by 1,694 · cited 20×
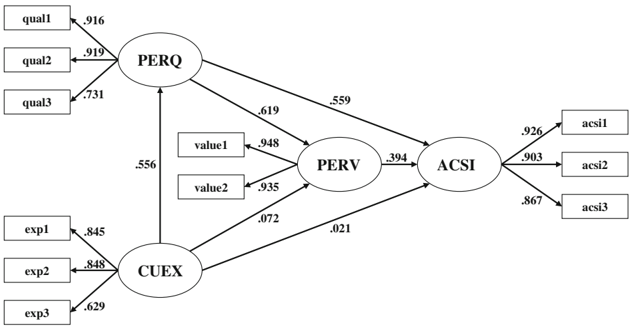
“Figure 7 shows the reduced ACSI model and the PLS results.”
BackgroundInfluentialPeng, D. X., & Lai, F. (2012) · Journal of Operations Management · doi:10.1016/j.jom.2012.06.002 · Cited by 1,532 · cited 2×
“2011; Rigdon 2014; Tenenhaus and Tenenhaus 2011), as well as its frequent application across different disciplines, demonstrate (e.g., Hair et al. 2012a, b; Lee et al. 2011; Peng and Lai 2012; Ringle et al. 2012).”
BackgroundWold, H. (2005) · Encyclopedia of Statistical Sciences · doi:10.1002/0471667196.ess1914.pub2 · Cited by 1,524
Trust and Electronic Government Success: An Empirical Study
Teo, T. S. H., Srivastava, S. C., & Jiang, L. (2008) · Journal of Management Information Systems · doi:10.2753/mis0742-1222250303 · Cited by 1,400 · cited 2×
“Some authors suggest a threshold of 0.85 (Clark andWatson 1995; Kline 2011), whereas others propose a value of 0.90 (Gold et al. 2001; Teo et al. 2008).”
BackgroundInfluentialSoft modelling: The Basic Design and Some Extensions
Wold, H. (1982) · Medical Entomology and Zoology · Cited by 1,314
Macmillan, N. A., & Creelman, C. D. (2004) · doi:10.4324/9781410611147 · Cited by 1,269
Consistent and asymptotically normal PLS estimators for linear structural equations
Dijkstra, T. K., & Henseler, J. (2015) · Computational Statistics & Data Analysis · doi:10.1016/j.csda.2014.07.008 · Cited by 1,204
Self-citationEvaluation of Structural Equation Models Using the Partial Least Squares (PLS) Approach
Götz, O., Liehr-Gobbers, K., & Krafft, M. (2010) · Handbook of Partial Least Squares · doi:10.1007/978-3-540-32827-8_30 · Cited by 1,194 · cited 1×
“The evaluation of the PLS results meets the relevant criteria (Chin 1998, 2010; Götz et al. 2010; Hair et al. 2012a), which Ringle et al. (2010), using this example, presented in detail.”
Advanced Methods of Marketing Research
Bagozzi, R. P. (1994) · Cited by 1,159
Web Based Knowledge Infrastructures for the Sciences: An Adaptive Document
Hars, A. (2000) · Communications of the Association for Information Systems · doi:10.17705/1cais.00401 · Cited by 1,140
Use of structural equation modeling in operations management research: Looking back and forward
Shah, R., & Goldstein, S. M. (2006) · Journal of Operations Management · doi:10.1016/j.jom.2005.05.001 · Cited by 976 · cited 1×
“Specifically, the Fornell-Larcker criterion is a standard approach to assess discriminant validity in covariance-based SEM (Shah and Goldstein 2006; Shook et al. 2004).”
MethodScandinavian Journal of Statistics
(2010) · Scandinavian Journal of Statistics · doi:10.1111/(issn)1467-9469 · Cited by 976
Insufficient discriminant validity: a comment on Bove, Pervan, Beatty, and Shiu (2009)
Farrell, A. M. (2010) · Journal of Business Research · doi:10.1016/j.jbusres.2009.05.003 · Cited by 914
Rethinking Partial Least Squares Path Modeling: In Praise of Simple Methods
Rigdon, E. E. (2012) · Long Range Planning · doi:10.1016/j.lrp.2012.09.010 · Cited by 877 · cited 2×
“…process (Bagozzi and Phillips 1982; Bagozzi 1984), perhaps the most influential psychometric framework for measurement development and validation (Rigdon 2012), constructs are not necessarily equivalent to the theoretical concepts at the center of scientific research: a construct should rather…”
BackgroundRoldán, J. L., & Sánchez-Franco, M. J. (2012) · Research Methodologies, Innovations and Philosophies in Software Systems Engineering and Information Systems · doi:10.4018/978-1-4666-0179-6.ch010 · Cited by 869
An assessment of the use of structural equation modeling in strategic management research
Shook, C. L., Ketchen, D. J., Hult, G. T. M., & Kacmar, K. M. (2004) · Strategic Management Journal · doi:10.1002/smj.385 · Cited by 816 · cited 2×
“Specifically, the Fornell-Larcker criterion is a standard approach to assess discriminant validity in covariance-based SEM (Shah and Goldstein 2006; Shook et al. 2004).”
BackgroundMethodA Concise Guide to Market Research
Mooi, E., & Sarstedt, M. (2011) · Springer eBooks · doi:10.1007/978-3-642-12541-6 · Cited by 716
Self-citationConfirmatory tetrad analysis in PLS path modeling
Gudergan, S. P., Ringle, C. M., Wende, S., & Will, A. (2008) · Journal of Business Research · doi:10.1016/j.jbusres.2008.01.012 · Cited by 704 · cited 1×
“The Bonferroni approach does not rely on any distributional assumptions about the data, making it particularly suitable in the context of variance-based SEM techniques such as PLS (Gudergan et al. 2008).”
MethodSelf-citationFoundations of Factor Analysis
Mulaik, S. A. (2009) · Chapman & Hall/CRC eBooks · doi:10.1201/b15851 · Cited by 639
Handbook of Research Methods. in Social and Personality Psychology
Lai, H. L. T. (2000) · Cited by 629
semPLS: Structural Equation Modeling Using Partial Least Squares
Monecke, A., & Leisch, F. (2012) · Journal of Statistical Software · doi:10.18637/jss.v048.i03 · Cited by 616 · cited 3×
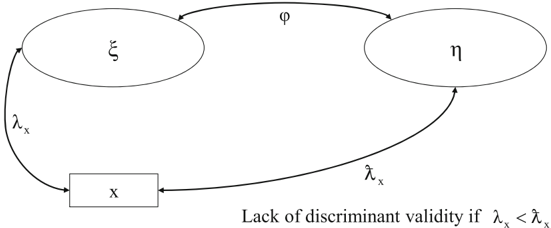
“In essence, as suggested by Nunnally (1978) and Netemeyer et al. (2003), the HTMT approach is an estimate of the correlation between the constructs ξi and ξj (see the Appendix for the derivation), which parallels the disattenuated construct score correlation.”
BackgroundMethodInfluentialRecommendations for APA test standards regarding construct, trait, or discriminant validity.
Campbell, D. T. (1960) · American Psychologist · doi:10.1037/h0048255 · Cited by 560 · cited 1×
“Technically, discriminant validity requires that “a test not correlate too highly with measures from which it is supposed to differ” (Campbell 1960, p. 548).”
BackgroundFoundations of the American Customer Satisfaction Index
Anderson, E. W., & Fornell, C. (2000) · Total Quality Management · doi:10.1080/09544120050135425 · Cited by 553 · cited 2×
“To illustrate the approaches, we draw on the American Customer Satisfaction Index (ACSI) model (Anderson and Fornell 2000; Fornell et al. 1996), using empirical data from the first quarter of 1999 with N=10,417 observations after excluding cases with missing data from the indicators used for model estimation (case wis…”
MethodSosik, J. J., Kahai, S. S., & Piovoso, M. J. (2009) · Group & Organization Management · doi:10.1177/1059601108329198 · Cited by 513
Information Privacy: Corporate Management and National Regulation
Milberg, S. J., Smith, H. J., & Burke, S. J. (2000) · Organization Science · doi:10.1287/orsc.11.1.35.12567 · Cited by 504 · cited 2×
“These alternatives include testing whether the latent variable correlations are significantly different from one another (Milberg et al. 2000) and running separate confirmatory factor analyses prior to employing variance-based SEM (Cording et al.”
MethodA Concise Guide to Market Research: The Process, Data, and Methods Using IBM SPSS Statistics
Sarstedt, M., & Mooi, E. (2014) · Springer Texts in Business and Economics · doi:10.1007/978-3-642-53965-7 · Cited by 448
Self-citationQuality Management in Systems Development: An Organizational System Perspective1
Ravichandran, T., & Rai, A. (2000) · MIS Quarterly · doi:10.2307/3250967 · Cited by 442 · cited 2×
“2000) and running separate confirmatory factor analyses prior to employing variance-based SEM (Cording et al. 2008; Pavlou et al. 2007; Ravichandran and Rai 2000) by using, for example, Anderson and Gerbing's (1988) test as the standard.”
MethodA Critical Examination of Common Beliefs About Partial Least Squares Path Modeling
Rönkkö, M., & Evermann, J. (2013) · Organizational Research Methods · doi:10.1177/1094428112474693 · Cited by 434 · cited 2×
“In addition, we find that the sensitivity of the 5 We thankMikko Rönkkö and Joerg Evermann for providing us with the code of their simulation study (Rönkkö and Evermann 2013), which helped us localize this error in their analysis.”
BackgroundInterfirm Strategic Information Flows in Logistics Supply Chain Relationships1
Klein, R., & Rai, A. (2009) · MIS Quarterly · doi:10.2307/20650325 · Cited by 434 · cited 1×
“One of the few exceptions is the research by Klein and Rai (2009), who suggest examining the crossloadings of formative indicators.”
BackgroundA Prospectus for Theory Construction in Marketing
Bagozzi, R. P. (1984) · Journal of Marketing · doi:10.1177/002224298404800102 · Cited by 426 · cited 2×
“According to the holistic construal process (Bagozzi and Phillips 1982; Bagozzi 1984), perhaps the most influential psychometric framework for measurement development and validation (Rigdon 2012), constructs are not necessarily equivalent to the theoretical concepts at the center of scientific…”
MethodOn the use of partial least squares path modeling in accounting research
Lee, L., Petter, S., Fayard, D., & Robinson, S. (2011) · International Journal of Accounting Information Systems · doi:10.1016/j.accinf.2011.05.002 · Cited by 389 · cited 2×
“2011; Rigdon 2014; Tenenhaus and Tenenhaus 2011), as well as its frequent application across different disciplines, demonstrate (e.g., Hair et al. 2012a, b; Lee et al. 2011; Peng and Lai 2012; Ringle et al. 2012).”
Background(2000) · Cited by 375
Diffusing the internet in the arab world: the role of social norms and technological culturation
Loch, K. D., Straub, D. W., & Kamel, S. (2003) · IEEE Transactions on Engineering Management · doi:10.1109/tem.2002.808257 · Cited by 371
Regularized Generalized Canonical Correlation Analysis
Tenenhaus, A., & Tenenhaus, M. (2011) · Psychometrika · doi:10.1007/s11336-011-9206-8 · Cited by 368
Monte Carlo Experiments: Design and Implementation
Paxton, P., Curran, P. J., Bollen, K. A., Kirby, J., & Chen, F. (2001) · Structural Equation Modeling: A Multidisciplinary Journal · doi:10.1207/s15328007sem0802_7 · Cited by 344
Generalized Structured Component Analysis
Hwang, H., & Takane, Y. (2004) · Psychometrika · doi:10.1007/bf02295841 · Cited by 337 · cited 2×
“Variance-based SEM methods—such as partial least squares path modeling (PLS; Lohmöller 1989; Wold 1982), generalized structured component analysis (GSCA; Henseler 2012; Hwang and Takane 2004), regularized generalized canonical correlation analysis (Tenenhaus and Tenenhaus 2011), and best fitting proper indices (Dijkst…”
MethodPath Analysis with Composite Variables
McDonald, R. P. (1996) · Multivariate Behavioral Research · doi:10.1207/s15327906mbr3102_5 · Cited by 332 · cited 2×
“The design of the Monte Carlo simulation was motivated by the objective to define models that (1) allow for the assessment of approaches’ sensitivity and specificity with regard to detecting a lack of discriminant validity and (2) resemble setups commonly encountered in applied research (Paxton et al. 2001). In line w…”
Method(2016) · Multi-Label Dimensionality Reduction · doi:10.1201/b16017-6 · Cited by 321
CORDING, M., CHRISTMANN, P., & KING, D. R. (2008) · Academy of Management Journal · doi:10.5465/amj.2008.33665279 · Cited by 313 · cited 2×
“…different from one another (Milberg et al. 2000) and running separate confirmatory factor analyses prior to employing variance-based SEM (Cording et al. 2008; Pavlou et al. 2007; Ravichandran and Rai 2000) by using, for example, Anderson and Gerbing's (1988) test as the standard.1 While…”
MethodMethodology Review: Analysis of Multitrait-Multimethod Matrices
Schmitt, N., & Stults, D. M. (1986) · Applied Psychological Measurement · doi:10.1177/014662168601000101 · Cited by 311 · cited 3×
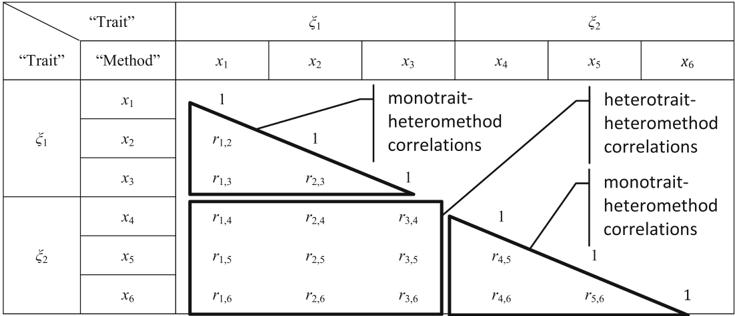
“What if the order is not as expected in only a few incidents? It cannot be ruled out that some heterotraitheteromethod correlations exceed monotrait-heteromethod correlations, although the two constructs do in fact differ (Schmitt and Stults 1986).”
BackgroundDoes PLS have advantages for small sample size or non-normal data?
Goodhue, D. L., Lewis, W. W., & Thompson, R. L. (2012) · MIS Quarterly · doi:10.5555/2481655.2481672 · Cited by 297
Peter, J. P., & Churchill, G. A. (1986) · Journal of Marketing Research · doi:10.2307/3151771 · Cited by 252 · cited 1×
“The estimated strength of these relationships, most notably between the latent variables, can only be meaningfully interpreted if construct validity was established (Peter and Churchill 1986).”
BackgroundA Comparative Study on Parameter Recovery of Three Approaches to Structural Equation Modeling
Hwang, H., Malhotra, N. K., Kim, Y., Tomiuk, M. A., & Hong, S. (2010) · Journal of Marketing Research · doi:10.1509/jmkr.47.4.699 · Cited by 240 · cited 2×
“…structural equation modeling (SEM) is growing in popularity, which the plethora of recent developments and discussions (e.g., Henseler et al. 2014; Hwang et al. 2010; Lu et al. 2011; Rigdon 2014; Tenenhaus and Tenenhaus 2011), as well as its frequent application across different disciplines,…”
BackgroundRethinking Partial Least Squares Path Modeling: Breaking Chains and Forging Ahead
Rigdon, E. E. (2014) · Long Range Planning · doi:10.1016/j.lrp.2014.02.003 · Cited by 228 · cited 5×
“…(Aguirre-Urreta et al. 2013).2 Furthermore, each indicator’s error variance is also included in the composite (e.g., Bollen and Lennox 1991), which increases the validity gap between the construct and the composite (Rigdon 2014) and, ultimately, compounds the inflation in the loading estimates.”
BackgroundInfluentialDijkstra, T. K. (2008) · Springer US · Cited by 212
Genetic algorithm segmentation in partial least squares structural equation modeling
Ringle, C. M., Sarstedt, M., & Schlittgen, R. (2014) · OR Spectrum · doi:10.1007/s00291-013-0320-0 · Cited by 177 · cited 2×
“In line with prior studies (Ringle et al. 2010, 2014) that used this dataset in their ACSI model examples, we rely on a modified version of the ACSI model without the constructs complaints (dummycoded indicator) and loyalty (more than 80% of the cases for this construct measurement are missing).”
BackgroundMethodSelf-citationRingle, C. M., Sarstedt, M., & Mooi, E. A. (2010) · Annals of Information Systems · doi:10.1007/978-1-4419-1280-0_2 · Cited by 162
Self-citationDijkstra, T. K. (2014) · Long Range Planning · doi:10.1016/j.lrp.2014.02.004 · Cited by 152 · cited 20×
“Figure 7 shows the reduced ACSI model and the PLS results.”
InfluentialA Prospectus for Theory Construction in Marketing
Bagozzi, R. P. (1984) · Journal of Marketing · doi:10.2307/1251307 · Cited by 145
Henseler, J. (2012) · Journal of the Academy of Marketing Science · doi:10.1007/s11747-011-0298-6 · Cited by 143 · cited 2×
“Variance-based SEM methods—such as partial least squares path modeling (PLS; Lohmöller 1989; Wold 1982), generalized structured component analysis (GSCA; Henseler 2012; Hwang and Takane 2004), regularized generalized canonical correlation analysis (Tenenhaus and Tenenhaus 2011), and best fitting proper indices (Dijkst…”
MethodSelf-citationLu, I. R. R., Kwan, E., Thomas, D. R., & Cedzynski, M. (2011) · International Journal of Research in Marketing · doi:10.1016/j.ijresmar.2011.03.006 · Cited by 122 · cited 2×
“…modeling (SEM) is growing in popularity, which the plethora of recent developments and discussions (e.g., Henseler et al. 2014; Hwang et al. 2010; Lu et al. 2011; Rigdon 2014; Tenenhaus and Tenenhaus 2011), as well as its frequent application across different disciplines, demonstrate (e.g., Hair…”
BackgroundRingle, C. M., Sarstedt, M., & Mooi, E. (2010) · tub.dok (Hamburg University of Technology) · Cited by 111
Self-citationDijkstra, T. K., & Henseler, J. (2011) · Quality & Quantity · doi:10.1007/s11135-010-9359-z · Cited by 106 · cited 2×
“Variance-based SEM methods—such as partial least squares path modeling (PLS; Lohmöller 1989; Wold 1982), generalized structured component analysis (GSCA; Henseler 2012; Hwang and Takane 2004), regularized generalized canonical correlation analysis (Tenenhaus and Tenenhaus 2011), and best fitting proper indices (Dijkst…”
BackgroundMethodSelf-citationVilares, M. J., Almeida, M. H., & Coelho, P. S. (2009) · Springer eBooks · doi:10.1007/978-3-540-32827-8_14 · Cited by 93 · cited 1×
“In line with Vilares et al. (2010), as well as Vilares and Coelho (2013), we generate 1,000 datasets for each combination of design factors.”
BackgroundAguirre-Urreta, M. I., Marakas, G. M., & Ellis, M. E. (2013) · ACM SIGMIS Database the DATABASE for Advances in Information Systems · doi:10.1145/2544415.2544417 · Cited by 75 · cited 2×
“As a result, the degree of overlap between each indicator and composite will be high, yielding inflated loading estimates, especially if the number of indicators per construct (composite) is small (Aguirre-Urreta et al. 2013).”
BackgroundPath Analysis of Multitrait-Multimethod Matrices
Schmitt, N. (1978) · Applied Psychological Measurement · doi:10.1177/014662167800200201 · Cited by 75 · cited 1×
“Therefore, this approach does not suffer from the standard MTMM approach’s well-known issues regarding data requirements and parallel measures (Schmitt 1978; Schmitt and Stults 1986).”
BackgroundMarcoulides, G. A., Chin, & Saunders, C. (2012) · MIS Quarterly · doi:10.2307/41703477 · Cited by 62 · cited 3×
“Similar to the loadings, variance-based SEM methods generally underestimate structural model relationships (e.g., Reinartz et al. 2009; Marcoulides, Chin, and Saunders 2012).”
MethodResultVilares, M. J., & Coelho, P. S. (2013) · Studies in theoretical and applied statistics. Selected papers of the statistical societies · doi:10.1007/978-3-642-34904-1_2 · Cited by 9 · cited 6×
“Similar to the loadings, variance-based SEM methods generally underestimate structural model relationships (e.g., Reinartz et al. 2009; Marcoulides, Chin, and Saunders 2012).”
BackgroundInfluential(1992)
Use of partial least squares (PLS) in strategic management research: a review of four recent studies
Hulland, J. (1999) · Strategic Management Journal · doi:10.1002/(sici)1097-0266(199902)20:2<195::aid-smj13>3.0.co;2-7
Research works printed but not linked: 3
- Gefen, D., Straub, D. W., & Boudreau, M.-C. (2000). Structural equation modeling techniques and regression: guidelines for research practice. Communications of the AIS, 4, 1–78.
- Nunnally, J. (1978). Psychometric theory (2nd ed.). New York: McGraw-Hill.
- Ringle, C. M., Sarstedt, M., & Straub, D. W. (2012). A critical look at the use of PLS-SEM in MIS Quarterly. MIS Quarterly, 36(1), iii–xiv.
Cited by
When to Use and How to Report the Results of PLS-SEM
Hair, J. F., Risher, J. J., Sarstedt, M., & Ringle, C. M. (2019) · European Business Review · doi:10.1108/ebr-11-2018-0203 · Cited by 27,541
Self-citationPartial Least Squares Structural Equation Modeling (PLS-SEM) Using R: A Workbook
Hair, J. F., Hult, G. T. M., Ringle, C. M., Sarstedt, M., Danks, N. P., & Ray, S. (2021) · Classroom Companion: Business · doi:10.1007/978-3-030-80519-7 · Cited by 10,343
Self-citationUsing pls path modeling in new technology research: updated guidelines
Henseler, J., Hubona, G., & Ray, P. A. (2016) · Industrial Management & Data Systems · doi:10.1108/imds-09-2015-0382 · Cited by 7,173
“…such as bootstrap-based tests of overall model fit (Dijkstra and Henseler, 2015a), consistent PLS (PLSc) to estimate factor models (see Dijkstra and Henseler, 2015b), and the heterotrait-monotrait ratio of correlations (HTMT) as a new criterion for discriminant validity (see Henseler et al., 2015).”
BackgroundMethodSelf-citationAssessing measurement model quality in PLS-SEM using confirmatory composite analysis
Hair, J. F., Howard, M. C., & Nitzl, C. (2020) · Journal of Business Research · doi:10.1016/j.jbusres.2019.11.069 · Cited by 5,446
“One stream of research has suggested GOF indices, which are typically used in CFA, are also applicable in a CCA (Dijkstra & Henseler, 2015; Henseler et al., 2014; Schuberth, Henseler, & Dijkstra, 2018).”
BackgroundPredictive model assessment in PLS-SEM: guidelines for using PLSpredict
Shmueli, G., Sarstedt, M., Hair, J. F., Cheah, J.-H., Ting, H., Vaithilingam, S., & Ringle, C. M. (2019) · European Journal of Marketing · doi:10.1108/ejm-02-2019-0189 · Cited by 4,618
Self-citation
Metadata
- Authors
- Henseler, J., Ringle, C. M., & Sarstedt, M.
- Affiliations
- Universidade Nova de Lisboa (PT)
- University of Newcastle Australia (AU)
- Corresponding author
- Sarstedt, Marko
- Venue
- Journal of the Academy of Marketing Science
- Published
- 2014-08-22
- Volume
- 43
- Issue
- 1
- Pages
- 115-135
- ISSN
- 0092-0703 (ISSN-L)
- 1552-7824
- OpenAlex
- W2105846236
- Cited by
- 38,459
- References
- 112
- Citations by year
- 2026: 9160 · 2025: 7076 · 2024: 5683 · 2023: 5082 · 2022: 4007 · 2021: 2951 · 2020: 1857 · 2019: 1210 · 2018: 761 · 2017: 384 · 2016: 208 · 2015: 58 · 2014: 7
- FWCI
- 276.66
- Type
- journal article
- Language
- en
- Open access
- hybrid
- doi.org
- Locations
- Journal of the Academy of Marketing Science (publishedVersion, cc-by)
- New University of Lisbon's Repository (New University of Lisbon) (publishedVersion, other-oa)
- University of Twente Research Information (acceptedVersion, cc-by)
- Figshare (submittedVersion, cc-by)
- Portuguese National Funding Agency for Science, Research and Technology (RCAAP Project by FCT) (submittedVersion, other-oa)
- tub.dok (Hamburg University of Technology) (submittedVersion)
- NOVA (University of Newcastle Australia) (submittedVersion, cc-by)
- University of Twente Research Information (submittedVersion, cc-by)
- Funders
- Rijksuniversiteit Groningen
- Radboud Universiteit
- Topics
- Social Sciences › Decision Sciences › Management Science and Operations Research › Psychometric Methodologies and Testing
- Physical Sciences › Mathematics › Statistics and Probability › Statistical Methods and Applications
- Social Sciences › Business, Management and Accounting › Strategy and Management › Business Strategies and Management Research
- Keywords
- discriminant validity, partial least squares, cross-loadings, multitrait-multimethod matrix, latent variables, measurement validity
About these checks
Registry, retraction, Cites and statistics results are computed, not judged, with one exception: a printed reference that no index lists is read once by a model before it counts as a citation error. Claims are extracted by a model and kept only when their quote appears verbatim in the text; each cited source is then checked, with a model’s help, for whether it says what the claim relies on. Those verdicts can be wrong — read the claim’s quote and the cited source before relying on one.
Statistics and arithmetic are recomputed, not judged.
Confidence bands are shown only for fields calibrated on our annotated test set. None is calibrated yet, so no band is shown.
What counts as a claim ›How we measure confidence ›How we check this ›
Are you an author, or do you see a problem with this page? Request a review
Data sources
Bibliographic data: Semantic Scholar, OpenAlex, Crossref.
Contains information from the Semantic Scholar Academic Graph Datasets, made available under the ODC Attribution License (ODC-BY 1.0).
Semantic Scholar’s data is described in: Kinney, R., et al. (2023). The Semantic Scholar Open Data Platform. arXiv:2301.10140.
