

The DOI matches its Crossref record; 51 of the 52 references it cites were found in a registry or an index; none of the 28 sources its claims cite is checked for support yet.
Decoding Sound and Imagery Content in Early Visual Cortex
Open accessAbstract
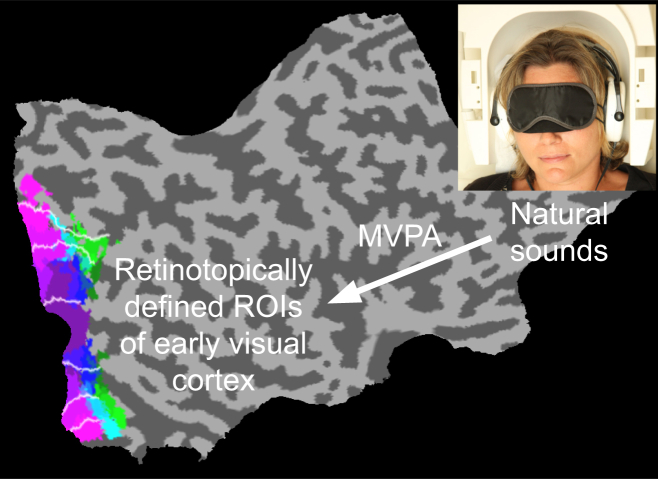
Human early visual cortex was traditionally thought to process simple visual features such as orientation, contrast, and spatial frequency via feedforward input from the lateral geniculate nucleus (e.g., [1]). However, the role of nonretinal influence on early visual cortex is so far insufficiently investigated despite much evidence that feedback connections greatly outnumber feedforward connections [2-5]. Here, we explored in five fMRI experiments how information originating from audition and imagery affects the brain activity patterns in early visual cortex in the absence of any feedforward visual stimulation. We show that category-specific information from both complex natural sounds and imagery can be read out from early visual cortex activity in blindfolded participants. The coding of nonretinal information in the activity patterns of early visual cortex is common across actual auditory perception and imagery and may be mediated by higher-level multisensory areas. Furthermore, this coding is robust to mild manipulations of attention and working memory but affected by orthogonal, cognitively demanding visuospatial processing. Crucially, the information fed down to early visual cortex is category specific and generalizes to sound exemplars of the same category, providing evidence for abstract information feedback rather than precise pictorial feedback. Our results suggest that early visual cortex receives nonretinal input from other brain areas when it is generated by auditory perception and/or imagery, and this input carries common abstract information. Our findings are compatible with feedback of predictive information to the earliest visual input level (e.g., [6]), in line with predictive coding models [7-10].
Overview
AI snapshot
Written from the paper’s full text.
TL;DR
Using fMRI and multivariate pattern analysis in blindfolded participants, this paper shows that category-specific information from natural sounds and auditory imagery can be decoded from early visual cortex activity without feedforward visual stimulation. The feedback appears abstract/categorical rather than pictorial, is robust to mild attention/working-memory interference, and is disrupted by demanding visuospatial processing.
Key findings
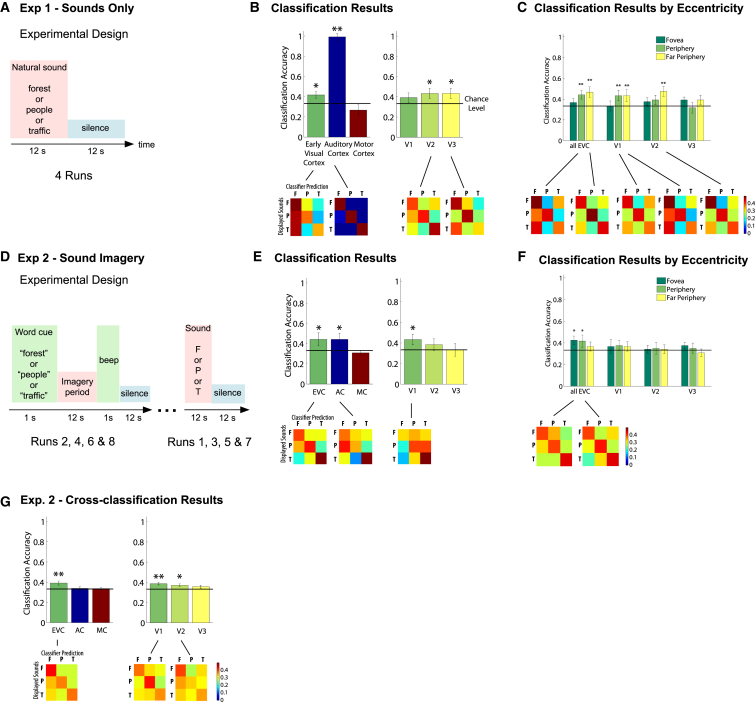
- In experiment 1, a linear SVM discriminated three natural sounds (bird singing, traffic noise, talking crowd) from early visual cortex, particularly V2 and V3, at about 42%; classification also succeeded in auditory cortex but not motor cortex.
- In experiment 2, imagined sounds were decoded from V1 and auditory cortex, and cross-classification between sound perception and imagery succeeded in V1 and V2, indicating shared activity patterns across real and imagined sounds.
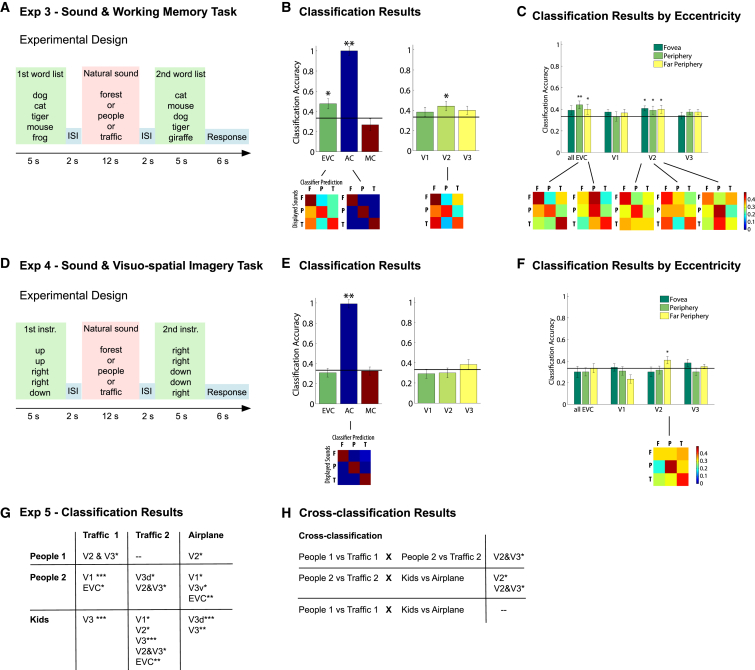
- In experiment 3, decoding during natural sound stimulation remained successful mainly in peripheral regions and consistently in V2 despite an orthogonal auditory working-memory task; in experiment 4, a demanding visuospatial imagery task left only residual above-chance classification in far-peripheral V2.
- In experiment 5, “human” versus “inanimate” sound categories were classified in several early visual areas for eight out of nine exemplar combinations, and cross-classification across different exemplars within a category succeeded in V2 and V3 in two out of three combinations, supporting abstract/categorical feedback rather than precise pictorial reinstatement.
Methods
- Five fMRI experiments with blindfolded participants omitted visual stimulation while subjects listened to natural sounds, imagined sounds from word cues, or performed orthogonal cognitive tasks during sound stimulation.
- Activity patterns were extracted from retinotopically mapped V1, V2, and V3 and analyzed with multivariate pattern classification, primarily a linear support vector machine; whole-brain searchlight analyses identified other regions carrying sound/imagery content.
- Univariate GLM analyses tested whether decoding was driven by positive activation or deactivation; cross-classification tested generalization between perception and imagery and across sound exemplars within categories.
Limitations
- The paper states that classification accuracies were relatively low, describing the results as proof of principle and robust across subject and stimulus samples.
- The paper notes that without feedforward stimulation, it is difficult to study the functional role of nonretinal feedback in actual visual perception.
- The paper states that whether the proposed pathways play a causal role in inducing differential activity patterns remains to be investigated; the provided text also does not report exact sample sizes per experiment.
Model-written summary. Check it against the paper before relying on it.
Integrity signals
Registry
Cites
Statistics
Figures
Verification
Claims the paper makes
20 Own interpretation · 15 Own result · 10 Not checked yet
A result the paper reports from its own data — it cites no other source for it, so there is none to check. The quote shows it is in the paper.
In the paper
“Crucially, cross-classification succeeded in V2 and V3 in two out of three combinations, i.e., training the classifier for the pair “traffic 1” versus “people 1” lead to successful classification of “traffic 2” versus “people 2,” and training the classifier for the pair “traffic 2” versus “people 2” lead to successful classification of “airplane” versus “kids” (Figure 3H; Table S1).”
§ Decoding Sound and Imagery Content in Early Visual Cortex > Results > Category Specificity of the Information Fed Back to Early Visual Cortex
plaincorrelational- Asserted: passes — The authors put it forward as true.
- Checkable: passes — It can be checked against evidence.
- Load-bearing: passes — The paper’s conclusions depend on it.
- Based: passes — The paper gives a reason why it holds.
A result the paper reports from its own data — it cites no other source for it, so there is none to check. The quote shows it is in the paper.
In the paper
“Cross-classification succeeded in V1 and V2 (Figure 2G).”
§ Decoding Sound and Imagery Content in Early Visual Cortex > Results > Decoding of Sound and Imagery Content in Early Visual Cortex
plaincorrelational- Asserted: passes — The authors put it forward as true.
- Checkable: passes — It can be checked against evidence.
- Load-bearing: passes — The paper’s conclusions depend on it.
- Based: passes — The paper gives a reason why it holds.
A result the paper reports from its own data — it cites no other source for it, so there is none to check. The quote shows it is in the paper.
In the paper
“In auditory cortex, cross-classification did not succeed, indicating that activity patterns induced by feedforward auditory stimulation are coded differently than those induced by feedback through auditory imagery.”
§ Decoding Sound and Imagery Content in Early Visual Cortex > Results > Decoding of Sound and Imagery Content in Early Visual Cortex
plain- Asserted: passes — The authors put it forward as true.
- Checkable: passes — It can be checked against evidence.
- Load-bearing: passes — The paper’s conclusions depend on it.
- Based: passes — The paper gives a reason why it holds.
A result the paper reports from its own data — it cites no other source for it, so there is none to check. The quote shows it is in the paper.
In the paper
“In experiments 3 and 4, the secondary tasks activated early visual areas consistent with an engagement of object attention.”
§ Decoding Sound and Imagery Content in Early Visual Cortex > Results > Univariate Activation Profile
plaincorrelational- Asserted: passes — The authors put it forward as true.
- Checkable: passes — It can be checked against evidence.
- Load-bearing: unclear — It is unclear whether the paper’s conclusions depend on it.
- Based: passes — The paper gives a reason why it holds.
A result the paper reports from its own data — it cites no other source for it, so there is none to check. The quote shows it is in the paper.
In the paper
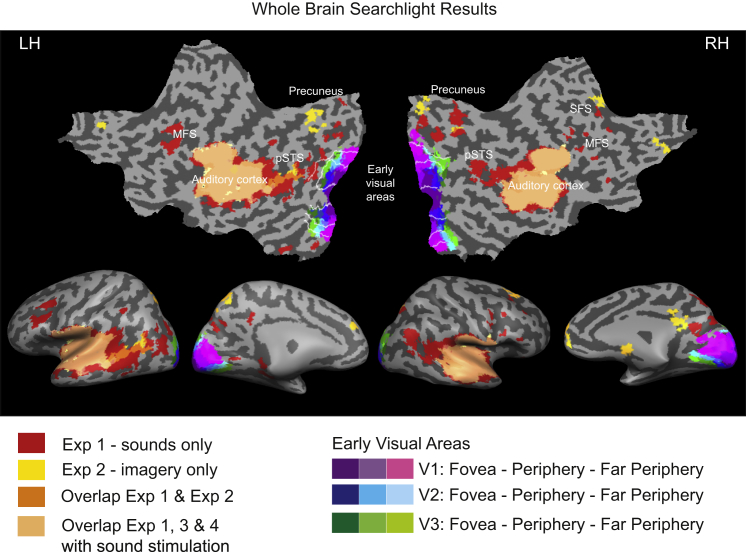
“In experiments 1 and 2, real and imagined sounds could be decoded in parts of the precuneus and in posterior superior temporal sulcus (pSTS) (see overlapping regions in Figure 4).”
§ Decoding Sound and Imagery Content in Early Visual Cortex > Results > Whole-Brain Searchlight Results
hedgedcorrelational- Asserted: passes — The authors put it forward as true.
- Checkable: passes — It can be checked against evidence.
- Load-bearing: passes — The paper’s conclusions depend on it.
- Based: passes — The paper gives a reason why it holds.
A result the paper reports from its own data — it cites no other source for it, so there is none to check. The quote shows it is in the paper.
In the paper
“Sounds and, to a lesser extent, imagined sounds were successfully classified in a network of frontal regions, including superior and middle frontal sulci.”
§ Decoding Sound and Imagery Content in Early Visual Cortex > Results > Whole-Brain Searchlight Results
plaincorrelational- Asserted: passes — The authors put it forward as true.
- Checkable: passes — It can be checked against evidence.
- Load-bearing: unclear — It is unclear whether the paper’s conclusions depend on it.
- Based: passes — The paper gives a reason why it holds.
A result the paper reports from its own data — it cites no other source for it, so there is none to check. The quote shows it is in the paper.
In the paper
“Activity patterns during natural sound stimulation were again successfully decoded from early visual cortex, mainly in peripheral regions and consistently in V2 (Figures 3B and 3C). This demonstrates that simultaneous retention of orthogonal contents in working memory did not strongly affect classification.”
§ Decoding Sound and Imagery Content in Early Visual Cortex > Results > Decoding of Sounds while Manipulating Cognitive Resources
boosted- Asserted: passes — The authors put it forward as true.
- Checkable: passes — It can be checked against evidence.
- Load-bearing: passes — The paper’s conclusions depend on it.
- Based: passes — The paper gives a reason why it holds.
A result the paper reports from its own data — it cites no other source for it, so there is none to check. The quote shows it is in the paper.
In the paper
“The classifier successfully discriminated the three different sounds in early visual cortex, particularly in V2 and V3 (at ∼42%; see Figure 2; for results with increased statistical power, see Figure S1A).”
- Also stated in: § Decoding of Sound and Imagery Content in Early Visual Cortex · plain
“Hence, activity patterns in early visual cortex contained sufficient information from auditory stimulation to allow the content-specific discrimination of natural sounds.”
§ Decoding Sound and Imagery Content in Early Visual Cortex > Results > Decoding of Sound and Imagery Content in Early Visual Cortex
plaincorrelational- Asserted: passes — The authors put it forward as true.
- Checkable: passes — It can be checked against evidence.
- Load-bearing: passes — The paper’s conclusions depend on it.
- Based: passes — The paper gives a reason why it holds.
- Also stated in: § Decoding of Sound and Imagery Content in Early Visual Cortex · plain
A result the paper reports from its own data — it cites no other source for it, so there is none to check. The quote shows it is in the paper.
In the paper
“The univariate activity profile also showed that classification was not driven by one sound eliciting more attention-related activity than another sound (Figure S3).”
§ Decoding Sound and Imagery Content in Early Visual Cortex > Discussion
plain- Asserted: passes — The authors put it forward as true.
- Checkable: passes — It can be checked against evidence.
- Load-bearing: passes — The paper’s conclusions depend on it.
- Based: passes — The paper gives a reason why it holds.
A result the paper reports from its own data — it cites no other source for it, so there is none to check. The quote shows it is in the paper.
In the paper
“Unsurprisingly, sounds could be decoded in a large part of bilateral superior temporal sulcus mostly belonging to auditory cortex (Figure 4).”
§ Decoding Sound and Imagery Content in Early Visual Cortex > Results > Whole-Brain Searchlight Results
hedgedcorrelational- Asserted: passes — The authors put it forward as true.
- Checkable: passes — It can be checked against evidence.
- Load-bearing: unclear — It is unclear whether the paper’s conclusions depend on it.
- Based: passes — The paper gives a reason why it holds.
- It may state two separate claims as one. 24
- The quote only partly states this claim. 1
- Probably not a substantial claim. 5
A result the paper reports from its own data — it cites no other source for it, so there is none to check. The quote shows it is in the paper.
In the paper
“Even at very liberal thresholds (p < 0.05 uncorrected; Figure S3), listening to sounds in the absence of visual stimulation elicited no positive activation in early visual areas but instead elicited a weak deactivation, consistent with previous findings (e.g.,[16]) and in contrast to classical findings for visual mental imagery [17, 18].”
§ Decoding Sound and Imagery Content in Early Visual Cortex > Results > Univariate Activation Profile
plaindirect- Asserted: passes — The authors put it forward as true.
- Checkable: passes — It can be checked against evidence.
- Load-bearing: passes — The paper’s conclusions depend on it.
- Based: passes — The paper gives a reason why it holds.
It may state two separate claims as one.
A result the paper reports from its own data — it cites no other source for it, so there is none to check. The quote shows it is in the paper.
In the paper
“Successful discrimination of imagined sounds was observed in both foveal and peripheral areas of early visual cortex (but not far periphery), in V1 and auditory cortex (Figures 2E and 2F; classification of real sounds replicated the results of experiment 1, cf. Figure S1B).”
- Also stated in: § Decoding of Sound and Imagery Content in Early Visual Cortex · hedged
“Therefore, even in the absence of both visual and auditory stimulation, the contents of mental imagery could be decoded from both V1 and auditory cortex.”
§ Decoding Sound and Imagery Content in Early Visual Cortex > Results > Decoding of Sound and Imagery Content in Early Visual Cortex
plaincorrelational- Asserted: passes — The authors put it forward as true.
- Checkable: passes — It can be checked against evidence.
- Load-bearing: passes — The paper’s conclusions depend on it.
- Based: passes — The paper gives a reason why it holds.
It may state two separate claims as one. The quote only partly states this claim.
- Also stated in: § Decoding of Sound and Imagery Content in Early Visual Cortex · hedged
A result the paper reports from its own data — it cites no other source for it, so there is none to check. The quote shows it is in the paper.
In the paper
“Imagery (experiment 2) elicited no positive activity but exhibited weak deactivations in both early visual and auditory cortices.”
§ Decoding Sound and Imagery Content in Early Visual Cortex > Results > Univariate Activation Profile
plain- Asserted: passes — The authors put it forward as true.
- Checkable: passes — It can be checked against evidence.
- Load-bearing: passes — The paper’s conclusions depend on it.
- Based: passes — The paper gives a reason why it holds.
It may state two separate claims as one.
A result the paper reports from its own data — it cites no other source for it, so there is none to check. The quote shows it is in the paper.
In the paper
“Although the classifier failed to discriminate the three natural sounds in most of early visual cortex, residual above-chance classification remained in the far periphery of V2 (Figures 3E and 3F) despite the orthogonal engagement of attentionally demanding active visuospatial processing.”
§ Decoding Sound and Imagery Content in Early Visual Cortex > Results > Decoding of Sounds while Manipulating Cognitive Resources
plain- Asserted: passes — The authors put it forward as true.
- Checkable: passes — It can be checked against evidence.
- Load-bearing: passes — The paper’s conclusions depend on it.
- Based: passes — The paper gives a reason why it holds.
It may state two separate claims as one.
None of the sources cited for this claim have been checked yet.
In the paper
“Moreover, higher visual areas project back to V1 the associated color of grayscale objects [36] or the predicted motion path of an apparent motion illusion [37, 38].”
§ Decoding Sound and Imagery Content in Early Visual Cortex > Discussion
What the sources say
- Not checked yetcites [36] Bannert, 2013, Decoding the yellow of a gray banana, Curr. Biol. source
- Not checked yetcites [37] Muckli, 2005, Primary visual cortex activity along the apparent-motion trace reflects illusory perception, PLoS Biol. source
- Not checked yetcites [38] Vetter, 2013, TMS over V5 disrupts motion prediction, Cereb. Cortex
plaindirect- Asserted: passes — The authors put it forward as true.
- Checkable: passes — It can be checked against evidence.
- Load-bearing: fails — The paper’s conclusions may not depend on it.
- Based: passes — The paper gives a reason why it holds.
Probably not a substantial claim. The paper’s conclusions may not depend on it. It may state two separate claims as one.
None of the sources cited for this claim have been checked yet.
In the paper
“Our findings are compatible with feedback of predictive information to the earliest visual input level (e.g., [6]), in line with predictive coding models [7–10].”
§ Decoding Sound and Imagery Content in Early Visual Cortex > Abstract
What the sources say
- Not checked yetcites [6] Mumford, 1992, On the computational architecture of the neocortex. II. The role of cortico-cortical loops, Biol. Cybern. source
- Not checked yetcites [7] Friston, 2010, The free-energy principle: a unified brain theory?, Nat. Rev. Neurosci. source
- Not checked yetcites [8] Clark, 2013, Whatever next? Predictive brains, situated agents, and the future of cognitive science, Behav. Brain Sci. source
- Not checked yetcites [9] Bar, 2007, The proactive brain: using analogies and associations to generate predictions, Trends Cogn. Sci. source
- Not checked yetcites [10] Bastos, 2012, Canonical microcircuits for predictive coding, Neuron source
hedgedcorrelational- Asserted: passes — The authors put it forward as true.
- Checkable: passes — It can be checked against evidence.
- Load-bearing: passes — The paper’s conclusions depend on it.
- Based: passes — The paper gives a reason why it holds.
It may state two separate claims as one.
A conclusion the paper draws from its own results — it cites no other source for it, so there is none to check. The quote shows it is in the paper.
In the paper
“Crucially, the information fed down to early visual cortex is category specific and generalizes to sound exemplars of the same category, providing evidence for abstract information feedback rather than precise pictorial feedback.”
§ Decoding Sound and Imagery Content in Early Visual Cortex > Abstract
plaindirect- Asserted: passes — The authors put it forward as true.
- Checkable: passes — It can be checked against evidence.
- Load-bearing: passes — The paper’s conclusions depend on it.
- Based: passes — The paper gives a reason why it holds.
It may state two separate claims as one.
A conclusion the paper draws from its own results — it cites no other source for it, so there is none to check. The quote shows it is in the paper.
In the paper
“Furthermore, this coding is robust to mild manipulations of attention and working memory but affected by orthogonal, cognitively demanding visuospatial processing.”
§ Decoding Sound and Imagery Content in Early Visual Cortex > Abstract
plaindirect- Asserted: passes — The authors put it forward as true.
- Checkable: passes — It can be checked against evidence.
- Load-bearing: passes — The paper’s conclusions depend on it.
- Based: passes — The paper gives a reason why it holds.
It may state two separate claims as one.
A conclusion the paper draws from its own results — it cites no other source for it, so there is none to check. The quote shows it is in the paper.
In the paper
“This demonstrates that both sounds and imagery cues induced similar activity patterns in early visual cortex and that feedback information is coded consistently across imagery and auditory perception.”
§ Decoding Sound and Imagery Content in Early Visual Cortex > Results > Decoding of Sound and Imagery Content in Early Visual Cortex
boostedcorrelational- Asserted: passes — The authors put it forward as true.
- Checkable: passes — It can be checked against evidence.
- Load-bearing: passes — The paper’s conclusions depend on it.
- Based: passes — The paper gives a reason why it holds.
It may state two separate claims as one.
A conclusion the paper draws from its own results — it cites no other source for it, so there is none to check. The quote shows it is in the paper.
In the paper
“Note that despite relatively low classification accuracies, our series of experiments replicated the successful decoding of sounds in early visual areas several times, demonstrating proof of principle and the robustness of our results across different subject and stimulus samples.”
§ Decoding Sound and Imagery Content in Early Visual Cortex > Discussion
boostedcorrelational- Asserted: passes — The authors put it forward as true.
- Checkable: passes — It can be checked against evidence.
- Load-bearing: passes — The paper’s conclusions depend on it.
- Based: passes — The paper gives a reason why it holds.
It may state two separate claims as one.
A conclusion the paper draws from its own results — it cites no other source for it, so there is none to check. The quote shows it is in the paper.
In the paper
“In the context of our findings, we suggest that the content-specific information from sounds, when they are heard and/or imagined, is relayed from auditory cortex to early visual cortex via pSTS and precuneus, eliciting differential activity patterns in both of these regions.”
§ Decoding Sound and Imagery Content in Early Visual Cortex > Discussion
hedgeddirect- Asserted: passes — The authors put it forward as true.
- Checkable: passes — It can be checked against evidence.
- Load-bearing: passes — The paper’s conclusions depend on it.
- Based: passes — The paper gives a reason why it holds.
It may state two separate claims as one.
A conclusion the paper draws from its own results — it cites no other source for it, so there is none to check. The quote shows it is in the paper.
In the paper
“The coding of nonretinal information in the activity patterns of early visual cortex is common across actual auditory perception and imagery and may be mediated by higher-level multisensory areas.”
§ Decoding Sound and Imagery Content in Early Visual Cortex > Abstract
hedgedconditional- Asserted: passes — The authors put it forward as true.
- Checkable: passes — It can be checked against evidence.
- Load-bearing: passes — The paper’s conclusions depend on it.
- Based: passes — The paper gives a reason why it holds.
It may state two separate claims as one.
A conclusion the paper draws from its own results — it cites no other source for it, so there is none to check. The quote shows it is in the paper.
In the paper
“Our results suggest that early visual cortex receives nonretinal input from other brain areas when it is generated by auditory perception and/or imagery, and this input carries common abstract information.”
§ Decoding Sound and Imagery Content in Early Visual Cortex > Abstract
hedgeddirect- Asserted: passes — The authors put it forward as true.
- Checkable: passes — It can be checked against evidence.
- Load-bearing: passes — The paper’s conclusions depend on it.
- Based: passes — The paper gives a reason why it holds.
It may state two separate claims as one.
In the paper
“The precuneus has been identified as an area responding to both visual and auditory stimuli and possibly serving as an audiovisual convergence area [25].”
§ Decoding Sound and Imagery Content in Early Visual Cortex > Discussion
What the sources say
- Not checked yetcites [25] Hertz, 2010, Disentangling unisensory and multisensory components in audiovisual integration using a novel multifrequency fMRI spectral analysis, Neuroimage source
hedgedcorrelational- Asserted: passes — The authors put it forward as true.
- Checkable: passes — It can be checked against evidence.
- Load-bearing: passes — The paper’s conclusions depend on it.
- Based: passes — The paper gives a reason why it holds.
Probably not a substantial claim. It may state two separate claims as one.
A conclusion the paper draws from its own results — it cites no other source for it, so there is none to check. The quote shows it is in the paper.
In the paper
“The results of experiment 5 suggest that the information that is fed down to early visual cortex is not only content specific but also category specific, i.e., related to the information shared by sound exemplars of the same category.”
§ Decoding Sound and Imagery Content in Early Visual Cortex > Discussion
hedgedcorrelational- Asserted: passes — The authors put it forward as true.
- Checkable: passes — It can be checked against evidence.
- Load-bearing: passes — The paper’s conclusions depend on it.
- Based: passes — The paper gives a reason why it holds.
It may state two separate claims as one.
A conclusion the paper draws from its own results — it cites no other source for it, so there is none to check. The quote shows it is in the paper.
In the paper
“The findings of experiment 5 furthermore demonstrate that the successful decoding in experiment 1 was not specific to the first sound exemplars we used and could not be caused by differential low-level acoustic features of the sounds (e.g., frequency distribution).”
§ Decoding Sound and Imagery Content in Early Visual Cortex > Discussion
boosted- Asserted: passes — The authors put it forward as true.
- Checkable: passes — It can be checked against evidence.
- Load-bearing: passes — The paper’s conclusions depend on it.
- Based: passes — The paper gives a reason why it holds.
It may state two separate claims as one.
A conclusion the paper draws from its own results — it cites no other source for it, so there is none to check. The quote shows it is in the paper.
In the paper
“This suggests that information feedback is unlikely to be caused by an exact pictorial representation but instead contains abstract and possibly semantic information.”
§ Decoding Sound and Imagery Content in Early Visual Cortex > Discussion
hedged- Asserted: passes — The authors put it forward as true.
- Checkable: passes — It can be checked against evidence.
- Load-bearing: passes — The paper’s conclusions depend on it.
- Based: passes — The paper gives a reason why it holds.
It may state two separate claims as one.
None of the sources cited for this claim have been checked yet.
In the paper
“Apart from the route via multisensory areas, there is evidence for multisensory integration on the subcortical level [27] and for direct anatomical connections between early auditory and early visual areas [12, 28, 29], mostly reaching peripheral regions [12–14], consistent with both our eccentricity and searchlight results.”
§ Decoding Sound and Imagery Content in Early Visual Cortex > Discussion
What the sources say
- Not checked yetcites [27] van den Brink, 2013, Subcortical, modality-specific pathways contribute to multisensory processing in humans, Cereb. Cortex
- Not checked yetcites [12] Eckert, 2008, A cross-modal system linking primary auditory and visual cortices: evidence from intrinsic fMRI connectivity analysis, Hum. Brain Mapp. source
- Not checked yetcites [28] Beer, 2013, Combined diffusion-weighted and functional magnetic resonance imaging reveals a temporal-occipital network involved in auditory-visual object processing, Front Integr Neurosci source
- Not checked yetcites [29] Beer, 2011, Diffusion tensor imaging shows white matter tracts between human auditory and visual cortex, Exp. Brain Res. source
- Not checked yetcites [13] Rockland, 2003, Multisensory convergence in calcarine visual areas in macaque monkey, Int. J. Psychophysiol. source
- Not checked yetcites [14] Cate, 2009, Auditory attention activates peripheral visual cortex, PLoS ONE source
plaincorrelational- Asserted: passes — The authors put it forward as true.
- Checkable: passes — It can be checked against evidence.
- Load-bearing: unclear — It is unclear whether the paper’s conclusions depend on it.
- Based: passes — The paper gives a reason why it holds.
It may state two separate claims as one.
A conclusion the paper draws from its own results — it cites no other source for it, so there is none to check. The quote shows it is in the paper.
In the paper
“This also means that our results were not caused by an unspecific attention effect or a simple reactivation of early visual cortex due to pictorial visual mental imagery.”
§ Decoding Sound and Imagery Content in Early Visual Cortex > Discussion
plain- Asserted: passes — The authors put it forward as true.
- Checkable: passes — It can be checked against evidence.
- Load-bearing: passes — The paper’s conclusions depend on it.
- Based: passes — The paper gives a reason why it holds.
It may state two separate claims as one.
A conclusion the paper draws from its own results — it cites no other source for it, so there is none to check. The quote shows it is in the paper.
In the paper
“Our results demonstrate that the information arriving in early visual cortex is categorical and independent of its exact source.”
§ Decoding Sound and Imagery Content in Early Visual Cortex > Discussion
boosted- Asserted: passes — The authors put it forward as true.
- Checkable: passes — It can be checked against evidence.
- Load-bearing: passes — The paper’s conclusions depend on it.
- Based: passes — The paper gives a reason why it holds.
It may state two separate claims as one.
None of the sources cited for this claim have been checked yet.
In the paper
“For example, activity patterns in nonstimulated parts of early visual cortex contain content-specific information from the surrounding visual context [31, 32], from objects presented in the periphery [33], and from visual stimuli solely held in working memory rather than being actively perceived [34, 35].”
§ Decoding Sound and Imagery Content in Early Visual Cortex > Discussion
What the sources say
- Not checked yetcites [31] Smith, 2010, Nonstimulated early visual areas carry information about surrounding context, Proc. Natl. Acad. Sci. USA source
- Not checked yetcites [32] Ban, 2013, Topographic representation of an occluded object and the effects of spatiotemporal context in human early visual areas, J. Neurosci. source
- Not checked yetcites [33] Williams, 2008, Feedback of visual object information to foveal retinotopic cortex, Nat. Neurosci. source
- Not checked yetcites [34] Harrison, 2009, Decoding reveals the contents of visual working memory in early visual areas, Nature source
- Not checked yetcites [35] Albers, 2013, Shared representations for working memory and mental imagery in early visual cortex, Curr. Biol. source
plaincorrelational- Asserted: passes — The authors put it forward as true.
- Checkable: passes — It can be checked against evidence.
- Load-bearing: fails — The paper’s conclusions may not depend on it.
- Based: passes — The paper gives a reason why it holds.
Probably not a substantial claim. The paper’s conclusions may not depend on it. It may state two separate claims as one.
In the paper
“Also, hippocampal projections to peripheral early visual regions have been demonstrated in the context of boundary extension for scene processing [30].”
§ Decoding Sound and Imagery Content in Early Visual Cortex > Discussion
What the sources say
- Not checked yetcites [30] Chadwick, 2013, The hippocampus extrapolates beyond the view in scenes: an fMRI study of boundary extension, Cortex source
boostedcorrelational- Asserted: passes — The authors put it forward as true.
- Checkable: passes — It can be checked against evidence.
- Load-bearing: fails — The paper’s conclusions may not depend on it.
- Based: passes — The paper gives a reason why it holds.
Probably not a substantial claim. The paper’s conclusions may not depend on it.
In the paper
“pSTS is implicated in audiovisual integration and has been shown to feed down information to primary visual and auditory cortices [26].”
§ Decoding Sound and Imagery Content in Early Visual Cortex > Discussion
What the sources say
- Not checked yetcites [26] Naumer, 2011, Investigating human audio-visual object perception with a combination of hypothesis-generating and hypothesis-testing fMRI analysis tools, Exp. Brain Res. source
plaindirect- Asserted: passes — The authors put it forward as true.
- Checkable: passes — It can be checked against evidence.
- Load-bearing: passes — The paper’s conclusions depend on it.
- Based: passes — The paper gives a reason why it holds.
It may state two separate claims as one.
A conclusion the paper draws from its own results — it cites no other source for it, so there is none to check. The quote shows it is in the paper.
In the paper
“That is, the information contained in these activity patterns is generalizable across different sound exemplars within a category, demonstrating that sounds trigger shared categorical information transfer to early visual cortex rather than a fine-grained pictorial representation.”
§ Decoding Sound and Imagery Content in Early Visual Cortex > Results > Category Specificity of the Information Fed Back to Early Visual Cortex
boosteddirect- Asserted: passes — The authors put it forward as true.
- Checkable: passes — It can be checked against evidence.
- Load-bearing: passes — The paper’s conclusions depend on it.
- Based: passes — The paper gives a reason why it holds.
It may state two separate claims as one.
None of the sources cited for this claim have been checked yet.
In the paper
“In fact, previous accounts suggested that prediction and mental imagery may involve overlapping brain mechanisms [6, 43, 44], and mental imagery might have evolved from predictive brain mechanisms.”
§ Decoding Sound and Imagery Content in Early Visual Cortex > Discussion
What the sources say
- Not checked yetcites [6] Mumford, 1992, On the computational architecture of the neocortex. II. The role of cortico-cortical loops, Biol. Cybern. source
- Not checked yetcites [43] Maguire, 2013, The hippocampus: a manifesto for change, J. Exp. Psychol. Gen. source
- Not checked yetcites [44] Moulton, 2009, Imagining predictions: mental imagery as mental emulation, Philos. Trans. R. Soc. Lond. B Biol. Sci. source
hedgedconditional- Asserted: passes — The authors put it forward as true.
- Checkable: passes — It can be checked against evidence.
- Load-bearing: fails — The paper’s conclusions may not depend on it.
- Based: passes — The paper gives a reason why it holds.
Probably not a substantial claim. The paper’s conclusions may not depend on it. It may state two separate claims as one.
The paper relies on this without support.
The word cues “forest,” “traffic,” and “people” reliably elicit the intended mental imagery of the corresponding sounds and natural scenes in subjects.
“Subjects were instructed to engage in mental imagery of the sounds and a corresponding natural scene.”
“runs in which subjects solely imagined the sounds upon hearing the word cues “forest,” “traffic,” or “people””
Claims other papers make about this one
Each is checked against this paper’s own text: does it say what the citing paper says it does?
The source backs part of the claim, not all of it — or backs it for a different population, condition or comparison.
In the citing paper
“Functional magnetic resonance imaging (fMRI) has shown that feedback from higher- to lower-level sensory cortices carries spatiotemporally precise and context-specific predictions (25–29).”
From The Predictive Coding Account of Psychosis (2018) · cites this paper as [28]
Experimental — accuracy not yet measured
Citations
Cites
The free-energy principle: a unified brain theory?
Friston, K. (2010) · Nature Reviews Neuroscience · doi:10.1038/nrn2787 · Cited by 8,120 · cited 3×
“, [6]), in line with predictive coding models [7–10].”
Nonparametric permutation tests for functional neuroimaging: A primer with examples
Nichols, T. E., & Holmes, A. P. (2002) · Human Brain Mapping · doi:10.1002/hbm.1058 · Cited by 6,256
Whatever next? Predictive brains, situated agents, and the future of cognitive science
Clark, A. (2013) · Behavioral and Brain Sciences · doi:10.1017/s0140525x12000477 · Cited by 5,924 · cited 2×
“, [6]), in line with predictive coding models [7–10].”
Canonical Microcircuits for Predictive Coding
Bastos, A. M., Usrey, W. M., Adams, R. A., Mangun, G. R., Fries, P., & Friston, K. J. (2012) · Neuron · doi:10.1016/j.neuron.2012.10.038 · Cited by 2,421 · cited 2×
“, [6]), in line with predictive coding models [7–10].”
Decoding reveals the contents of visual working memory in early visual areas
Harrison, S. A., & Tong, F. (2009) · Nature · doi:10.1038/nature07832 · Cited by 1,347
The proactive brain: using analogies and associations to generate predictions
Bar, M. (2007) · Trends in Cognitive Sciences · doi:10.1016/j.tics.2007.05.005 · Cited by 1,144
On the computational architecture of the neocortex: II The role of cortico-cortical loops
Mumford, D. (1992) · Biological Cybernetics · doi:10.1007/bf00198477 · Cited by 1,074
On the computational architecture of the neocortex: I. The role of the thalamo-cortical loop
Mumford, D. (1991) · Biological Cybernetics · doi:10.1007/bf00202389 · Cited by 929
Anatomy of hierarchy: Feedforward and feedback pathways in macaque visual cortex
Markov, N. T., Vezoli, J., Chameau, P., Falchier, A., Quilodran, R., Huissoud, C., Lamy, C., Misery, P., Giroud, P., Ullman, S., et al. (2014) · Journal of Comparative Neurology · doi:10.1002/cne.23458 · Cited by 759
Corticocortical connections in the visual system: structure and function
Salin, P. A., & Bullier, J. (1995) · Physiological Reviews · doi:10.1152/physrev.1995.75.1.107 · Cited by 636
Cited by
Sorted by citations
Cognition does not affect perception: Evaluating the evidence for “top-down” effects
Firestone, C., & Scholl, B. J. (2016) · Behavioral and Brain Sciences · doi:10.1017/s0140525x15000965 · Cited by 1,200
The Predictive Coding Account of Psychosis
Sterzer, P., Adams, R. A., Fletcher, P., Frith, C., Lawrie, S. M., Muckli, L., Petrovic, P., Uhlhaas, P., Voss, M., & Corlett, P. R. (2018) · Biological Psychiatry · doi:10.1016/j.biopsych.2018.05.015 · Cited by 941
Self-citationA voxel-wise encoding model for early visual areas decodes mental images of remembered scenes
Naselaris, T., Olman, C. A., Stansbury, D. E., Uǧurbil, K., & Gallant, J. L. (2014) · NeuroImage · doi:10.1016/j.neuroimage.2014.10.018 · Cited by 386
Zadbood, A., Chen, J., Leong, Y. C., Norman, K. A., & Hasson, U. (2017) · Cerebral Cortex · doi:10.1093/cercor/bhx202 · Cited by 281
Zadbood, A., Chen, J., Leong, Y. C., Norman, K. A., & Hasson, U. (2016) · doi:10.1101/081208 · Cited by 281
Varieties of cognitive penetration in visual perception
Vetter, P., & Newen, A. (2014) · Consciousness and Cognition · doi:10.1016/j.concog.2014.04.007 · Cited by 263
Self-citationPredictive coding and multisensory integration: an attentional account of the multisensory mind
Talsma, D. (2015) · Frontiers in Integrative Neuroscience · doi:10.3389/fnint.2015.00019 · Cited by 237
The multisensory function of the human primary visual cortex
Murray, M. M., Thelen, A., Thut, G., Romei, V., Martuzzi, R., & Matusz, P. J. (2016) · Neuropsychologia · doi:10.1016/j.neuropsychologia.2015.08.011 · Cited by 219
Emotion schemas are embedded in the human visual system
Kragel, P. A., Reddan, M. C., LaBar, K. S., & Wager, T. D. (2019) · Science Advances · doi:10.1126/sciadv.aaw4358 · Cited by 214
Functional connectivity of visual cortex in the blind follows retinotopic organization principles
Striem-Amit, E., Ovadia-Caro, S., Caramazza, A., Margulies, D. S., Villringer, A., & Amedi, A. (2015) · Brain · doi:10.1093/brain/awv083 · Cited by 194
Laminar fMRI: applications for cognitive neuroscience
Lawrence, S. J. D., Formisano, E., Muckli, L., & de Lange, F. P. (2019) · NeuroImage · doi:10.1016/j.neuroimage.2017.07.004 · Cited by 186
Self-citationPilgramm, S., de Haas, B., Helm, F., Zentgraf, K., Stark, R. M., Munzert, J., & Krüger, B. (2015) · Human Brain Mapping · doi:10.1002/hbm.23015 · Cited by 168
Improving the study of brain-behavior relationships by revisiting basic assumptions
Westlin, C., Theriault, J. E., Katsumi, Y., Nieto-Castañón, A., Kucyi, A., Ruf, S. F., Brown, S. M., Pavel, M., Deniz Erdogmus, B., Brooks, D. H., et al. (2023) · Trends in Cognitive Sciences · doi:10.1016/j.tics.2022.12.015 · Cited by 181
Reconstructing faces from fMRI patterns using deep generative neural networks
VanRullen, R., & Reddy, L. (2019) · Communications Biology · doi:10.1038/s42003-019-0438-y · Cited by 157
Words Jump-Start Vision: A Label Advantage in Object Recognition
Boutonnet, B., & Lupyan, G. (2015) · Journal of Neuroscience · doi:10.1523/jneurosci.5111-14.2015 · Cited by 154
Rohe, T., & Noppeney, U. (2016) · Current Biology · doi:10.1016/j.cub.2015.12.056 · Cited by 170
The neural correlates of visual imagery: A co-ordinate-based meta-analysis
Winlove, C. I. P., Milton, F., Ranson, J., Fulford, J., MacKisack, M., Macpherson, F., & Zeman, A. (2018) · Cortex · doi:10.1016/j.cortex.2017.12.014 · Cited by 150
van den Hurk, J., Baelen, M. V., & de Beeck, H. O. (2017) · Proceedings of the National Academy of Sciences · doi:10.1073/pnas.1612862114 · Cited by 155
Visual Imagery and Perception Share Neural Representations in the Alpha Frequency Band
Xie, S., Kaiser, D., & Cichy, R. M. (2020) · Current Biology · doi:10.1016/j.cub.2020.04.074 · Cited by 139
Kozai, T. D. Y., Du, Z. J., Gugel, Z. V., Smith, M. A., Chase, S. M., Bodily, L., Caparosa, E. M., Friedlander, R. M., & Cui, X. T. (2014) · Journal of Neuroscience Methods · doi:10.1016/j.jneumeth.2014.12.010 · Cited by 137
A multisensory perspective of working memory
Quak, M., London, R. E., & Talsma, D. (2015) · Frontiers in Human Neuroscience · doi:10.3389/fnhum.2015.00197 · Cited by 151
Zabicki, A., de Haas, B., Zentgraf, K., Stark, R. M., Munzert, J., & Krüger, B. (2016) · Cerebral Cortex · doi:10.1093/cercor/bhw257 · Cited by 134
Transformed Neural Pattern Reinstatement during Episodic Memory Retrieval
Xiao, X., Dong, Q., Gao, J., Men, W., Poldrack, R. A., & Xue, G. (2017) · Journal of Neuroscience · doi:10.1523/jneurosci.2324-16.2017 · Cited by 142
Decoding Natural Sounds in Early “Visual” Cortex of Congenitally Blind Individuals
Vetter, P., Bola, Ł., Reich, L., Bennett, M., Muckli, L. F., & Amedi, A. (2020) · Current Biology · doi:10.1016/j.cub.2020.05.071 · Cited by 129
Self-citationNánay, B. (2023) · doi:10.1093/oso/9780198809500.001.0001 · Cited by 121
Generative Feedback Explains Distinct Brain Activity Codes for Seen and Mental Images
Breedlove, J. L., St-Yves, G., Olman, C. A., & Naselaris, T. (2020) · Current Biology · doi:10.1016/j.cub.2020.04.014 · Cited by 121
Cortical Activity Predicts Which Older Adults Recognize Speech in Noise and When
Vaden, K. I., Kuchinsky, S. E., Ahlstrom, J. B., Dubno, J. R., & Eckert, M. A. (2015) · Journal of Neuroscience · doi:10.1523/jneurosci.2908-14.2015 · Cited by 110
Heimler, B., Striem-Amit, E., & Amedi, A. (2015) · Current Opinion in Neurobiology · doi:10.1016/j.conb.2015.09.001 · Cited by 108
Why cognitive penetration of our perceptual experience is still the most plausible account
Newen, A., & Vetter, P. (2016) · Consciousness and Cognition · doi:10.1016/j.concog.2016.09.005 · Cited by 104
Self-citationContextual modulation of primary visual cortex by auditory signals
Petro, L. S., Paton, A., & Muckli, L. F. (2017) · Philosophical Transactions of the Royal Society B Biological Sciences · doi:10.1098/rstb.2016.0104 · Cited by 97
Self-citationSensory Substitution and Multimodal Mental Imagery
Nánay, B. (2017) · Perception · doi:10.1177/0301006617699225 · Cited by 99
Single-trial multisensory memories affect later auditory and visual object discrimination
Thelen, A., Talsma, D., & Murray, M. M. (2015) · Cognition · doi:10.1016/j.cognition.2015.02.003 · Cited by 86
Decoding across sensory modalities reveals common supramodal signatures of conscious perception
Sanchez, G., Hartmann, T., Fuscà, M., Demarchi, G., & Weisz, N. (2020) · Proceedings of the National Academy of Sciences · doi:10.1073/pnas.1912584117 · Cited by 75
Gordon, N., Koenig‐Robert, R., Tsuchiya, N., van Boxtel, J. J. A., & Hohwy, J. (2017) · eLife · doi:10.7554/elife.22749 · Cited by 72
Contributions of local speech encoding and functional connectivity to audio-visual speech perception
Giordano, B. L., Ince, R. A. A., Groß, J., Panzeri, S., Schyns, P. G., & Kayser, C. (2017) · eLife · doi:10.7554/elife.24763 · Cited by 73
Regev, M., Simony, E., Lee, K. J., Tan, K. M., Chen, J., & Hasson, U. (2018) · Cerebral Cortex · doi:10.1093/cercor/bhy282 · Cited by 74
Reliability-Weighted Integration of Audiovisual Signals Can Be Modulated by Top-down Attention
Rohe, T., & Noppeney, U. (2018) · eNeuro · doi:10.1523/eneuro.0315-17.2018 · Cited by 77
Learning Representations from Audio-Visual Spatial AlignmentPreprint
Morgado, P. M., Li, Y., & Vasconcelos, N. M. (2020) · arXiv (Cornell University) · doi:10.48550/arxiv.2011.01819 · Cited by 78
Multisensory integration and cross-modal learning in synaesthesia: A unifying model
Newell, F. N., & Mitchell, K. J. (2015) · Neuropsychologia · doi:10.1016/j.neuropsychologia.2015.07.026 · Cited by 72
The Complex Interplay Between Multisensory Integration and Perceptual Awareness
Deroy, O. D., Faivre, N., Lunghi, C., Spence, C. J., Aller, M., & Noppeney, U. (2016) · Multisensory Research · doi:10.1163/22134808-00002529 · Cited by 77
Contributions of cortical feedback to sensory processing in primary visual cortex
Petro, L. S., Vizioli, L., & Muckli, L. (2014) · Frontiers in Psychology · doi:10.3389/fpsyg.2014.01223 · Cited by 61
Self-citationHeimler, B., & Amedi, A. (2020) · Neuroscience & Biobehavioral Reviews · doi:10.1016/j.neubiorev.2020.06.034 · Cited by 70
Monaco, S., Malfatti, G., Culham, J. C., Cattaneo, L., & Turella, L. (2020) · NeuroImage · doi:10.1016/j.neuroimage.2020.116981 · Cited by 75
Visual Influences on Auditory Behavioral, Neural, and Perceptual Processes: A Review
Opoku-Baah, C., Schoenhaut, A. M., Vassall, S. G., Tovar, D. A., Ramachandran, R., & Wallace, M. T. (2021) · Journal of the Association for Research in Otolaryngology · doi:10.1007/s10162-021-00789-0 · Cited by 86
Morgan, A., Petro, L. S., & Muckli, L. F. (2019) · Journal of Neuroscience · doi:10.1523/jneurosci.0852-19.2019 · Cited by 69
Self-citationOpening Up Vision: The Case Against Encapsulation
Ogilvie, R., & Carruthers, P. (2015) · Review of Philosophy and Psychology · doi:10.1007/s13164-015-0294-8 · Cited by 63
Unimodal and Bimodal Access to Sensory Working Memories by Auditory and Visual Impulses
Wolff, M. J., Kandemir, G., Stokes, M. G., & Akyürek, E. G. (2019) · Journal of Neuroscience · doi:10.1523/jneurosci.1194-19.2019 · Cited by 64
Masson, H. L., Bulthé, J., de Beeck, H. O., & Wallraven, C. (2015) · Cerebral Cortex · doi:10.1093/cercor/bhv170 · Cited by 63
van Loon, A. M., Fahrenfort, J. J., van der Velde, B., Lirk, P. B., Vulink, N. C. C., Hollmann, M. W., Scholte, H. S., & Lamme, V. A. F. (2015) · Cerebral Cortex · doi:10.1093/cercor/bhv018 · Cited by 60
Young, B. D., & Nánay, B. (2021) · Pacific philosophical quarterly · doi:10.1111/papq.12357 · Cited by 58
A primer on encoding models in sensory neuroscience
van Gerven, M. A. J. (2016) · Journal of Mathematical Psychology · doi:10.1016/j.jmp.2016.06.009 · Cited by 62
Retinotopic-like maps of spatial sound in primary ‘visual’ cortex of blind human echolocators
Norman, L. J., & Thaler, L. (2019) · Proceedings of the Royal Society B Biological Sciences · doi:10.1098/rspb.2019.1910 · Cited by 56
Sensory representations in primary visual cortex are not sufficient for subjective imagery
Cabbai, G., Racey, C., Simner, J., Dance, C., Ward, J., & Forster, S. (2024) · Current Biology · doi:10.1016/j.cub.2024.09.062 · Cited by 76
Smith, F. W., & Smith, M. L. (2019) · NeuroImage · doi:10.1016/j.neuroimage.2019.03.065 · Cited by 57
Self-citationMusic influences vividness and content of imagined journeys in a directed visual imagery task
Herff, S. A., Cecchetti, G., Taruffi, L., & Déguernel, K. (2021) · Scientific Reports · doi:10.1038/s41598-021-95260-8 · Cited by 56
Nielsen, T. (2017) · Neuroscience of Consciousness · doi:10.1093/nc/nix001 · Cited by 56
The Role of Dendritic Signaling in the Anesthetic Suppression of Consciousness
Meyer, K. (2015) · Anesthesiology · doi:10.1097/aln.0000000000000673 · Cited by 53
Kayser, S. J., Philiastides, M. G., & Kayser, C. (2017) · NeuroImage · doi:10.1016/j.neuroimage.2017.01.010 · Cited by 51
Multisensory subtypes of aphantasia: Mental imagery as supramodal perception in reverse
Dawes, A. J., Keogh, R., & Pearson, J. (2023) · Neuroscience Research · doi:10.1016/j.neures.2023.11.009 · Cited by 55
Imageless imagery in aphantasia revealed by early visual cortex decoding
Chang, S., Zhang, X., Cao, Y., Pearson, J., & Meng, M. (2025) · Current Biology · doi:10.1016/j.cub.2024.12.012 · Cited by 45
Decoding Trans-Saccadic Memory
Edwards, G., VanRullen, R., & Cavanagh, P. (2017) · Journal of Neuroscience · doi:10.1523/jneurosci.0854-17.2017 · Cited by 40
Advances in memristor based artificial neuron fabrication-materials, models, and applications
Bian, J., Liu, Z., Tao, Y., Wang, Z., Zhao, X., Lin, Y., Xu, H., & Liu, Y. (2023) · International Journal of Extreme Manufacturing · doi:10.1088/2631-7990/acfcf1 · Cited by 45
Decoding the direction of imagined visual motion using 7 T ultra-high field fMRI
Emmerling, T. C., Zimmermann, J., Sorger, B., Frost, M. A., & Goebel, R. (2015) · NeuroImage · doi:10.1016/j.neuroimage.2015.10.022 · Cited by 44
Ragni, F., Tucciarelli, R., Andersson, P. U., & Lingnau, A. (2020) · Cortex · doi:10.1016/j.cortex.2020.02.020 · Cited by 46
Zhang, M., Varga, D., Wang, X., Krieger‐Redwood, K., Gouws, A. D., Smallwood, J., & Jefferies, E. (2020) · NeuroImage · doi:10.1016/j.neuroimage.2020.117405 · Cited by 46
Spoken language comprehension activates the primary visual cortexPreprint
Seydell‐Greenwald, A., Wang, X., Newport, E. L., Bi, Y., & Striem-Amit, E. (2020) · bioRxiv (Cold Spring Harbor Laboratory) · doi:10.1101/2020.12.02.408765 · Cited by 43
Nánay, B. (2023) · doi:10.1002/9781394259847.ch30 · Cited by 42
Decoding Visual Location From Neural Patterns in the Auditory Cortex of the Congenitally Deaf
Almeida, J., He, D., Chen, Q., Mahon, B. Z., Zhang, F., Gonçalves, Ó. F., Fang, F., & Bi, Y. (2015) · Psychological Science · doi:10.1177/0956797615598970 · Cited by 49
Mapping Specific Mental Content during Musical Imagery
Regev, M., Halpern, A. R., Owen, A. M., Patel, A. D., & Zatorre, R. J. (2021) · Cerebral Cortex · doi:10.1093/cercor/bhab036 · Cited by 44
Decoding Object-Based Auditory Attention from Source-Reconstructed MEG Alpha Oscillations
de Vries, I. D., Marinato, G., & Baldauf, D. (2021) · Journal of Neuroscience · doi:10.1523/jneurosci.0583-21.2021 · Cited by 39
Spatial localization of sound elicits early responses from occipital visual cortex in humans
Campus, C., Sandini, G., Morrone, M. C., & Gori, M. (2017) · Scientific Reports · doi:10.1038/s41598-017-09142-z · Cited by 39
Convergent and invariant object representations for sight, sound, and touch
Man, K., Damásio, A. R., Meyer, K., & Kaplan, J. (2015) · Human Brain Mapping · doi:10.1002/hbm.22867 · Cited by 38
Perceived and mentally rotated contents are differentially represented in cortical depth of V1
Iamshchinina, P., KAISER, D. H., Yakupov, R., Haenelt, D., Sciarra, A., Mattern, H., Lüesebrink, F., Düzel, E., Speck, O., Weiskopf, N., et al. (2021) · Communications Biology · doi:10.1038/s42003-021-02582-4 · Cited by 45
Wallmeier, L., Kish, D., Wiegrebe, L., & Flanagin, V. L. (2015) · European Journal of Neuroscience · doi:10.1111/ejn.12843 · Cited by 35
Modality-Independent Coding of Scene Categories in Prefrontal Cortex
Jung, Y., Larsen, B., & Walther, D. B. (2018) · Journal of Neuroscience · doi:10.1523/jneurosci.0272-18.2018 · Cited by 35
Campus, C., Sandini, G., Amadeo, M. B., & Gori, M. (2019) · Scientific Reports · doi:10.1038/s41598-018-37821-y · Cited by 39
Orienting spatial attention to sounds enhances visual processing
Störmer, V. S. (2019) · Current Opinion in Psychology · doi:10.1016/j.copsyc.2019.03.010 · Cited by 35
Spoken language processing activates the primary visual cortex
Seydell‐Greenwald, A., Wang, X., Newport, E. L., Bi, Y., & Striem-Amit, E. (2023) · PLoS ONE · doi:10.1371/journal.pone.0289671 · Cited by 37
Roldan, S. M. (2017) · Frontiers in Psychology · doi:10.3389/fpsyg.2017.00833 · Cited by 32
Binding and differentiation in multisensory object perception
Green, E. J. (2019) · Synthese · doi:10.1007/s11229-019-02351-1 · Cited by 33
Alpha-frequency feedback to early visual cortex orchestrates coherent naturalistic vision
Chen, L., Cichy, R. M., & KAISER, D. H. (2023) · Science Advances · doi:10.1126/sciadv.adi2321 · Cited by 31
Mental imagery can generate and regulate acquired differential fear conditioned reactivity
Greening, S. G., Lee, T., Burleigh, L. M., Grégoire, L., Robinson, T., Jiang, X., Mather, M., & Kaplan, J. (2022) · Scientific Reports · doi:10.1038/s41598-022-05019-y · Cited by 35
Sensitive Period for Cognitive Repurposing of Human Visual Cortex
Kanjlia, S., Pant, R., & Bedny, M. (2018) · Cerebral Cortex · doi:10.1093/cercor/bhy280 · Cited by 32
Aging Effect on Audiovisual Integrative Processing in Spatial Discrimination Task
Zou, Z., Chau, B. K. H., Ting, K. H., & Chan, C. C. H. (2017) · Frontiers in Aging Neuroscience · doi:10.3389/fnagi.2017.00374 · Cited by 29
Decoding sound content in the early visual cortex of aphantasic participants
de la Cruz, B. M. M., Abbatecola, C., Luciani, R. S., Paton, A., Bergmann, J., Vetter, P., Petro, L. S., & Muckli, L. F. (2024) · Current Biology · doi:10.1016/j.cub.2024.09.008 · Cited by 36
Self-citationUncovering the Role of the Early Visual Cortex in Visual Mental Imagery
Dijkstra, N. (2024) · Vision · doi:10.3390/vision8020029 · Cited by 32
Emberson, L. L. (2016) · Behavioral and Brain Sciences · doi:10.1017/s0140525x15002496 · Cited by 26
Sound Induces Change in Orientation Preference of V1 Neurons: Audio-Visual Cross-Influence
Chanauria, N., Bharmauria, V., Bachatene, L., Cattan, S., Rouat, J., & Molotchnikoff, S. (2019) · Neuroscience · doi:10.1016/j.neuroscience.2019.01.039 · Cited by 24
Sommer, V. R., & Sander, M. C. (2021) · Aging Neuropsychology and Cognition · doi:10.1080/13825585.2021.2019184 · Cited by 23
Cochlea to categories: The spatiotemporal dynamics of semantic auditory representations
Lowe, M. X., Mohsenzadeh, Y., Lahner, B., Charest, I., Oliva, A., & Teng, S. (2021) · Cognitive Neuropsychology · doi:10.1080/02643294.2022.2085085 · Cited by 24
Hsu, C.-W., & Teoh, Y. (2016) · Journal of Autism and Developmental Disorders · doi:10.1007/s10803-016-2959-2 · Cited by 26
Masuda, Y., Takemura, H., Terao, M., Miyazaki, A., Ogawa, S., Horiguchi, H., Nakadomari, S., Matsumoto, K., Nakano, T., Wandell, B. A., et al. (2020) · Current Biology · doi:10.1016/j.cub.2020.10.034 · Cited by 22
Zhu, M., Chen, Y., Zheng, J., Zhao, P., Xia, M., Tang, Y., & Wang, F. (2025) · Translational Psychiatry · doi:10.1038/s41398-025-03265-y · Cited by 28
Topographical and laminar distribution of audiovisual processing within human planum temporale
Chai, Y., Liu, T. T., Marrett, S., Li, L., Khojandi, A., Handwerker, D. A., Alink, A., Muckli, L. F., & Bandettini, P. A. (2021) · Progress in Neurobiology · doi:10.1016/j.pneurobio.2021.102121 · Cited by 23
Self-citationde Borst, A. W., & de Gelder, B. (2016) · Cerebral Cortex · doi:10.1093/cercor/bhw211 · Cited by 23
Who's that Knocking at My Door? Neural Bases of Sound Source Identification
Lemaître, G., Pyles, J. A., Halpern, A. R., Navolio, N., Lehet, M. I., & Heller, L. M. (2016) · Cerebral Cortex · doi:10.1093/cercor/bhw397 · Cited by 25
Absence of shared representation in the visual cortex challenges unconscious imagery in aphantasia
Scholz, C. O., Monzel, M., & Liu, J. (2025) · Current Biology · doi:10.1016/j.cub.2025.05.009 · Cited by 30
Memory influences haptic perception of softness
Metzger, A., & Drewing, K. (2019) · Scientific Reports · doi:10.1038/s41598-019-50835-4 · Cited by 24
Spatially generalizable representations of facial expressions: Decoding across partial face samples
Greening, S. G., Mitchell, D. G. V., & Smith, F. W. (2017) · Cortex · doi:10.1016/j.cortex.2017.11.016 · Cited by 22
Self-citationKayser, S. J., & Kayser, C. (2018) · Scientific Reports · doi:10.1038/s41598-018-22137-8 · Cited by 23
Metadata
- Authors
- Vetter, P., Smith, F. W., & Muckli, L.
- Affiliations
- University of Geneva (CH)
- University of Glasgow (GB)
- Corresponding author
- Vetter, Petra
- Muckli, Lars
- Venue
- Current Biology
- Publisher
- Elsevier BV
- Published
- 2014-06
- Volume
- 24
- Issue
- 11
- Pages
- 1256-1262
- ISSN
- 0960-9822 (ISSN-L)
- PMC
- PMC4046224
- OpenAlex
- W2016034937
- Semantic Scholar
- e40eefc9d7e41953e2a24e0bfd9701be9b8752bd
- Cited by
- 323
- References
- 52
- Citations by year
- 2026: 12 · 2025: 23 · 2024: 38 · 2023: 75 · 2022: 20 · 2021: 21 · 2020: 21 · 2019: 25 · 2018: 18 · 2017: 19 · 2016: 20 · 2015: 25 · 2014: 6
- FWCI
- 32.47
- Type
- journal article
- Language
- en
- Open access
- hybrid
- doi.org
- Locations
- Current Biology (publishedVersion, cc-by)
- Europe PMC (PubMed Central) (publishedVersion, cc-by)
- PubMed Central (publishedVersion, cc-by)
- PubMed (publishedVersion)
- ENLIGHTEN (Jurnal Bimbingan dan Konseling Islam) (acceptedVersion)
- Archive ouverte UNIGE (University of Geneva) (acceptedVersion, other-oa)
- UEA Digital Repository (University of East Anglia) (submittedVersion, cc-by)
- Archive ouverte UNIGE (University of Geneva) (submittedVersion, cc-by)
- Funders
- College of Science and Engineering, University of Minnesota
- Biotechnology and Biological Sciences Research Council (BB/G005044/1)
- Topics
- Social Sciences › Psychology › Experimental and Cognitive Psychology › Multisensory perception and integration
- Life Sciences › Neuroscience › Cognitive Neuroscience › Visual perception and processing mechanisms
- Life Sciences › Neuroscience › Cognitive Neuroscience › Tactile and Sensory Interactions
- Keywords
- early visual cortex, auditory imagery, auditory perception, top-down feedback, multisensory integration, predictive coding, abstract information, visuospatial processing, attention, working memory, blindfolded participants
- MeSH terms
- Acoustic Stimulation, Auditory Perception, Humans, Magnetic Resonance Imaging, Memory, Short-Term, Photic Stimulation, Visual Cortex, Visual Perception
About these checks
Registry, retraction, Cites and statistics results are computed, not judged, with one exception: a printed reference that no index lists is read once by a model before it counts as a citation error. Claims are extracted by a model and kept only when their quote appears verbatim in the text; each cited source is then checked, with a model’s help, for whether it says what the claim relies on. Those verdicts can be wrong — read the claim’s quote and the cited source before relying on one.
A language model drew the claims from the paper on 2026-10-10, under version 3 of the claim definition (model deepseek-v4.1-flash, prompt extract-v3).
A second model labelled each claim on 2026-10-10 (model jev-1.13-20260917, definition revision gold-guideline-v0.2).
Statistics and arithmetic are recomputed, not judged.
Confidence bands are shown only for fields calibrated on our annotated test set. None is calibrated yet, so no band is shown.
What counts as a claim ›How we measure confidence ›How we check this ›
Are you an author, or do you see a problem with this page? Request a review
