

The DOI matches its Crossref record; 59 of the 66 references it cites were found in a registry or an index; 2 of the 53 sources its claims cite were checked for support.
An investigation into per- and polyfluoroalkyl substances (PFAS) in nineteen Australian wastewater treatment plants (WWTPs)
Open accessAbstract
Quantifying the emissions of per- and polyfluoroalkyl substances (PFAS) from Australian wastewater treatment plants (WWTP) is of high importance due to potential impacts on receiving aquatic ecosystems. The new Australian PFAS National Environmental Management Plan recommends 0.23 ng L −1 of PFOS as the guideline value for 99% species protection for aquatic systems. In this study, 21 PFAS from four classes were measured in WWTP solid and aqueous samples from 19 Australian WWTPs. The mean ∑ 21 PFAS was 110 ng L −1 (median: 80 ng L −1 ; range: 9.3–520 ng L −1 ) in aqueous samples and 34 ng g −1 dw (median: 12 ng g −1 dw; range: 2.0–130 ng g −1 dw) in WWTP solids. Similar to WWTPs worldwide, perfluorocarboxylic acids were generally higher in effluent, compared to influent. Partitioning to solids within WWTPs increased with increasing fluoroalkyl chain length from 0.05 to 1.22 log units. Many PFAS were highly correlated, and PCA analysis showed strong associations between two groups: odd chained PFCAs, PFHxA and PFSAs; and 6:2 FTS with daily inflow volume and the proportion of trade waste accepted by WWTPs (as % of typical dry inflow). The compounds PFPeA, PFHxA, PFHpA, PFOA, PFNA, and PFDA increased significantly between influent and final effluent. The compounds 6:2 FTS and 8:2 FTS were quantified and F–53B detected and reported in Australian WWTP matrices. The compound 6:2 FTS was an important contributor to PFAS emissions in the studied Australian WWTPs, supporting the need for future research on its sources (including precursor degradation), environmental fate and impact in Australian aquatic environments receiving WWTP effluent.
Overview
AI snapshot
Written from the paper’s full text.
TL;DR
Twenty-one PFAS from four classes were measured in aqueous and solid samples from 19 Australian wastewater treatment plants, with PFAS detected in every sample. The study reports widespread PFAS occurrence, significant increases of several PFCAs from influent to final effluent, and 6:2 FTS as an important contributor to estimated emissions.
Key findings
- Mean ∑21PFAS was 110 ng L−1 (median 80 ng L−1; range 9.3–520 ng L−1) in aqueous samples and 34 ng g−1 dw (median 12 ng g−1 dw; range 2.0–130 ng g−1 dw) in solids; PFAS were detected in all samples from all matrices.
- ∑21PFAS increased across treatment stages: influent 76, primary effluent 89, secondary effluent 140, final effluent 140, and recycled water 120 ng L−1; PFPeA, PFHxA, PFHpA, PFOA, PFNA, and PFDA increased significantly between influent and final effluent.
- Partitioning to solids increased with fluoroalkyl chain length from 0.05 to 1.22 log units, and was higher for PFSAs than PFCAs of similar chain length, except 6:2 FTS, which had the lowest mean partitioning coefficient and primarily partitioned to the aqueous phase.
- 6:2 FTS was detected in 99% of aqueous samples (mean 7.3 ng L−1) and 26% of solid samples (mean 0.26 ng g−1 dw); estimated annual discharge for PFBA, PFPeA, and 6:2 FTS was 25, 27, and 19 kg, respectively, similar to PFOS (26 kg), and total ∑21PFAS discharge was estimated at 339 kg using the same annual discharge volume of 3013 GL.
Methods
- Three replicate aqueous and solid samples were collected from 19 Australian WWTPs throughout 2017, covering influent, primary effluent, secondary effluent, final effluent, recycled water, primary sludge, secondary sludge, and lagoon sludge; aqueous n = 201 and solid n = 51.
- Twenty-one PFAS from PFCAs, PFSAs, FTSs, and Cl-PFESAs were quantified by LC-MS/MS with isotope dilution after solid-phase extraction for aqueous samples and solvent extraction with dispersive SPE cleanup for solids.
- Analyses included descriptive statistics, Pearson correlations, linear mixed-effects models comparing influent and final effluent, PCA including daily inflow and percentage trade waste, and log Kd calculations for selected compounds where both aqueous and solid concentrations were above LOQ.
Limitations
- The paper states that laboratory control samples using ultrapure water and acid-washed sand may not adequately represent WWTP matrices and associated interferences, creating some uncertainty in analytical results.
- The paper states that annual discharge estimates from a single sampling campaign have high uncertainty due to daily and seasonal variation, and that log Kd calculations are only approximations because they assume equilibrium and do not consider differences in effluent and sludge retention times.
- Evident from the design: each WWTP was sampled once during 2017, so within-plant temporal variability and seasonal trends are not fully resolved; several compounds were detected only below LOQ or at low frequency, limiting statistical analysis.
Model-written summary. Check it against the paper before relying on it.
Integrity signals
Registry
Cites
Statistics
Figures
Verification
Claims the paper makes
74 Own result · 33 Not checked yet · 19 Own interpretation · 7 Own method · 2 Partly supported · 2 No basis given · accuracy not yet measured
A result the paper reports from its own data — it cites no other source for it, so there is none to check. The quote shows it is in the paper.
In the paper
“Mean concentrations in aqueous samples followed the trend: PFHxA > PFOA > PFOS > PFHxS > PFBA > PFPeA>6:2 FTS > PFHpA > PFBS > PFDA > PFPeS > PFNA > PFHpS>8:2 FTS > PFTeA > PFDS.”
§ An investigation into per- and polyfluoroalkyl substances (PFAS) in nineteen Australian wastewater treatment plants (WWTPs) > Results and discussion > PFAS in WWTP matrices
plain- Asserted: passes — The authors put it forward as true.
- Checkable: passes — It can be checked against evidence.
- Load-bearing: unclear — It is unclear whether the paper’s conclusions depend on it.
- Based: passes — The paper gives a reason why it holds.
A result the paper reports from its own data — it cites no other source for it, so there is none to check. The quote shows it is in the paper.
In the paper
“Partitioning to solids within WWTPs increased with increasing fluoroalkyl chain length from 0.05 to 1.22 log units.”
§ An investigation into per- and polyfluoroalkyl substances (PFAS) in nineteen Australian wastewater treatment plants (WWTPs) > Abstract
plaindirect- Asserted: passes — The authors put it forward as true.
- Checkable: passes — It can be checked against evidence.
- Load-bearing: passes — The paper’s conclusions depend on it.
- Based: passes — The paper gives a reason why it holds.
- The authors state this as an assumption: For the log Kd calculation, PFAS concentrations in solids and liquids at the sampled location were in equilibrium.
None of the sources cited for this claim have been checked yet.
In the paper
“Mean concentrations of PFAS in aqueous samples were similar to concentrations previously reported for Australian WWTP aqueous samples [37, 41, 43].”
§ An investigation into per- and polyfluoroalkyl substances (PFAS) in nineteen Australian wastewater treatment plants (WWTPs) > Results and discussion > PFAS in WWTP matrices
What the sources say
- Not checked yetcites [37] Gallen, 2018, A mass estimate of perfluoroalkyl substance (PFAS) release from Australian wastewater treatment plants, Chemosphere source
- Not checked yetcites [41] Thompson, 2011, Removal of PFOS, PFOA and other perfluoroalkyl acids at water reclamation plants in South East Queensland Australia, Chemosphere source
- Not checked yetcites [43] Nguyen, 2019, Temporal trends of per- and polyfluoroalkyl substances (PFAS) in the influent of two of the largest wastewater treatment plants in Australia, Emerg. Contam. source
plain- Asserted: passes — The authors put it forward as true.
- Checkable: passes — It can be checked against evidence.
- Load-bearing: unclear — It is unclear whether the paper’s conclusions depend on it.
- Based: passes — The paper gives a reason why it holds.
A result the paper reports from its own data — it cites no other source for it, so there is none to check. The quote shows it is in the paper.
In the paper
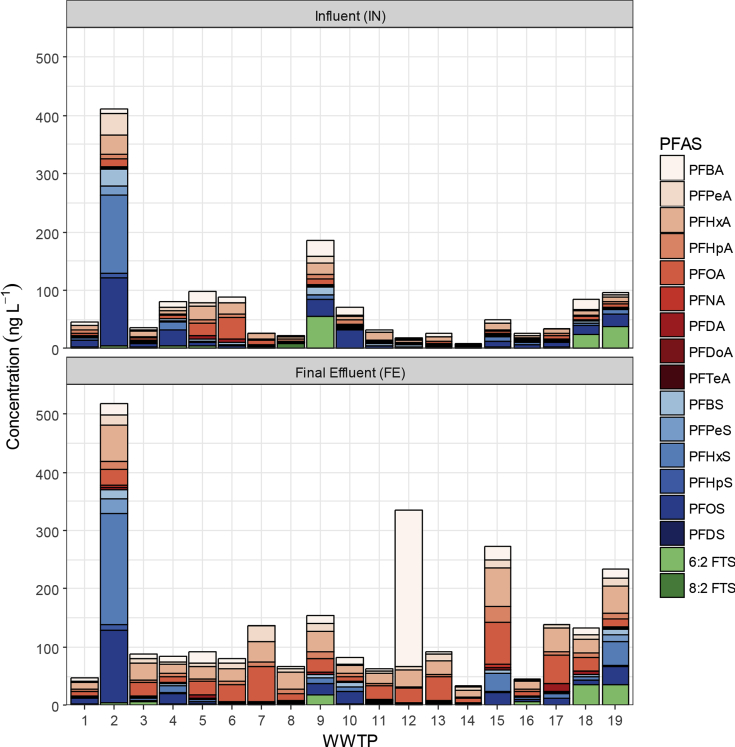
“The highest concentration measured in aqueous matrices for any compound was 370 ng L−1 for PFBA in final effluent at WWTP-12.”
§ An investigation into per- and polyfluoroalkyl substances (PFAS) in nineteen Australian wastewater treatment plants (WWTPs) > Results and discussion > PFAS in WWTP matrices
plain- Asserted: passes — The authors put it forward as true.
- Checkable: passes — It can be checked against evidence.
- Load-bearing: unclear — It is unclear whether the paper’s conclusions depend on it.
- Based: passes — The paper gives a reason why it holds.
A result the paper reports from its own data — it cites no other source for it, so there is none to check. The quote shows it is in the paper.
In the paper
“Eleven of the 21 compounds were detected in >90% of samples (PFBA, PFPeA, PFHxA, PFHpA, PFOA, PFNA, PFDA, PFBS, PFHxS, PFOS, 6:2 FTS), and these were used in the subsequent statistical analysis of influent and final effluent.”
§ An investigation into per- and polyfluoroalkyl substances (PFAS) in nineteen Australian wastewater treatment plants (WWTPs) > Results and discussion > PFAS in WWTP matrices
plain- Asserted: passes — The authors put it forward as true.
- Checkable: passes — It can be checked against evidence.
- Load-bearing: passes — The paper’s conclusions depend on it.
- Based: passes — The paper gives a reason why it holds.
A result the paper reports from its own data — it cites no other source for it, so there is none to check. The quote shows it is in the paper.
In the paper
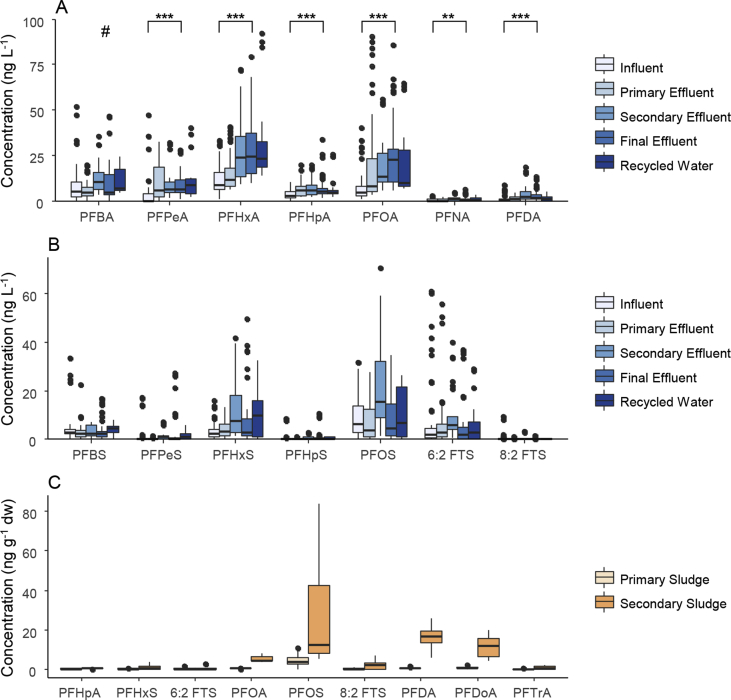
“The compounds PFPeA, PFHxA, PFHpA, PFOA, PFNA, and PFDA increased significantly between influent and final effluent.”
§ An investigation into per- and polyfluoroalkyl substances (PFAS) in nineteen Australian wastewater treatment plants (WWTPs) > Abstract
plaindirect- Asserted: passes — The authors put it forward as true.
- Checkable: passes — It can be checked against evidence.
- Load-bearing: passes — The paper’s conclusions depend on it.
- Based: passes — The paper gives a reason why it holds.
A result the paper reports from its own data — it cites no other source for it, so there is none to check. The quote shows it is in the paper.
In the paper
“Many PFAS were highly correlated”
§ An investigation into per- and polyfluoroalkyl substances (PFAS) in nineteen Australian wastewater treatment plants (WWTPs) > Abstract
plaincorrelational- Asserted: passes — The authors put it forward as true.
- Checkable: passes — It can be checked against evidence.
- Load-bearing: unclear — It is unclear whether the paper’s conclusions depend on it.
- Based: passes — The paper gives a reason why it holds.
A result the paper reports from its own data — it cites no other source for it, so there is none to check. The quote shows it is in the paper.
In the paper
“The compound 6:2 FTS was an important contributor to PFAS emissions in the studied Australian WWTPs”
§ An investigation into per- and polyfluoroalkyl substances (PFAS) in nineteen Australian wastewater treatment plants (WWTPs) > Abstract
plaincorrelational- Asserted: passes — The authors put it forward as true.
- Checkable: passes — It can be checked against evidence.
- Load-bearing: passes — The paper’s conclusions depend on it.
- Based: passes — The paper gives a reason why it holds.
A result the paper reports from its own data — it cites no other source for it, so there is none to check. The quote shows it is in the paper.
In the paper
“PFAS were detected in all samples from all matrices.”
§ An investigation into per- and polyfluoroalkyl substances (PFAS) in nineteen Australian wastewater treatment plants (WWTPs) > Results and discussion > PFAS in WWTP matrices
plain- Asserted: passes — The authors put it forward as true.
- Checkable: passes — It can be checked against evidence.
- Load-bearing: passes — The paper’s conclusions depend on it.
- Based: passes — The paper gives a reason why it holds.
A result the paper reports from its own data — it cites no other source for it, so there is none to check. The quote shows it is in the paper.
In the paper
“34 ng g−1 dw (median: 12 ng g−1 dw; range: 2.0–130 ng g−1 dw) in WWTP solids”
§ An investigation into per- and polyfluoroalkyl substances (PFAS) in nineteen Australian wastewater treatment plants (WWTPs) > Abstract
plain- Asserted: passes — The authors put it forward as true.
- Checkable: passes — It can be checked against evidence.
- Load-bearing: passes — The paper’s conclusions depend on it.
- Based: passes — The paper gives a reason why it holds.
- It may state two separate claims as one. 43
- Probably not a substantial claim. 20
The cited sources support only part of this claim — read each source’s verdict below.
In the paper
“Most PFAS are recalcitrant through conventional water treatment processes and, therefore, wastewater effluents can contain PFAS that has originated from domestic and industrial sources [11, 12].”
§ An investigation into per- and polyfluoroalkyl substances (PFAS) in nineteen Australian wastewater treatment plants (WWTPs) > Introduction
What the sources say
- Not checked yetcites [11] Arvaniti, 2015, Review on the occurrence, fate and removal of perfluorinated compounds during wastewater treatment, Sci. Total Environ. source
- Partly supportedcites [12] Hu, 2016, Detection of poly- and perfluoroalkyl substances (PFASs) in U.S. Drinking water linked to industrial sites, military fire training areas, and wastewater treatment plants, Environ. Sci. Technol. Lett. sourceExperimental — accuracy not yet measured
The Introduction states that PFAS are not removed by standard wastewater treatment methods and that concentrations can increase in effluent relative to influent. It does not identify domestic and industrial sources as the origins of PFAS in that effluent; the Methods section lists industrial sites and wastewater treatment plants as separate potential sources. (LLM, conf=0.83)
plaindirect- Asserted: passes — The authors put it forward as true.
- Checkable: passes — It can be checked against evidence.
- Load-bearing: passes — The paper’s conclusions depend on it.
- Based: passes — The paper gives a reason why it holds.
It may state two separate claims as one.
The cited sources support only part of this claim — read each source’s verdict below.
In the paper
“In component 3, there were strong associations between PFOS, PFHxS, PFOA, and PFDA, all of which have been used extensively in the past [4].”
§ An investigation into per- and polyfluoroalkyl substances (PFAS) in nineteen Australian wastewater treatment plants (WWTPs) > Results and discussion > Trends, correlations, and transformation
What the sources say
- Partly supportedcites [4] Buck, 2011, Perfluoroalkyl and polyfluoroalkyl substances in the environment: terminology, classification, and origins, Integr. Environ. Assess. Manag. sourceExperimental — accuracy not yet measured
The Introduction describes widespread historical use of PFASs. In the section on nonpolymer substances (page unavailable), the paper describes PFOS’s former industrial and commercial applications, decades of PFOA-salt use, and past production of PFHxS. It does not establish that PFHxS was used extensively or that PFDA specifically was used extensively. (LLM, conf=0.85)
plain- Asserted: passes — The authors put it forward as true.
- Checkable: passes — It can be checked against evidence.
- Load-bearing: fails — The paper’s conclusions may not depend on it.
- Based: passes — The paper gives a reason why it holds.
Probably not a substantial claim. The paper’s conclusions may not depend on it.
- Partly supported
A result the paper reports from its own data — it cites no other source for it, so there is none to check. The quote shows it is in the paper.
In the paper
“Similar to WWTPs worldwide, perfluorocarboxylic acids were generally higher in effluent, compared to influent.”
§ An investigation into per- and polyfluoroalkyl substances (PFAS) in nineteen Australian wastewater treatment plants (WWTPs) > Abstract
plaincorrelational- Asserted: passes — The authors put it forward as true.
- Checkable: passes — It can be checked against evidence.
- Load-bearing: unclear — It is unclear whether the paper’s conclusions depend on it.
- Based: passes — The paper gives a reason why it holds.
It may state two separate claims as one.
A result the paper reports from its own data — it cites no other source for it, so there is none to check. The quote shows it is in the paper.
In the paper
“PCA analysis showed strong associations between two groups: odd chained PFCAs, PFHxA and PFSAs; and 6:2 FTS with daily inflow volume and the proportion of trade waste accepted by WWTPs (as % of typical dry inflow).”
§ An investigation into per- and polyfluoroalkyl substances (PFAS) in nineteen Australian wastewater treatment plants (WWTPs) > Abstract
boostedcorrelational- Asserted: passes — The authors put it forward as true.
- Checkable: passes — It can be checked against evidence.
- Load-bearing: unclear — It is unclear whether the paper’s conclusions depend on it.
- Based: passes — The paper gives a reason why it holds.
It may state two separate claims as one.
A result the paper reports from its own data — it cites no other source for it, so there is none to check. The quote shows it is in the paper.
In the paper
“The compounds 6:2 FTS and 8:2 FTS were quantified and F–53B detected and reported in Australian WWTP matrices.”
§ An investigation into per- and polyfluoroalkyl substances (PFAS) in nineteen Australian wastewater treatment plants (WWTPs) > Abstract
plain- Asserted: passes — The authors put it forward as true.
- Checkable: passes — It can be checked against evidence.
- Load-bearing: passes — The paper’s conclusions depend on it.
- Based: passes — The paper gives a reason why it holds.
It may state two separate claims as one.
A result the paper reports from its own data — it cites no other source for it, so there is none to check. The quote shows it is in the paper.
In the paper
“WWTP-2 had the highest ∑21PFAS in influent and final effluent, with concentrations of 410 and 520 ng L−1, respectively.”
§ An investigation into per- and polyfluoroalkyl substances (PFAS) in nineteen Australian wastewater treatment plants (WWTPs) > Results and discussion > PFAS in WWTP matrices
plainn = 3- Asserted: passes — The authors put it forward as true.
- Checkable: passes — It can be checked against evidence.
- Load-bearing: unclear — It is unclear whether the paper’s conclusions depend on it.
- Based: passes — The paper gives a reason why it holds.
It may state two separate claims as one.
A result the paper reports from its own data — it cites no other source for it, so there is none to check. The quote shows it is in the paper.
In the paper
“6:2 FTS was detected in 99% of aqueous samples (mean 7.3 ng L−1) and 26% of solid samples (mean 0.26 ng g−1 dw), At three of the larger WWTPs (-9, 330 ML day−1; -18, 143 ML day−1; and -19, 498 ML day−1), elevated total PFAS loading was a result of increased 6:2 FTS in influent (56, 23 and 38 ng L−1, respectively).”
§ An investigation into per- and polyfluoroalkyl substances (PFAS) in nineteen Australian wastewater treatment plants (WWTPs) > Results and discussion > PFAS in WWTP matrices
plain- Asserted: passes — The authors put it forward as true.
- Checkable: passes — It can be checked against evidence.
- Load-bearing: unclear — It is unclear whether the paper’s conclusions depend on it.
- Based: passes — The paper gives a reason why it holds.
It may state two separate claims as one.
A result the paper reports from its own data — it cites no other source for it, so there is none to check. The quote shows it is in the paper.
In the paper
“PFCA concentrations in aqueous samples also increased from influent to final effluent, with levels persisting in recycled water, whilst PFSA concentrations within treatment plants varied.”
§ An investigation into per- and polyfluoroalkyl substances (PFAS) in nineteen Australian wastewater treatment plants (WWTPs) > Results and discussion > PFAS in WWTP matrices
plaindirect- Asserted: passes — The authors put it forward as true.
- Checkable: passes — It can be checked against evidence.
- Load-bearing: passes — The paper’s conclusions depend on it.
- Based: passes — The paper gives a reason why it holds.
It may state two separate claims as one.
A result the paper reports from its own data — it cites no other source for it, so there is none to check. The quote shows it is in the paper.
In the paper
“The calculated mean partitioning coefficients from this study reflected this trend, increasing with increased fluoroalkyl chain length, and were higher in PFSAs compared to PFCAs of similar carbon chain length; except for 6:2 FTS which displayed the lowest mean partitioning coefficient, being primarily partitioned to the aqueous phase (Table S5).”
§ An investigation into per- and polyfluoroalkyl substances (PFAS) in nineteen Australian wastewater treatment plants (WWTPs) > Results and discussion > PFAS in WWTP matrices
plain- Asserted: passes — The authors put it forward as true.
- Checkable: passes — It can be checked against evidence.
- Load-bearing: unclear — It is unclear whether the paper’s conclusions depend on it.
- Based: passes — The paper gives a reason why it holds.
It may state two separate claims as one.
A result the paper reports from its own data — it cites no other source for it, so there is none to check. The quote shows it is in the paper.
In the paper
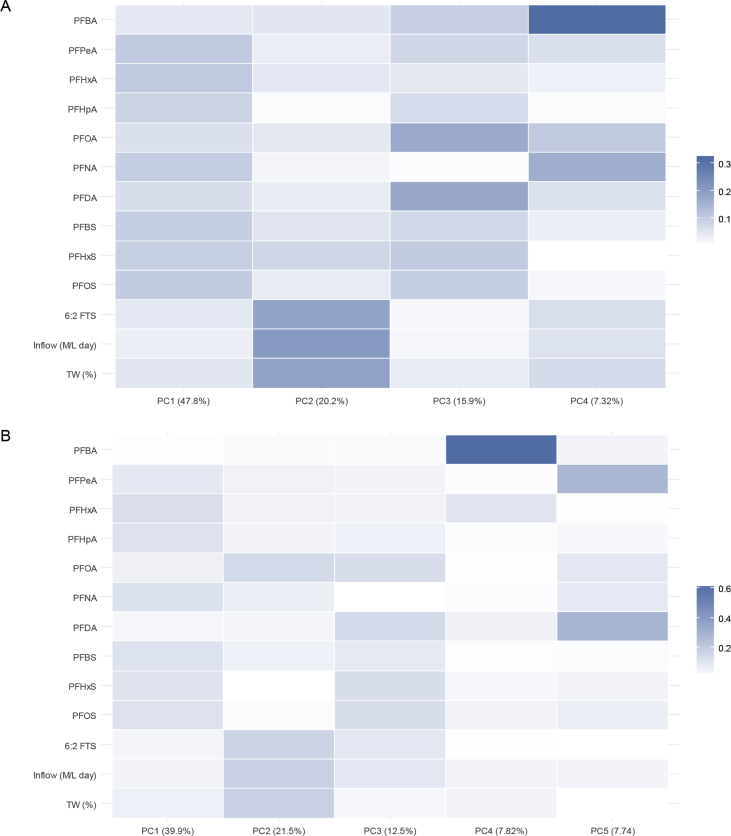
“The compounds PFPeA and PFDA were strongly associated, accounting for a small amount of the variation in component 5.”
§ An investigation into per- and polyfluoroalkyl substances (PFAS) in nineteen Australian wastewater treatment plants (WWTPs) > Results and discussion > Trends, correlations, and transformation
boostedcorrelational- Asserted: passes — The authors put it forward as true.
- Checkable: passes — It can be checked against evidence.
- Load-bearing: fails — The paper’s conclusions may not depend on it.
- Based: passes — The paper gives a reason why it holds.
Probably not a substantial claim. The paper’s conclusions may not depend on it. It may state two separate claims as one.
A result the paper reports from its own data — it cites no other source for it, so there is none to check. The quote shows it is in the paper.
In the paper
“PFHxA had the highest mean concentration from pooled aqueous samples in secondary effluent, final effluent, and recycled water; increasing in concentration from influent to primary, secondary and final effluent and recycled water (11, 16, 28, 28 and 32 ng L−1, respectively).”
§ An investigation into per- and polyfluoroalkyl substances (PFAS) in nineteen Australian wastewater treatment plants (WWTPs) > Results and discussion > PFAS in WWTP matrices
plaindirect- Asserted: passes — The authors put it forward as true.
- Checkable: passes — It can be checked against evidence.
- Load-bearing: unclear — It is unclear whether the paper’s conclusions depend on it.
- Based: passes — The paper gives a reason why it holds.
It may state two separate claims as one.
A result the paper reports from its own data — it cites no other source for it, so there is none to check. The quote shows it is in the paper.
In the paper
“There were four principal components in the influent data, and five principal components in the final effluent data with eigenvalues above 1 (Fig. 3).”
§ An investigation into per- and polyfluoroalkyl substances (PFAS) in nineteen Australian wastewater treatment plants (WWTPs) > Results and discussion > Trends, correlations, and transformation
plain- Asserted: passes — The authors put it forward as true.
- Checkable: passes — It can be checked against evidence.
- Load-bearing: unclear — It is unclear whether the paper’s conclusions depend on it.
- Based: passes — The paper gives a reason why it holds.
It may state two separate claims as one.
A result the paper reports from its own data — it cites no other source for it, so there is none to check. The quote shows it is in the paper.
In the paper
“In final effluent, there were significant, positive, strong correlations between PFPeA-PFHxA, PFPeA-PFOA, PFHxA-PFOA, PFHxA-PFNA, PFHpA-PFHxA, PFHpA-PFNA, PFHpA-PFHxS, PFHpA-PFOS, and PFHxS-PFOS.”
§ An investigation into per- and polyfluoroalkyl substances (PFAS) in nineteen Australian wastewater treatment plants (WWTPs) > Results and discussion > Trends, correlations, and transformation
boostedcorrelational- Asserted: passes — The authors put it forward as true.
- Checkable: passes — It can be checked against evidence.
- Load-bearing: passes — The paper’s conclusions depend on it.
- Based: passes — The paper gives a reason why it holds.
It may state two separate claims as one.
A result the paper reports from its own data — it cites no other source for it, so there is none to check. The quote shows it is in the paper.
In the paper
“In principle component 4, PFBA was the main contributor to variation, and behaved independently of the other PFCAs, reflecting the trend seen in influent.”
§ An investigation into per- and polyfluoroalkyl substances (PFAS) in nineteen Australian wastewater treatment plants (WWTPs) > Results and discussion > Trends, correlations, and transformation
plaincorrelational- Asserted: passes — The authors put it forward as true.
- Checkable: passes — It can be checked against evidence.
- Load-bearing: unclear — It is unclear whether the paper’s conclusions depend on it.
- Based: passes — The paper gives a reason why it holds.
It may state two separate claims as one.
A result the paper reports from its own data — it cites no other source for it, so there is none to check. The quote shows it is in the paper.
In the paper
“This increase between primary and secondary sludge was also reflected in the calculated distribution coefficients (Table S5); where coefficients increased between primary and secondary locations by 0.17–1.22 log units for PFOS and 0.37 to 1.34 log units for PFDA.”
§ An investigation into per- and polyfluoroalkyl substances (PFAS) in nineteen Australian wastewater treatment plants (WWTPs) > Results and discussion > PFAS in WWTP matrices
plaindirect- Asserted: passes — The authors put it forward as true.
- Checkable: passes — It can be checked against evidence.
- Load-bearing: unclear — It is unclear whether the paper’s conclusions depend on it.
- Based: passes — The paper gives a reason why it holds.
It may state two separate claims as one.
A result the paper reports from its own data — it cites no other source for it, so there is none to check. The quote shows it is in the paper.
In the paper
“There were no significant correlations for the following: 1) PFBA and all other compounds; 2) 6:2 FTS and 5 of the eleven compounds; 3) PFBS-PFOA and PFBS-PFDA; 4) PFHxS-PFPeA and PFHxS-PFOA; 5) PFOS-PFPeA, PFOS-PFOA, and PFOS-PFDA.”
§ An investigation into per- and polyfluoroalkyl substances (PFAS) in nineteen Australian wastewater treatment plants (WWTPs) > Results and discussion > Trends, correlations, and transformation
plain- Asserted: passes — The authors put it forward as true.
- Checkable: passes — It can be checked against evidence.
- Load-bearing: passes — The paper’s conclusions depend on it.
- Based: passes — The paper gives a reason why it holds.
It may state two separate claims as one.
A result the paper reports from its own data — it cites no other source for it, so there is none to check. The quote shows it is in the paper.
In the paper
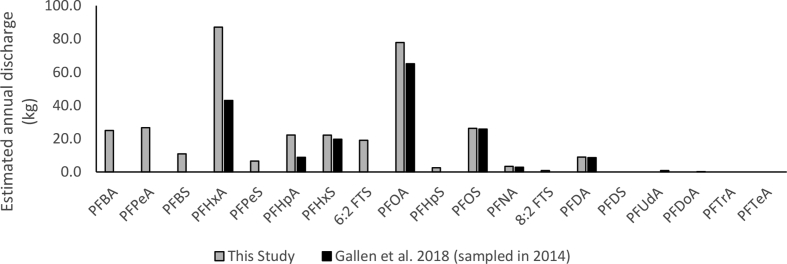
“In our study the estimated yearly mass discharged was higher for PFHpA (8.8 vs 22 kg annually) and PFHxA (43 vs 87 kg annually).”
§ An investigation into per- and polyfluoroalkyl substances (PFAS) in nineteen Australian wastewater treatment plants (WWTPs) > Results and discussion > Environmental discharge in final effluent
hedged- Asserted: passes — The authors put it forward as true.
- Checkable: passes — It can be checked against evidence.
- Load-bearing: unclear — It is unclear whether the paper’s conclusions depend on it.
- Based: passes — The paper gives a reason why it holds.
It may state two separate claims as one.
- The authors state this as an assumption: The same annual discharge volume of 3013 GL applies to the 19 WWTPs in this study.
A result the paper reports from its own data — it cites no other source for it, so there is none to check. The quote shows it is in the paper.
In the paper
“Daily discharge rates from the 19 WWTPs in this study varied greatly, were similar to previous Australian studies, similar to studies worldwide and were influenced primarily by daily inflow (and as an extension WWTP size; Table S6).”
§ An investigation into per- and polyfluoroalkyl substances (PFAS) in nineteen Australian wastewater treatment plants (WWTPs) > Results and discussion > Environmental discharge in final effluent
plaindirect- Asserted: passes — The authors put it forward as true.
- Checkable: passes — It can be checked against evidence.
- Load-bearing: unclear — It is unclear whether the paper’s conclusions depend on it.
- Based: passes — The paper gives a reason why it holds.
It may state two separate claims as one.
A result the paper reports from its own data — it cites no other source for it, so there is none to check. The quote shows it is in the paper.
In the paper
“In component 3, PFOA and PFDA were highly associated and in component 4, PFBA was the main contributor to the variation observed.”
§ An investigation into per- and polyfluoroalkyl substances (PFAS) in nineteen Australian wastewater treatment plants (WWTPs) > Results and discussion > Trends, correlations, and transformation
plaincorrelational- Asserted: passes — The authors put it forward as true.
- Checkable: passes — It can be checked against evidence.
- Load-bearing: unclear — It is unclear whether the paper’s conclusions depend on it.
- Based: passes — The paper gives a reason why it holds.
It may state two separate claims as one.
A result the paper reports from its own data — it cites no other source for it, so there is none to check. The quote shows it is in the paper.
In the paper
“In influent, positive, strong (r > 0.70) and significant (p < 0.05) correlations were displayed between compounds within the same compound class PFCAs (PFHxA-PFOA, PFHxA-PFNA, PFHxA-PFDA, and PFOA-PFDA) and between PFPeA-6:2 FTS and PFPeA-PFHxS.”
§ An investigation into per- and polyfluoroalkyl substances (PFAS) in nineteen Australian wastewater treatment plants (WWTPs) > Results and discussion > Trends, correlations, and transformation
plaincorrelational- Asserted: passes — The authors put it forward as true.
- Checkable: passes — It can be checked against evidence.
- Load-bearing: unclear — It is unclear whether the paper’s conclusions depend on it.
- Based: passes — The paper gives a reason why it holds.
It may state two separate claims as one.
A result the paper reports from its own data — it cites no other source for it, so there is none to check. The quote shows it is in the paper.
In the paper
“The compounds 6:2 FTS and 8:2 FTS quantified, and F–53B components 6:2 Cl-PFESA and 8:2 Cl-PFESA were detected in Australian WWTPs.”
§ An investigation into per- and polyfluoroalkyl substances (PFAS) in nineteen Australian wastewater treatment plants (WWTPs) > Conclusions
plain- Asserted: passes — The authors put it forward as true.
- Checkable: passes — It can be checked against evidence.
- Load-bearing: passes — The paper’s conclusions depend on it.
- Based: passes — The paper gives a reason why it holds.
It may state two separate claims as one.
A result the paper reports from its own data — it cites no other source for it, so there is none to check. The quote shows it is in the paper.
In the paper
“In component 1, the PFSAs (PFBS, PFHxS, PFOS), odd chained PFCAs (PFPeA, PFHpA, and PFNA), and PFHxA displayed strong associations and accounted for a large proportion of the variation within the data.”
§ An investigation into per- and polyfluoroalkyl substances (PFAS) in nineteen Australian wastewater treatment plants (WWTPs) > Results and discussion > Trends, correlations, and transformation
boostedcorrelational- Asserted: passes — The authors put it forward as true.
- Checkable: passes — It can be checked against evidence.
- Load-bearing: unclear — It is unclear whether the paper’s conclusions depend on it.
- Based: passes — The paper gives a reason why it holds.
It may state two separate claims as one.
A result the paper reports from its own data — it cites no other source for it, so there is none to check. The quote shows it is in the paper.
In the paper
“At WWTPs-5, 6 and 9, ∑21PFAS concentration was greater in influent than final effluent and largely due to PFSA and FTS concentrations.”
§ An investigation into per- and polyfluoroalkyl substances (PFAS) in nineteen Australian wastewater treatment plants (WWTPs) > Results and discussion > PFAS in WWTP matrices
plaindirect- Asserted: passes — The authors put it forward as true.
- Checkable: passes — It can be checked against evidence.
- Load-bearing: unclear — It is unclear whether the paper’s conclusions depend on it.
- Based: passes — The paper gives a reason why it holds.
It may state two separate claims as one.
A result the paper reports from its own data — it cites no other source for it, so there is none to check. The quote shows it is in the paper.
In the paper
“PFOA had the highest mean concentration in primary effluent (23 ng L−1), displaying an increase from mean influent concentration (7.9 ng L−1).”
§ An investigation into per- and polyfluoroalkyl substances (PFAS) in nineteen Australian wastewater treatment plants (WWTPs) > Results and discussion > PFAS in WWTP matrices
plaindirect- Asserted: passes — The authors put it forward as true.
- Checkable: passes — It can be checked against evidence.
- Load-bearing: unclear — It is unclear whether the paper’s conclusions depend on it.
- Based: passes — The paper gives a reason why it holds.
It may state two separate claims as one.
In the paper
“High concentrations of 6:2 FTS in WWTP effluents have been associated with AFFF use in catchments in the USA [33].”
§ An investigation into per- and polyfluoroalkyl substances (PFAS) in nineteen Australian wastewater treatment plants (WWTPs) > Results and discussion > PFAS in WWTP matrices
What the sources say
- Not checked yetcites [33] Houtz, 2016, Poly- and perfluoroalkyl substances in wastewater: significance of unknown precursors, manufacturing shifts, and likely AFFF impacts, Water Res. source
plaincorrelational- Asserted: passes — The authors put it forward as true.
- Checkable: passes — It can be checked against evidence.
- Load-bearing: fails — The paper’s conclusions may not depend on it.
- Based: passes — The paper gives a reason why it holds.
Probably not a substantial claim. The paper’s conclusions may not depend on it.
In the paper
“Within the NEMP, the recommended freshwater and marine guideline values (water concentrations) for 99% species protection are 0.23 and 1900 ng L−1 PFOS and PFOA, respectively (HEPA 2018).”
§ An investigation into per- and polyfluoroalkyl substances (PFAS) in nineteen Australian wastewater treatment plants (WWTPs) > Introduction
What the sources say
- Not checked yetcites [13] 2018
plain- Asserted: passes — The authors put it forward as true.
- Checkable: passes — It can be checked against evidence.
- Load-bearing: fails — The paper’s conclusions may not depend on it.
- Based: passes — The paper gives a reason why it holds.
Probably not a substantial claim. The paper’s conclusions may not depend on it. It may state two separate claims as one.
What the paper did — it cites no source for this, so there is none to check. The quote shows it is in the paper.
In the paper
“Only one compound (PFBA) was detected above LOD in field blanks from treatment plants WWTP-7 and WWTP-17; due to this, PFBA results for these two treatment plants were set as < LOD.”
§ An investigation into per- and polyfluoroalkyl substances (PFAS) in nineteen Australian wastewater treatment plants (WWTPs) > Materials and methods > Quality control
plain- Asserted: passes — The authors put it forward as true.
- Checkable: passes — It can be checked against evidence.
- Load-bearing: unclear — It is unclear whether the paper’s conclusions depend on it.
- Based: passes — The paper gives a reason why it holds.
It may state two separate claims as one.
In the paper
“6:2 FTS has been employed in aqueous film-forming firefighting foam (AFFF) in mixtures with fluoroalkylthioamido sulfonates [56], used as a PFOS replacement in metal plating applications [57] and is a transformation intermediate in the degradation of more complex fluorotelomer-based compounds [4].”
§ An investigation into per- and polyfluoroalkyl substances (PFAS) in nineteen Australian wastewater treatment plants (WWTPs) > Results and discussion > PFAS in WWTP matrices
What the sources say
- Not checked yetcites [56] Schultz, 2004, Quantitative determination of fluorotelomer sulfonates in groundwater by LC MS/MS, Environ. Sci. Technol. source
plain- Asserted: passes — The authors put it forward as true.
- Checkable: passes — It can be checked against evidence.
- Load-bearing: fails — The paper’s conclusions may not depend on it.
- Based: passes — The paper gives a reason why it holds.
Probably not a substantial claim. The paper’s conclusions may not depend on it.
What the paper did — it cites no source for this, so there is none to check. The quote shows it is in the paper.
In the paper
“Mean recovery of all compounds in LCS samples ranged from 80 to 120% with s.d. < 15%, except for 6:2 FTS (61% s.d. 8%).”
§ An investigation into per- and polyfluoroalkyl substances (PFAS) in nineteen Australian wastewater treatment plants (WWTPs) > Materials and methods > Quality control
plain- Asserted: passes — The authors put it forward as true.
- Checkable: passes — It can be checked against evidence.
- Load-bearing: unclear — It is unclear whether the paper’s conclusions depend on it.
- Based: passes — The paper gives a reason why it holds.
It may state two separate claims as one.
None of the sources cited for this claim have been checked yet.
In the paper
“Australian WWTPs represent a unique case as there is no reported PFAS manufacture and low rates of PFAS are imported for direct use in industries such as car manufacture, chrome plating, leather treatment, medical imaging, firefighting and in goods already impregnated (carpets, furniture, etc.) or in products containing PFAS as impurities [13, 44].”
§ An investigation into per- and polyfluoroalkyl substances (PFAS) in nineteen Australian wastewater treatment plants (WWTPs) > Introduction
What the sources say
- Not checked yetcites [13] 2018
- Not checked yetcites [44] NICNAS, 2013
plain- Asserted: passes — The authors put it forward as true.
- Checkable: passes — It can be checked against evidence.
- Load-bearing: unclear — It is unclear whether the paper’s conclusions depend on it.
- Based: passes — The paper gives a reason why it holds.
It may state two separate claims as one.
In the paper
“6:2 FTS has been employed in aqueous film-forming firefighting foam (AFFF) in mixtures with fluoroalkylthioamido sulfonates [56], used as a PFOS replacement in metal plating applications [57] and is a transformation intermediate in the degradation of more complex fluorotelomer-based compounds [4].”
§ An investigation into per- and polyfluoroalkyl substances (PFAS) in nineteen Australian wastewater treatment plants (WWTPs) > Results and discussion > PFAS in WWTP matrices
What the sources say
- Not checked yetcites [4] Buck, 2011, Perfluoroalkyl and polyfluoroalkyl substances in the environment: terminology, classification, and origins, Integr. Environ. Assess. Manag. source
plaindirect- Asserted: passes — The authors put it forward as true.
- Checkable: passes — It can be checked against evidence.
- Load-bearing: fails — The paper’s conclusions may not depend on it.
- Based: passes — The paper gives a reason why it holds.
Probably not a substantial claim. The paper’s conclusions may not depend on it.
None of the sources cited for this claim have been checked yet.
In the paper
“The increase of PFAAs has been attributed to the degradation of the PFAS precursor compounds [32, 33], fluorotelomer sulfonoates (FTS) and fluorotelomer alcohols (FOTH), that have been shown to transform to stable PFAAs in WWTP sludge [34, 35].”
§ An investigation into per- and polyfluoroalkyl substances (PFAS) in nineteen Australian wastewater treatment plants (WWTPs) > Introduction
What the sources say
- Not checked yetcites [32] Eriksson, 2017, Contribution of precursor compounds to the release of per- and polyfluoroalkyl substances (PFASs) from waste water treatment plants (WWTPs), J. Environ. Sci. source
- Not checked yetcites [33] Houtz, 2016, Poly- and perfluoroalkyl substances in wastewater: significance of unknown precursors, manufacturing shifts, and likely AFFF impacts, Water Res. source
- Not checked yetcites [34] Zhao, 2013, 6:2 Fluorotelomer alcohol aerobic biotransformation in activated sludge from two domestic wastewater treatment plants, Chemosphere source
- Not checked yetcites [35] Wang, 2011, 6:2 Fluorotelomer sulfonate aerobic biotransformation in activated sludge of waste water treatment plants, Chemosphere source
plaindirect- Asserted: passes — The authors put it forward as true.
- Checkable: passes — It can be checked against evidence.
- Load-bearing: unclear — It is unclear whether the paper’s conclusions depend on it.
- Based: passes — The paper gives a reason why it holds.
It may state two separate claims as one.
None of the sources cited for this claim have been checked yet.
In the paper
“F–53B is used as a PFOS alternative for mist suppression in metal plating applications used in China that has recently been detected in Chinese WWTPs and the environment [19, 24, 25].”
§ An investigation into per- and polyfluoroalkyl substances (PFAS) in nineteen Australian wastewater treatment plants (WWTPs) > Results and discussion > PFAS in WWTP matrices
What the sources say
- Not checked yetcites [19] Ruan, 2015, Identification of novel polyfluorinated ether sulfonates as PFOS alternatives in municipal sewage sludge in China, Environ. Sci. Technol. source
- Not checked yetcites [24] Wang, 2013, First report of a Chinese PFOS alternative overlooked for 30 Years: its toxicity, persistence, and presence in the environment, Environ. Sci. Technol. source
- Not checked yetcites [25] Shi, 2015, Tissue distribution and whole body burden of the chlorinated polyfluoroalkyl ether sulfonic acid F-53B in crucian carp (Carassius carassius): evidence for a highly bioaccumulative contaminant of emerging concern, Environ. Sci. Technol. source
plain- Asserted: passes — The authors put it forward as true.
- Checkable: passes — It can be checked against evidence.
- Load-bearing: fails — The paper’s conclusions may not depend on it.
- Based: passes — The paper gives a reason why it holds.
Probably not a substantial claim. The paper’s conclusions may not depend on it. It may state two separate claims as one.
In the paper
“In Australia between 2006 and 2007, 99% of the directly imported PFOS was for use as a mist suppressant in metal plating which is listed as an approved, essential use [58].”
§ An investigation into per- and polyfluoroalkyl substances (PFAS) in nineteen Australian wastewater treatment plants (WWTPs) > Results and discussion > PFAS in WWTP matrices
What the sources say
- Not checked yetcites [58] NICNAS. Alert, 2008
plain- Asserted: passes — The authors put it forward as true.
- Checkable: passes — It can be checked against evidence.
- Load-bearing: unclear — It is unclear whether the paper’s conclusions depend on it.
- Based: passes — The paper gives a reason why it holds.
It may state two separate claims as one.
In the paper
“PFAS have been detected in WWTP influent, effluent and solids worldwide [11].”
§ An investigation into per- and polyfluoroalkyl substances (PFAS) in nineteen Australian wastewater treatment plants (WWTPs) > Introduction
What the sources say
- Not checked yetcites [11] Arvaniti, 2015, Review on the occurrence, fate and removal of perfluorinated compounds during wastewater treatment, Sci. Total Environ. source
plain- Asserted: passes — The authors put it forward as true.
- Checkable: passes — It can be checked against evidence.
- Load-bearing: fails — The paper’s conclusions may not depend on it.
- Based: passes — The paper gives a reason why it holds.
Probably not a substantial claim. The paper’s conclusions may not depend on it.
None of the sources cited for this claim have been checked yet.
In the paper
“In some studies, concentrations of compounds such as perfluorocarboxylic acids (PFCA) and perfluorosulfonic acids (PFSA) have increased from influent to final effluent [11, 27, 31].”
§ An investigation into per- and polyfluoroalkyl substances (PFAS) in nineteen Australian wastewater treatment plants (WWTPs) > Introduction
What the sources say
- Not checked yetcites [11] Arvaniti, 2015, Review on the occurrence, fate and removal of perfluorinated compounds during wastewater treatment, Sci. Total Environ. source
- Not checked yetcites [27] Arvaniti, 2014, Sorption of Perfluorinated Compounds onto different types of sewage sludge and assessment of its importance during wastewater treatment, Chemosphere source
- Not checked yetcites [31] Filipovic, 2015, Are perfluoroalkyl acids in waste water treatment plant effluents the result of primary emissions from the technosphere or of environmental recirculation?, Chemosphere source
hedgeddirect- Asserted: passes — The authors put it forward as true.
- Checkable: passes — It can be checked against evidence.
- Load-bearing: fails — The paper’s conclusions may not depend on it.
- Based: passes — The paper gives a reason why it holds.
Probably not a substantial claim. The paper’s conclusions may not depend on it.
What the paper did — it cites no source for this, so there is none to check. The quote shows it is in the paper.
In the paper
“The use of ultrapure water and acid-washed sand as laboratory control samples may not adequately represent WWTP matrices (and the associated interferences) and present some uncertainty with analytical results.”
§ An investigation into per- and polyfluoroalkyl substances (PFAS) in nineteen Australian wastewater treatment plants (WWTPs) > Materials and methods > Quality control
hedgedconditional- Asserted: passes — The authors put it forward as true.
- Checkable: passes — It can be checked against evidence.
- Load-bearing: fails — The paper’s conclusions may not depend on it.
- Based: passes — The paper gives a reason why it holds.
Probably not a substantial claim. The paper’s conclusions may not depend on it.
In the paper
“An Australian-wide study measuring nine PFAS in WWTP effluent (range from n. d. to 240 ng L−1) and biosolids, sampled in 2016, estimated that Australian WWTPs have discharged an estimated 33 kg PFOS and 67 kg PFOA, annually [37].”
§ An investigation into per- and polyfluoroalkyl substances (PFAS) in nineteen Australian wastewater treatment plants (WWTPs) > Introduction
What the sources say
- Not checked yetcites [37] Gallen, 2018, A mass estimate of perfluoroalkyl substance (PFAS) release from Australian wastewater treatment plants, Chemosphere source
hedged- Asserted: passes — The authors put it forward as true.
- Checkable: passes — It can be checked against evidence.
- Load-bearing: fails — The paper’s conclusions may not depend on it.
- Based: passes — The paper gives a reason why it holds.
Probably not a substantial claim. The paper’s conclusions may not depend on it. It may state two separate claims as one.
In the paper
“These compounds have been demonstrated as the major components of the commercial product F–53B after purification, with a reported 6:2 Cl-PFESA content of 77.6% and 8:2 Cl-PFESA comprising an unreported percentage of the remaining fraction [19].”
§ An investigation into per- and polyfluoroalkyl substances (PFAS) in nineteen Australian wastewater treatment plants (WWTPs) > Results and discussion > PFAS in WWTP matrices
What the sources say
- Not checked yetcites [19] Ruan, 2015, Identification of novel polyfluorinated ether sulfonates as PFOS alternatives in municipal sewage sludge in China, Environ. Sci. Technol. source
boosted- Asserted: passes — The authors put it forward as true.
- Checkable: passes — It can be checked against evidence.
- Load-bearing: fails — The paper’s conclusions may not depend on it.
- Based: passes — The paper gives a reason why it holds.
Probably not a substantial claim. The paper’s conclusions may not depend on it. It may state two separate claims as one.
In the paper
“6:2 FTS has been employed in aqueous film-forming firefighting foam (AFFF) in mixtures with fluoroalkylthioamido sulfonates [56], used as a PFOS replacement in metal plating applications [57] and is a transformation intermediate in the degradation of more complex fluorotelomer-based compounds [4].”
§ An investigation into per- and polyfluoroalkyl substances (PFAS) in nineteen Australian wastewater treatment plants (WWTPs) > Results and discussion > PFAS in WWTP matrices
What the sources say
- Not checked yetcites [57] Wang, 2013, Fluorinated alternatives to long-chain perfluoroalkyl carboxylic acids (PFCAs), perfluoroalkane sulfonic acids (PFSAs) and their potential precursors, Environ. Int. source
plaindirect- Asserted: passes — The authors put it forward as true.
- Checkable: passes — It can be checked against evidence.
- Load-bearing: fails — The paper’s conclusions may not depend on it.
- Based: passes — The paper gives a reason why it holds.
Probably not a substantial claim. The paper’s conclusions may not depend on it.
What the paper did — it cites no source for this, so there is none to check. The quote shows it is in the paper.
In the paper
“Linear calibration curves were prepared by gravimetric dilution of a mixed PFAS standard solution (100 ng mL−1 in methanol) with methanol to 9 levels with r2 > 0.99.”
§ An investigation into per- and polyfluoroalkyl substances (PFAS) in nineteen Australian wastewater treatment plants (WWTPs) > Materials and methods > Quality control
plain- Asserted: passes — The authors put it forward as true.
- Checkable: passes — It can be checked against evidence.
- Load-bearing: fails — The paper’s conclusions may not depend on it.
- Based: passes — The paper gives a reason why it holds.
Probably not a substantial claim. The paper’s conclusions may not depend on it.
What the paper did — it cites no source for this, so there is none to check. The quote shows it is in the paper.
In the paper
“Mean recovery of all compounds in LCS samples ranged from 80 to 120% with s.d. < 15%, except for PFDS (72%, s.d. 13%), 8:2 Cl-PFESA (73%, s.d. 7%), PFTrA (70%, s.d. 6%) and PFTeA (76%, s.d. 6%) (Table S2).”
§ An investigation into per- and polyfluoroalkyl substances (PFAS) in nineteen Australian wastewater treatment plants (WWTPs) > Materials and methods > Quality control
plain- Asserted: passes — The authors put it forward as true.
- Checkable: passes — It can be checked against evidence.
- Load-bearing: unclear — It is unclear whether the paper’s conclusions depend on it.
- Based: passes — The paper gives a reason why it holds.
It may state two separate claims as one.
None of the sources cited for this claim have been checked yet.
In the paper
“The Australian metal plating industry has no need to switch to alternatives like F–53B as PFOS is still approved for use.”
§ An investigation into per- and polyfluoroalkyl substances (PFAS) in nineteen Australian wastewater treatment plants (WWTPs) > Results and discussion > PFAS in WWTP matrices
plaindirect- Asserted: passes — The authors put it forward as true.
- Checkable: passes — It can be checked against evidence.
- Load-bearing: fails — The paper’s conclusions may not depend on it.
- Based: passes — The paper gives a reason why it holds.
Probably not a substantial claim. The paper’s conclusions may not depend on it. It may state two separate claims as one.
A conclusion the paper draws from its own results — it cites no other source for it, so there is none to check. The quote shows it is in the paper.
In the paper
“This implies the distribution of PFCAs and PFSAs are WWTP specific and vary in final effluent independently of each other.”
§ An investigation into per- and polyfluoroalkyl substances (PFAS) in nineteen Australian wastewater treatment plants (WWTPs) > Results and discussion > Trends, correlations, and transformation
plaincorrelational- Asserted: passes — The authors put it forward as true.
- Checkable: passes — It can be checked against evidence.
- Load-bearing: passes — The paper’s conclusions depend on it.
- Based: passes — The paper gives a reason why it holds.
It may state two separate claims as one.
In the paper
“Furthermore, both PFOA and PFHxA have displayed net positive increases from influent to effluent, associated with diPAP and unknown PFAS precursor degradation in WWTP influent and sludge in three Swedish WWTPs [32].”
§ An investigation into per- and polyfluoroalkyl substances (PFAS) in nineteen Australian wastewater treatment plants (WWTPs) > Results and discussion > PFAS in WWTP matrices
What the sources say
- Not checked yetcites [32] Eriksson, 2017, Contribution of precursor compounds to the release of per- and polyfluoroalkyl substances (PFASs) from waste water treatment plants (WWTPs), J. Environ. Sci. source
plaincorrelational- Asserted: passes — The authors put it forward as true.
- Checkable: passes — It can be checked against evidence.
- Load-bearing: fails — The paper’s conclusions may not depend on it.
- Based: passes — The paper gives a reason why it holds.
Probably not a substantial claim. The paper’s conclusions may not depend on it. It may state two separate claims as one.
In the paper
“Furthermore, degradation of the compound 6:2 FTOH in activated sludge has been demonstrated to produce the corresponding 5:3 acid, which is then degraded further to PFHxA [34].”
§ An investigation into per- and polyfluoroalkyl substances (PFAS) in nineteen Australian wastewater treatment plants (WWTPs) > Results and discussion > PFAS in WWTP matrices
What the sources say
- Not checked yetcites [34] Zhao, 2013, 6:2 Fluorotelomer alcohol aerobic biotransformation in activated sludge from two domestic wastewater treatment plants, Chemosphere source
boosteddirect- Asserted: passes — The authors put it forward as true.
- Checkable: passes — It can be checked against evidence.
- Load-bearing: passes — The paper’s conclusions depend on it.
- Based: passes — The paper gives a reason why it holds.
It may state two separate claims as one.
A conclusion the paper draws from its own results — it cites no other source for it, so there is none to check. The quote shows it is in the paper.
In the paper
“This difference may be a result of changing PFAS use patterns or bias introduced through the WWTPs selected and sampling design each study.”
§ An investigation into per- and polyfluoroalkyl substances (PFAS) in nineteen Australian wastewater treatment plants (WWTPs) > Results and discussion > Environmental discharge in final effluent
hedgedconditional- Asserted: passes — The authors put it forward as true.
- Checkable: passes — It can be checked against evidence.
- Load-bearing: fails — The paper’s conclusions may not depend on it.
- Based: passes — The paper gives a reason why it holds.
Probably not a substantial claim. The paper’s conclusions may not depend on it. It may state two separate claims as one.
In the paper
“Furthermore, in Australia, PFOS is still employed in approved uses and there are no current restrictions on PFHxS or PFBS [13].”
§ An investigation into per- and polyfluoroalkyl substances (PFAS) in nineteen Australian wastewater treatment plants (WWTPs) > Results and discussion > Trends, correlations, and transformation
What the sources say
- Not checked yetcites [13] 2018
plain- Asserted: passes — The authors put it forward as true.
- Checkable: passes — It can be checked against evidence.
- Load-bearing: unclear — It is unclear whether the paper’s conclusions depend on it.
- Based: passes — The paper gives a reason why it holds.
It may state two separate claims as one.
In the paper
“In their study, they estimated a national ∑9PFAS discharge from Australian WWTPs as 175 kg per year in Australian WWTP effluent [37].”
§ An investigation into per- and polyfluoroalkyl substances (PFAS) in nineteen Australian wastewater treatment plants (WWTPs) > Results and discussion > Environmental discharge in final effluent
What the sources say
- Not checked yetcites [37] Gallen, 2018, A mass estimate of perfluoroalkyl substance (PFAS) release from Australian wastewater treatment plants, Chemosphere source
hedged- Asserted: passes — The authors put it forward as true.
- Checkable: passes — It can be checked against evidence.
- Load-bearing: passes — The paper’s conclusions depend on it.
- Based: passes — The paper gives a reason why it holds.
Probably not a substantial claim.
In the paper
“Little transformation of 6:2 FTOH to PFPeA was observed as the intermediary product 5:2s FTOH was likely volatilized before biotransformation could occur.”
§ An investigation into per- and polyfluoroalkyl substances (PFAS) in nineteen Australian wastewater treatment plants (WWTPs) > Results and discussion > PFAS in WWTP matrices
What the sources say
- Not checked yetcites [34] Zhao, 2013, 6:2 Fluorotelomer alcohol aerobic biotransformation in activated sludge from two domestic wastewater treatment plants, Chemosphere source
hedgeddirect- Asserted: passes — The authors put it forward as true.
- Checkable: passes — It can be checked against evidence.
- Load-bearing: passes — The paper’s conclusions depend on it.
- Based: passes — The paper gives a reason why it holds.
It may state two separate claims as one.
A conclusion the paper draws from its own results — it cites no other source for it, so there is none to check. The quote shows it is in the paper.
In the paper
“The strong associations of these compounds and their contribution to the observed variation in influent data may reflect Australian PFAS usage trends and PFAS loading within specific WWTP catchments.”
§ An investigation into per- and polyfluoroalkyl substances (PFAS) in nineteen Australian wastewater treatment plants (WWTPs) > Results and discussion > Trends, correlations, and transformation
hedgedconditional- Asserted: passes — The authors put it forward as true.
- Checkable: passes — It can be checked against evidence.
- Load-bearing: unclear — It is unclear whether the paper’s conclusions depend on it.
- Based: passes — The paper gives a reason why it holds.
It may state two separate claims as one.
None of the sources cited for this claim have been checked yet.
In the paper
“Short-odd chain PFCAs (<C8) and PFHxA have been associated as impurities, degradants and metabolites of the short-chain fluorochemistries used to replace PFOA [4, 18, 62]”
§ An investigation into per- and polyfluoroalkyl substances (PFAS) in nineteen Australian wastewater treatment plants (WWTPs) > Results and discussion > Trends, correlations, and transformation
What the sources say
- Not checked yetcites [4] Buck, 2011, Perfluoroalkyl and polyfluoroalkyl substances in the environment: terminology, classification, and origins, Integr. Environ. Assess. Manag. source
- Not checked yetcites [18] Liu, 2013, Microbial degradation of polyfluoroalkyl chemicals in the environment: a review, Environ. Int. source
- Not checked yetcites [62] Luz, 2019, Perfluorohexanoic acid toxicity, part I: development of a chronic human health toxicity value for use in risk assessment, Regul. Toxicol. Pharmacol. source
plaincorrelational- Asserted: passes — The authors put it forward as true.
- Checkable: passes — It can be checked against evidence.
- Load-bearing: fails — The paper’s conclusions may not depend on it.
- Based: passes — The paper gives a reason why it holds.
Probably not a substantial claim. The paper’s conclusions may not depend on it.
A conclusion the paper draws from its own results — it cites no other source for it, so there is none to check. The quote shows it is in the paper.
In the paper
“This strong association was largely a result of the larger WWTPs accepting a higher proportion of trade waste, however, it shows the importance of 6:2 FTS as a possible trade waste indicator in these Australian WWTPs.”
§ An investigation into per- and polyfluoroalkyl substances (PFAS) in nineteen Australian wastewater treatment plants (WWTPs) > Results and discussion > Trends, correlations, and transformation
hedgeddirect- Asserted: passes — The authors put it forward as true.
- Checkable: passes — It can be checked against evidence.
- Load-bearing: passes — The paper’s conclusions depend on it.
- Based: passes — The paper gives a reason why it holds.
It may state two separate claims as one.
What the paper did — it cites no source for this, so there is none to check. The quote shows it is in the paper.
In the paper
“Due to the delay of transmission of PFAS (caused by hydraulic retention time) within a wastewater treatment plant, the comparison of influent and effluent over the same 24-hour period may not be directly applicable.”
§ An investigation into per- and polyfluoroalkyl substances (PFAS) in nineteen Australian wastewater treatment plants (WWTPs) > Results and discussion > PFAS in WWTP matrices
hedgedconditional- Asserted: passes — The authors put it forward as true.
- Checkable: passes — It can be checked against evidence.
- Load-bearing: fails — The paper’s conclusions may not depend on it.
- Based: passes — The paper gives a reason why it holds.
Probably not a substantial claim. The paper’s conclusions may not depend on it.
A conclusion the paper draws from its own results — it cites no other source for it, so there is none to check. The quote shows it is in the paper.
In the paper
“Many PFAS were highly correlated, suggesting similar sources of PFSAs and PFCAs and independent behavior of these compound classes within WWTPs.”
§ An investigation into per- and polyfluoroalkyl substances (PFAS) in nineteen Australian wastewater treatment plants (WWTPs) > Conclusions
hedgedcorrelational- Asserted: passes — The authors put it forward as true.
- Checkable: passes — It can be checked against evidence.
- Load-bearing: passes — The paper’s conclusions depend on it.
- Based: passes — The paper gives a reason why it holds.
It may state two separate claims as one.
The authors state this as an assumption.
For the log Kd calculation, PFAS concentrations in solids and liquids at the sampled location were in equilibrium.
“This calculation method is only an approximation as it assumed that the concentration of PFAS in solids and liquids at the sampled location were in equilibrium and does not consider the differences in effluent and sludge retention times.”
The paper relies on this without support.
Typical wastewater treatment processes are unable to remove PFAS from the final effluent.
“Typical wastewater treatment processes are unable to remove PFAS from the final effluent.”
The paper relies on this without support.
In Australian cities, sewer systems are closed, with separate stormwater sewers and low infiltration rates, so rainfall has limited effect on influent PFAS composition as opposed to pulse events from industrial effluent discharge.
“Furthermore, unlike many parts of the world, in Australian cities, sewer systems are closed, with separate stormwater sewers and low infiltration rates, this means rainfall has limited effect on influent PFAS composition as opposed to pulse events from industrial effluent discharge.”
The authors state this as an assumption.
The same annual discharge volume of 3013 GL applies to the 19 WWTPs in this study.
“Assuming the same annual discharge volume of 3013 GL and using mean annual discharge rates from the 19 WWTPs in this study, we calculated an estimated discharge of ∑21PFAS of 339 kg.”
Claims other papers make about this one
Each is checked against this paper’s own text: does it say what the citing paper says it does?
The source backs part of the claim, not all of it — or backs it for a different population, condition or comparison.
In the citing paper
“all of which are analytes that have been reported at the highest concentrations when assessing similar suites of PFAS in other studies (Coggan et al., 2019; Sardiña et al., 2019).”
From Occurrence, transformation, and transport of PFAS entering, leaving, and flowing past wastewater treatment plants with diverse land uses (2024) · cites this paper as Coggan et al., 2019
Experimental — accuracy not yet measuredThe cited source says what the claim attributes to it.
In the citing paper
“Because of the novelty of PFAS as a contaminant of concern, wastewater treatment plants (WWTPs) are not designed to remove PFAS from influent, often resulting in measured effluent concentrations exceeding influent concentrations (Coggan et al., 2019; Dalahmeh et al., 2018; Hamid and Li, 2016; Lenka et al., 2021).”
From Occurrence, transformation, and transport of PFAS entering, leaving, and flowing past wastewater treatment plants with diverse land uses (2024) · cites this paper as Coggan et al., 2019
The cited source says what the claim attributes to it.
In the citing paper
“Because of the novelty of PFAS as a contaminant of concern, wastewater treatment plants (WWTPs) are not designed to remove PFAS from influent, often resulting in measured effluent concentrations exceeding influent concentrations (Coggan et al., 2019; Dalahmeh et al., 2018; Hamid and Li, 2016; Lenka et al., 2021).”
From Occurrence, transformation, and transport of PFAS entering, leaving, and flowing past wastewater treatment plants with diverse land uses (2024) · cites this paper as Coggan et al., 2019
The cited source says what the claim attributes to it.
In the citing paper
“Coggan et al. (2019) observed mean PFAS concentrations increase from 76 ng/L in influent to 140 ng/L in effluent across 19 WWTPs in Australia.”
From Occurrence, transformation, and transport of PFAS entering, leaving, and flowing past wastewater treatment plants with diverse land uses (2024) · cites this paper as Coggan et al. (2019)
The check wasn’t confident either way, so it gives no verdict — never disputed.
In the citing paper
“Tributaries that join Little Neshaminy Creek between sites 11-12 could also be a potential source of PFDA in the system, although several studies have observed PFDA in STP outfalls.”
From Using a Time-of-Travel Sampling Approach to Quantify Per- and Polyfluoroalkyl Substances (PFAS) Stream Loading and Source Inputs in a Mixed-Source, Urban Catchment (2024) · cites this paper as [45]
Experimental — accuracy not yet measured
Self-check
Percentages, sums and reported differences re-computed from the paper’s own numbers.
Each contradiction between two passages listed here was confirmed by an independent check.
Rated minor: it would not touch a result — a value no result rests on, a p-value that stays on the same side of the significance level, or a conflict that is clerical, resolved elsewhere in the paper, or outside its own findings.
In the paper
“For the influent data, the first four components explained 93.2% of the variation (47.8, 20.2, 15.9 and 7.32%, respectively).”
§ An investigation into per- and polyfluoroalkyl substances (PFAS) in nineteen Australian wastewater treatment plants (WWTPs) > Results and discussion > Trends, correlations, and transformation
Reported 93.2 · recomputed 91.22
Rated minor: it would not touch a result — a value no result rests on, a p-value that stays on the same side of the significance level, or a conflict that is clerical, resolved elsewhere in the paper, or outside its own findings.
In the paper
§ An investigation into per- and polyfluoroalkyl substances (PFAS) in nineteen Australian wastewater treatment plants (WWTPs) > Materials and methods > Quality control
“Only one compound (PFBA) was detected above LOD in field blanks from treatment plants WWTP-7 and WWTP-17; due to this, PFBA results for these two treatment plants were set as < LOD.”
§ An investigation into per- and polyfluoroalkyl substances (PFAS) in nineteen Australian wastewater treatment plants (WWTPs) > Results and discussion > PFAS in WWTP matrices
“| PFBA | 5.8 | 13 | 33 | <LOQ | 370 | 100% |”
Citations
Cites
R: A Language and Environment for Statistical Computing
R Core Team (2000) · doi:10.32614/r.manuals · Cited by 355,893
Fitting Linear Mixed-Effects Models Using lme4
Bates, D., Mächler, M., Bolker, B., & Walker, S. (2015) · Journal of Statistical Software · doi:10.18637/jss.v067.i01 · Cited by 86,835 · cited 1×
“Linear mixed-effects analysis was performed on the transformed data using the R package lme4 [52].”
Methodggplot2: Elegant Graphics for Data Analysis
Wickham, H. (2009) · doi:10.1007/978-0-387-98141-3 · Cited by 14,447
Buck, R. C., Franklin, J., Berger, U., Conder, J. M., Cousins, I. T., de Voogt, P., Jensen, A. A., Kannan, K., Mabury, S. A., & van Leeuwen, S. P. (2011) · Integrated Environmental Assessment and Management · doi:10.1002/ieam.258 · Cited by 4,641
Reshaping Data with the reshape Package
Wickham, H. (2007) · Journal of Statistical Software · doi:10.18637/jss.v021.i12 · Cited by 3,251 · cited 1×
“Data visualizations were also produced in R [48] using the packages reshape2 [49] and ggplot2 [50].”
MethodGlobal Distribution of Perfluorooctane Sulfonate in Wildlife
Giesy, J. P., & Kannan, K. (2001) · Environmental Science & Technology · doi:10.1021/es001834k · Cited by 2,750 · cited 3×
“manufactured since the 1950s, it wasn't until 2001 that the extent of PFAS global contamination was first demonstrated for perfluorooctane sulfonate (PFOS; C8F17SO3H) and perfluorooctanoic acid (PFOA; C7F15COOH) [1].”
BackgroundInfluentialSources, fate and transport of perfluorocarboxylates
Prevedouros, K., Cousins, I. T., Buck, R. C., & Korzeniowski, S. H. (2006) · Environmental Science & Technology · doi:10.1021/es0512475 · Cited by 2,594
A Never-Ending Story of Per- and Polyfluoroalkyl Substances (PFASs)?
Wang, Z., DeWitt, J. C., Higgins, C. P., & Cousins, I. T. (2017) · Environmental Science & Technology · doi:10.1021/acs.est.6b04806 · Cited by 1,921
Polyfluorinated Compounds: Past, Present, and Future
Lindstrom, A. B., Strynar, M. J., & Libelo, E. L. (2011) · Environmental Science & Technology · doi:10.1021/es2011622 · Cited by 1,628
Sorption of Perfluorinated Surfactants on Sediments
Higgins, C. P., & Luthy, R. G. (2006) · Environmental Science & Technology · doi:10.1021/es061000n · Cited by 1,563 · cited 1×
“In environmental aquatic systems, the different partitioning behavior will typically result in short-chain compounds (PFCAs: C6, and PFSAs: C5) partitioning to the aqueous phase and long-chain compounds adsorbed to the solid compartments [16, 17].”
Background
Cited by
Sorted by citations
Items 201–300 of 326
Analytical Methods for PFAS in Products and the Environment
Schöpel, M., Jacobs, G., Jordens, J., van Ermen, G., Voorspoels, S., & Krause, M. (2022) · TemaNord · doi:10.6027/temanord2022-510 · Cited by 11
Birtek, R. I., Karpuzcu, M. E., & Öztürk, İ. (2022) · Environmental Monitoring and Assessment · doi:10.1007/s10661-022-09840-w · Cited by 10
Beisner, K. R., Paretti, N. V., Jasmann, J. R., & Barber, L. B. (2023) · Journal of Hydrology Regional Studies · doi:10.1016/j.ejrh.2023.101461 · Cited by 11
Dronjak, L., Mazen, K., Venkatesh, G., Moyet, M., Samara, F., & Kanan, S. (2025) · Discover Catalysis. · doi:10.1007/s44344-025-00020-9 · Cited by 11
Xin, X., Li, J., & Huang, C. (2025) · ACS ES&T Water · doi:10.1021/acsestwater.5c00730 · Cited by 12
Danilova, S. N., Meng, S.-D., Chen, F., Zhang, Z., Liu, B., Kolodeznikov, V. E., Petrova, N. N., Li, Y.-F., & Zhang, Z.-F. (2026) · Journal of Water Process Engineering · doi:10.1016/j.jwpe.2026.109911 · Cited by 9
Kosiarski, K., Usner, C., & Preisendanz, H. E. (2024) · Journal of Environmental Quality · doi:10.1002/jeq2.20630 · Cited by 12
Elevated PFAS Precursors in Septage and Residential Pump Stations
Penrose, M. T., Deighton, J., Glassmeyer, S. T., Brougham, A., Bessler, S. M., McKnight, T., & Ateia, M. (2025) · Environmental Science & Technology Letters · doi:10.1021/acs.estlett.5c00246 · Cited by 10
Per‐ and polyfluoroalkyl substance removal in carbon‐based advanced treatment for potable reuse
Kumar, P., Rodriguez-Gonzalez, L. C., Salveson, A. T., Ammerman, D. K., & Steinle‐Darling, E. (2021) · AWWA Water Science · doi:10.1002/aws2.1244 · Cited by 9
The water industry and the decarbonisation of cities: A comprehensive review in the context of Cop26
Fisher, P. M. J., & Smith, D. D. (2022) · PLOS Water · doi:10.1371/journal.pwat.0000023 · Cited by 11
Development of ceramic filter tube for passive sampling of PFAS in waters
Cheng, S., Li, C., Liu, S., Zou, H., Ying, G., & Chen, C.-E. (2024) · Environmental Technology & Innovation · doi:10.1016/j.eti.2024.103608 · Cited by 7
Effects on food intake of Gammarus spp. after exposure to PFBA in very low concentrations
Porseryd, T., Larsson, J., Lindman, J., Malmström, E., Smolarz, K., Grahn, M., & Dinnétz, P. (2024) · Marine Pollution Bulletin · doi:10.1016/j.marpolbul.2024.116369 · Cited by 10
Mohammadi, N., Guclu, S., Atespare, A. E., Köseoğlu-İmer, D. Y., Ünal, S., & Dizman, B. (2025) · Journal of Water Process Engineering · doi:10.1016/j.jwpe.2025.107345 · Cited by 12
Ma, Y., Sharkey, M., Coggins, M. A., Stubbings, W. A., Healy, M. G., & Harrad, S. (2025) · The Science of The Total Environment · doi:10.1016/j.scitotenv.2025.179380 · Cited by 11
Understanding the scale and potential contributions of background PFAS in the environment
Adamson, D. T., Gamlin, J. D., Jin, Y., Casteel, W., Schaefer, C. E., & Higgins, C. P. (2026) · Journal of Hazardous Materials · doi:10.1016/j.jhazmat.2026.141121 · Cited by 8
IWASAKI, R., UCHIDA, J., Yamana, Y., Nakamura, Y., Maeda, K., Sotoma, S., & Yoshida, Y. (2023) · Electrochemistry · doi:10.5796/electrochemistry.23-00066 · Cited by 9
Zhang, Y. W., Li, X., Li, N., Zhao, R., Niu, H., Shi, Y., & Cai, Y. (2025) · Environmental Science & Technology · doi:10.1021/acs.est.5c04548 · Cited by 16
Per- and polyfluoroalkyl substances (PFAS) in the rivers of the Western United States
Sims, D. B., Monk, J., Woldetsadik, D. A., Hudson, A. C., Garner, M. C., Lindley, K., Piacentini, J. C., Buch, A. C., Cohu, C. M., Duvall, C. S., et al. (2024) · International Journal of Environmental Science and Technology · doi:10.1007/s13762-024-06269-1 · Cited by 9
Smolinski, R., Oates, M., Venkatesan, A. K., Gobler, C. J., & McDonough, C. A. (2025) · Environmental Science Processes & Impacts · doi:10.1039/d5em00134j · Cited by 8
Le, V.-G., Nguyen, M., Luu, T.-A., Nguyen, P. H., Dang, V. D., Pham, M., Kim, S. S., Um, M., & Nguyen, D. D. (2025) · Journal of Water Process Engineering · doi:10.1016/j.jwpe.2025.108403 · Cited by 8
Urban surface water flows contribute more PFAS to marine environments than treated wastewater
Lewis, P. J., Odell, E. H., Johnstone, C. P., Chaston, T. B., MacMahon, D., Paige, T., Sharp, S. M., Taylor, M. P., Pettigrove, V. J., & Saaristo, M. (2025) · Environmental Research · doi:10.1016/j.envres.2025.122751 · Cited by 7
Yang, G., Liu, Z., Yun, L., & Harada, K. H. (2025) · Water Research · doi:10.1016/j.watres.2025.125167 · Cited by 10
Sustainable remediation strategies for emerging PFAS contaminants in water
Rani, L., Srivastav, A. L., Kaushal, J., Jangra, N., Kumar, M., & Haque, S. E. (2025) · RSC Advances · doi:10.1039/d5ra05521k · Cited by 8
Yong, Z. Y., Othman, M. H. D., Yong, E. L., Puteh, M. H., Jaafar, J., Rahman, M. A., & Kurniawan, T. A. (2026) · International Journal of Environmental Research · doi:10.1007/s41742-025-00996-0 · Cited by 7
Duru, C. I., & Sherchan, S. P. (2025) · Water Air & Soil Pollution · doi:10.1007/s11270-025-08225-2 · Cited by 9
Kizhakkethil, J. P., & Kourtchev, I. (2025) · Atmospheric Environment · doi:10.1016/j.atmosenv.2025.121218 · Cited by 6
Morethe, M. F., Mpenyana-Monyatsi, L., Abafe, O. A., & Okonkwo, O. J. (2025) · ACS ES&T Water · doi:10.1021/acsestwater.5c00145 · Cited by 8
Biotransformation and partitioning of structurally different PFAS by wastewater microbial consortia
Saifur, S., Vyverberg, N., Aguilar, J. M. N., Antle, J. P., Aich, N., Aga, D. S., & Bradley, I. (2025) · Environmental Science Water Research & Technology · doi:10.1039/d5ew00528k · Cited by 8
Nduka, J. K., Alluwo, C. J., Offor, C. C., & Eboh-Ajoku, O. I. (2025) · Environmental Science Advances · doi:10.1039/d5va00424a · Cited by 8
Per- and polyfluoroalkyl substances (PFAS) in wastewater streams: occurrence and current treatment
Tang, K. H. D. (2023) · Academia Engineering · doi:10.20935/acadeng6129 · Cited by 6
Phytoremediation of soils contaminated with poly- and per-fluoroalkyl substances (PFAS)
Bolan, N. S., Kirkham, M. B., Perera, V., Mayakaduwage, S., Ekanayake, A., Rajapaksha, A. U., Wijesekara, H., Srivastava, P., & Vithanage, M. S. (2022) · Elsevier eBooks · doi:10.1016/b978-0-323-99907-6.00012-8 · Cited by 7
Zhang, H., & Sherchan, S. P. (2025) · The Science of The Total Environment · doi:10.1016/j.scitotenv.2025.180531 · Cited by 5
Models and challenges for studying forever chemicals and their impact on human health
Jaß, J., Bezabhe, Y. H., Mustafa, M., Ragnvaldsson, D., & Olsson, P. (2025) · Disease Models & Mechanisms · doi:10.1242/dmm.052320 · Cited by 6
Defluorination of per- and polyfluoroalkyl carboxylic acids (PFCAs) by wood decomposer fungi
Ayers, C. R., & Zhang, J. (2025) · Mycologia · doi:10.1080/00275514.2025.2499476 · Cited by 5
Alam, M. S., & Chen, G. (2025) · International Journal of Environmental Research · doi:10.1007/s41742-025-00851-2 · Cited by 9
Byrne, P., Mayes, W. M., James, A., Comber, S. D. W., Biles, E., Riley, A. L., Verplanck, P. L., & Bradley, L. (2025) · The Science of The Total Environment · doi:10.1016/j.scitotenv.2025.180502 · Cited by 5
Lee, J.-H., Kang, D., Kim, C., Jung, S.-J., Yoon, J., Lee, W., Kim, K., & Jeon, J. (2025) · Journal of Water Process Engineering · doi:10.1016/j.jwpe.2025.109077 · Cited by 4
Lu, L., Li, M., Kang, G.-D., Wu, P., Wang, N., Tan, Y., Su, G., Ruan, J., & Zhang, S. (2026) · Ecotoxicology and Environmental Safety · doi:10.1016/j.ecoenv.2026.120059 · Cited by 4
Method development for analysis 13 per‐ and polyfluoroalkyl acids in tap water by HPLC‐MS / MS
Nhi, T. T. Y., Tran, V. T. K., Nguyễn, M. Á., Nguyen, T. T., Tran, P. H., Nguyen, P. N., Quyen, D. T. T., & To, H. T. (2023) · Vietnam Journal of Chemistry · doi:10.1002/vjch.202300087 · Cited by 4
Boleydei, H., Huot, C., & Vaneeckhaute, C. (2025) · Chemosphere · doi:10.1016/j.chemosphere.2025.144186 · Cited by 9
Sleep, J. A., & Juhasz, A. L. (2020) · Environmental Pollution · doi:10.1016/j.envpol.2020.115120 · Cited by 4
RetractedOjemaye, C. Y., Ojemaye, M. O., Okoh, A. I., & Okoh, O. O. (2023) · Journal of Environmental Science and Health Part A · doi:10.1080/10934529.2023.2203639 · Cited by 4
Chen, J., Samaei, S. H., Zhang, L., Zhang, Y., Basu, O. D., Yang, Y., & Xue, J. (2025) · Journal of Hazardous Materials Advances · doi:10.1016/j.hazadv.2025.100920 · Cited by 12
Ika, A. R., Lin, S.-F., Wang, C.-L., Chang‐Chien, G., & Huang, B.-W. (2025) · Journal of Water Process Engineering · doi:10.1016/j.jwpe.2025.109196 · Cited by 4
Breaking the PFAS treatment barrier: Scalable solutions for industrial wastewater treatment
Alyasi, H., Ali, L., & Mahmoud, K. A. (2026) · Journal of Water Process Engineering · doi:10.1016/j.jwpe.2026.109567 · Cited by 3
PFAS remediation across Europe: costs and limited impacts
Ling, A. L., Aubert, R., Bersi, E., Horel, S., & Arp, H. P. H. (2026) · Environmental Science Processes & Impacts · doi:10.1039/d5em00870k · Cited by 6
Robust titanium suboxide anodes doped by sintering enhance PFOS degradation in water
Sui, Y., Xi, Z., Li, L., Wang, Y., Li, G., Dong, S., Wang, Y., Lin, H., Li, K., & Huang, Q. (2025) · Chemosphere · doi:10.1016/j.chemosphere.2025.144438 · Cited by 5
Liu, M., Qadeer, A., Anis, M., Ajmal, Z., Bekele, T. G., Wang, S., Jiang, X., & Leung, K. (2023) · Elsevier eBooks · doi:10.1016/b978-0-323-96002-1.00001-8 · Cited by 8
Sana, T., Chowdhury, M. I., Panneerselvan, L., & Megharaj, M. (2025) · Environmental Challenges · doi:10.1016/j.envc.2025.101103 · Cited by 3
Gunarathne, V., Vithanage, M. S., & Rinklebe, J. (2023) · One Health · doi:10.1002/9781119867333.ch10 · Cited by 4
Falk, S. R. N., Gaßmann, M., & Stahl, T. (2024) · Environmental Pollution · doi:10.1016/j.envpol.2024.124512 · Cited by 2
Warwick, K. G., Ryan, M. M., Nice, H. E., & Wright, I. A. (2025) · Urban Science · doi:10.3390/urbansci9060182 · Cited by 2
Joshi, V., Nandini, D., & Purwar, R. (2025) · Journal of Fluorine Chemistry · doi:10.1016/j.jfluchem.2025.110462 · Cited by 2
Addou, A. M., Li, R., Li, C., Jin, L., & Li, H. (2025) · Journal of environmental chemical engineering · doi:10.1016/j.jece.2025.120377 · Cited by 3
Simonetti, F., Ciuccoli, N., Ankan, A., Mancini, M., Castellani, M., Sgroi, M., Fatone, F., & Migliorati, V. (2025) · Water Research · doi:10.1016/j.watres.2025.125133 · Cited by 2
Jones, O. A. H., Brindle, A., Sterjovski, M., Al-Mashari, S., Netherway, P., Lewis, P. J., Martin, J., & Currell, M. (2026) · Journal of Contaminant Hydrology · doi:10.1016/j.jconhyd.2026.104861 · Cited by 2
Jiang, J., Meng, H., Shu, Z., Zhao, N., Lin, X., Li, J., Qin, M., Wu, S., & Qiu, L. (2026) · Environmental Science & Technology · doi:10.1021/acs.est.5c11476 · Cited by 2
Wen, K., Tang, A., Wan, N., Li, M., Liu, Z., Sun, X., Liu, Y., & Mai, B. (2026) · Environmental Chemistry and Ecotoxicology · doi:10.1016/j.enceco.2026.02.009 · Cited by 2
Wu, D., Tang, F., Ning, Z., Wang, Q., Mei, Y., Hrynsphan, D., Savitskaya, T., & Chen, J. (2026) · Separation and Purification Technology · doi:10.1016/j.seppur.2026.138054 · Cited by 2
Obanya, H. E., Ginley, F., Payne, M. R., & Ford, A. T. (2026) · Marine Environmental Research · doi:10.1016/j.marenvres.2026.108094 · Cited by 3
Yadav, B., Chavan, S., Tyagi, R. D., & Drogui, P. (2022) · Elsevier eBooks · doi:10.1016/b978-0-323-99906-9.00005-x · Cited by 2
Ji, B., & Zhao, Y. (2023) · Energy, environment, and sustainability · doi:10.1007/978-981-99-2062-4_3 · Cited by 3
Miino, M. C., Halešová, T., Macsek, T., Raček, J., & Hlavínek, P. (2023) · Clean Technologies · doi:10.3390/cleantechnol5040060 · Cited by 2
Szarka, A., Vidová, B., Viktoryová, N., Vidošovič, T., Horváth, G., & Hrouzková, S. (2024) · Lecture notes in civil engineering · doi:10.1007/978-981-97-0948-9_24 · Cited by 2
Michael, A., Patrick, S., Betty, N. C., et al. (2024) · Archives of Agriculture and Environmental Science · doi:10.26832/24566632.2024.0902026 · Cited by 2
McLellan, N. L., Croll, H. C., Adelman, M. J., Pernitsky, D., & Jacangelo, J. G. (2024) · The Science of The Total Environment · doi:10.1016/j.scitotenv.2024.176593 · Cited by 2
Puttamreddy, S., Ramesh, S. B., Nippatlapalli, N., & Allabakshi, S. M. (2024) · Journal of environmental chemical engineering · doi:10.1016/j.jece.2024.115114 · Cited by 3
Black, G. P., Wong, L., & Young, T. M. (2025) · Environmental Science Processes & Impacts · doi:10.1039/d4em00502c · Cited by 4
Ayers, C. R., & Zhang, J. (2025) · Fungal Biology · doi:10.1016/j.funbio.2025.101586 · Cited by 3
Franko, N., Vetrih, M., & Dolenc, M. S. (2025) · Journal of Xenobiotics · doi:10.3390/jox15050136 · Cited by 2
Australian Case Studies Involving Exposure to PFOS
Hagen, T. G., Nola, G. D., Lane, A., & Woodworth, J. G. (2024) · Wiley eBooks · doi:10.1002/9781119742975.ch29 · Cited by 3
Occurrence and distribution of perfluoroalkyl acids in rivers: Impact and risk assessment
Verma, N., Rani, L., Rachmalla, M., Dua, K., & Jha, N. K. (2022) · Elsevier eBooks · doi:10.1016/b978-0-323-85045-2.00002-9 · Cited by 2
PFAS soil contamination and remediation
Liu, Y., Samarasinghe, S. C., Wijayawardena, A., Odoh, C. K., & Naidu, R. (2024) · Elsevier eBooks · doi:10.1016/b978-0-323-99762-1.00047-4 · Cited by 1
Internal and surface temperature profiles of spherical biosolids particles during convective drying
Nylen, J., Sheehan, M., Whelan, A., et al. (2024) · Drying Technology · doi:10.1080/07373937.2024.2407959 · Cited by 1
Aqueous film-forming foams used in Brazil are toxic to neotropical invertebrates
Ueda, M., Moreira, L. B., Maranho, L. A., & Abessa, D. M. D. S. (2025) · Marine Environmental Research · doi:10.1016/j.marenvres.2025.107581 · Cited by 1
Akhilghosh, K. A., Farissi, S., Aiswriya, V. P., Aravindakumar, C. T., Muthuchamy, M., & Muthukumar, A. (2025) · Environmental Science and Pollution Research · doi:10.1007/s11356-025-37054-3 · Cited by 1
Ávila, B. S., Ríos, S. E. G., & Peñuela, G. A. (2025) · ACS ES&T Water · doi:10.1021/acsestwater.5c00766 · Cited by 3
Gkalipidou, E., Koukoura, A., Savvanidou, I., Kostakis, M. G., Gerokonstantis, D. T., Mastoras, P., Gatidou, G., Fountoulakis, M. S., Vakalis, S., Arvaniti, O. S., et al. (2026) · Chemical Engineering Journal · doi:10.1016/j.cej.2026.174358 · Cited by 1
Keith, A. C., Kastury, F., & Juhasz, A. L. (2026) · Journal of Agricultural and Food Chemistry · doi:10.1021/acs.jafc.5c05889 · Cited by 2
Awad, J., Lu, W., Walker, C., Malerba, M. E., Schuster, L., & Navarro, D. A. (2026) · ACS ES&T Water · doi:10.1021/acsestwater.5c01268 · Cited by 4
de Navarro, M. G., Lugo, C. C., & Quinete, N. (2026) · Journal of Chromatography A · doi:10.1016/j.chroma.2026.467183 · Cited by 1
Concentrations of per- and polyfluoroalkyl substances in the rainwater of South-Eastern Australia
Singh, N., Askeland, M., Utembe, S. R., Coggan, T. L., & Jones, O. A. H. (2026) · Environmental Toxicology and Chemistry · doi:10.1093/etojnl/vgag204 · Cited by 1
Self-citationBilgin, A., & Erpul, G. (2021) · European Journal of Environment and Earth Sciences · doi:10.24018/ejgeo.2021.2.3.141 · Cited by 1
Link, G. W., Reeves, D. M., Cassidy, D. P., et al. (2023) · SSRN Electronic Journal · doi:10.2139/ssrn.4524555 · Cited by 1
Zhang, H., Chen, Y., Liu, Y., et al. (2023) · SSRN Electronic Journal · doi:10.2139/ssrn.4530925 · Cited by 1
Koongolla, J. B., Egodawatta, P., Goonetilleke, A., & Ayoko, G. A. (2026) · Journal of Hazardous Materials · doi:10.1016/j.jhazmat.2026.143434
Fries, E., Helmecke, M., & Schulte, C. (2022) · Water and waste water management · doi:10.1007/978-3-030-95288-4_15
Environmental effects of per- and poly-fluoroalkyl substances exposure
Pandey, K., Rai, S., Kuril, S., Singh, P., Rajput, M. S., Pilli, S., Tyagi, R. D., & Pandey, A. (2022) · Elsevier eBooks · doi:10.1016/b978-0-323-99906-9.00002-4
Per- and poly-fluoroalkyl substances (PFASs) in water and wastewater
Chowdhury, S. D., Tyagi, R. D., Pilli, S., Tyagi, V. K., Pandey, A., & Bhunia, P. (2022) · Elsevier eBooks · doi:10.1016/b978-0-323-99906-9.00003-6
Ultra-Sensitive and Rapid Analysis of Per- and Polyfluoroalkyl Substances (PFAS) in Water
Parry, E., & Anumol, T. (2021) · LCGC North America · doi:10.56530/lcgc.na.xl8575w4
Retention of Per- and Polyfluoroalkyl Substances (Pfas) by Syringe FiltersPreprint
He, K. F., Feerick, A., Jin, H., Batista-Andrade, J. A., Batista, M. D., Dugan, C., & Blaney, L. M. (2023) · SSRN Electronic Journal · doi:10.2139/ssrn.4528234
Criminalization Arrangements for Corporations (Comparative Study of Indonesia and Australia)
Baiquni, M. I., Adiyatma, S. E., Saputri, A. D., et al. (2023) · Unnes Law Journal · doi:10.15294/ulj.v9i2.74129
Analytical techniques for estimation of industrial endocrine disrupting chemicals
Pavithra, K., Rex, K. R., Chandra, S., Vairaperumal, T., Mukhopadhyay, M., & Chakraborty, P. (2024) · Elsevier eBooks · doi:10.1016/b978-0-12-823897-4.00018-6
Environmental occurrence of industrial endocrine disrupting chemicals
Chandra, S., Pavithra, K., Rex, K. R., Mukhopadhyay, M., Ahamed, A. A., & Chakraborty, P. (2024) · Elsevier eBooks · doi:10.1016/b978-0-12-823897-4.00002-2
Mezzanotte, V., & Sforza, E. B. (2024) · Environmental and Climate Technologies · doi:10.2478/rtuect-2024-0045
Lee, W., & Choi, Y. (2025) · Journal of The Korean Society of Water and Wastewater · doi:10.11001/jksww.2025.39.3.131
Miiro, A., Mubiru, E., Odume, O. N., Odongo, S., Nyakairu, G. W., Matovu, H., Kato, C. D., Špánik, I., Sillanpää, M. E. T., Sifuna, D., et al. (2025) · Emerging contaminants · doi:10.1016/j.emcon.2025.100580
Source Identification Issues in Environmental Forensics
Babu, B. K., Das, P., Bordoloi, M., & Shekhawat, H. (2025) · Springer eBooks · doi:10.1007/978-981-95-0199-1_5 · Cited by 1
Metadata
- Authors
- Coggan, T. L., Moodie, D., Kolobaric, A., Szabo, D., Shimeta, J., Crosbie, N. D., Lee, E., Fernandes, M., & Clarke, B. O.
- Affiliations
- RMIT University (AU)
- Melbourne Water (AU)
- Water Corporation of Western Australia (Australia) (AU)
- Flinders University (AU)
- Corresponding author
- Coggan, Timothy L.
- ORCID
- Venue
- Heliyon
- Publisher
- Elsevier BV
- Published
- 2019-08
- Volume
- 5
- Issue
- 8
- Pages
- e02316
- ISSN
- 2405-8440 (ISSN-L)
- PMC
- PMC6716228
- OpenAlex
- W2969674960
- Cited by
- 327
- References
- 66
- Citations by year
- 2026: 43 · 2025: 62 · 2024: 61 · 2023: 50 · 2022: 47 · 2021: 41 · 2020: 23
- FWCI
- 12.07
- Type
- journal article
- Language
- en
- Open access
- gold
- doi.org
- Licence
- Locations
- Heliyon (publishedVersion, cc-by)
- Europe PMC (PubMed Central) (publishedVersion, cc-by)
- PubMed Central (publishedVersion, cc-by)
- PubMed (publishedVersion)
- RMIT Research Repository (RMIT University Library) (submittedVersion, other-oa)
- DOAJ (DOAJ: Directory of Open Access Journals) (submittedVersion, cc-by-sa)
- Figshare (submittedVersion)
- Minerva Access (University of Melbourne) (submittedVersion, cc-by)
- Funders
- Department of Education, Employment and Workplace Relations, Australian Government
- Water Research Australia
- Topics
- Physical Sciences › Environmental Science › Environmental Chemistry › Per- and polyfluoroalkyl substances research
- Physical Sciences › Environmental Science › Pollution › Pharmaceutical and Antibiotic Environmental Impacts
- Physical Sciences › Environmental Science › Environmental Chemistry › Environmental Chemistry and Analysis
- Keywords
- per- and polyfluoroalkyl substances, PFAS, wastewater treatment plants, PFAS emissions, perfluorocarboxylic acids, perfluorinated sulfonic acids, fluorotelomer sulfonates, trade waste, influent and effluent concentrations, aquatic ecosystems
About these checks
Registry, retraction, Cites and statistics results are computed, not judged, with one exception: a printed reference that no index lists is read once by a model before it counts as a citation error. Claims are extracted by a model and kept only when their quote appears verbatim in the text; each cited source is then checked, with a model’s help, for whether it says what the claim relies on. Those verdicts can be wrong — read the claim’s quote and the cited source before relying on one.
A language model drew the claims from the paper on 2026-10-07, under version 3 of the claim definition (model deepseek-v4.1-flash, prompt extract-v3).
A second model labelled each claim on 2026-10-07 (model jev-1.13-20260917, definition revision gold-guideline-v0.2).
Cited sources are checked with a language model’s help (gpt-6-sol).
Statistics and arithmetic are recomputed, not judged.
Confidence bands are shown only for fields calibrated on our annotated test set. None is calibrated yet, so no band is shown.
What counts as a claim ›How we measure confidence ›How we check this ›
Are you an author, or do you see a problem with this page? Request a review
