

The DOI matches its Crossref record; 41 of the 42 references it cites were found in a registry or an index.
Limited Mitochondrial Permeabilization Causes DNA Damage and Genomic Instability in the Absence of Cell Death
Open accessAbstract
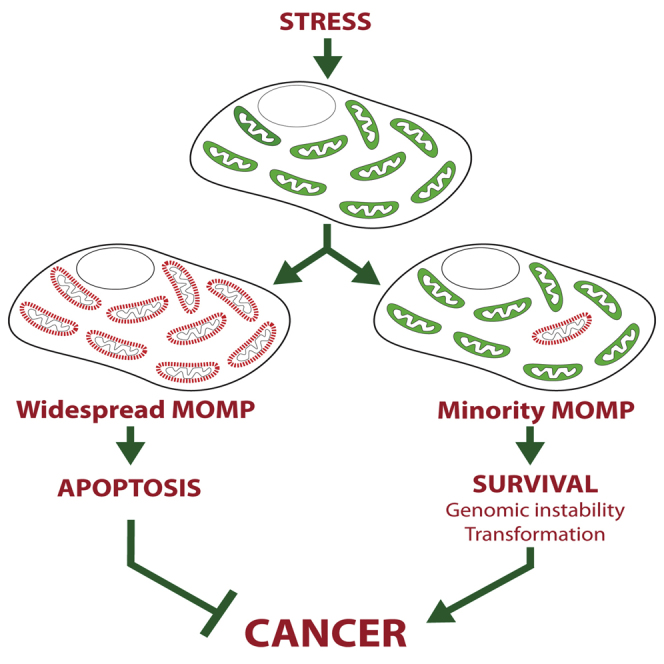
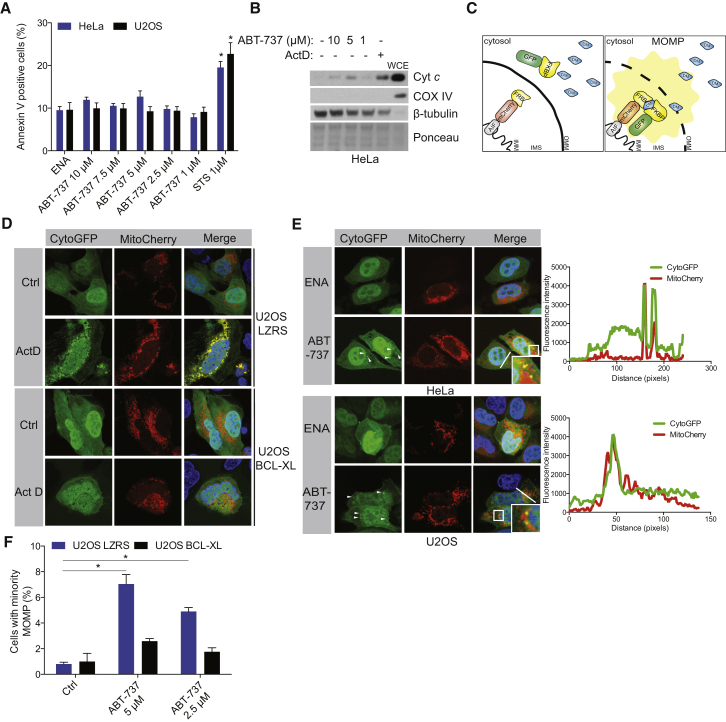
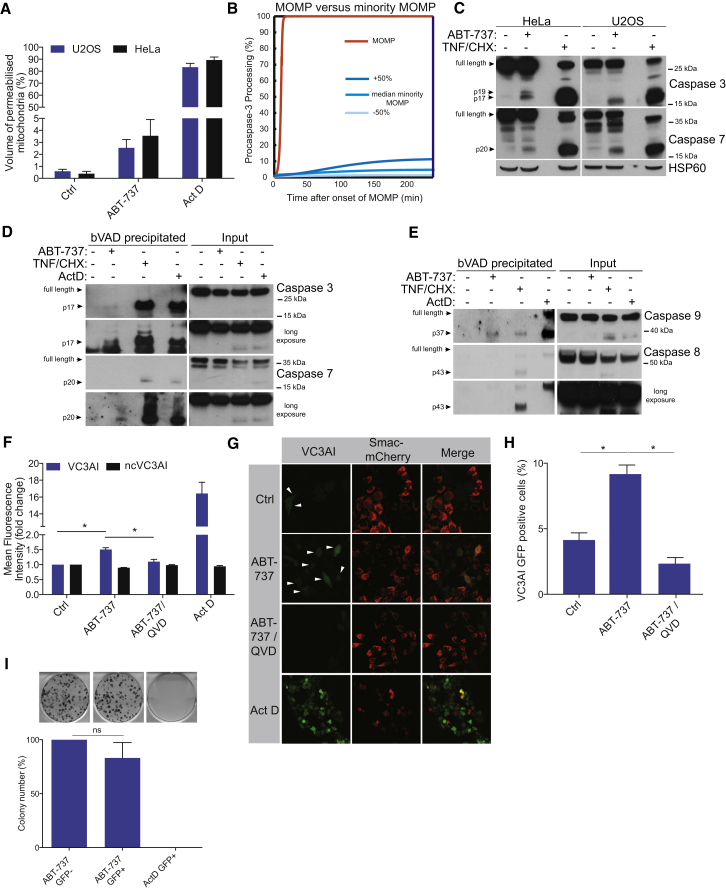
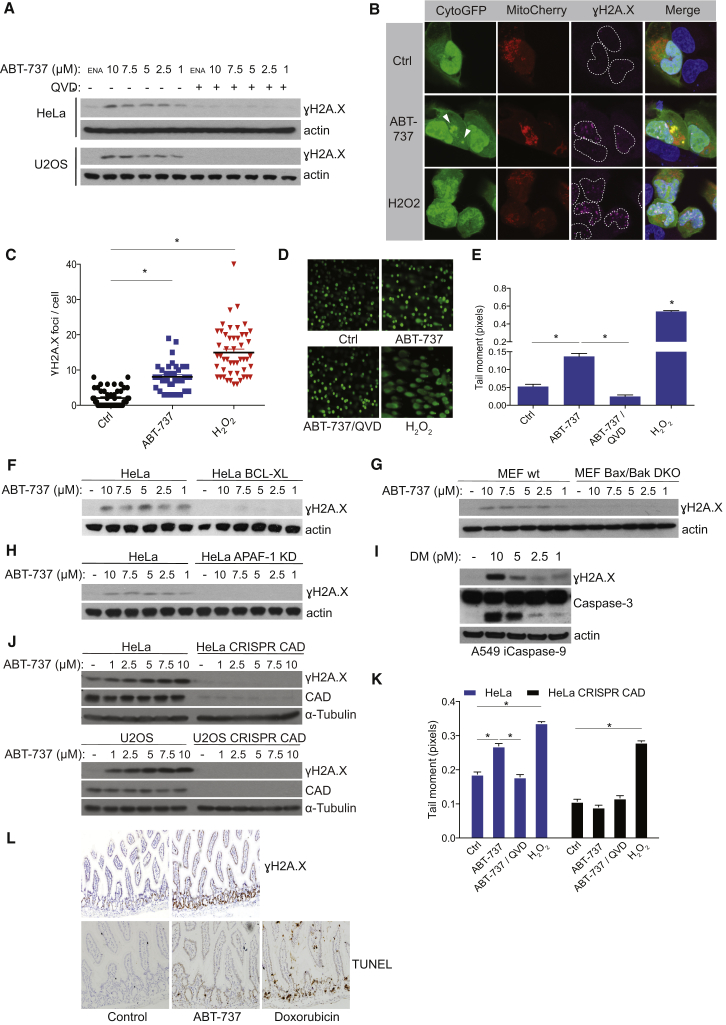
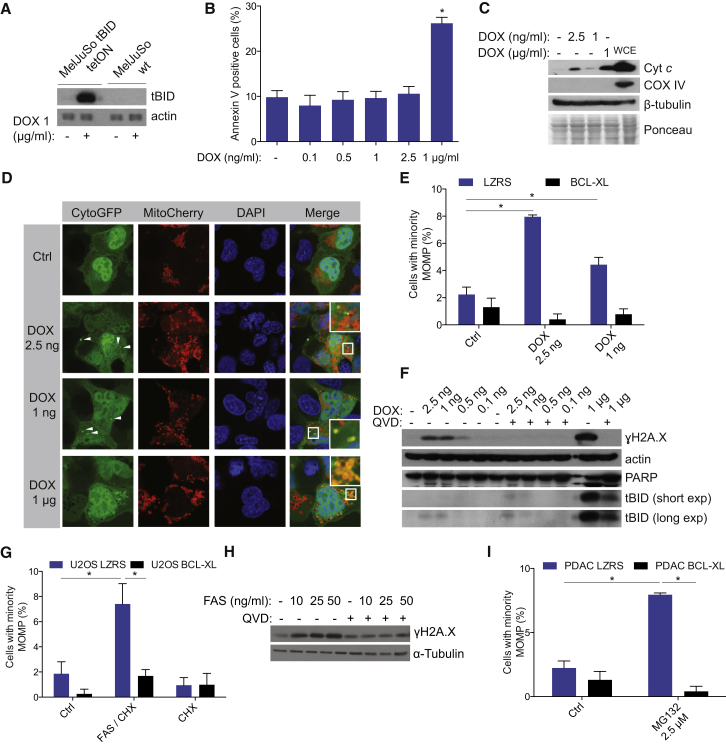
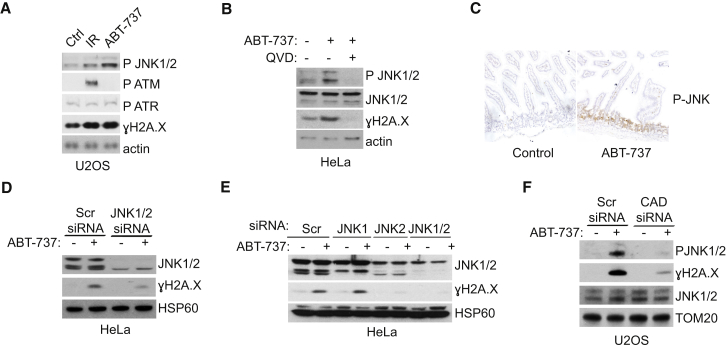
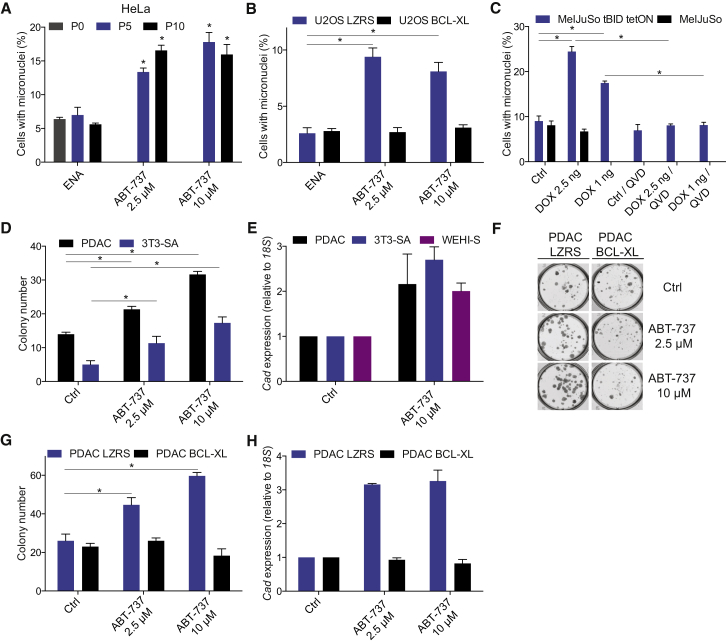
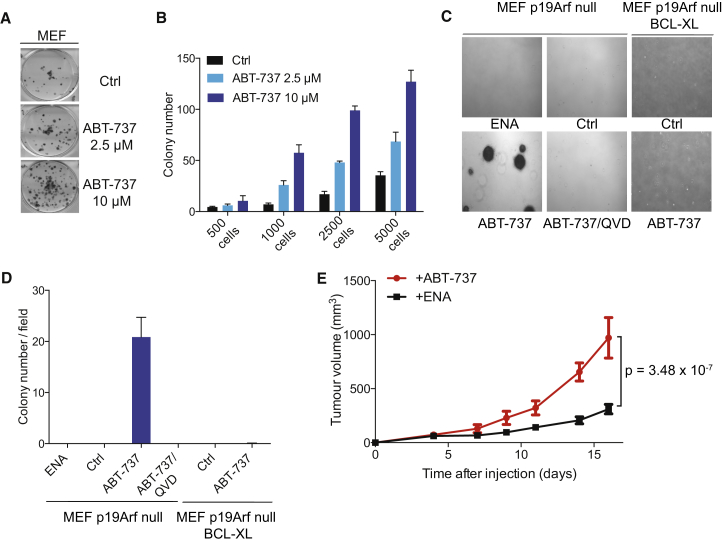
During apoptosis, the mitochondrial outer membrane is permeabilized, leading to the release of cytochrome c that activates downstream caspases. Mitochondrial outer membrane permeabilization (MOMP) has historically been thought to occur synchronously and completely throughout a cell, leading to rapid caspase activation and apoptosis. Using a new imaging approach, we demonstrate that MOMP is not an all-or-nothing event. Rather, we find that a minority of mitochondria can undergo MOMP in a stress-regulated manner, a phenomenon we term "minority MOMP." Crucially, minority MOMP leads to limited caspase activation, which is insufficient to trigger cell death. Instead, this caspase activity leads to DNA damage that, in turn, promotes genomic instability, cellular transformation, and tumorigenesis. Our data demonstrate that, in contrast to its well-established tumor suppressor function, apoptosis also has oncogenic potential that is regulated by the extent of MOMP. These findings have important implications for oncogenesis following either physiological or therapeutic engagement of apoptosis.
Overview
The claims and statistics of this paper haven’t been checked yet.
Run the check — free, no account needed. It reads the open-access text and checks the sources it cites.
Integrity signals
Registry
Cites
Statistics
Figures
Verification
Claims the paper makes
The claims and statistics of this paper haven’t been checked yet.
Run the check — free, no account needed. It reads the open-access text and checks the sources it cites.
Claims other papers make about this one
Each is checked against this paper’s own text: does it say what the citing paper says it does?
In the citing paper
“In addition, when MOMP affects a limited number of mitochondria, the consequent sublethal activation of caspases does not precipitate RCD but promotes genomic instability [226].”
From Molecular mechanisms of cell death: recommendations of the nomenclature committee on cell death 2018. (2018) · cites this paper as [226]
In the citing paper
“Finally, at least some cells exposed to transient apoptotic stimuli appear to survive MOMP affecting a limited number of mitochondria and the partial activation of executioner caspases by a hitherto poorly characterized process called anastasis (most likely constituting a robust adaptative response upstream of the boundary between cellular life and death) [226–228].”
From Molecular mechanisms of cell death: recommendations of the nomenclature committee on cell death 2018. (2018) · cites this paper as [226]
In the citing paper
“However, it has been shown that in conditions of sub-lethal stress, a small subset of mitochondria undergo MOMP without inducing cell death, a phenomenon called minority MOMP (miMOMP) (Ichim et al., 2015).”
From Cytoplasmic DNA: sources, sensing, and role in aging and disease (2021) · cites this paper as Ichim et al., 2015
Self-check
Percentages, sums and reported differences re-computed from the paper’s own numbers.
The self-check needs the paper’s full text.
Citations
Cites
The DNA-damage response in human biology and disease
Jackson, S. P., & Bartek, J. (2009) · Nature · doi:10.1038/nature08467 · Cited by 6,092
An inhibitor of Bcl-2 family proteins induces regression of solid tumours
Oltersdorf, T., Elmore, S. W., Shoemaker, A. R., Armstrong, R. C., Augeri, D. J., Belli, B., Bruncko, M., Deckwerth, T. L., Dinges, J., Hajduk, P. J., et al. (2005) · Nature · doi:10.1038/nature03579 · Cited by 3,407
Mitochondria and cell death: outer membrane permeabilization and beyond
Tait, S. W. G., & Green, D. R. (2010) · Nature Reviews Molecular Cell Biology · doi:10.1038/nrm2952 · Cited by 2,593
Self-citationATM and related protein kinases: safeguarding genome integrity
Shiloh, Y. (2003) · Nature Reviews Cancer · doi:10.1038/nrc1011 · Cited by 2,577
Cytokinesis-block micronucleus cytome assay
Fenech, M. F. (2007) · Nature Protocols · doi:10.1038/nprot.2007.77 · Cited by 2,025
Cleavage of CAD inhibitor in CAD activation and DNA degradation during apoptosis
Sakahira, H., Enari, M., & Nagata, S. (1998) · Nature · doi:10.1038/34214 · Cited by 1,666
The coordinate release of cytochrome c during apoptosis is rapid, complete and kinetically invariant
Goldstein, J. C., Waterhouse, N. J., Juin, P. P., Evan, G. I., & Green, D. R. (2000) · Nature Cell Biology · doi:10.1038/35004029 · Cited by 1,073
Li, Z., Jo, J., Jia, J., Lo, S., Whitcomb, D. J., Jiao, S., Cho, K., & Sheng, M. (2010) · Cell · doi:10.1016/j.cell.2010.03.053 · Cited by 533
Colell, A., Ricci, J.-E., Tait, S., Milasta, S., Maurer, U., Bouchier-Hayes, L., Fitzgerald, P., Guio-Carrion, A., Waterhouse, N. J., Li, C. W., et al. (2007) · Cell · doi:10.1016/j.cell.2007.03.045 · Cited by 516
Self-citationDie another way – non-apoptotic mechanisms of cell death
Tait, S. W. G., Ichim, G., & Green, D. R. (2014) · Journal of Cell Science · doi:10.1242/jcs.093575 · Cited by 366 · cited 1×
“However, even in the absence of caspase activity, cells typically die onceMOMP has occurred, most likely due to progressive mitochondrial dysfunction (Lartigue et al., 2009; Tait et al., 2014).”
Self-citation
Cited by
Sorted by citations
Galluzzi, L., Vitale, I., Aaronson, S. A., Abrams, J. M., Adam, D., Agostinis, P., Alnemri, E. S., Altucci, L., Amelio, I., Andrews, D. W., et al. (2018) · Cell Death & Differentiation · doi:10.1038/s41418-017-0012-4 · Cited by 6,680
Mitochondria as multifaceted regulators of cell death
Bock, F. J., & Tait, S. W. G. (2019) · Nature Reviews Molecular Cell Biology · doi:10.1038/s41580-019-0173-8 · Cited by 2,531
Self-citationThe cGAS–STING pathway as a therapeutic target in inflammatory diseases
Decout, A., Katz, J. D., Venkatraman, S., & Ablasser, A. (2021) · Nature Reviews Immunology · doi:10.1038/s41577-021-00524-z · Cited by 2,309
Regulation of apoptosis in health and disease: the balancing act of BCL-2 family proteins
Singh, R., Letai, A., & Sarosiek, K. (2019) · Nature Reviews Molecular Cell Biology · doi:10.1038/s41580-018-0089-8 · Cited by 2,111
Cytotoxic CD8+ T cells in cancer and cancer immunotherapy
Raskov, H., Orhan, A., Christensen, J. P., & Gögenur, I. (2021) · British Journal of Cancer · doi:10.1038/s41416-020-01048-4 · Cited by 1,687
Mitochondrial dysfunction in cell senescence and aging
Miwa, S., Kashyap, S., Chini, E., & von Zglinicki, T. (2022) · Journal of Clinical Investigation · doi:10.1172/jci158447 · Cited by 1,061
Mitochondrial control of inflammation
Marchi, S., Guilbaud, E., Tait, S. W. G., Yamazaki, T., & Galluzzi, L. (2023) · Nature Reviews Immunology · doi:10.1038/s41577-022-00760-x · Cited by 1,027
Self-citationMitochondrial DNA in inflammation and immunity
Riley, J. S., & Tait, S. W. G. (2020) · EMBO Reports · doi:10.15252/embr.201949799 · Cited by 910
Self-citationVDAC oligomers form mitochondrial pores to release mtDNA fragments and promote lupus-like disease
Kim, J., Gupta, R., Blanco, L. P., Yang, S., Shteinfer-Kuzmine, A., Wang, K., Zhu, J., Yoon, H. E., Wang, X., Kerkhofs, M., et al. (2019) · Science · doi:10.1126/science.aav4011 · Cited by 793
The Role of Cancer-Associated Fibroblasts and Fibrosis in Liver Cancer
Affo, S., Yu, L.-X., & Schwabe, R. F. (2017) · Annual Review of Pathology: Mechanisms of Disease · doi:10.1146/annurev-pathol-052016-100322 · Cited by 757
Mechanisms of BCL-2 family proteins in mitochondrial apoptosis
Czabotar, P. E., & García‐Sáez, A. J. (2023) · Nature Reviews Molecular Cell Biology · doi:10.1038/s41580-023-00629-4 · Cited by 739
Apoptotic stress causes mtDNA release during senescence and drives the SASP
Victorelli, S. G., Salmonowicz, H., Chapman, J., Martini, H., Vizioli, M. G., Riley, J. S., Cloix, C., Hall-Younger, E., Espíndola‐Netto, J. M., Jurk, D., et al. (2023) · Nature · doi:10.1038/s41586-023-06621-4 · Cited by 708
Self-citationMOMP, cell suicide as a BCL-2 family business
Kalkavan, H., & Green, D. R. (2017) · Cell Death and Differentiation · doi:10.1038/cdd.2017.179 · Cited by 707
BCL-2 proteins and apoptosis: Recent insights and unknowns
Edlich, F. (2017) · Biochemical and Biophysical Research Communications · doi:10.1016/j.bbrc.2017.06.190 · Cited by 640
The Coming Decade of Cell Death Research: Five Riddles
Green, D. R. (2019) · Cell · doi:10.1016/j.cell.2019.04.024 · Cited by 575
Mitochondrial inner membrane permeabilisation enables mtDNA release during apoptosis
Riley, J. S., Quarato, G., Cloix, C., Lopez, J., O'Prey, J., Pearson, M., Chapman, J., Sesaki, H., Carlin, L. M., Passos, J. F., et al. (2018) · The EMBO Journal · doi:10.15252/embj.201899238 · Cited by 551
Self-citationTargeting BCL-2 regulated apoptosis in cancer
Campbell, K. J., & Tait, S. W. G. (2018) · Open Biology · doi:10.1098/rsob.180002 · Cited by 564
Self-citationParadoxical roles of caspase-3 in regulating cell survival, proliferation, and tumorigenesis
Eskandari, E., & Eaves, C. J. (2022) · The Journal of Cell Biology · doi:10.1083/jcb.202201159 · Cited by 504
López-Otín, C., & Kroemer, G. (2021) · Cell · doi:10.1016/j.cell.2020.11.034 · Cited by 499
Glover, H. L., Schreiner, A., Dewson, G., & Tait, S. W. G. (2024) · Nature Cell Biology · doi:10.1038/s41556-024-01429-4 · Cited by 515
Self-citationA fate worse than death: apoptosis as an oncogenic process
Ichim, G., & Tait, S. W. G. (2016) · Nature Reviews Cancer · doi:10.1038/nrc.2016.58 · Cited by 451
Self-citationMitochondria and cell death-associated inflammation
Vringer, E., & Tait, S. W. G. (2022) · Cell Death and Differentiation · doi:10.1038/s41418-022-01094-w · Cited by 461
Self-citationThe Apoptosis Paradox in Cancer
Morana, O., Wood, W., & Gregory, C. D. (2022) · International Journal of Molecular Sciences · doi:10.3390/ijms23031328 · Cited by 442
Autophagy in cancer: moving from understanding mechanism to improving therapy responses in patients
Levy, J. M. M., & Thorburn, A. M. (2019) · Cell Death and Differentiation · doi:10.1038/s41418-019-0474-7 · Cited by 443
Targeting apoptotic caspases in cancer
Boice, A., & Bouchier‐Hayes, L. (2020) · Biochimica et Biophysica Acta (BBA) - Molecular Cell Research · doi:10.1016/j.bbamcr.2020.118688 · Cited by 406
Self-citationHamacher‐Brady, A., & Brady, N. R. (2015) · Cellular and Molecular Life Sciences · doi:10.1007/s00018-015-2087-8 · Cited by 410
Modes of Regulated Cell Death in Cancer
Koren, E., & Fuchs, Y. (2021) · Cancer Discovery · doi:10.1158/2159-8290.cd-20-0789 · Cited by 388
The emerging, multifaceted role of mitophagy in cancer and cancer therapeutics
Panigrahi, D. P., Praharaj, P. P., Bhol, C. S., Mahapatra, K. K., Patra, S., Behera, B. P., Mishra, S. R., & Bhutia, S. K. (2019) · Seminars in Cancer Biology · doi:10.1016/j.semcancer.2019.07.015 · Cited by 379
The concept of intrinsic versus extrinsic apoptosis
Lossi, L. (2022) · Biochemical Journal · doi:10.1042/bcj20210854 · Cited by 372
Mitochondrial DNA Release in Innate Immune Signaling
Newman, L. E., & Shadel, G. S. (2023) · Annual Review of Biochemistry · doi:10.1146/annurev-biochem-032620-104401 · Cited by 349
Interleukin-1β Induces mtDNA Release to Activate Innate Immune Signaling via cGAS-STING
Aarreberg, L. D., Esser-Nobis, K., Driscoll, C., Shuvarikov, A., Roby, J. A., & Gale, M. (2019) · Molecular Cell · doi:10.1016/j.molcel.2019.02.038 · Cited by 328
Nuclear sensing of breaks in mitochondrial DNA enhances immune surveillance
Tigano, M., Vargas, D. C., Tremblay-Belzile, S., Fu, Y., & Sfeir, A. (2021) · Nature · doi:10.1038/s41586-021-03269-w · Cited by 327
Mitochondria—Judges and Executioners of Cell Death Sentences
Bhola, P. D., & Letai, A. (2016) · Molecular Cell · doi:10.1016/j.molcel.2016.02.019 · Cited by 326
Mitochondrial dysfunction and cell senescence: deciphering a complex relationship
Chapman, J., Fielder, E., & Passos, J. F. (2019) · FEBS Letters · doi:10.1002/1873-3468.13498 · Cited by 325
Cytoplasmic DNA: sources, sensing, and role in aging and disease
Miller, K. N., Victorelli, S. G., Salmonowicz, H., Dasgupta, N., Liu, T., Passos, J. F., & Adams, P. D. (2021) · Cell · doi:10.1016/j.cell.2021.09.034 · Cited by 288
Lagoumtzi, S. M., & Chondrogianni, N. (2021) · Free Radical Biology and Medicine · doi:10.1016/j.freeradbiomed.2021.05.003 · Cited by 279
Mitochondrial permeabilization engages NF-κB-dependent anti-tumour activity under caspase deficiency
Giampazolias, E., Zunino, B., Dhayade, S., Bock, F., Cloix, C., Cao, K., Roca, A., Lopez, J., Ichim, G., Proïcs, E., et al. (2017) · Nature Cell Biology · doi:10.1038/ncb3596 · Cited by 258
Self-citationMitochondrial Homeostasis and Cellular Senescence
Vasileiou, P. V. S., Evangelou, K., Vlasis, K. G., Fildisis, G., Panayiotidis, M. I., Chronopoulos, E., Passias, P.-G., Kouloukoussa, M., Gorgoulis, V. G., & Havaki, S. (2019) · Cells · doi:10.3390/cells8070686 · Cited by 255
Role of Mitochondria in Radiation Responses: Epigenetic, Metabolic, and Signaling Impacts
Averbeck, D., & Rodriguez‐Lafrasse, C. (2021) · International Journal of Molecular Sciences · doi:10.3390/ijms222011047 · Cited by 262
Pore-forming proteins as drivers of membrane permeabilization in cell death pathways
Vandenabeele, P., Bultynck, G., & Savvides, S. N. (2022) · Nature Reviews Molecular Cell Biology · doi:10.1038/s41580-022-00564-w · Cited by 220
Pro-apoptotic complexes of BAX and BAK on the outer mitochondrial membrane
Wolf, P., Schoeniger, A., & Edlich, F. (2022) · Biochimica et Biophysica Acta (BBA) - Molecular Cell Research · doi:10.1016/j.bbamcr.2022.119317 · Cited by 213
Chromothripsis: A New Mechanism for Rapid Karyotype Evolution
Leibowitz, M. L., Zhang, C., & Pellman, D. S. (2015) · Annual Review of Genetics · doi:10.1146/annurev-genet-120213-092228 · Cited by 205
Apoptosis in Cancer Biology and Therapy
Moyer, A. F., Tanaka, K., & Cheng, E. H. Y. (2025) · Annual Review of Pathology Mechanisms of Disease · doi:10.1146/annurev-pathmechdis-051222-115023 · Cited by 212
Pore formation in regulated cell death
Flores‐Romero, H., Ros, U., & García‐Sáez, A. J. (2020) · The EMBO Journal · doi:10.15252/embj.2020105753 · Cited by 191
The caspase‐activated DN ase: apoptosis and beyond
Larsen, B. D., & Sørensen, C. S. (2016) · FEBS Journal · doi:10.1111/febs.13970 · Cited by 180
Drug-tolerant persister cells in cancer: the cutting edges and future directions
Pu, Y., Li, L., Peng, H., Liu, L., Heymann, D., Robert, C., Vallette, F. M., & Shen, S. (2023) · Nature Reviews Clinical Oncology · doi:10.1038/s41571-023-00815-5 · Cited by 189
Recent insights into cell death and autophagy
Fitzwalter, B. E., & Thorburn, A. M. (2015) · FEBS Journal · doi:10.1111/febs.13515 · Cited by 177
Inhibiting the inhibitors: Targeting anti-apoptotic proteins in cancer and therapy resistance
Shahar, N., & Larisch, S. (2020) · Drug Resistance Updates · doi:10.1016/j.drup.2020.100712 · Cited by 175
Genomic instability, inflammatory signaling and response to cancer immunotherapy
Chen, M., Linstra, R., & van Vugt, M. A. T. M. (2022) · Biochimica et Biophysica Acta (BBA) - Reviews on Cancer · doi:10.1016/j.bbcan.2021.188661 · Cited by 166
Letai, A. G. (2016) · Annual Review of Cancer Biology · doi:10.1146/annurev-cancerbio-050216-121933 · Cited by 172
Mitochondria, cholesterol and cancer cell metabolism
Ribas, V., García‐Ruiz, C., & Fernández-Checa, J. C. (2016) · Clinical and Translational Medicine · doi:10.1186/s40169-016-0106-5 · Cited by 166
Apoptotic Caspases: Multiple or Mistaken Identities?
McArthur, K., & Kile, B. T. (2018) · Trends in Cell Biology · doi:10.1016/j.tcb.2018.02.003 · Cited by 166
A molecular signature for anastasis, recovery from the brink of apoptotic cell death
Sun, G., Guzman, E., Balasanyan, V., Conner, C. M., Wong, K., Zhou, H. R., Kosik, K. S., & Montell, D. J. (2017) · Journal of Cell Biology · doi:10.1083/jcb.201706134 · Cited by 151
Gudipaty, S. A., Conner, C. M., Rosenblatt, J., & Montell, D. J. (2018) · Annual Review of Cell and Developmental Biology · doi:10.1146/annurev-cellbio-100616-060748 · Cited by 150
Mitochondria and the hallmarks of cancer
Giampazolias, E., & Tait, S. W. G. (2015) · FEBS Journal · doi:10.1111/febs.13603 · Cited by 144
Self-citationThijssen, R., Diepstraten, S. T., Moujalled, D. M., Chew, E., Flensburg, C., Shi, M. X., Dengler, M. A., Litalien, V., MacRaild, S., Chen, M., et al. (2021) · Blood · doi:10.1182/blood.2020010167 · Cited by 135
A link between mitotic defects and mitotic catastrophe: detection and cell fate
Sazonova, E. V., Petrichuk, S. V., Kopeina, G. S., & Zhivotovsky, B. (2021) · Biology Direct · doi:10.1186/s13062-021-00313-7 · Cited by 141
Soeur, J., Belaïdi, J.-P., Chollet, C., Denat, L., Dimitrov, A., Jones, C., Perez, P., Zanini, M., Zobiri, O., Mezzache, S., et al. (2017) · Journal of Dermatological Science · doi:10.1016/j.jdermsci.2017.01.007 · Cited by 131
BCL-2 family deregulation in colorectal cancer: potential for BH3 mimetics in therapy
Ramesh, P., & Medema, J. P. (2020) · APOPTOSIS · doi:10.1007/s10495-020-01601-9 · Cited by 134
Ding, X., Sun, G., Argaw, Y. G., Wong, J. O., Easwaran, S., & Montell, D. J. (2016) · eLife · doi:10.7554/elife.10936 · Cited by 128
Mitophagy: Link to cancer development and therapy
Kulikov, A. V., Luchkina, E. A., Gogvadze, V. G., & Zhivotovsky, B. (2017) · Biochemical and Biophysical Research Communications · doi:10.1016/j.bbrc.2016.10.088 · Cited by 132
Modulating mitofusins to control mitochondrial function and signaling
Zacharioudakis, E., Agianian, B., Vasantha Kumar, M. V., Biris, N., Garner, T. P., Rabinovich-Nikitin, I., Ouchida, A. T., Margulets, V., Nordstrøm, L. U., Riley, J. S., et al. (2022) · Nature Communications · doi:10.1038/s41467-022-31324-1 · Cited by 137
Self-citationMitochondrial pores at the crossroad between cell death and inflammatory signaling
Flores‐Romero, H., Dadsena, S., & García‐Sáez, A. J. (2023) · Molecular Cell · doi:10.1016/j.molcel.2023.02.021 · Cited by 131
Mitochondria and Inflammation: Cell Death Heats Up
Vringer, E., & Tait, S. W. G. (2019) · Frontiers in Cell and Developmental Biology · doi:10.3389/fcell.2019.00100 · Cited by 124
Self-citationLu, Y., Li, L., Lin, Z., Li, M., Hu, X., Zhang, Y., Peng, M., Xia, H., & Han, G. (2018) · Advanced Healthcare Materials · doi:10.1002/adhm.201800602 · Cited by 122
Primary Sclerosing Cholangitis as a Premalignant Biliary Tract Disease: Surveillance and Management
Ilyas, S. I., Eaton, J. E., & Gores, G. J. (2015) · Clinical Gastroenterology and Hepatology · doi:10.1016/j.cgh.2015.05.035 · Cited by 120
Mitochondrial dynamics regulate genome stability via control of caspase-dependent DNA damage
Cao, K., Riley, J. S., Heilig, R., Montes-Gómez, A. E., Vringer, E., Berthenet, K., Cloix, C., Elmasry, Y., Spiller, D. G., Ichim, G., et al. (2022) · Developmental Cell · doi:10.1016/j.devcel.2022.03.019 · Cited by 124
Self-citationAnastasis: recovery from the brink of cell death
Tang, H. M., & Tang, H. L. (2018) · Royal Society Open Science · doi:10.1098/rsos.180442 · Cited by 117
Role of the nucleus in apoptosis: signaling and execution
Prokhorova, E. A., Zamaraev, A. V., Kopeina, G. S., Zhivotovsky, B., & Lavrik, I. N. (2015) · Cellular and Molecular Life Sciences · doi:10.1007/s00018-015-2031-y · Cited by 116
Failed Apoptosis Enhances Melanoma Cancer Cell Aggressiveness
Berthenet, K., Ferrer, C. C., Fanfone, D., Popgeorgiev, N., Neves, D., Bertolino, P., Gibert, B., Hernández‐Vargas, H., & Ichim, G. (2020) · Cell Reports · doi:10.1016/j.celrep.2020.107731 · Cited by 120
Self-citationEndoplasmic Reticulum Stress Signaling and Neuronal Cell Death
Merighi, A., & Lossi, L. (2022) · International Journal of Molecular Sciences · doi:10.3390/ijms232315186 · Cited by 123
A non-death function of the mitochondrial apoptosis apparatus in immunity
Brokatzky, D., Dörflinger, B., Haimovici, A., Weber, A., Kirschnek, S., Vier, J., Metz, A., Henschel, J., Steinfeldt, T., Gentle, I. E., et al. (2019) · The EMBO Journal · doi:10.15252/embj.2018100907 · Cited by 112
Ihenacho, U. K., Nolden, K. A., Harwig, M. C., Widlansky, M. E., & Hill, R. B. (2021) · Frontiers in Endocrinology · doi:10.3389/fendo.2021.660095 · Cited by 117
Senescence and senolytics in cardiovascular disease: Promise and potential pitfalls
Owens, W. A., Walaszczyk, A., Spyridopoulos, I., Dookun, E., & Richardson, G. D. (2021) · Mechanisms of Ageing and Development · doi:10.1016/j.mad.2021.111540 · Cited by 114
Mitochondria in cancer: in the aspects of tumorigenesis and targeted therapy
Badrinath, N., & Yoo, S. Y. (2018) · Carcinogenesis · doi:10.1093/carcin/bgy148 · Cited by 112
To the edge of cell death and back
Gong, Y., Crawford, J. C., Heckmann, B. L., & Green, D. R. (2018) · FEBS Journal · doi:10.1111/febs.14714 · Cited by 110
Procaspase-3 Overexpression in Cancer: A Paradoxical Observation with Therapeutic Potential
Boudreau, M. W., Peh, J., & Hergenrother, P. J. (2019) · ACS Chemical Biology · doi:10.1021/acschembio.9b00338 · Cited by 104
Key roles of necroptotic factors in promoting tumor growth
Liu, X., Zhou, M., Mei, L., Ruan, J., Hu, Q., Peng, J., Su, H., Liao, H., Liu, S., Liu, W., et al. (2016) · Oncotarget · doi:10.18632/oncotarget.7924 · Cited by 109
Pekmezovic, M., Hovhannisyan, H., Gresnigt, M. S., Iracane, E., Oliveira-Pacheco, J., Siscar-Lewin, S., Seemann, E., Qualmann, B., Kalkreuter, T., Müller, S., et al. (2021) · Nature Microbiology · doi:10.1038/s41564-021-00875-2 · Cited by 96
Self-inflicted DNA double-strand breaks sustain tumorigenicity and stemness of cancer cells
Liu, X., Li, F., Huang, Q., Zhang, Z., Zhou, L., Deng, Y., Zhou, M., Fleenor, D. E., He, W., Kastan, M. B., et al. (2017) · Cell Research · doi:10.1038/cr.2017.41 · Cited by 99
Crosstalk between mitochondria–ER contact sites and the apoptotic machinery as a novel health meter
Larrañaga-SanMiguel, A., Bengoa‐Vergniory, N., & Flores‐Romero, H. (2024) · Trends in Cell Biology · doi:10.1016/j.tcb.2024.08.007 · Cited by 94
The porin VDAC2 is the mitochondrial platform for Bax retrotranslocation
Lauterwasser, J., Todt, F., Zerbes, R. M., Nguyen, T. N., Craigen, W. J., Lazarou, M., van der Laan, M., & Edlich, F. (2016) · Scientific Reports · doi:10.1038/srep32994 · Cited by 92
Mechanisms of mitochondrial cell death
Dadsena, S., Zollo, C., & García-Sáez, A. J. (2021) · Biochemical Society Transactions · doi:10.1042/bst20200522 · Cited by 92
Metabolism and Innate Immunity Meet at the Mitochondria
Bahat, A., MacVicar, T., & Langer, T. (2021) · Frontiers in Cell and Developmental Biology · doi:10.3389/fcell.2021.720490 · Cited by 92
Targeting the SASP to combat ageing: Mitochondria as possible intracellular allies?
Birch, J., & Passos, J. F. (2017) · BioEssays · doi:10.1002/bies.201600235 · Cited by 89
Perturbing mitosis for anti‐cancer therapy: is cell death the only answer?
Haschka, M. D., Karbon, G., Fava, L. L., & Villunger, A. (2018) · EMBO Reports · doi:10.15252/embr.201745440 · Cited by 95
Regulation and Consequences of cGAS Activation by Self-DNA
Zierhut, C., & Funabiki, H. (2020) · Trends in Cell Biology · doi:10.1016/j.tcb.2020.05.006 · Cited by 91
Cancer cells use self-inflicted DNA breaks to evade growth limits imposed by genotoxic stress
Larsen, B. D., Benada, J., Yung, P. Y. K., Bell, R. A. V., Pappas, G. D., Urban, V., Ahlskog, J. K., Kuo, T. T., Janščák, P., Megeney, L. A., et al. (2022) · Science · doi:10.1126/science.abi6378 · Cited by 90
When cell death goes wrong: inflammatory outcomes of failed apoptosis and mitotic cell death
Bock, F. J., & Riley, J. S. (2022) · Cell Death and Differentiation · doi:10.1038/s41418-022-01082-0 · Cited by 94
Self-citationThe Apaf-1 apoptosome induces formation of caspase-9 homo- and heterodimers with distinct activities
Wu, C.-C., Lee, S. H., Malladi, S., Chen, M.-D., Mastrandrea, N. J., Zhang, Z., & Bratton, S. B. (2016) · Nature Communications · doi:10.1038/ncomms13565 · Cited by 89
Caspase-3 Regulates YAP-Dependent Cell Proliferation and Organ Size
Yosefzon, Y., Soteriou, D., Feldman, A., Kostic, L., Koren, E., Brown, S., Ankawa, R., Sedov, E., Glaser, F., & Fuchs, Y. (2018) · Molecular Cell · doi:10.1016/j.molcel.2018.04.019 · Cited by 91
A matter of life and death: stem cell survival in tissue regeneration and tumour formation
Soteriou, D., & Fuchs, Y. (2018) · Nature Reviews Cancer · doi:10.1038/nrc.2017.122 · Cited by 87
Callens, M., Kraskovskaya, N., Derevtsova, K. Z., Annaert, W. G., Bultynck, G., Борисович, Б. И., & Vervliet, T. (2021) · Biochimica et Biophysica Acta (BBA) - Molecular Cell Research · doi:10.1016/j.bbamcr.2021.118997 · Cited by 86
Carling, G. K., Fan, L., Foxe, N. R., Norman, K., Wong, M. Y., Zhu, D., Corona, C., Razzoli, A., Yu, F., Yarahmady, A., et al. (2024) · Neuron · doi:10.1016/j.neuron.2024.09.006 · Cited by 89
Inhibitor of apoptosis proteins as intracellular signaling intermediates
Kocab, A. J., & Duckett, C. S. (2015) · FEBS Journal · doi:10.1111/febs.13554 · Cited by 89
Mitochondria and cellular senescence: Implications for musculoskeletal ageing
Habiballa, L., Salmonowicz, H., & Passos, J. F. (2019) · Free Radical Biology and Medicine · doi:10.1016/j.freeradbiomed.2018.10.417 · Cited by 82
Dammert, M. A., Brägelmann, J., Olsen, R. R., Böhm, S., Monhasery, N., Whitney, C. P., Chalishazar, M. D., Tumbrink, H. L., Guthrie, M. R., Klein, S., et al. (2019) · Nature Communications · doi:10.1038/s41467-019-11371-x · Cited by 82
Autophagy induced during apoptosis degrades mitochondria and inhibits type I interferon secretion
Lindqvist, L., Frank, D. O., McArthur, K., Dite, T. A., Lazarou, M., Oakhill, J. S., Kile, B. T., & Vaux, D. L. (2017) · Cell Death and Differentiation · doi:10.1038/s41418-017-0017-z · Cited by 82
Gregory, C. D., & Dransfield, I. (2018) · Frontiers in Immunology · doi:10.3389/fimmu.2018.01111 · Cited by 79
Apoptosis – Fueling the oncogenic fire
Ferrer, C. C., Berthenet, K., & Ichim, G. (2020) · FEBS Journal · doi:10.1111/febs.15624 · Cited by 82
Self-citation
Metadata
- Authors
- Ichim, G., Lopez, J., Ahmed, S. U., Muthalagu, N., Giampazolias, E., Delgado, M. E., Haller, M., Riley, J. S., Mason, S. M., Athineos, D., Parsons, M. J., van de Kooij, B., Bouchier-Hayes, L., Chalmers, A. J., Rooswinkel, R. W., Oberst, A., Blyth, K., Rehm, M., Murphy, D. J., & Tait, S. W. G.
- Affiliations
- Cancer Research UK Scotland Institute (GB)
- University of Glasgow (GB)
- Royal College of Surgeons in Ireland (IE)
- Baylor College of Medicine (US)
- The Netherlands Cancer Institute (NL)
- University of Washington (US)
- Corresponding author
- Tait, Stephen W.G.
- ORCID
- Venue
- Molecular Cell
- Publisher
- Elsevier BV
- Published
- 2015-03
- Volume
- 57
- Issue
- 5
- Pages
- 860-872
- ISSN
- 1097-2765 (ISSN-L)
- PMC
- PMC4352766
- OpenAlex
- W2099583458
- Cited by
- 479
- References
- 42
- Citations by year
- 2026: 49 · 2025: 48 · 2024: 57 · 2023: 45 · 2022: 58 · 2021: 43 · 2020: 42 · 2019: 36 · 2018: 33 · 2017: 32 · 2016: 22 · 2015: 11
- FWCI
- 14.19
- Type
- journal article
- Language
- en
- Update notices
- erratum (2015-06-04)
- Open access
- hybrid
- doi.org
- Licence
- Locations
- Molecular Cell (publishedVersion, cc-by)
- PubMed Central (publishedVersion, cc-by)
- PubMed (publishedVersion)
- ENLIGHTEN (Jurnal Bimbingan dan Konseling Islam) (acceptedVersion)
- Sunderland Repository (University of Sunderland) (acceptedVersion)
- University of Groningen research database (University of Groningen / Centre for Information Technology) (submittedVersion)
- Funders
- Cancer Research UK (22311)
- Royal Society
- European Commission
- National Institutes of Health
- Biotechnology and Biological Sciences Research Council (BB/K008374/1)
- National Institute of Allergy and Infectious Diseases (R01AI108685)
- Topics
- Life Sciences › Biochemistry, Genetics and Molecular Biology › Molecular Biology › Cell death mechanisms and regulation
- Life Sciences › Biochemistry, Genetics and Molecular Biology › Molecular Biology › Mitochondrial Function and Pathology
- Life Sciences › Biochemistry, Genetics and Molecular Biology › Cell Biology › Autophagy in Disease and Therapy
- Keywords
- mitochondrial outer membrane permeabilization, apoptosis, caspase activation, cytochrome c release, DNA damage, genomic instability, cell transformation, carcinogenesis, tumor suppression
- MeSH terms
- Animals, Biphenyl Compounds, DNA Damage, Dose-Response Relationship, Drug, Embryo, Mammalian, Fibroblasts, HeLa Cells, Histones, Humans, Mice, Inbred C57BL, Nitrophenols, Permeability, Piperazines, Sulfonamides, Time Factors, Blotting, Western, Apoptosis, Mice, Knockout, Microscopy, Confocal, Proto-Oncogene Proteins c-bcl-2, Staurosporine, Caspases, Genomic Instability, HCT116 Cells, Cell Line, Tumor, Cyclin-Dependent Kinase Inhibitor p19, Mitochondrial Membranes, MCF-7 Cells
About these checks
Registry, retraction, Cites and statistics results are computed, not judged, with one exception: a printed reference that no index lists is read once by a model before it counts as a citation error. Claims are extracted by a model and kept only when their quote appears verbatim in the text; each cited source is then checked, with a model’s help, for whether it says what the claim relies on. Those verdicts can be wrong — read the claim’s quote and the cited source before relying on one.
Statistics and arithmetic are recomputed, not judged.
Confidence bands are shown only for fields calibrated on our annotated test set. None is calibrated yet, so no band is shown.
What counts as a claim ›How we measure confidence ›How we check this ›
Are you an author, or do you see a problem with this page? Request a review
