

The DOI matches its Crossref record; 39 of the 42 references it cites were found in a registry or an index.
Global, regional, and national sepsis incidence and mortality, 1990–2017: analysis for the Global Burden of Disease Study
Open accessAbstract
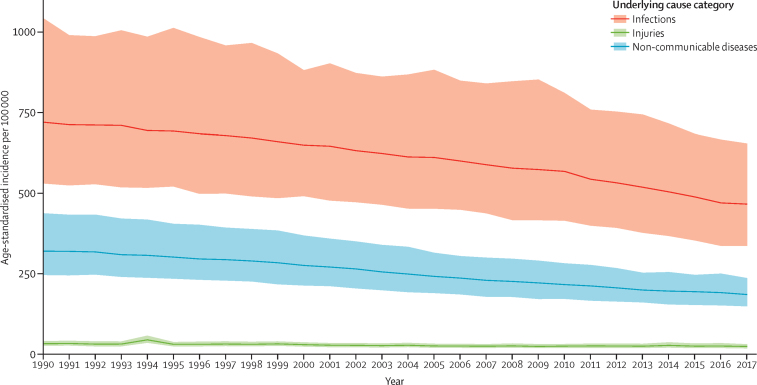
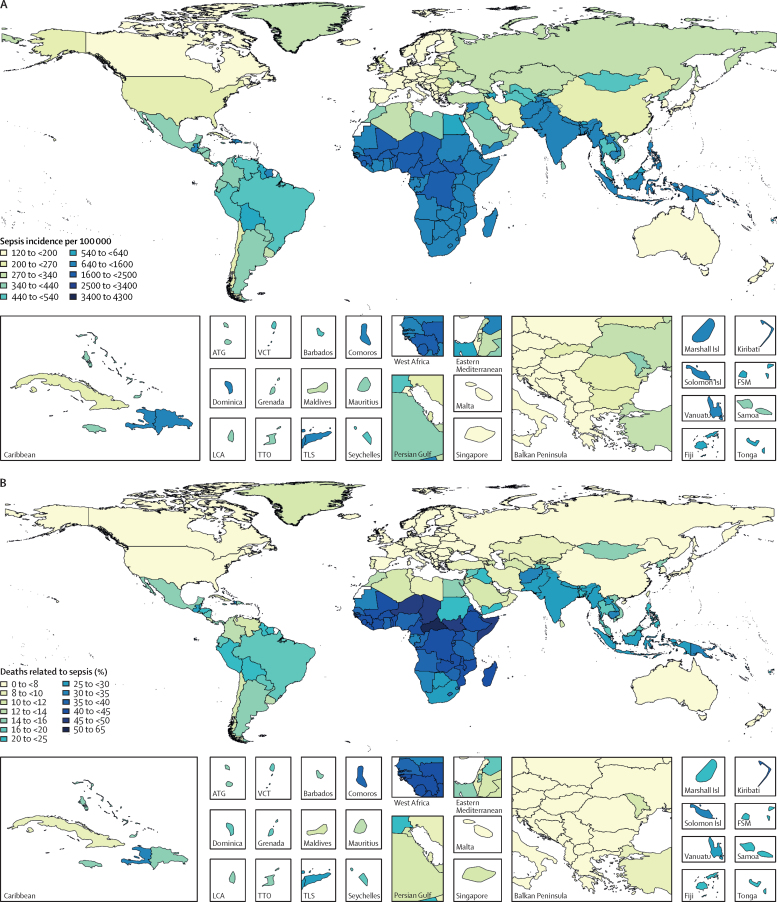
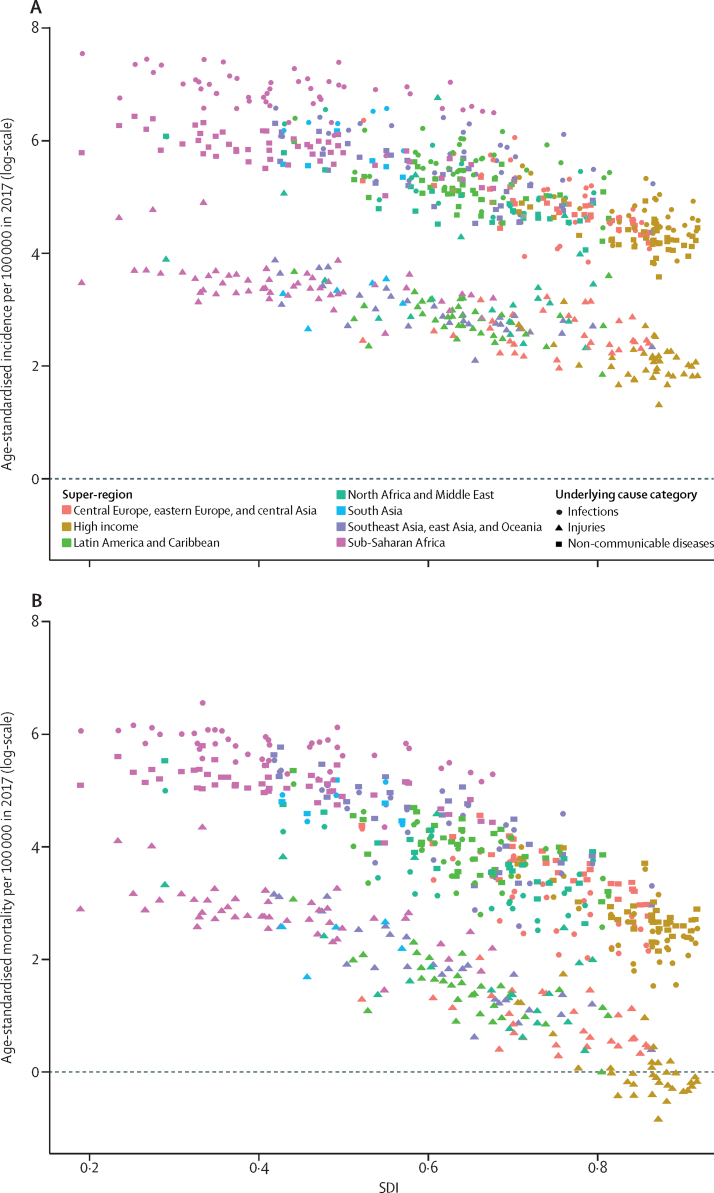
BACKGROUND: Sepsis is life-threatening organ dysfunction due to a dysregulated host response to infection. It is considered a major cause of health loss, but data for the global burden of sepsis are limited. As a syndrome caused by underlying infection, sepsis is not part of standard Global Burden of Diseases, Injuries, and Risk Factors Study (GBD) estimates. Accurate estimates are important to inform and monitor health policy interventions, allocation of resources, and clinical treatment initiatives. We estimated the global, regional, and national incidence of sepsis and mortality from this disorder using data from GBD 2017. METHODS: We used multiple cause-of-death data from 109 million individual death records to calculate mortality related to sepsis among each of the 282 underlying causes of death in GBD 2017. The percentage of sepsis-related deaths by underlying GBD cause in each location worldwide was modelled using mixed-effects linear regression. Sepsis-related mortality for each age group, sex, location, GBD cause, and year (1990-2017) was estimated by applying modelled cause-specific fractions to GBD 2017 cause-of-death estimates. We used data for 8·7 million individual hospital records to calculate in-hospital sepsis-associated case-fatality, stratified by underlying GBD cause. In-hospital sepsis-associated case-fatality was modelled for each location using linear regression, and sepsis incidence was estimated by applying modelled case-fatality to sepsis-related mortality estimates. FINDINGS: In 2017, an estimated 48·9 million (95% uncertainty interval [UI] 38·9-62·9) incident cases of sepsis were recorded worldwide and 11·0 million (10·1-12·0) sepsis-related deaths were reported, representing 19·7% (18·2-21·4) of all global deaths. Age-standardised sepsis incidence fell by 37·0% (95% UI 11·8-54·5) and mortality decreased by 52·8% (47·7-57·5) from 1990 to 2017. Sepsis incidence and mortality varied substantially across regions, with the highest burden in sub-Saharan Africa, Oceania, south Asia, east Asia, and southeast Asia. INTERPRETATION: Despite declining age-standardised incidence and mortality, sepsis remains a major cause of health loss worldwide and has an especially high health-related burden in sub-Saharan Africa. FUNDING: The Bill & Melinda Gates Foundation, the National Institutes of Health, the University of Pittsburgh, the British Columbia Children's Hospital Foundation, the Wellcome Trust, and the Fleming Fund.
Overview
The claims and statistics of this paper haven’t been checked yet.
Run the check — free, no account needed. It reads the open-access text and checks the sources it cites.
Integrity signals
Registry
Cites
Statistics
Figures
Verification
Claims the paper makes
The claims and statistics of this paper haven’t been checked yet.
Run the check — free, no account needed. It reads the open-access text and checks the sources it cites.
Claims other papers make about this one
Each is checked against this paper’s own text: does it say what the citing paper says it does?
The source backs part of the claim, not all of it — or backs it for a different population, condition or comparison.
In the citing paper
“A clear relationship can be seen – the poorest nations, all former European colonies, have the highest sepsis incidence”
From On race, human variation, and who gets and dies of sepsis (2022) · cites this paper as Rudd et al., 2020
Experimental — accuracy not yet measuredThe cited source says what the claim attributes to it.
In the citing paper
“This approach follows the methods validated by many studies on the epidemiology of sepsis26, 27, 28, 29 and was used by Rudd and colleagues.10”
From Global burden of bacterial antimicrobial resistance 1990–2021: a systematic analysis with forecasts to 2050 (2024) · cites this paper as [10]
The cited source says what the claim attributes to it.
In the citing paper
“Previously published global estimates reported a 53% decline in age-standardised sepsis-related deaths from 1990 to 2017.10”
From Global burden of bacterial antimicrobial resistance 1990–2021: a systematic analysis with forecasts to 2050 (2024) · cites this paper as [10]
In the citing paper
“8.2 million of the 11.1 million sepsis deaths worldwide that year occurred in low and middle income nations”
From On race, human variation, and who gets and dies of sepsis (2022) · cites this paper as Rudd et al., 2020
In the citing paper
“more people in middle and low income nations die of sepsis per incident than in wealthy nations”
From On race, human variation, and who gets and dies of sepsis (2022) · cites this paper as Rudd et al., 2020
In the citing paper
“The majority of the world's sepsis burden is borne by the least wealthiest nations, most former European colonies.”
From On race, human variation, and who gets and dies of sepsis (2022) · cites this paper as Rudd et al., 2020
In the citing paper
“Worldwide, the bulk of sepsis burden falls on marginalized peoples (Gracey & King, 2009; Rudd et al., 2020).”
From On race, human variation, and who gets and dies of sepsis (2022) · cites this paper as Rudd et al., 2020
Self-check
Percentages, sums and reported differences re-computed from the paper’s own numbers.
The self-check needs the paper’s full text.
Citations
Cites
James, S. L., Abate, D., Abate, K. H., Abay, S. M., Abbafati, C., Abbasi, N., Abbastabar, H., Abd-Allah, F., Abdela, J., Abdelalim, A., et al. (2018) · The Lancet · doi:10.1016/s0140-6736(18)32279-7 · Cited by 13,867
Bone, R. C., BALK, R. A., Cerra, F. B., Dellinger, R. P., Fein, A. M., Knaus, W. A., Schein, R. M. H., & Sibbald, W. J. (1992) · CHEST Journal · doi:10.1378/chest.101.6.1644 · Cited by 13,335
Vos, T., Abajobir, A. A., Abate, K. H., Abbafati, C., Abbas, K. M., Abd-Allah, F., Abdulkader, R. S., Abdulle, A. M., Abebo, T. A., Abera, S. F., et al. (2017) · The Lancet · doi:10.1016/s0140-6736(17)32154-2 · Cited by 13,220
Self-citationRoth, G. A., Abate, D., Abate, K. H., Abay, S. M., Abbafati, C., Abbasi, N., Abbastabar, H., Abd-Allah, F., Abdela, J., Abdelalim, A., et al. (2018) · The Lancet · doi:10.1016/s0140-6736(18)32203-7 · Cited by 8,600
Self-citationAngus, D. C., Linde-Zwirble, W. T., Lidicker, J., Clermont, G., Carcillo, J., & Pinsky, M. R. (2001) · Critical Care Medicine · doi:10.1097/00003246-200107000-00002 · Cited by 8,503
Self-citationSurviving Sepsis Campaign: International guidelines for management of sepsis and septic shock: 2016.
Rhodes, A., Evans, L. E., Alhazzani, W., Levy, M. M., Antonelli, M., Ferrer, R., Kumar, A., Sevransky, J. E., Sprung, C. L., Nunnally, M. E., et al. (2017) · Intensive Care Medicine · doi:10.1007/s00134-017-4683-6 · Cited by 6,621
Self-citationThe epidemiology of sepsis in the United States from 1979 through 2000
Martin, G. S., Mannino, D. M., Eaton, S., & Moss, M. (2003) · New England Journal of Medicine · doi:10.1056/nejmoa022139 · Cited by 5,841
Stanaway, J. D., Afshin, A., Gakidou, E., Lim, S. S., Abate, D., Abate, K. H., Abbafati, C., Abbasi, N., Abbastabar, H., Abd-Allah, F., et al. (2018) · The Lancet · doi:10.1016/s0140-6736(18)32225-6 · Cited by 4,943
Self-citationKyu, H. H., Abate, D., Abate, K. H., Abay, S. M., Abbafati, C., Abbasi, N., Abbastabar, H., Abd-Allah, F., Abdela, J., Abdelalim, A., et al. (2018) · The Lancet · doi:10.1016/s0140-6736(18)32335-3 · Cited by 4,192
Self-citationFleischmann, C., Scherag, A., Adhikari, N. K. J., Hartog, C. S., Tsaganos, T., Schlattmann, P., Angus, D. C., & Reinhart, K. (2016) · American Journal of Respiratory and Critical Care Medicine · doi:10.1164/rccm.201504-0781oc · Cited by 3,548
Self-citation
Research works printed but not linked: 1
- Singer, 2016, The third international consensus definitions for sepsis and septic shock (Sepsis-3), JAMA, 315, 801, 10.1001/jama.2016.0287 · DOI · Paper page
Cited by
Sorted by citations
Items 1,001–1,054 of 1,054
Decoy Nanoparticles and Protein Corona Modulation: A Novel Frontier in Sepsis Treatment
Denisova, E., Volkova, D. S., Streltsova, V. V., Kopytov, S., Krivosheev, A., Panfilova, E. A., Yan, N., Kostyushev, D. S., Ganjalikhani-Hakemi, M., Pokrovsky, V. V., et al. (2026) · International Journal of Nanomedicine · doi:10.2147/ijn.s593748
“The highest mortality rates remain concentrated in sub-Saharan Africa and some Asia regions, underscoring the persistent inequities in healthcare access and outcomes 4 (Figure 1).”
Anupam, K., Sawlani, K., Yadav, A., Chaudhary, S. C., Usman, K., Sharma, A., & Atam, V. (2026) · Journal of Association of Physicians of India · doi:10.59556/japi.74.1319
Makkar, A., Khushboo, H., Bairwa, M., Sharma, A., Goyal, B., & Kant, R. (2026) · International Journal of Critical Illness and Injury Science · doi:10.4103/ijciis.ijciis_142_25
Back to basics in critical care: Can hematological ratios refine sepsis risk stratification?
Gupta, B., Prakash, J., & Ortego, A. (2026) · International Journal of Critical Illness and Injury Science · doi:10.4103/ijciis.ijciis_42_26
“[1] Despite significant improvements in early identification and protocolized management of sepsis, risk stratification remains problematic.”
Farhati, V., Hunter, J., Sattwika, P. D., & Rozi, M. F. (2026) · Bali Journal of Anesthesiology · doi:10.4103/bjoa.bjoa_298_25
Khanijau, A., Allman, E., Pulmones, R., Goodman, R. N., Cantillon, D., McGalliard, R., Parry, C. M., Carrol, E. D., & Roberts, A. P. (2026) · Journal of Medical Microbiology · doi:10.1099/jmm.0.002147
“Gram-negative bloodstream infections (GNBSIs) contribute significantly to the global burden of paediatric sepsis, accounting for 30–50% of all bloodstream infections worldwide [1, 2].”
FOLR3+neutrophils contribute to sepsis by exacerbating hyper-inflammation
Chen, F., Tan, H., Wang, D., Su, R., Liao, J., Ge, H., & Wang, W. (2026) · Genes and Immunity · doi:10.1038/s41435-026-00396-0
“Furthermore, one in three sepsis survivors die within one year after discharge, and one in six experiences signi fi cant long-term morbidity [2].”
Islam, S., Sharma, S., Sharmin, F., Naidin, E. J., Shuki, F. K., & Mahanto, S. (2026) · Asia Pacific Journal of Cancer Research · doi:10.70818/apjcr.v03i01.074
“When pneumonia progresses beyond localized respiratory infection and causes systemic inflammatory response with organ dysfunction, it may lead to pneumonia-associated sepsis, a life-threatening condition requiring rapid recognition and timely management [2, 3].”
Bastow, C. R., Mei, C., Wen, S. W., Wilson, J. L., Nguyen, H., Suthya, A. R., Bourne, J. H., Lankadeva, Y. R., & Wong, C. H. Y. (2026) · Intensive Care Medicine Experimental · doi:10.1186/s40635-026-00886-5
“Multiple groups have reported sex differences in sepsis survival, with greater mortality rates observed in male patients and animals [2, 62–67].”
InfluentialSong, B., Chen, G.-Y., & Kang, H.-J. (2026) · Emergency and Critical Care Medicine · doi:10.1097/ec9.0000000000000182
Arsenijević, J., Pirkovic, M. S. S., Milovanović, D. R., Kostic, M. J., Jovičić, B. P., Lešnjak, I., Jevtić, M., Mijailovic, S., Knežević, S., Radojević, D., et al. (2026) · Biomedicines · doi:10.3390/biomedicines14040787
Multimodal Deep Learning for Real-Time Sepsis Risk Classification on Embedded Systems
Rajendran, V., Malhotra, M., Rallabandi, S., Kumar, A., & Jayabal, S. R. (2026) · International Multi-Conference on Systems, Signals & Devices (SSD) · doi:10.1109/ssd69655.2026.11558916
Zhang, T., Wan, Y., Wan, J., Han, Z., Min, S., & Chen, S. (2026) · BMC Anesthesiology · doi:10.1186/s12871-026-03613-5
“Sepsis-induced shock represents a life-threatening manifestation of dysregulated host responses to infection and contributes to approximately 11 million deaths globally each year [1].”
Zhang, X.-Q., Wu, J.-Y., & Guo, S. (2026) · Shock · doi:10.1097/shk.0000000000002824
“Globally, sepsis affects over 49 million individuals annually, with mortality rates ranging from 20% to 40% (2).”
Wang, J.-Y., Chen, Z.-F., Zhang, Y.-R., Zhang, L., Xu, Y., Wan, Y., & Liang, H. (2026) · Global Insights in Medicine and Nursing · doi:10.65140/gimn202602.14
“The scatter charts, funnel charts, and leave-one-out sensitivity analyses for the six discovered circulating inflammatory biomarkers in sepsis are shown in Figures 5, 6 and 7.”
Yuan, Y., Wang, J.-J., Lei, S.-Y., & Li, J.-S. (2026) · PLoS ONE · doi:10.1371/journal.pone.0343026
“This complex condition imposes a heavy burden on the global healthcare system, with an estimated 31.5 million cases of sepsis and 19.4 million cases of severe sepsis annually, resulting in approximately 5.3 million deaths each year [2].”
InfluentialExplainable Machine Learning for Multi-Horizon Early Sepsis Prediction in Intensive Care Units
Ogunwale, Y., Fakoya, J., Oyedemi, O. A., Abiona, A., Ajinaja, M., & Ibiyomi, M. A. (2026) · Cureus Journal of Computer Science · doi:10.7759/s44389-026-00045-7
Wetterberg, H., Nilsson, A., Linder, A., Lengquist, M., Frigyesi, A., Sundén‐Cullberg, J., & Inghammar, M. (2026) · Critical Care Medicine · doi:10.1097/ccm.0000000000007105
Su, Q., Yu, J., He, S., Fan, C., Chen, Y., Zhou, W., & Qiao, M. (2026) · BMC Emergency Medicine · doi:10.1186/s12873-026-01547-2
“The Sequential Organ Failure Assessment (SOFA) score has been established as a key tool for diagnosing sepsis and assessing its severity, according to international guidelines [1–3].”
Surveillance of Sepsis in Children-Making Every Case Count.
Schlapbach, L., Chong, S.-L., & Luethi, N. (2026) · Journal of the American Medical Association (JAMA) · doi:10.1001/jama.2026.2814
Host response signatures across sepsis aetiologies in India: a single centre observational study
Biemond, J. J., Earny, V. A., Virk, H., Adukkadukkam, A., Girish, A., Klarenbeek, A. M., Peters-Sengers, H., Butler, J., Mukhopadhyay, C., Wiersinga, W., et al. (2026) · The Lancet Regional Health - Southeast Asia · doi:10.1016/j.lansea.2026.100752
Ayyıldız, F., Ayyıldız, A., Yıldız, G., Ata, A. R., & Yıldırım, Ö. (2026) · Heart & lung : the journal of critical care · doi:10.1016/j.hrtlng.2026.102771
Zhang, B.-L., & Mi, Y.-W. (2026) · Transactions on Artificial Intelligence · doi:10.53941/tai.2026.100007
“Sepsis remains one of the leading causes of mortality in intensive care units (ICUs) worldwide, affecting approximately 49 million people annually and contributing to 11 million deaths globally [1].”
Septic source matters: how infection site and microbial etiology affect sepsis prognosis
Guarino, M., Maroncelli, G., Luppi, F., Donati, C., Bandini, C., Costanzini, A., Maritati, M., Contini, C., Giorgio, R. D., & Spampinato, M. (2026) · Emergency Care Journal · doi:10.4081/ecj.2026.14647
Wang, J., Xu, L.-S., Li, W., Zhao, F., Yang, Y., Shan, L., Xin, L., & Wang, W. (2026) · Journal of Biological Engineering · doi:10.1186/s13036-026-00662-9
“Previous studies have shown that mitochondrial DNA (mtDNA) is an important component that mediates mitochondrial and cellular metabolic functions [6].”
Elevated growth differentiation factor-15 in sepsis: clinical associations and immune cell context
Li, W., Li, Y., Wang, Y., Wu, Z., Cui, J., Wang, J., & Yu, X. (2026) · Frontiers in Cell and Developmental Biology · doi:10.3389/fcell.2026.1789747
“Sepsis is a life-threatening condition characterized by organ dysfunction resulting from a dysregulated host response to infection and remains a leading cause of mortality in intensive care units worldwide (Rudd et al., 2020).”
Sex and gender differences in hemostasis in critical illness
Helms, J., Juffermans, N. P., & Iba, T. (2026) · Critical Care Science · doi:10.62675/2965-2774.20260035 · Cited by 1
“(7) In a sepsis cohort, women had less thrombocytopenia, lower Sequential Organ Failure Assessment (SOFA) scores, and lower crude mortality after adjustment, although sex was not independently associated with adjusted mortality.”
Shirazi, S. A., Kumar, D., Siddique, A., Salman, S., Ali, S., & Uddin, Q. (2026) · JMMC · doi:10.62118/jmmc.v16i02.713
Granulocyte and monocyte adsorption therapy in sepsis: a propensity score-matched analysis
Hisamune, R., Yamakawa, K., Nakamura, T., Doi, K., Takahashi, G., Moriyama, K., Ishihara, T., & Nishida, O. (2026) · Journal of Intensive Care · doi:10.1186/s40560-026-00872-9
“The JMDC defined sepsis according to the ICD-10 criteria as a condition involving a combination of infection and organ dysfunction [2].”
Li, M., Gu, M.-H., Wang, H., Sun, Y., Jiang, S.-S., Wang, X.-K., Wang, S., Wang, M., Lv, S.-S., Han, X.-D., et al. (2026) · Frontiers in Cellular and Infection Microbiology · doi:10.3389/fcimb.2026.1746246
“In 2017, it was estimated that 48.9 million sepsis cases were reported worldwide, with a mortality rate of 22.5%, accounting for nearly one-fi fth of all deaths (Rudd et al., 2020).”
InfluentialOzudogru, F. K., Karaca, B., Yılmaz, H. E., Karalar, O., Aksun, M., & Gonderen, K. (2026) · BMC Infectious Diseases · doi:10.1186/s12879-026-13002-5
“In 2017, it was estimated that there were 48.9 million cases worldwide and 11 million sepsis-related deaths, accounting for approximately 20% of all global deaths; however, accurately determining the global burden of sepsis remains challenging [3].”
InfluentialAGGREGATE INDEX OF SYSTEMIC INFLAMMATION (AISI) IN SURVIVOR AND NON-SURVIVOR SEPSIS PATIENTS
Amir, S. F., Nurulita, A., & Bahrun, U. (2026) · INDONESIAN JOURNAL OF CLINICAL PATHOLOGY AND MEDICAL LABORATORY · doi:10.24293/ijcpml.v32i2.2468
Chen, X.-L., Yang, J., Hong, X., Li, L., Zheng, G., & Yu, T. (2026) · BMC Infectious Diseases · doi:10.1186/s12879-026-13086-z
“…in diagnostic imaging and the widespread adoption of image-guided percutaneous drainage combined with appropriate antibiotic therapy, PLA continues to be associated with severe complications such as sepsis, septic shock, metastatic infections, and multiple organ dysfunction syndrome (MODS) [2– 4].”
Chen, Q., Zeng, J.-J., Zhong, L.-C., Jiang, Z.-W., He, L.-P., Lin, Q.-W., Zeng, Q., Liu, J., Yin, H.-C., & Song, J.-C. (2026) · Frontiers in Cellular and Infection Microbiology · doi:10.3389/fcimb.2026.1779950
Jin, Y., Tan, Y., Huang, S., Wang, Y., Yang, S., Wei, J., Wei, Y., Zhou, Y., Huang, Y., He, C., et al. (2026) · Journal of Health Population and Nutrition · doi:10.1186/s41043-026-01262-5
“The ARIMA model is a classical model in the time series analysis method that can effectively fit and predict the trend of time series data [21].”
Ma, Y., Shen, S.-X., Zheng, W., Liu, M., Yang, X.-B., Wang, Y.-D., & Zhang, X. (2026) · Frontiers in Immunology · doi:10.3389/fimmu.2026.1754842
Wearable near-infrared spectroscopy device for low-resource settings
Samaei, S., Eskandari, R., Shoemaker, L. N., Li, N. C., Kamar, F., Sikstrom, L. D., Holdsworth, D. W., & Diop, M. (2026) · Journal of Physics: Photonics · doi:10.1088/2515-7647/ae4cdf
“Interestingly, previous work has also demonstrated the sensitivity of slow fluctuations in peripheral tissue oxygenation to sepsis-related microvascular dysfunction [73–75], a life-threatening condition heavily burdening low-resource populations [2].”
Asociación de las plaquetas con la falla orgánica múltiple en pacientes sépticos
Bocanegra-Alegría, E., Bravo-Santibáñez, E., & Márquez-Torres, C. B. (2026) · Revista medica del Instituto Mexicano del Seguro Social · doi:10.5281/zenodo.17537616
Zhang, Y. J., Qiu, C., Li, X., Peng, Y., Liu, J., & Zhu, P. (2026) · Frontiers in Genetics · doi:10.3389/fgene.2026.1754817
“According to data from the Global Burden of Disease (GBD) 2017 study, sepsis accounted for approximately 19.7% of all deaths worldwide, imposing a substantial global healthcare burden (Rudd et al., 2020).”
InfluentialEshel, Y., Sharaha, U., Bykhovsky, D., Chernyak, M., Asleh, M., Miskin, H., Lapidot, I., Mordechai, S., Kapelushnik, J., & Salman, A. (2026) · Analytical Chemistry · doi:10.1021/acs.analchem.5c07862
Singer, C., Plută, I., Vintilescu, Ș. B., Madalina, P. E., Stoica, G., Văruţ, R., Vasilica, P. D. F., Rădulescu, V., Geanina, N. V., Preoteasa, D., et al. (2026) · Children · doi:10.3390/children13030366
“Septic shock, in particular, is a leading cause of childhood hospitalization and death, with global estimates reporting tens of millions of pediatric sepsis cases annually and approximately 2.9 million associated deaths, predominantly in low-resource settings [1,2].”
InfluentialMa, Q.-H., Guo, J., Yang, Y.-J., & Feng, Y.-M. (2026) · Journal of Thoracic Disease · doi:10.21037/jtd-2025-aw-2414
“A study estimating the global burden of sepsis reported 48.9 million incident sepsis cases and 11 million sepsis-related deaths worldwide (3).”
InfluentialSingh, A., & Gupta, P. (2026) · Biologia · doi:10.1007/s11756-026-02154-z
“Sepsis accounts for an estimated 48 million cases and 11 million deaths annually (Salomão et al. 2019; Rudd et al. 2020).”
Zou, L.-B., Fu, B.-X., Wang, D.-Y., Chen, Y., Gui, H., Mu, G., Li, X., Zhang, Y.-M., Liu, J.-F., & Yang, C.-H. (2026) · Materials Today Bio · doi:10.1016/j.mtbio.2026.102989
“Sepsis is a life-threatening organ dysfunction syndrome driven by a dysregulated host response to infection, characterized by acute onset and rapid progression to multiple organ failure, constituting a critical public health crisis [1 – 3].”
Advances and Challenges in Sepsis Care in Low-Resource Settings
Maves, R. C., & Siddiqui, S. Z. (2026) · Critical Care Clinics · doi:10.1016/j.ccc.2026.01.005
Scarcella, M., Formenti, P., Petroni, G., Monti, R., & de Robertis, E. (2026) · Journal of Clinical Medicine · doi:10.3390/jcm15052061
“In 2017 alone, an estimated 49 million cases of sepsis and 11 million sepsis-related deaths occurred worldwide [2].”
Lee, K.-B., Lee, C. Y., Jang, J., Jeong, Y., & Lee, K. H. (2026) · Journal of Clinical Medicine · doi:10.3390/jcm15062125
“Despite global advancements in diagnostic and therapeutic strategies, sepsis remains a global healthcare burden, affecting an estimated 49 million individuals annually [1].”
Kalkman, L. C., Kanu, E. M., Bache, E. B., Septihandayani, I., Kelling, E. F., Kargbo, I. M., Sesay, M. D., Tarawally, Y. M., Bangura, J. J., Bull, M. A., et al. (2026) · The Lancet Regional Health - Africa · doi:10.1016/j.lanafr.2026.100025
Pathologic Th1–Treg Cells Exacerbate Acute Lung Injury and Lethality in Sepsis
Murao, T., Murao, A., Aziz, M., & Wang, P. (2026) · Cells · doi:10.3390/cells15060521 · Cited by 1
“Sepsis is a major global medical problem, affecting over 50 million people and resulting in approximately 11 million deaths annually world-wide [1,2].”
Fu, F., Zhang, C., Xu, Z., Ji, P., & Zhang, Z. (2026) · JGH Open · doi:10.1002/jgh3.70318
“It can lead to multiple organ dysfunction syndrome, posing a substantial risk to the lives of critically ill patients [1, 2].”
Sreepathi, D., Kumar, H. S. S., Pavan, G., & Satyanarayana, N. (2026) · In Silico Research in Biomedicine · doi:10.1016/j.insi.2026.100300
Wang, Y.-M., Wang, M., Wang, L., Tang, Q., Wang, Y.-P., Teng, X.-Y., & Jin, L. (2026) · Journal of Acute Disease · doi:10.4103/jad.jad_149_25
Megatrends and equity gaps in global digital health: A bibliometric review (2010–2025)
Borromeo, A. S., Manaloto, A. M., & Vicedo, R. V. (2026) · Health Policy · doi:10.1016/j.healthpol.2026.105621 · Cited by 1
TREM2 sustains glucose metabolic homeostasis to drive antibacterial defense during sepsis
Wu, Z., Wang, X., Ren, Y., Shen, L., Pan, Y., Zhang, Y., Fan, J., Shu, Q., Fang, X., & 陈齐兴 (2026) · iScience · doi:10.1016/j.isci.2026.115415
Metadata
- Authors
- Rudd, K. E., Johnson, S. C., Agesa, K. M., Shackelford, K. A., Tsoi, D., Kievlan, D. R., Colombara, D. V., Ikuta, K. S., Kissoon, N., Finfer, S., Fleischmann-Struzek, C., Machado, F. R., Reinhart, K. K., Rowan, K., Seymour, C. W., Watson, R. S., West, T. E., Marinho, F., Hay, S. I., Lozano, R., Lopez, A. D., Angus, D. C., Murray, C. J. L., & Naghavi, M.
- Affiliations
- University of Pittsburgh (US)
- University of Washington (US)
- University of British Columbia (CA)
- UNSW Sydney (AU)
- Jena University Hospital (DE)
- Seattle Children's Hospital (US)
- Universidade de São Paulo (BR)
- Corresponding author
- Naghavi, Mohsen
- ORCID
- Venue
- The Lancet
- Publisher
- Elsevier BV
- Published
- 2020-01
- Volume
- 395
- Issue
- 10219
- Pages
- 200-211
- ISSN
- 0099-5355 (ISSN-L)
- 0140-6736
- PMC
- PMC6970225
- OpenAlex
- W2998853022
- Cited by
- 7,971
- References
- 42
- Citations by year
- 2026: 1540 · 2025: 1722 · 2024: 1545 · 2023: 1195 · 2022: 899 · 2021: 735 · 2020: 329
- FWCI
- 567.33
- Type
- journal article
- Language
- en
- Open access
- hybrid
- doi.org
- Licence
- Locations
- The Lancet (publishedVersion, cc-by)
- PubMed Central (publishedVersion, cc-by)
- PubMed (publishedVersion)
- LA Referencia (Red Federada de Repositorios Institucionales de Publicaciones Científicas) (submittedVersion, other-oa)
- Minerva Access (University of Melbourne) (submittedVersion, cc-by)
- Funders
- Bill & Melinda Gates Foundation
- National Institutes of Health (T32HL007287, T32HL007820, R35GM119519)
- National Health and Medical Research Council (no 1117230)
- Topics
- Health Sciences › Medicine › Critical Care and Intensive Care Medicine › Sepsis Diagnosis and Treatment
- Health Sciences › Medicine › Public Health, Environmental and Occupational Health › Global Health and Epidemiology
- Health Sciences › Medicine › Pediatrics, Perinatology and Child Health › Neonatal and Maternal Infections
- Keywords
- sepsis, sepsis incidence, sepsis mortality, global burden of disease, case fatality, underlying cause of death, age-standardized incidence rate, temporal trends, regional variation, sub-Saharan Africa, South Asia, hospital records, cause-specific mortality, health policy interventions, resource allocation, health loss, nosocomial infections, infection-related mortality, sepsis surveillance
- MeSH terms
- Global Burden of Disease, Adolescent, Adult, Aged, Aged, 80 and over, Cause of Death, Child, Child, Preschool, Female, Humans, Infant, Infant, Newborn, Male, Middle Aged, Socioeconomic Factors, Incidence, Age Distribution, Sex Distribution, Sepsis, Young Adult
About these checks
Registry, retraction, Cites and statistics results are computed, not judged, with one exception: a printed reference that no index lists is read once by a model before it counts as a citation error. Claims are extracted by a model and kept only when their quote appears verbatim in the text; each cited source is then checked, with a model’s help, for whether it says what the claim relies on. Those verdicts can be wrong — read the claim’s quote and the cited source before relying on one.
Statistics and arithmetic are recomputed, not judged.
Confidence bands are shown only for fields calibrated on our annotated test set. None is calibrated yet, so no band is shown.
What counts as a claim ›How we measure confidence ›How we check this ›
Are you an author, or do you see a problem with this page? Request a review
