

The DOI matches its Crossref record; 81 of the 81 references it cites were found in a registry or an index.
Transcriptional response to stress is pre-wired by promoter and enhancer architecture
Open accessAbstract
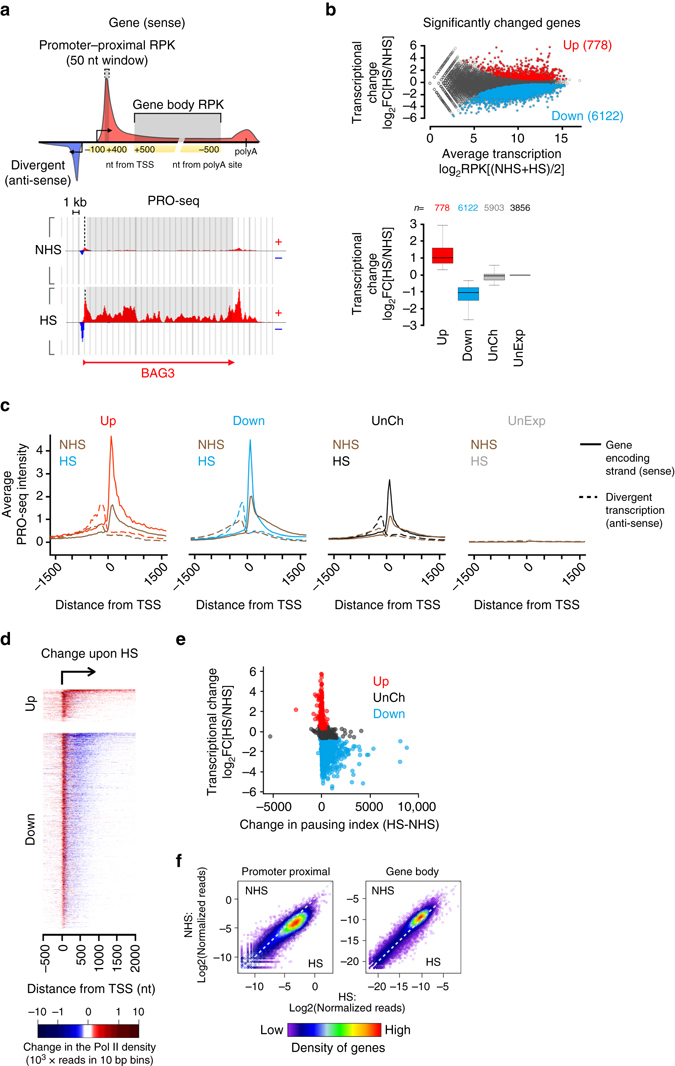
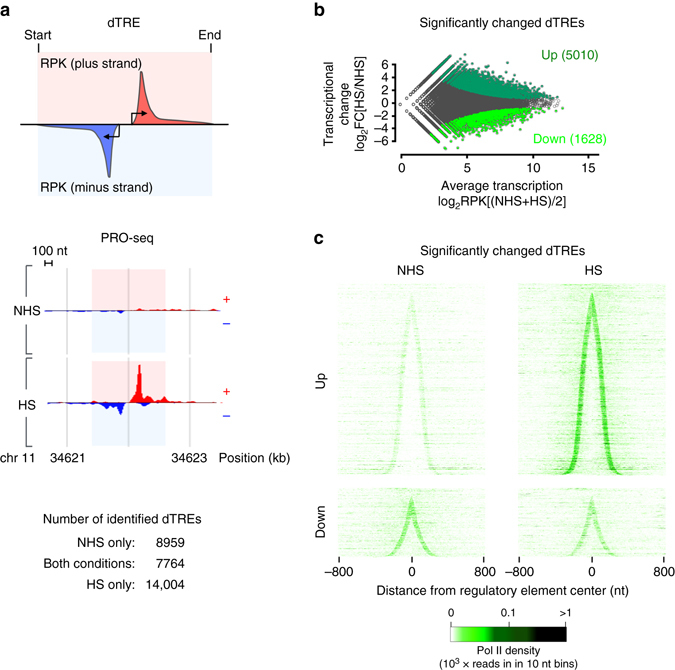
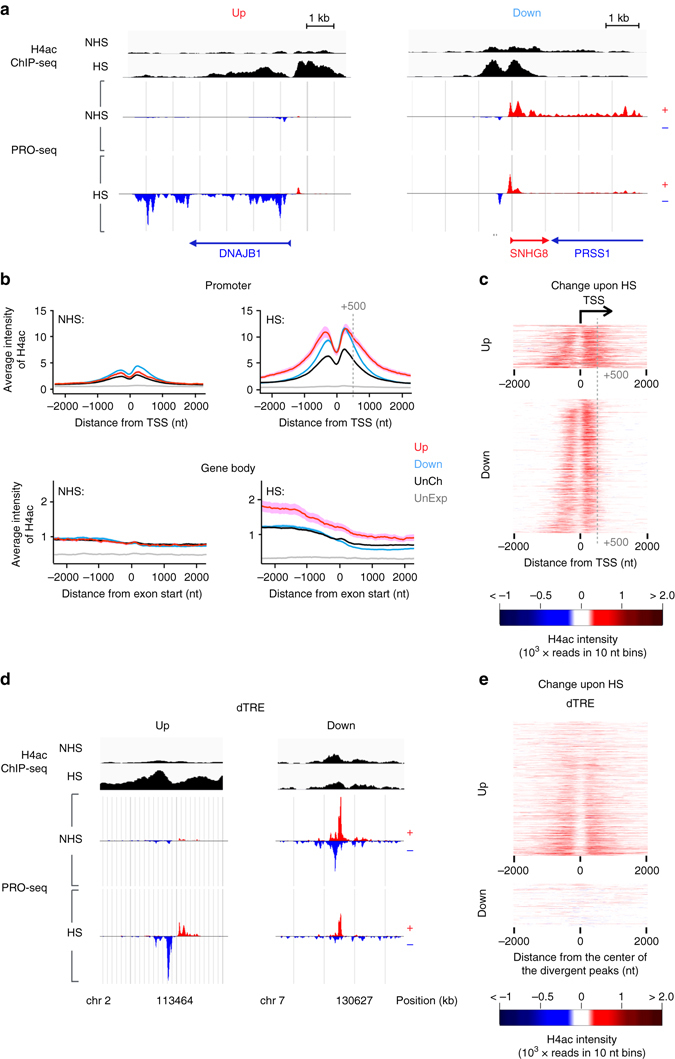
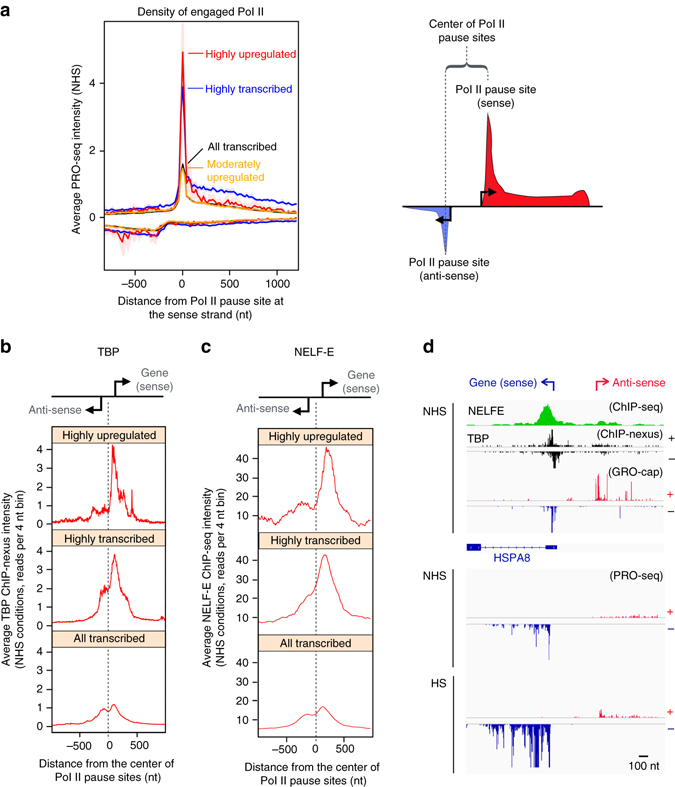
Programs of gene expression are executed by a battery of transcription factors that coordinate divergent transcription from a pair of tightly linked core initiation regions of promoters and enhancers. Here, to investigate how divergent transcription is reprogrammed upon stress, we measured nascent RNA synthesis at nucleotide-resolution, and profiled histone H4 acetylation in human cells. Our results globally show that the release of promoter-proximal paused RNA polymerase into elongation functions as a critical switch at which a gene’s response to stress is determined. Highly transcribed and highly inducible genes display strong transcriptional directionality and selective assembly of general transcription factors on the core sense promoter. Heat-induced transcription at enhancers, instead, correlates with prior binding of cell-type, sequence-specific transcription factors. Activated Heat Shock Factor 1 (HSF1) binds to transcription-primed promoters and enhancers, and CTCF-occupied, non-transcribed chromatin. These results reveal chromatin architectural features that orient transcription at divergent regulatory elements and prime transcriptional responses genome-wide.
Overview
The claims and statistics of this paper haven’t been checked yet.
Run the check — free, no account needed. It reads the open-access text and checks the sources it cites.
Integrity signals
Registry
Cites
Statistics
Figures
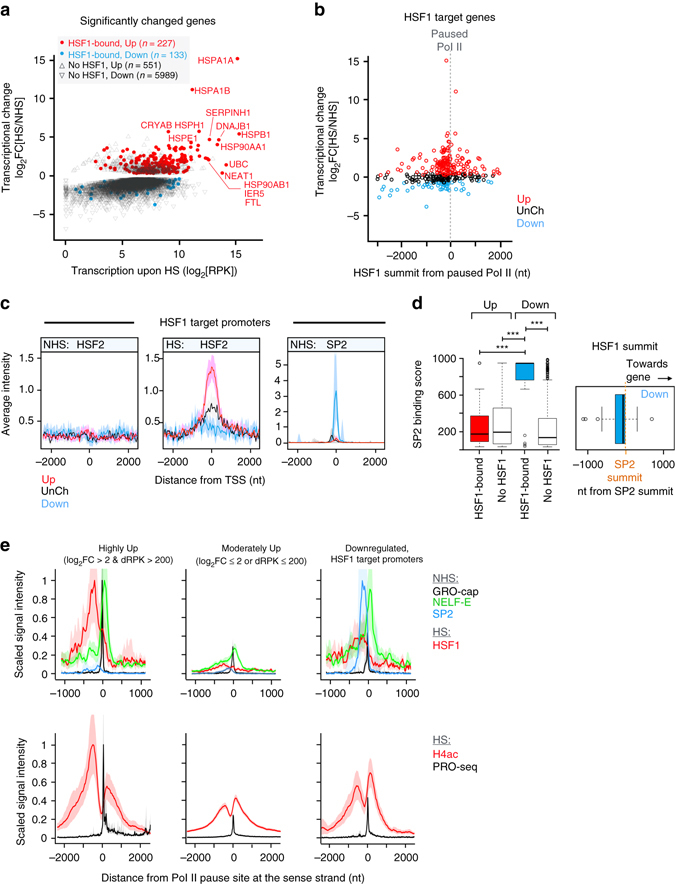
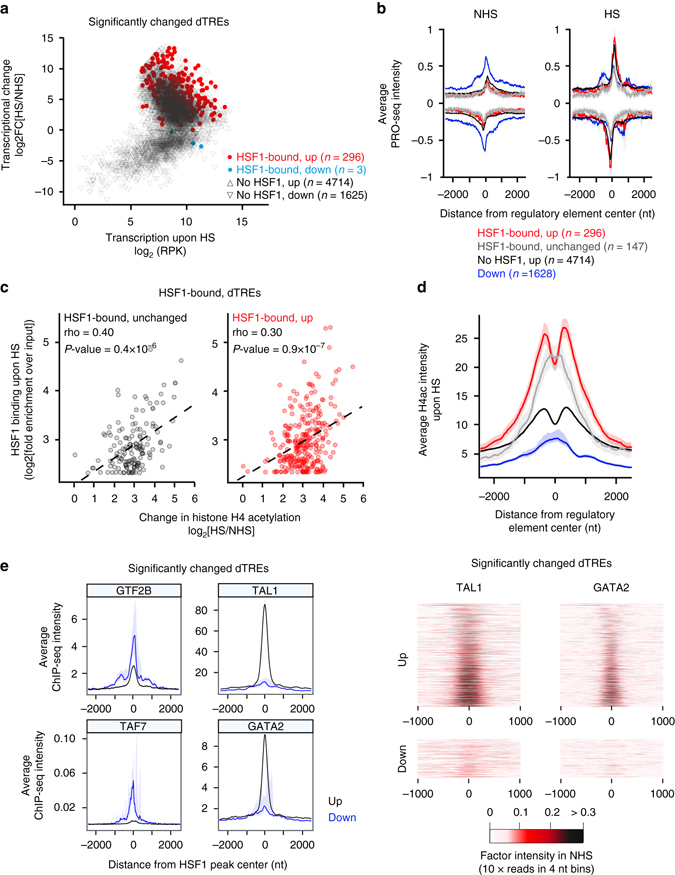
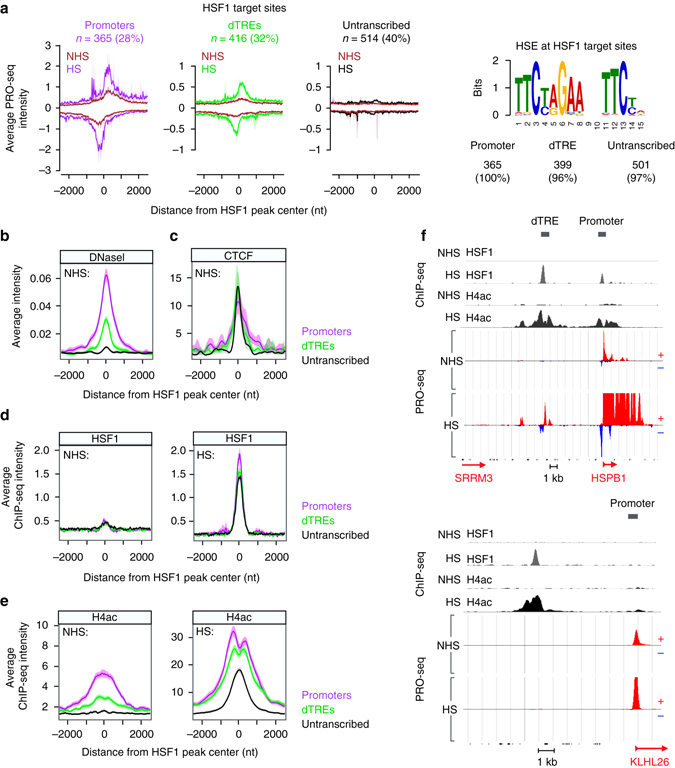
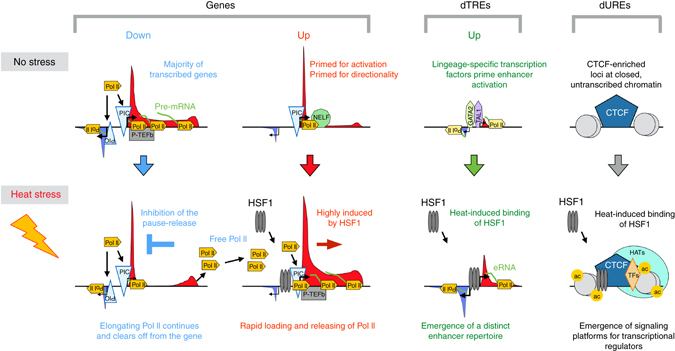
Verification
Claims the paper makes
The claims and statistics of this paper haven’t been checked yet.
Run the check — free, no account needed. It reads the open-access text and checks the sources it cites.
Claims other papers make about this one
Each is checked against this paper’s own text: does it say what the citing paper says it does?
The source backs part of the claim, not all of it — or backs it for a different population, condition or comparison.
In the citing paper
“But even this generality is complicated by the fact that the capacity of an expressed TF to interact with an enhancer may depend on the chromatin state of the region in which the enhancer resides100, which is in turn a function not only of a cell’s present state but also its developmental history.”
From Towards a comprehensive catalogue of validated and target-linked human enhancers (2020) · cites this paper as [100]
Experimental — accuracy not yet measured
Self-check
Percentages, sums and reported differences re-computed from the paper’s own numbers.
The self-check needs the paper’s full text.
Citations
Cites
1 retracted
Genomic organization of human transcription initiation complexes
Venters, B. J., & Pugh, B. F. (2013) · Nature · doi:10.1038/nature12535 · Cited by 79
RetractedModerated estimation of fold change and dispersion for RNA-seq data with DESeq2
Love, M. I., Huber, W., & Anders, S. (2014) · Genome Biology · doi:10.1186/s13059-014-0550-8 · Cited by 95,106
Cutadapt removes adapter sequences from high-throughput sequencing reads
Martin, M. (2011) · EMBnet.journal · doi:10.14806/ej.17.1.200 · Cited by 33,889
BEDTools: a flexible suite of utilities for comparing genomic features
Quinlan, A. R., & Hall, I. M. (2010) · Bioinformatics · doi:10.1093/bioinformatics/btq033 · Cited by 27,437
Ultrafast and memory-efficient alignment of short DNA sequences to the human genome.
Langmead, B., Trapnell, C., Pop, M., & Salzberg, S. L. (2009) · Genome Biology · doi:10.1186/gb-2009-10-3-r25 · Cited by 21,849
Heintzman, N. D., Stuart, R. K., Hon, G., Fu, Y., Ching, C. W., Hawkins, R. D., Barrera, L. O., Van Calcar, S., Qu, C., Ching, K. A., et al. (2007) · Nature Genetics · doi:10.1038/ng1966 · Cited by 3,398
Mapping and analysis of chromatin state dynamics in nine human cell types
Ernst, J., Kheradpour, P., Mikkelsen, T. S., Shoresh, N., Ward, L. D., Epstein, C. B., Zhang, X., Wang, L., Issner, R., Coyne, M., et al. (2011) · Nature · doi:10.1038/nature09906 · Cited by 2,898
An atlas of active enhancers across human cell types and tissues
The FANTOM Consortium, Andersson, R., Gebhard, C., Miguel-Escalada, I., Hoof, I., Bornholdt, J., Boyd, M., Chen, Y., Zhao, X., Schmidl, C., et al. (2014) · Nature · doi:10.1038/nature12787 · Cited by 2,550
Histone modifications at human enhancers reflect global cell-type-specific gene expression
Heintzman, N. D., Hon, G. C., Hawkins, R. D., Kheradpour, P., Stark, A., Harp, L. F., Ye, Z., Lee, L. K., Stuart, R. K., Ching, C. W., et al. (2009) · Nature · doi:10.1038/nature07829 · Cited by 2,533
Widespread transcription at neuronal activity-regulated enhancers
Kim, T.-K., Hemberg, M., Gray, J. M., Costa, A. M., Bear, D. M., Wu, J., Harmin, D. A., Laptewicz, M., Barbara-Haley, K., Kuersten, S., et al. (2010) · Nature · doi:10.1038/nature09033 · Cited by 2,450
The Heat Shock Response: Life on the Verge of Death
Richter, K., Haslbeck, M., & Büchner, J. (2010) · Molecular Cell · doi:10.1016/j.molcel.2010.10.006 · Cited by 2,025
Nascent RNA Sequencing Reveals Widespread Pausing and Divergent Initiation at Human Promoters
Core, L. J., Waterfall, J. J., & Lis, J. T. (2008) · Science · doi:10.1126/science.1162228 · Cited by 1,986
Self-citationIdentifying ChIP-seq enrichment using MACS
Feng, J., Liu, T., Qin, B., Zhang, Y., & Liu, X. S. (2012) · Nature Protocols · doi:10.1038/nprot.2012.101 · Cited by 1,848
Expression of a β-globin gene is enhanced by remote SV40 DNA sequences
Banerji, J., Rusconi, S., & Schaffner, W. (1981) · Cell · doi:10.1016/0092-8674(81)90413-x · Cited by 1,724
A User's Guide to the Encyclopedia of DNA Elements (ENCODE)
The ENCODE Project Consortium (2011) · PLoS Biology · doi:10.1371/journal.pbio.1001046 · Cited by 1,517
Regulation of aging and age-related disease by DAF-16 and heat-shock factor
Hsu, A.-L., Murphy, C. T., & Kenyon, C. (2003) · Science · doi:10.1126/science.1083701 · Cited by 1,513
Protein synthesis in salivary glands of Drosophila melanogaster: Relation to chromosome puffs
Tissieres, A., Mitchell, H. K., & Tracy, U. M. (1974) · Journal of Molecular Biology · doi:10.1016/0022-2836(74)90447-1 · Cited by 1,227
Discovery and characterization of chromatin states for systematic annotation of the human genome
Ernst, J., & Kellis, M. (2010) · Nature Biotechnology · doi:10.1038/nbt.1662 · Cited by 1,075
Histone exchange, chromatin structure and the regulation of transcription
Venkatesh, S., & Workman, J. L. (2015) · Nature Reviews Molecular Cell Biology · doi:10.1038/nrm3941 · Cited by 997
CTCF-Mediated Human 3D Genome Architecture Reveals Chromatin Topology for Transcription
Tang, Z., Luo, O. J., Li, X., Zheng, M., Zhu, J. J., Szalaj, P., Trzaskoma, P., Magalska, A., Wlodarczyk, J., Ruszczycki, B., et al. (2015) · Cell · doi:10.1016/j.cell.2015.11.024 · Cited by 982
A high-resolution map of active promoters in the human genome
Kim, T. H., Barrera, L. O., Zheng, M., Qu, C., Singer, M. A., Richmond, T., Wu, Y., Green, R. D., & Ren, B. (2005) · Nature · doi:10.1038/nature03877 · Cited by 954
Transcriptional Regulatory Elements in the Human Genome
Maston, G. A., Evans, S. K., & Green, M. R. (2006) · Annual Review of Genomics and Human Genetics · doi:10.1146/annurev.genom.7.080505.115623 · Cited by 937 · cited 1×
“(5) Potent trans-activator HSF1 localizes to transcription-primed and architectural protein-primed genomic regions.”
Divergent Transcription from Active Promoters
Seila, A. C., Calabrese, J. M., Levine, S. S., Yeo, G. W.-M., Rahl, P. B., Flynn, R. A., Young, R. A., & Sharp, P. A. (2008) · Science · doi:10.1126/science.1162253 · Cited by 930
Getting up to speed with transcription elongation by RNA polymerase II
Jonkers, I., & Lis, J. T. (2015) · Nature Reviews Molecular Cell Biology · doi:10.1038/nrm3953 · Cited by 876
Self-citationReprogramming transcription by distinct classes of enhancers functionally defined by eRNA
Wang, D., García-Bassets, I., Benner, C. W., Li, W., Su, X. B., Zhou, Y., Qiu, J., Liu, W., Kaikkonen, M. U., Ohgi, K. A., et al. (2011) · Nature · doi:10.1038/nature10006 · Cited by 854
Precise Maps of RNA Polymerase Reveal How Promoters Direct Initiation and Pausing
Kwak, H., Fuda, N. J., Core, L. J., & Lis, J. T. (2013) · Science · doi:10.1126/science.1229386 · Cited by 849
Self-citationYamaguchi, Y., Takagi, T., Wada, T., Yano, K., Furuya, A., Sugimoto, S., Hasegawa, J., & Handa, H. (1999) · Cell · doi:10.1016/s0092-8674(00)80713-8 · Cited by 841
Functional and Mechanistic Diversity of Distal Transcription Enhancers
Bulger, M., & Groudine, M. (2011) · Cell · doi:10.1016/j.cell.2011.01.024 · Cited by 803
Mendillo, M. L., Santagata, S., Koeva, M., Bell, G. W., Hu, R., Tamimi, R. M., Fraenkel, E., Ince, T. A., Whitesell, L. J., & Lindquist, S. L. (2012) · Cell · doi:10.1016/j.cell.2012.06.031 · Cited by 718
Core, L. J., Martins, A. L., Danko, C. G., Waters, C. T., Siepel, A., & Lis, J. T. (2014) · Nature Genetics · doi:10.1038/ng.3142 · Cited by 693
Self-citationTranscribed enhancers lead waves of coordinated transcription in transitioning mammalian cells
Arner, E., Daub, C. O., Vitting‐Seerup, K., Andersson, R., Lilje, B., Drabløs, F., Lennartsson, A., Rönnerblad, M., Hrydziuszko, O., Vitezic, M., et al. (2015) · Science · doi:10.1126/science.1259418 · Cited by 587
Jonkers, I., Kwak, H., & Lis, J. T. (2014) · eLife · doi:10.7554/elife.02407 · Cited by 581
Self-citationDefining mechanisms that regulate RNA polymerase II transcription in vivo
Fuda, N. J., Ardehali, M. B., & Lis, J. T. (2009) · Nature · doi:10.1038/nature08449 · Cited by 576
Self-citationMahat, D. B., Kwak, H., Booth, G. T., Jonkers, I. H., Danko, C. G., Patel, R. K., Waters, C. T., Munson, K. M., Core, L. J., & Lis, J. T. (2016) · Nature Protocols · doi:10.1038/nprot.2016.086 · Cited by 517
Self-citationEnhancer transcripts mark active estrogen receptor binding sitesPreprint
Hah, N., Murakami, S., Nagari, A., Danko, C. G., & Kraus, W. L. (2013) · Genome Research · doi:10.1101/gr.152306.112 · Cited by 491
Self-citationGenome-Wide Analysis of the Biology of Stress Responses through Heat Shock Transcription Factor
Hahn, J., Hu, Z., Thiele, D. J., & Iyer, V. R. (2004) · Molecular and Cellular Biology · doi:10.1128/mcb.24.12.5249-5256.2004 · Cited by 438
Mammalian heat shock response and mechanisms underlying its genome-wide transcriptional regulation
Mahat, D. B., Salamanca, H. H., Duarte, F. M., Danko, C. G., & Lis, J. T. (2016) · Molecular Cell · doi:10.1016/j.molcel.2016.02.025 · Cited by 426
Self-citationYan, J., Enge, M., Whitington, T., Dave, K., Liu, J., Sur, I., Schmierer, B., Jolma, A., Kivioja, T., Taipale, M., et al. (2013) · Cell · doi:10.1016/j.cell.2013.07.034 · Cited by 384
Mayer, A., di Iulio, J., Maleri, S., Eser, U., Vierstra, J., Reynolds, A., Sandstrom, R., Stamatoyannopoulos, J. A., & Churchman, L. S. (2015) · Cell · doi:10.1016/j.cell.2015.03.010 · Cited by 367
Regulation of the Cellular Heat Shock Response in Caenorhabditis elegans by Thermosensory Neurons
Prahlad, V., Cornelius, T., & Morimoto, R. I. (2008) · Science · doi:10.1126/science.1156093 · Cited by 367
Discovering Hematopoietic Mechanisms through Genome-wide Analysis of GATA Factor Chromatin Occupancy
Fujiwara, T., O’Geen, H., Keleş, S., Blahnik, K. R., Linnemann, A. K., Kang, Y.-A., Choi, K., Farnham, P., & Bresnick, E. H. (2009) · Molecular Cell · doi:10.1016/j.molcel.2009.11.001 · Cited by 354
CTCF and Cohesin: Linking Gene Regulatory Elements with Their Targets
Merkenschlager, M., & Odom, D. T. (2013) · Cell · doi:10.1016/j.cell.2013.02.029 · Cited by 345
Trinklein, N. D., Murray, J. I., Hartman, S. J., Botstein, D., & Myers, R. (2003) · Molecular Biology of the Cell · doi:10.1091/mbc.e03-10-0738 · Cited by 341
Santagata, S., Hu, R., Lin, N., Mendillo, M. L., Collins, L. C., Hankinson, S. E., Schnitt, S. J., Whitesell, L. J., Tamimi, R. M., Lindquist, S. L., et al. (2011) · Proceedings of the National Academy of Sciences · doi:10.1073/pnas.1115031108 · Cited by 323
Vihervaara, A., & Sistonen, L. (2014) · Journal of Cell Science · doi:10.1242/jcs.132605 · Cited by 321
Self-citationP-TEFb kinase recruitment and function at heat shock lociPreprint
Lis, J. T., Mason, P., Peng, J., Price, D. H., & Werner, J. K. (2000) · Genes & Development · doi:10.1101/gad.14.7.792 · Cited by 314
Self-citationMultiple functions of Drosophila heat shock transcription factor in vivo
Jedlicka, P., Mortin, M. A., & Wu, C. (1997) · The EMBO Journal · doi:10.1093/emboj/16.9.2452 · Cited by 306
Enhancers as information integration hubs in development: lessons from genomics
Buecker, C., & Wysocka, J. (2012) · Trends in Genetics · doi:10.1016/j.tig.2012.02.008 · Cited by 295
Tight Coordination of Protein Translation and HSF1 Activation Supports the Anabolic Malignant State
Santagata, S., Mendillo, M. L., Tang, Y., Subramanian, A., Perley, C. C., Roche, S. P., Wong, B., Narayan, R., Kwon, H., Koeva, M., et al. (2013) · Science · doi:10.1126/science.1238303 · Cited by 287
ChIP-nexus enables improved detection of in vivo transcription factor binding footprints
He, Q., Johnston, J., & Zeitlinger, J. (2015) · Nature Biotechnology · doi:10.1038/nbt.3121 · Cited by 263
Huang, J., Liu, X., Li, D., Shao, Z., Cao, H., Zhang, Y., Trompouki, E., Bowman, T. V., Zon, L. I., Yuan, G., et al. (2016) · Developmental Cell · doi:10.1016/j.devcel.2015.12.014 · Cited by 247
Chromatin Landscape Dictates HSF Binding to Target DNA Elements
Guertin, M. J., & Lis, J. T. (2010) · PLoS Genetics · doi:10.1371/journal.pgen.1001114 · Cited by 244
Self-citationÖstling, P., Björk, J., Roos‐Mattjus, P., Mezger, V., & Sistonen, L. (2007) · Journal of Biological Chemistry · doi:10.1074/jbc.m607556200 · Cited by 238
Self-citationIdentification of active transcriptional regulatory elements from GRO-seq data
Danko, C. G., Hyland, S. L., Core, L. J., Martins, A. L., Waters, C. T., Lee, H. W., Cheung, V. G., Kraus, W. L., Lis, J. T., & Siepel, A. C. (2015) · Nature Methods · doi:10.1038/nmeth.3329 · Cited by 220
Self-citationChiang, W.-C., Ching, T.-T., Lee, H. C., Mousigian, C., & Hsu, A.-L. (2012) · Cell · doi:10.1016/j.cell.2011.12.019 · Cited by 219
Heat shock and recovery are mediated by different translational mechanisms.
DiDomenico, B., Bugaisky, G., & Lindquist, S. (1982) · Proceedings of the National Academy of Sciences · doi:10.1073/pnas.79.20.6181 · Cited by 205
Divergent Transcription: A Driving Force for New Gene Origination?
Wu, X., & Sharp, P. A. (2013) · Cell · doi:10.1016/j.cell.2013.10.048 · Cited by 180
Kruesi, W. S., Core, L. J., Waters, C. T., Lis, J. T., & Meyer, B. J. (2013) · eLife · doi:10.7554/elife.00808 · Cited by 175
Self-citationSandqvist, A., Björk, J., Åkerfelt, M., Chitikova, Z., Grichine, A., Vourc’h, C., Jolly, C., Salminen, T. A., Nymalm, Y., & Sistonen, L. (2009) · Molecular Biology of the Cell · doi:10.1091/mbc.e08-08-0864 · Cited by 175
Self-citationTranscriptional response to stress in the dynamic chromatin environment of cycling and mitotic cells
Vihervaara, A., Sergelius, C., Vasara, J., Blom, M. A. H., Elsing, A. N., Roos‐Mattjus, P., & Sistonen, L. (2013) · Proceedings of the National Academy of Sciences · doi:10.1073/pnas.1305275110 · Cited by 149
Self-citationNeuronal circuitry regulates the response of Caenorhabditis elegans to misfolded proteins
Prahlad, V., & Morimoto, R. I. (2011) · Proceedings of the National Academy of Sciences · doi:10.1073/pnas.1106557108 · Cited by 145
Duarte, F. M., Fuda, N. J., Mahat, D. B., Core, L. J., Guertin, M. J., & Lis, J. T. (2016) · Genes & Development · doi:10.1101/gad.284430.116 · Cited by 131
Self-citationHigh-resolution digital profiling of the epigenome
Zentner, G. E., & Henikoff, S. (2014) · Nature Reviews Genetics · doi:10.1038/nrg3798 · Cited by 127
E2F coregulates an essential HSF developmental program that is distinct from the heat-shock responsePreprint
Li, J., Chauve, L., Phelps, G., Brielmann, R. M., & Morimoto, R. I. (2016) · Genes & Development · doi:10.1101/gad.283317.116 · Cited by 116
Global SUMOylation on active chromatin is an acute heat stress response restricting transcription
Niskanen, E. A., Malinen, M., Sutinen, P., Toropainen, S., Paakinaho, V., Vihervaara, A., Joutsen, J., Kaikkonen, M. U., Sistonen, L., & Palvimo, J. J. (2015) · Genome biology · doi:10.1186/s13059-015-0717-y · Cited by 107
Self-citationAida, M., Chen, Y., Nakajima, K., Yamaguchi, Y., Wada, T., & Handa, H. (2006) · Molecular and Cellular Biology · doi:10.1128/mcb.02366-05 · Cited by 105
Booth, G. T., Wang, I. X., Cheung, V. G., & Lis, J. T. (2016) · Genome Research · doi:10.1101/gr.204578.116 · Cited by 97
Self-citationStructures of HSF2 reveal mechanisms for differential regulation of human heat-shock factors
Jaeger, A. M., Pemble, C. W., IV, Sistonen, L., & Thiele, D. J. (2016) · Nature Structural & Molecular Biology · doi:10.1038/nsmb.3150 · Cited by 91
Self-citationWu, W.-S., Morrissey, C. S., Keller, C. A., Mishra, T., Pimkin, M., Blobel, G. A., Weiss, M. J., & Hardison, R. C. (2014) · Genome Research · doi:10.1101/gr.164830.113 · Cited by 84
Heat Shock Transcription Factor 1 Localizes to Sex Chromatin during Meiotic Repression
Åkerfelt, M., Vihervaara, A., Laiho, A., Conter, A., Christians, E., Sistonen, L., & Henriksson, E. (2010) · Journal of Biological Chemistry · doi:10.1074/jbc.m110.157552 · Cited by 78
Self-citationGonsalves, S. E., Moses, A. M., Razak, Z., Robert, F., & Westwood, J. T. (2011) · PLoS ONE · doi:10.1371/journal.pone.0015934 · Cited by 77
Drosophila Heat Shock System as a General Model to Investigate Transcriptional RegulationPreprint
Guertin, M. J., Petesch, S. J., Zobeck, K. L., Min, I. M., & Lis, J. T. (2010) · Cold Spring Harbor Symposia on Quantitative Biology · doi:10.1101/sqb.2010.75.039 · Cited by 76
Self-citationGenetic Tailors: CTCF and Cohesin Shape the Genome During Evolution
Rudan, M. V., & Hadjur, S. (2015) · Trends in Genetics · doi:10.1016/j.tig.2015.09.004 · Cited by 70
Defining NELF-E RNA Binding in HIV-1 and Promoter-Proximal Pause Regions
Pagano, J. M., Kwak, H., Waters, C. T., Sprouse, R. O., White, B. S., Ozer, A., Szeto, K., Shalloway, D. I., Craighead, H. G., & Lis, J. T. (2014) · PLoS Genetics · doi:10.1371/journal.pgen.1004090 · Cited by 68
Self-citationHuman gene promoters are intrinsically bidirectional
Andersson, R., Chen, Y., Core, L., Lis, J., Sandelin, A., & Jensen, T. (2015) · Molecules and Cells · doi:10.1016/j.molcel.2015.10.015 · Cited by 64
Self-citationGenomic Organization of Human Transcription Initiation Complexes
Pugh, B. F., & Venters, B. J. (2016) · PLoS ONE · doi:10.1371/journal.pone.0149339 · Cited by 53
A mechanistic link between gene regulation and genome architecture in mammalian development
Bonora, G., Plath, K., & Denholtz, M. (2014) · Current Opinion in Genetics & Development · doi:10.1016/j.gde.2014.05.002 · Cited by 52
Nucleosome Dancing at the Tempo of Histone Tail Acetylation
Galvani, A., & Thiriet, C. (2015) · Genes · doi:10.3390/genes6030607 · Cited by 49
Masson, F. L., Razak, Z., Kaigo, M., Audouard, C., Charry, C., Cooke, H. J., Westwood, J. T., & Christians, E. (2011) · Molecular and Cellular Biology · doi:10.1128/mcb.05237-11 · Cited by 46
Expression of HSF2 decreases in mitosis to enable stress-inducible transcription and cell survival
Elsing, A. N., Aspelin, C., Björk, J., Bergman, H., Himanen, S. V., Kallio, M. J., Roos‐Mattjus, P., & Sistonen, L. (2014) · The Journal of Cell Biology · doi:10.1083/jcb.201402002 · Cited by 46
Self-citationHumburg, P., Maugeri, N., Lee, W., Mohr, B. J., & Knight, J. C. (2016) · Genome Medicine · doi:10.1186/s13073-016-0345-5 · Cited by 7
Cited by
Sorted by citations
Towards a comprehensive catalogue of validated and target-linked human enhancers
Gasperini, M., Tome, J. M., & Shendure, J. (2020) · Nature Reviews Genetics · doi:10.1038/s41576-019-0209-0 · Cited by 396
Molecular mechanisms driving transcriptional stress responses
Vihervaara, A., Duarte, F. M., & Lis, J. T. (2018) · Nature Reviews Genetics · doi:10.1038/s41576-018-0001-6 · Cited by 283
Self-citationNascent RNA analyses: tracking transcription and its regulation
Wissink, E. M., Vihervaara, A., Tippens, N. D., & Lis, J. T. (2019) · Nature Reviews Genetics · doi:10.1038/s41576-019-0159-6 · Cited by 258
Self-citationRoles of heat shock factor 1 beyond the heat shock response
Barna, J., Csermely, P., & Vellai, T. (2018) · Cellular and Molecular Life Sciences · doi:10.1007/s00018-018-2836-6 · Cited by 214
Mechanisms tailoring the expression of heat shock proteins to proteostasis challenges
Boopathy, L. R. A., Jacob‐Tomas, S., Alecki, C., & Vera, M. (2022) · Journal of Biological Chemistry · doi:10.1016/j.jbc.2022.101796 · Cited by 183
Metadata
- Authors
- Vihervaara, A., Mahat, D. B., Guertin, M. J., Chu, T., Danko, C. G., Lis, J. T., & Sistonen, L.
- Affiliations
- Åbo Akademi University (FI)
- Cornell University (US)
- University of Virginia (US)
- Corresponding author
- Lis, John T.
- Sistonen, Lea
- ORCID
- Venue
- Nature Communications
- Published
- 2017-08-15
- Volume
- 8
- Issue
- 1
- Pages
- 255-255
- ISSN
- 2041-1723 (ISSN-L)
- PMC
- PMC5557961
- OpenAlex
- W2743018412
- Cited by
- 164
- References
- 81
- Citations by year
- 2026: 13 · 2025: 19 · 2024: 9 · 2023: 14 · 2022: 24 · 2021: 29 · 2020: 25 · 2019: 15 · 2018: 14 · 2017: 1
- FWCI
- 6.15
- Type
- journal article
- Language
- en
- Open access
- gold
- doi.org
- Locations
- Nature Communications (publishedVersion, cc-by)
- PubMed Central (publishedVersion, cc-by)
- PubMed (publishedVersion)
- RePEc: Research Papers in Economics (submittedVersion)
- DOAJ (DOAJ: Directory of Open Access Journals) (submittedVersion, cc-by-sa)
- Åbo Akademi University Research Portal (submittedVersion)
- Funders
- Magnus Ehrnroothin Säätiö
- Sigrid Juséliuksen Säätiö
- Åbo Akademi
- National Institutes of Health (GM25232)
- National Institute of General Medical Sciences (R01GM025232)
- Topics
- Life Sciences › Biochemistry, Genetics and Molecular Biology › Molecular Biology › Genomics and Chromatin Dynamics
- Life Sciences › Biochemistry, Genetics and Molecular Biology › Molecular Biology › Chromatin Remodeling and Cancer
- Life Sciences › Biochemistry, Genetics and Molecular Biology › Molecular Biology › Heat shock proteins research
- Keywords
- divergent transcription, promoter architecture, enhancer architecture, histone H4 acetylation, RNA polymerase pausing, heat shock factor 1, CTCF, chromatin organization, transcriptional reprogramming, heat shock response
- MeSH terms
- Acetylation, Cell Line, Enhancer Elements, Genetic, Gene Expression Regulation, Heat-Shock Proteins, Humans, Promoter Regions, Genetic, Stress, Physiological, Transcription Factors, Transcription, Genetic, Heat-Shock Response
About these checks
Registry, retraction, Cites and statistics results are computed, not judged, with one exception: a printed reference that no index lists is read once by a model before it counts as a citation error. Claims are extracted by a model and kept only when their quote appears verbatim in the text; each cited source is then checked, with a model’s help, for whether it says what the claim relies on. Those verdicts can be wrong — read the claim’s quote and the cited source before relying on one.
Statistics and arithmetic are recomputed, not judged.
Confidence bands are shown only for fields calibrated on our annotated test set. None is calibrated yet, so no band is shown.
What counts as a claim ›How we measure confidence ›How we check this ›
Are you an author, or do you see a problem with this page? Request a review
