

The DOI matches its Crossref record; 41 of the 41 references it cites were found in a registry or an index.
High throughput ANI analysis of 90K prokaryotic genomes reveals clear species boundaries
Open accessPublished version of a preprint
Abstract
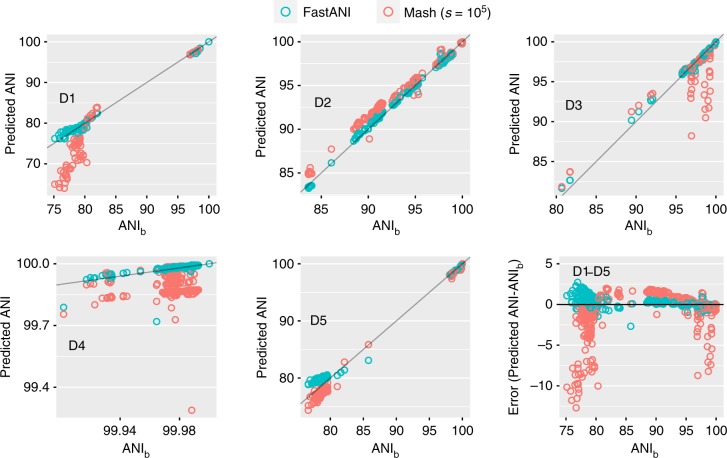
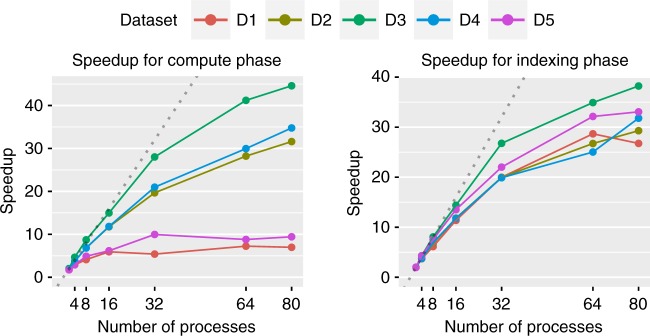
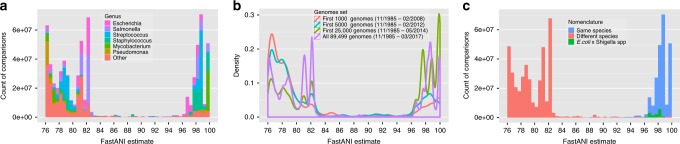
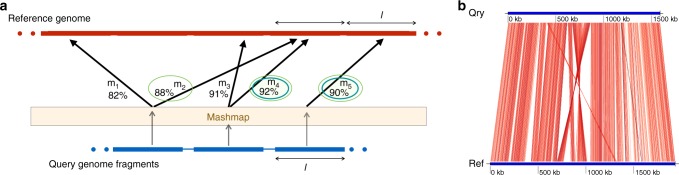
A fundamental question in microbiology is whether there is continuum of genetic diversity among genomes, or clear species boundaries prevail instead. Whole-genome similarity metrics such as Average Nucleotide Identity (ANI) help address this question by facilitating high resolution taxonomic analysis of thousands of genomes from diverse phylogenetic lineages. To scale to available genomes and beyond, we present FastANI, a new method to estimate ANI using alignment-free approximate sequence mapping. FastANI is accurate for both finished and draft genomes, and is up to three orders of magnitude faster compared to alignment-based approaches. We leverage FastANI to compute pairwise ANI values among all prokaryotic genomes available in the NCBI database. Our results reveal clear genetic discontinuity, with 99.8% of the total 8 billion genome pairs analyzed conforming to >95% intra-species and <83% inter-species ANI values. This discontinuity is manifested with or without the most frequently sequenced species, and is robust to historic additions in the genome databases.
Overview
The claims and statistics of this paper haven’t been checked yet.
Run the check — free, no account needed. It reads the open-access text and checks the sources it cites.
Integrity signals
Registry
Cites
Statistics
Figures
Verification
Claims the paper makes
The claims and statistics of this paper haven’t been checked yet.
Run the check — free, no account needed. It reads the open-access text and checks the sources it cites.
Claims other papers make about this one
Each is checked against this paper’s own text: does it say what the citing paper says it does?
The cited source says what the claim attributes to it.
In the citing paper
“FastANI (v1.3.1) (https://github.com/ParBLiSS/FastANI.) was used to calculate the average nucleotide identity between the isolated strains and the original Lp082,47 ensuring isolates were evolved from Lp082”
From Gut microbiota drives structural variation of exogenous probiotics to enhance colonization (2025) · cites this paper as [47]
Self-check
Percentages, sums and reported differences re-computed from the paper’s own numbers.
The self-check needs the paper’s full text.
Citations
Cites
Gapped BLAST and PSI-BLAST: a new generation of protein database search programs
Altschul, S. (1997) · Nucleic Acids Research · doi:10.1093/nar/25.17.3389 · Cited by 73,302
Search and clustering orders of magnitude faster than BLAST
Edgar, R. C. (2010) · Bioinformatics · doi:10.1093/bioinformatics/btq461 · Cited by 21,098
Fast and sensitive protein alignment using DIAMOND
Buchfink, B., Xie, C., & Huson, D. H. (2015) · Nature Methods · doi:10.1038/nmeth.3176 · Cited by 14,201
<tt>BLAT</tt> —The <tt>BLAST</tt> -Like Alignment Tool
Kent, W. J. (2002) · Genome Research · doi:10.1101/gr.229202 · Cited by 8,480
Canu: scalable and accurate long-read assembly via adaptive k -mer weighting and repeat separationPreprint
Koren, S., Walenz, B. P., Berlin, K., Miller, J. R., Bergman, N. H., & Phillippy, A. M. (2017) · Genome Research · doi:10.1101/gr.215087.116 · Cited by 7,260
Self-citationShifting the genomic gold standard for the prokaryotic species definition
Richter, M., & Rossello-Mora, R. A. (2009) · Proceedings of the National Academy of Sciences · doi:10.1073/pnas.0906412106 · Cited by 6,343
Versatile and open software for comparing large genomes
Kurtz, S., Phillippy, A., Delcher, A. L., Smoot, M., Shumway, M., Antonescu, C., & Salzberg, S. L. (2004) · Genome Biology · doi:10.1186/gb-2004-5-2-r12 · Cited by 5,254
Self-citationMauve: Multiple alignment of conserved genomic sequence with rearrangements
Darling, A. C. E., Mau, B., Blattner, F. R., & Perna, N. T. (2004) · Genome Research · doi:10.1101/gr.2289704 · Cited by 4,949
DNA–DNA hybridization values and their relationship to whole-genome sequence similarities
Goris, J., Konstantinidis, K. T., Klappenbach, J. A., Coenye, T., Vandamme, P. A. R., & Tiedje, J. M. (2007) · INTERNATIONAL JOURNAL OF SYSTEMATIC AND EVOLUTIONARY MICROBIOLOGY · doi:10.1099/ijs.0.64483-0 · Cited by 4,733 · cited 2×
“Nevertheless, it closely reflects the traditional microbiological concept of DNA-DNA hybridization relatedness for defining species (3), as it takes into account the fluid nature of the bacterial gene pool and hence implicitly considers shared function.”
BackgroundMethodSelf-citationA large-scale evaluation of algorithms to calculate average nucleotide identity
Yoon, S.-H., Ha, S. M., Lim, J., Kwon, S., & Chun, J. (2017) · Antonie van Leeuwenhoek · doi:10.1007/s10482-017-0844-4 · Cited by 3,614
Research works printed but not linked: 1
- Staley, J. The phylogenomic species concept. Microbiol. Today 36, 80–83 (2009).
Cited by
Sorted by citations
GTDB-Tk: a toolkit to classify genomes with the Genome Taxonomy Database
Chaumeil, P.-A., Mussig, A. J., Hugenholtz, P., & Parks, D. H. (2019) · Bioinformatics · doi:10.1093/bioinformatics/btz848 · Cited by 5,337
Zheng, J., Wittouck, S., Salvetti, E., Franz, C. M. A. P., Harris, H. M. B., Mattarelli, P., O’Toole, P. W., Pot, B., Vandamme, P., Walter, J., et al. (2020) · International Journal of Systematic and Evolutionary Microbiology · doi:10.1099/ijsem.0.004107 · Cited by 3,313
“Although proposals have been made to apply a methodfree species concept that is based on cohesive evolutionary forces [6], an ANI value of 95 % (94–96 %) has been almost consistently used in recent years to describe new bacterial species [7, 8] and was suggested to reflect the biological significance of the prokaryoti…”
BackgroundParks, D. H., Chuvochina, M., Rinke, C., Mussig, A. J., Chaumeil, P.-A., & Hugenholtz, P. (2022) · Nucleic Acids Research · doi:10.1093/nar/gkab776 · Cited by 2,402
Proksee: in-depth characterization and visualization of bacterial genomes
Grant, J. R., Enns, E., Marinier, E., Mandal, A., Herman, E. K., Chen, C., Graham, M., Domselaar, G. V., & Stothard, P. (2023) · Nucleic Acids Research · doi:10.1093/nar/gkad326 · Cited by 1,929
MitoHiFi: a python pipeline for mitochondrial genome assembly from PacBio high fidelity reads
Uliano‐Silva, M., Ferreira, J. G. R. N., Krasheninnikova, K., Blaxter, M., Mieszkowska, N., Hall, N., Holland, P. W. H., Durbin, R. M., Richards, T. A., Kersey, P. J., et al. (2023) · BMC Bioinformatics · doi:10.1186/s12859-023-05385-y · Cited by 1,939
Pasolli, E., Asnicar, F., Manara, S., Zolfo, M., Karcher, N., Armanini, F., Beghini, F., Manghi, P., Tett, A., Ghensi, P., et al. (2019) · Cell · doi:10.1016/j.cell.2019.01.001 · Cited by 1,591
“2 Cell 176, 1–14, January 24, 2019 tent with the definition of known species (see STAR Methods) and with other reports (Jain et al., 2018).”
A complete domain-to-species taxonomy for Bacteria and Archaea
Parks, D. H., Chuvochina, M. S., Chaumeil, P.-A., Rinke, C., Mussig, A. J., & Hugenholtz, P. (2020) · Nature Biotechnology · doi:10.1038/s41587-020-0501-8 · Cited by 1,542
Blanco-Míguez, A., Beghini, F., Cumbo, F., McIver, L. J., Thompson, K. N., Zolfo, M., Manghi, P., Dubois, L., Huang, K. D., Thomas, A. M., et al. (2023) · Nature Biotechnology · doi:10.1038/s41587-023-01688-w · Cited by 1,442
“Briefly, an SGB 42 delineates a microbial species purely based on the clustering of whole-genome genetic distances at 5% genomic identity 47 and a taxonomic label can then be assigned to the SGB based on the presence (or not) of characterized genomes from isolate sequencing.”
BackgroundA unified catalog of 204,938 reference genomes from the human gut microbiome
Almeida, A., Nayfach, S., Boland, M., Strozzi, F., Beracochea, M., Shi, Z. J., Pollard, K. S., Sakharova, E., Parks, D. H., Hugenholtz, P., et al. (2021) · Nature Biotechnology · doi:10.1038/s41587-020-0603-3 · Cited by 1,367
A new genomic blueprint of the human gut microbiota
Almeida, A., Mitchell, A. L., Boland, M., Forster, S. C., Gloor, G. B., Tarkowska, A., Lawley, T. D., & Finn, R. D. (2019) · Nature · doi:10.1038/s41586-019-0965-1 · Cited by 1,314
Stunted microbiota and opportunistic pathogen colonization in caesarean-section birth
Shao, Y., Forster, S. C., Tsaliki, E., Vervier, K., Strang, A., Simpson, N., Kumar, N., Stares, M. D., Rodger, A., Brocklehurst, P., et al. (2019) · Nature · doi:10.1038/s41586-019-1560-1 · Cited by 1,088
“To illustrate the population structure of the closely related Enterobacter and Klebsiella strain isolates, FastANI(Jain et al. 2017) was used to estimate the pairwise average nucleotide identity distance between all public and BBS genome assemblies, which was then used as an input to generate a…”
metaFlye: scalable long-read metagenome assembly using repeat graphs
Kolmogorov, M., Bickhart, D. M., Behsaz, B., Gurevich, A. A., Rayko, M., Shin, S. B., Kuhn, K. L., Yuan, J., Polevikov, E., Smith, T. P. L., et al. (2020) · Nature Methods · doi:10.1038/s41592-020-00971-x · Cited by 1,082
Asnicar, F., Thomas, A. M., Beghini, F., Mengoni, C., Manara, S., Manghi, P., Zhu, Q., Bolzan, M., Cumbo, F., May, U., et al. (2020) · Nature Communications · doi:10.1038/s41467-020-16366-7 · Cited by 869
Prevotella Diversity, Niches and Interactions with the Human Host
Tett, A., Pasolli, E., Masetti, G., Ercolini, D., & Segata, N. (2021) · Nature Reviews Microbiology · doi:10.1038/s41579-021-00559-y · Cited by 748
Johansson, M. H. K., Bortolaia, V., Tansirichaiya, S., Aarestrup, F. M., Roberts, A. P., & Petersen, T. N. (2021) · Journal of Antimicrobial Chemotherapy · doi:10.1093/jac/dkaa390 · Cited by 725
The population genetics of pathogenic Escherichia coli
Denamur, É., Clermont, O., Bonacorsi, S., & Gordon, D. M. (2020) · Nature Reviews Microbiology · doi:10.1038/s41579-020-0416-x · Cited by 731
Improved metagenome binning and assembly using deep variational autoencoders
Nissen, J. N., Johansen, J., Allesøe, R. L., Sønderby, C. K., Armenteros, J. J. A., Grønbech, C. H., Jensen, L. J., Nielsen, H. B., Petersen, T. N., Winther, O., et al. (2021) · Nature Biotechnology · doi:10.1038/s41587-020-00777-4 · Cited by 663
Update on the proposed minimal standards for the use of genome data for the taxonomy of prokaryotes
Riesco, R., & Trujillo, M. E. (2024) · INTERNATIONAL JOURNAL OF SYSTEMATIC AND EVOLUTIONARY MICROBIOLOGY · doi:10.1099/ijsem.0.006300 · Cited by 618
CoverM: read alignment statistics for metagenomics
Aroney, S. T. N., Newell, R. J. P., Nissen, J. N., Camargo, A. P., Tyson, G. W., & Woodcroft, B. J. (2025) · Bioinformatics · doi:10.1093/bioinformatics/btaf147 · Cited by 548
“Since aligning against multiple near-identical reference genomes can distort read alignments, CoverM uses Galah (Aroney et al. 2024) to dereplicate input genomes, interpreting ANI calculated by skani (Shaw and Yu 2023), FastANI (Jain et al. 2018), or Dashing (Baker and Langmead 2019).”
Tett, A., Huang, K. D., Asnicar, F., Fehlner-Peach, H., Pasolli, E., Karcher, N., Armanini, F., Manghi, P., Bonham, K., Zolfo, M., et al. (2019) · Cell Host & Microbe · doi:10.1016/j.chom.2019.08.018 · Cited by 476
“Studies have sought to place a threshold at which ANI values between genomes equate to the delineation of strains into species, with a broad consensus being values above 5%–6% distance (Goris et al., 2007; Jain et al., 2018; Konstantinidis and Tiedje, 2005; Pasolli et al., 2019).”
BackgroundSereika, M., Kirkegaard, R. H., Karst, S. M., Michaelsen, T. Y., Sørensen, E. A., Wollenberg, R. D., & Albertsen, M. (2022) · Nature Methods · doi:10.1038/s41592-022-01539-7 · Cited by 478
Roux, S., Camargo, A. P., Coutinho, F. H., Dabdoub, S. M., Dutilh, B. E., Nayfach, S., & Tritt, A. (2023) · PLoS Biology · doi:10.1371/journal.pbio.3002083 · Cited by 493
“32 [57].”
Diversity within Species: Interpreting Strains in Microbiomes
Van Rossum, T., Ferretti, P., Maistrenko, O. M., & Bork, P. (2020) · Nature Reviews Microbiology · doi:10.1038/s41579-020-0368-1 · Cited by 441
Pathways for horizontal gene transfer in bacteria revealed by a global map of their plasmids
Redondo-Salvo, S., Fernández-López, R., Ruiz, R., Vielva, L., de Toro, M., Rocha, E. P. C., Garcillán-Barcia, M. P., & de la Cruz, F. (2020) · Nature Communications · doi:10.1038/s41467-020-17278-2 · Cited by 438
Discovery of antimicrobial peptides in the global microbiome with machine learning
Júnior, C. D. S., Torres, M. D. T., Duan, Y., del Río, Á. R., Schmidt, T., Chong, H., Fullam, A., Kuhn, M., Zhu, C., Houseman, A., et al. (2024) · Cell · doi:10.1016/j.cell.2024.05.013 · Cited by 460
EzBioCloud: a genome-driven database and platform for microbiome identification and discovery
Chalita, M., Kim, Y. O., Park, S., Oh, H., Cho, J. H., Moon, J., Baek, N., Moon, C., Lee, K., Yang, J.-W., et al. (2024) · INTERNATIONAL JOURNAL OF SYSTEMATIC AND EVOLUTIONARY MICROBIOLOGY · doi:10.1099/ijsem.0.006421 · Cited by 440
“In this context, average nucleotide identity (ANI) and OrthoANI [3] have been instrumental in defining species boundaries, but their effectiveness diminishes for novel branches of the bacterial tree, where no close comparative sequences exist [4].”
Biosynthetic potential of the global ocean microbiome
Paoli, L., Ruscheweyh, H., Forneris, C. C., Hubrich, F., Kautsar, S. A., Bhushan, A., Lotti, A., Clayssen, Q., Salazar, G., Milanese, A., et al. (2022) · Nature · doi:10.1038/s41586-022-04862-3 · Cited by 394
Large-scale genome-wide analysis links lactic acid bacteria from food with the gut microbiome
Pasolli, E., De Filippis, F., Mauriello, I. E., Cumbo, F., Walsh, A. M., Leech, J., Cotter, P. D., Segata, N., & Ercolini, D. (2020) · Nature Communications · doi:10.1038/s41467-020-16438-8 · Cited by 367
Giant virus diversity and host interactions through global metagenomics
Schulz, F., Roux, S., Páez-Espino, D., Jungbluth, S. P., Walsh, D. A., Denef, V. J., McMahon, K. D., Konstantinidis, K. T., Eloe‐Fadrosh, E. A., Kyrpides, N. C., et al. (2020) · Nature · doi:10.1038/s41586-020-1957-x · Cited by 361
Self-citationA Genus Definition for Bacteria and Archaea Based on a Standard Genome Relatedness Index
Barco, R. A., Garrity, G. M., Scott, J. J., Amend, J. P., Nealson, K. H., & Emerson, D. (2020) · mBio · doi:10.1128/mbio.02475-19 · Cited by 353
Che, Y., Yu, Y., Xu, X., Břinda, K., Polz, M. F., Hanage, W. P., & Zhang, T. (2021) · Proceedings of the National Academy of Sciences · doi:10.1073/pnas.2008731118 · Cited by 363
“To avoid overcounting the number of transfers that are potentially vertically related, all genomic pairs sharing > 97% ANI were deduplicated using FastANI (80).”
MethodSingleton, C. M., Petriglieri, F., Kristensen, J. M., Kirkegaard, R. H., Michaelsen, T. Y., Andersen, M. H., Kondrotaite, Z., Karst, S. M., Dueholm, M. S., Nielsen, P. H., et al. (2021) · Nature Communications · doi:10.1038/s41467-021-22203-2 · Cited by 339
BACPHLIP: predicting bacteriophage lifestyle from conserved protein domains
Hockenberry, A. J., & Wilke, C. O. (2021) · PeerJ · doi:10.7717/peerj.11396 · Cited by 340
“To ascertain whether hidden phylo- 61 genetic structure in our dataset was inflating test set accuracies, we conservatively clustered 62 all labeled phages (training and testing sets) using fastANI (27) and assessed BACPHLIP 63 accuracy separately on test data for which there were (and were not) genomes in the train-…”
Reyes, J., Komarow, L., Chen, L., Ge, L., Hanson, B., Cober, E., Herc, E. S., Alenazi, T. H., Kaye, K. S., Garcia‐Diaz, J., et al. (2023) · The Lancet Microbe · doi:10.1016/s2666-5247(22)00329-9 · Cited by 325
Xie, F., Jin, W., Si, H., Yuan, Y., Tao, Y., Liu, J., Wang, X., Yang, C., Li, Q., Yan, X., et al. (2021) · Microbiome · doi:10.1186/s40168-021-01078-x · Cited by 333
Cholesterol Metabolism by Uncultured Human Gut Bacteria Influences Host Cholesterol Level
Kenny, D. J., Plichta, D. R., Shungin, D., Koppel, N., Hall, A. B., Fu, B., Vasan, R. S., Shaw, S. Y., Vlamakis, H. C., Balskus, E. P., et al. (2020) · Cell Host & Microbe · doi:10.1016/j.chom.2020.05.013 · Cited by 319
“At least one high-quality draft genome for most of the IsmAencoding MSPs was generated (completeness > 90%, contamination < 5%; Parks et al., 2015), and genome-wide similarity comparison confirmed that these MSPs are different species with a maximum average nucleotide identity of 88% (Figure S5E; Table S4) (Jain et al…”
BackgroundHigh-throughput, single-microbe genomics with strain resolution, applied to a human gut microbiome
Zheng, W., Zhao, S., Yin, Y., Zhang, H., Needham, D. M., Evans, E. D., Dai, C. L., Lu, P. J., Alm, E. J., & Weitz, D. A. (2022) · Science · doi:10.1126/science.abm1483 · Cited by 283
High-throughput microbial culturomics using automation and machine learning
Huang, Y., Sheth, R. U., Zhao, S., Cohen, L. A., Dabaghi, K., Moody, T., Sun, Y., Ricaurte, D., Richardson, M., Velez-Cortes, F., et al. (2023) · Nature Biotechnology · doi:10.1038/s41587-023-01674-2 · Cited by 283
Colbert, L. E., Alam, M. B. E., Wang, R., Karpinets, T. V., Lo, D., Lynn, E. J., Harris, T. A., Elnaggar, J. H., Yoshida-Court, K., Tomasic, K., et al. (2023) · Cancer Cell · doi:10.1016/j.ccell.2023.09.012 · Cited by 286
Genomic diversity landscape of the honey bee gut microbiota
Ellegaard, K., & Engel, P. (2019) · Nature Communications · doi:10.1038/s41467-019-08303-0 · Cited by 283
Machine learning for microbiologists
Asnicar, F., Thomas, A. M., Passerini, A., Waldron, L., & Segata, N. (2023) · Nature Reviews Microbiology · doi:10.1038/s41579-023-00984-1 · Cited by 284
“Cluster similarity thresholds for these tasks are typically set to 97% identity among 16S rRNA genes 56,57 to define operational taxonomic units and 95% whole-genome identity among strains to define species 55,58 .”
Li, C., Stražar, M., Mohamed, A. M., Ávila-Pacheco, J., Walker, R. L., Lebar, T., Zhao, S., Lockart, J., Dame, A., Thurimella, K., et al. (2024) · Cell · doi:10.1016/j.cell.2024.03.014 · Cited by 269
Bactopia: a Flexible Pipeline for Complete Analysis of Bacterial Genomes
Petit, R. A., & Read, T. D. (2020) · mSystems · doi:10.1128/msystems.00190-20 · Cited by 251
“For this project we used BaTs to a) summarize the results of running multiple 88 bacterial genomes through BaAP, b) extract 16S sequences and create a phylogeny, c) assign 89 taxonomic classifications with the Genome Taxonomy Database (4), d) subset Lactobacillus 90 crispatus samples by average nucleotide identity (AN…”
BackgroundMethodInfluentialReconstruction of ancient microbial genomes from the human gut
Wibowo, M. C., Yang, Z., Borry, M., Hübner, A., Huang, K. D., Tierney, B. T., Zimmerman, S. E., Barajas-Olmos, F. M., Contreras-Cubas, C., Garcia‐Ortíz, H., et al. (2021) · Nature · doi:10.1038/s41586-021-03532-0 · Cited by 251
Fast and robust metagenomic sequence comparison through sparse chaining with skani
Shaw, J., & Yu, Y. W. (2023) · Nature Methods · doi:10.1038/s41592-023-02018-3 · Cited by 248
“This means that a minimizer ANI estimator cannot use very sparse seeds, since the fraction of selected seeds is”
BackgroundMethodGenome mining of biosynthetic and chemotherapeutic gene clusters in Streptomyces bacteria
Belknap, K. C., Park, C. J., Barth, B. M., & Andam, C. P. (2020) · Scientific Reports · doi:10.1038/s41598-020-58904-9 · Cited by 259
MitoHiFi: a python pipeline for mitochondrial genome assembly from PacBio High Fidelity readsPreprint
Uliano‐Silva, M., Ferreira, J. G. R. N., Krasheninnikova, K., Formenti, G., Abueg, L. A. L., Torrance, J., Myers, E. W., Durbin, R. M., Blaxter, M., & McCarthy, S. (2022) · bioRxiv (Cold Spring Harbor Laboratory) · doi:10.1101/2022.12.23.521667 · Cited by 242
Durrant, M. G., Li, M. M., Siranosian, B. A., Montgomery, S. B., & Bhatt, A. S. (2019) · Cell Host & Microbe · doi:10.1016/j.chom.2019.10.022 · Cited by 239
Genomics and pathotypes of the many faces of Escherichia coli
Geurtsen, J., de Been, M., Weerdenburg, E., Zomer, A., McNally, A., & POOLMAN, J. T. (2022) · FEMS Microbiology Reviews · doi:10.1093/femsre/fuac031 · Cited by 270
“Based purely on ANI, E. coli and Shigella combined represent a singular typical species with a whole-genome average nucleotide identity of up to 98% (Jain et al. 2018).”
BackgroundDiversity and functional landscapes in the microbiota of animals in the wild
Levin, D., Raab, N., Pinto, Y., Rothschild, D., Zanir, G., Godneva, A., Mellul, N., Futorian, D., Gal, D., Leviatan, S., et al. (2021) · Science · doi:10.1126/science.abb5352 · Cited by 234
“The maximum ANI values were used for novelty categorization as follows: rSGBs with maximum ANI values above 95% were defined as known species, values below 83% as previously undescribed (novel) species, and values in between as intermediate.”
MethodInfluentialDrivers and determinants of strain dynamics following fecal microbiota transplantation
Schmidt, T. S. B., Li, S. S., Maistrenko, O. M., Akanni, W., Coelho, L. P., Dolai, S., Fullam, A., Glazek, A. M., Hercog, R., Herrema, H., et al. (2022) · Nature Medicine · doi:10.1038/s41591-022-01913-0 · Cited by 233
A collection of bacterial isolates from the pig intestine reveals functional and taxonomic diversity
Wylensek, D., Hitch, T. C. A., Riedel, T., Afrizal, A., Kumar, N., Wortmann, E., Liu, T., Devendran, S., Lesker, T. R., Hernández, S. B., et al. (2020) · Nature Communications · doi:10.1038/s41467-020-19929-w · Cited by 238
BiG-SLiCE: A highly scalable tool maps the diversity of 1.2 million biosynthetic gene clusters
Kautsar, S. A., van der Hooft, J. J. J., de Ridder, D., & Medema, M. H. (2021) · GigaScience · doi:10.1093/gigascience/giaa154 · Cited by 235
Charting the Complexity of the Marine Microbiome through Single-Cell Genomics
Pachiadaki, M., Brown, J. M., Brown, J., Bezuidt, O. K. I., Berube, P. M., Biller, S. J., Poulton, N. J., Burkart, M. D., Clair, J. J. L., Chisholm, S. W., et al. (2019) · Cell · doi:10.1016/j.cell.2019.11.017 · Cited by 222
“Prokka was run a second time with a custom protein annotation database built from compiling Swiss-Prot (Bateman et al., 2017) entries for Archaea and Bacteria.”
BackgroundMethodInfluentialHost preference and invasiveness of commensal bacteria in the Lotus and Arabidopsis root microbiota
Wippel, K., Tao, K., Niu, Y., Zgadzaj, R., Kiel, N., Guan, R., Dahms, E., Zhang, P., Jensen, D. B., Logemann, E., et al. (2021) · Nature Microbiology · doi:10.1038/s41564-021-00941-9 · Cited by 228
Extensive microbial diversity within the chicken gut microbiome revealed by metagenomics and culture
Gilroy, R., Ravi, A., Getino, M., Pursley, I., Horton, D. L., Alikhan, N.-F., Baker, D., Gharbi, K., Hall, N., Watson, M., et al. (2021) · PeerJ · doi:10.7717/peerj.10941 · Cited by 236
Deep sea sediments associated with cold seeps are a subsurface reservoir of viral diversity
Li, Z., Pan, D., Wei, G., Pi, W.-L., Zhang, C., Wang, J., Peng, Y., Zhang, L., Wang, Y., Hubert, C. R. J., et al. (2021) · The ISME Journal · doi:10.1038/s41396-021-00932-y · Cited by 218
Consistent Metagenome-Derived Metrics Verify and Delineate Bacterial Species Boundaries
Olm, M. R., Crits‐Christoph, A., Diamond, S., Lavy, A., Carnevali, P. B. M., & Banfield, J. F. (2020) · mSystems · doi:10.1128/msystems.00731-19 · Cited by 201
“Discrete sequence populations have been identified in large public genome databases (8, 9), most recently in a study using 90,000 bacterial genomes available in the public NCBI Genome database as of March 2017 (10).”
InfluentialLiang, J., Mao, G., Yin, X., Ma, L., Liu, L., Bai, Y., Zhang, T., & Qu, J. (2019) · Water Research · doi:10.1016/j.watres.2019.115160 · Cited by 218
Towards the biogeography of prokaryotic genes
Coelho, L. P., Alves, R., del Río, Á. R., Myers, P. N., Cantalapiedra, C. P., Giner‐Lamia, J., Schmidt, T., Mende, D. R., Orakov, A. N., Letunić, I., et al. (2021) · Nature · doi:10.1038/s41586-021-04233-4 · Cited by 209
Robust variation in infant gut microbiome assembly across a spectrum of lifestyles
Olm, M. R., Dahan, D., Carter, M. M., Merrill, B. D., Yu, F. B., Jain, S., Meng, X., Tripathi, S. M., Wastyk, H. C., Neff, N. F., et al. (2022) · Science · doi:10.1126/science.abj2972 · Cited by 213
SeqCode: a nomenclatural code for prokaryotes described from sequence data
Hedlund, B. P., Chuvochina, M. S., Hugenholtz, P., Konstantinidis, K. T., Murray, A. E., Palmer, M., Parks, D. H., Probst, A. J., Reysenbach, A., Rodriguez‐R, L. M., et al. (2022) · Nature Microbiology · doi:10.1038/s41564-022-01214-9 · Cited by 213
Self-citationPinnell, L. J., & Turner, J. W. (2019) · Frontiers in Microbiology · doi:10.3389/fmicb.2019.01252 · Cited by 221
“…all publicly available Desulfovibrionaceae, Desulfobacteraceae, and Desulfobulbaceae genomes in GenBank (n = 122, 107, and 65, respectively) by average nucleotide identity (ANI) using fastANI (Jain et al., 2018), using >95% ANI as the intraspecies threshold and 83% as an interspecies threshold.”
MethodDurrant, M. G., Fanton, A., Tycko, J., Hinks, M. M., Chandrasekaran, S. S., Perry, N. T., Schaepe, J. M., Du, P. P., Lotfy, P., Bassik, M. C., et al. (2022) · Nature Biotechnology · doi:10.1038/s41587-022-01494-w · Cited by 212
An ANI gap within bacterial species that advances the definitions of intra-species units
Rodriguez‐R, L. M., Conrad, R. E., Viver, T., Feistel, D. J., Lindner, B. G., Venter, S. N., Orellana, L. H., Amann, R., Rossello-Mora, R. A., & Konstantinidis, K. T. (2023) · mBio · doi:10.1128/mbio.02696-23 · Cited by 226
“In summary, it appears that a natural gap in ANI values can be used to define prokaryotic species and has been largely consistent with how species are recognized (21).”
BackgroundMethodResultInfluentialSelf-citationLeech, J., Cabrera-Rubio, R., Walsh, A. M., Macori, G., Walsh, C. J., Barton, W., Finnegan, L., Crispie, F., O’Sullivan, O., Claesson, M. J., et al. (2020) · mSystems · doi:10.1128/msystems.00522-20 · Cited by 200
Minimal standards for the description of new genera and species of rhizobia and agrobacteria
de Lajudie, P., Andrews, M., Ardley, J. K., Eardly, B. D., Jumas‐Bilak, E., Kuzmanović, N., Lassalle, F., Lindström, K., Mhamdi, R., Martínez‐Romero, E., et al. (2019) · INTERNATIONAL JOURNAL OF SYSTEMATIC AND EVOLUTIONARY MICROBIOLOGY · doi:10.1099/ijsem.0.003426 · Cited by 209
Prokaryotic taxonomy and nomenclature in the age of big sequence data
Hugenholtz, P., Chuvochina, M. S., Oren, A., Parks, D. H., & Soo, R. M. (2021) · The ISME Journal · doi:10.1038/s41396-021-00941-x · Cited by 225
Tang, C., Kong, X., Ahmed, S. A., Thakur, R., Chowdhary, A., Nenoff, P., Uhrlaß, S., Verma, S. B., Meis, J. F. G. M., Kandemir, H., et al. (2021) · Mycopathologia · doi:10.1007/s11046-021-00544-2 · Cited by 207
Phage–host coevolution in natural populations
Piel, D., Bruto, M., Labreuche, Y., Blanquart, F., Goudenège, D., Barcia‐Cruz, R., Chenivesse, S., Panse, S. L., James, A., Dubert, J., et al. (2022) · Nature Microbiology · doi:10.1038/s41564-022-01157-1 · Cited by 219
Kashaf, S. S., Proctor, D. M., Deming, C., Saary, P., Hölzer, M., Program, N. C. S., Mullikin, J. C., Thomas, J., Young, A., Bouffard, G., et al. (2021) · Nature Microbiology · doi:10.1038/s41564-021-01011-w · Cited by 203
A Reverse Ecology Approach Based on a Biological Definition of Microbial Populations
Arevalo, P., VanInsberghe, D., Elsherbini, J., Gore, J., & Polz, M. F. (2019) · Cell · doi:10.1016/j.cell.2019.06.033 · Cited by 201
“We observe that both the ecologically differentiated species and populations identified by PopCOGenT are generally more closely related than measured by conventional marker gene-based analyses or are predicted by current species definitions such as based on average nucleotide identity (ANI) (Jain et al., 2018; Mende e…”
Klebsiella oxytoca Complex: Update on Taxonomy, Antimicrobial Resistance, and Virulence
Yang, J., Long, H., Hu, Y., Feng, Y., McNally, A., & Zong, Z. (2021) · Clinical Microbiology Reviews · doi:10.1128/cmr.00006-21 · Cited by 208
“The corresponding genome sequences of strains harboring blaOXY-10, blaOXY-11, and blaOXY-12 were examined for precise species identification as described previously (23, 24).”
MethodBovio-Winkler, P., Guerrero, L. D., Erijman, L., Oyarzúa, P., Suárez‐Ojeda, M. E., Cabezas, A., & Etchebehere, C. (2023) · BMC Microbiology · doi:10.1186/s12866-023-02765-5 · Cited by 207
“The Average Nucleotide Identities (ANI) and the Average Amino Acid Identity (AAI) between MAGs and isolated species were determined using FastANI [55] and EzAAI [56].”
MethodCarroll, L. M., Wiedmann, M., & Kovač, J. (2020) · mBio · doi:10.1128/mbio.00034-20 · Cited by 200
“which two genomes belong to the same genomospecies if they share an ANI value above a set threshold (usually 95 ANI) (5).”
Metabolome-microbiome signatures in the fermented beverage, Kombucha
Villarreal-Soto, S. A., Bouajila, J., Pace, M., Leech, J., Cotter, P. D., Souchard, J.-P., Taillandier, P., & Beaufort, S. (2020) · International Journal of Food Microbiology · doi:10.1016/j.ijfoodmicro.2020.108778 · Cited by 196
Thousands of previously unknown phages discovered in whole-community human gut metagenomes
Benler, S., Yutin, N., Antipov, D., Rayko, M., Shmakov, S., Gussow, A. B., Pevzner, P. A., & Koonin, E. V. (2021) · Microbiome · doi:10.1186/s40168-021-01017-w · Cited by 194
Pan, S., Zhu, C., Zhao, X., & Coelho, L. P. (2022) · Nature Communications · doi:10.1038/s41467-022-29843-y · Cited by 203
Beresford-Jones, B. S., Forster, S. C., Stares, M. D., Notley, G., Viciani, E., Browne, H. P., Boehmler, D. J., Soderholm, A. T., Kumar, N., Vervier, K., et al. (2022) · Cell Host & Microbe · doi:10.1016/j.chom.2021.12.003 · Cited by 194
“6 alignment fraction were considered the same species (Jain et al., 2018; Nielsen et al., 2014; Varghese et al., 2015).”
BackgroundInfluentialHitch, T. C. A., Riedel, T., Oren, A., Overmann, J., Lawley, T. D., & Clavel, T. (2021) · ISME Communications · doi:10.1038/s43705-021-00017-z · Cited by 193
Nogal, A., Louca, P., Zhang, X., Wells, P. M., Steves, C. J., Spector, T. D., Falchi, M., Valdes, A. M., & Menni, C. (2021) · Frontiers in Microbiology · doi:10.3389/fmicb.2021.711359 · Cited by 194
“FastANI version 1.32 (Jain et al., 2018) was separately run on Lachnoclostridium and Coprococcus genomes to calculate the average nucleotide identity (ANI) between all pairs of sequences (Supplementary Tables 2, 3, 4).”
MethodInfluentialDeepMicrobes: taxonomic classification for metagenomics with deep learning
Liang, Q., Bible, P. W., Liu, Y., Zou, B., & Wei, L. (2020) · NAR Genomics and Bioinformatics · doi:10.1093/nargab/lqaa009 · Cited by 201
Verrucomicrobiota are specialist consumers of sulfated methyl pentoses during diatom blooms
Orellana, L. H., Francis, B., Ferraro, M., Hehemann, J., Fuchs, B. M., & Amann, R. (2021) · The ISME Journal · doi:10.1038/s41396-021-01105-7 · Cited by 199
A Comprehensive Analysis of the Global Human Gut Archaeome from a Thousand Genome Catalogue
Chibani, C. M., Mahnert, A., Borrel, G., Almeida, A., Werner, A., Brugère, J., Gribaldo, S., Finn, R. D., Schmitz, R. A., & Moissl‐Eichinger, C. (2020) · Nature Microbiology · doi:10.1038/s41564-021-01020-9 · Cited by 186
Metagenomics: An Effective Approach for Exploring Microbial Diversity and Functions
Nam, N. N., Do, H. D. K., Trinh, K. T. L., & Lee, N. Y. (2023) · Foods · doi:10.3390/foods12112140 · Cited by 213
Revision of the ‘Candidatus Phytoplasma’ species description guidelines
Bertaccini, A., Rosete, Y. A., Contaldo, N., Duduk, B., Fiore, N., Montano, H. G., Kube, M., Kuo, C., Martini, M., Oshima, K., et al. (2022) · INTERNATIONAL JOURNAL OF SYSTEMATIC AND EVOLUTIONARY MICROBIOLOGY · doi:10.1099/ijsem.0.005353 · Cited by 180
“Phytoplasma’ species will be based on a threshold of 95 % genome-wide ANI as suggested for bacteria [12, 13].”
Cotto, I., Dai, Z., Huo, L., Anderson, C. L., Vilardi, K. J., Ijaz, U. Z., Khunjar, W., Wilson, C., Clippeleir, H. D., Gilmore, K. R., et al. (2019) · Water Research · doi:10.1016/j.watres.2019.115268 · Cited by 167
Robertson, J. A., Bessonov, K., Schonfeld, J., & Nash, J. H. E. (2020) · Microbial Genomics · doi:10.1099/mgen.0.000435 · Cited by 169
Karcher, N., Nigro, E., Punčochář, M., Blanco-Míguez, A., Ciciani, M., Manghi, P., Zolfo, M., Cumbo, F., Manara, S., Golzato, D., et al. (2021) · Genome Biology · doi:10.1186/s13059-021-02427-7 · Cited by 159
Spasov, E., Tsuji, J. M., Hug, L. A., Doxey, A. C., Sauder, L. A., Parker, W. J., & Neufeld, J. D. (2020) · The ISME Journal · doi:10.1038/s41396-020-0650-2 · Cited by 166
Hidden diversity of soil giant viruses
Schulz, F., Alteio, L. V., Goudeau, D., Ryan, E. M., Yu, F. B., Malmstrom, R. R., Blanchard, J. L., & Woyke, T. (2018) · Nature Communications · doi:10.1038/s41467-018-07335-2 · Cited by 166
Zhu, C., Wu, L., Ning, D., Tian, R., Gao, S.-H., Zhang, B., Zhao, J., Zhang, Y., Xiao, N., Wang, Y., et al. (2025) · Nature Communications · doi:10.1038/s41467-025-59019-3 · Cited by 170
“Since our recovered MAGs were dereplicated at an average nucleotide identity of 95%, they represented species-level genome bins 89,90 .”
A fast adaptive algorithm for computing whole-genome homology maps
Jain, C., Koren, S., Dilthey, A., Phillippy, A. M., & Aluru, S. (2018) · Bioinformatics · doi:10.1093/bioinformatics/bty597 · Cited by 169
Self-citationProtective role of the Arabidopsis leaf microbiota against a bacterial pathogen
Vogel, C. M., Potthoff, D. B., Schäfer, M., Barandun, N., & Vorholt, J. A. (2021) · Nature Microbiology · doi:10.1038/s41564-021-00997-7 · Cited by 167
“Average nucleotide identities were calculated using FastANI 73 for members of the same family/order (Supplementary Table 13).”
InfluentialWu, X., Peng, J., Liu, P., Bei, Q., Rensing, C., Li, Y., Yuan, H., Liesack, W., Zhang, F. S., & Cui, Z. (2021) · The Science of The Total Environment · doi:10.1016/j.scitotenv.2021.147329 · Cited by 163
A gut microbial signature for combination immune checkpoint blockade across cancer types
Gunjur, A., Shao, Y., Rozday, T., Klein, O., Mu, A., Haak, B. W., Markman, B., Kee, D., Carlino, M. S., Underhill, C., et al. (2024) · Nature Medicine · doi:10.1038/s41591-024-02823-z · Cited by 165
“For the tree of Faecalibacterium genomes, pairwise whole-genome ANI distances were computed using FastANI 82 (many-to-many mode), which was converted into a distance matrix and then to a Newick-format tree using rapidNJ (v2.”
Dynamics of rice microbiomes reveal core vertically transmitted seed endophytes
Zhang, X., Ma, Y., Wang, X., Liao, K., He, S., Zhao, X., Guo, H., Zhao, D., & Wei, H. (2022) · Microbiome · doi:10.1186/s40168-022-01422-9 · Cited by 166
Insight into the function and evolution of the Wood–Ljungdahl pathway in Actinobacteria
Jiao, J., Fu, L., Hua, Z., Liu, L., Salam, N., Liu, P., Lv, A.-P., Wu, G., Xian, W.-D., Zhu, Q., et al. (2021) · The ISME Journal · doi:10.1038/s41396-021-00935-9 · Cited by 155
Newly Explored Faecalibacterium Diversity Is Connected to Age, Lifestyle, Geography, and Disease
De Filippis, F., Pasolli, E., & Ercolini, D. (2020) · Current Biology · doi:10.1016/j.cub.2020.09.063 · Cited by 161
“The twelve clades exhibited a median intra-clade distance ranging from 1.6% (clade L) to 3.6% (clade B), always below 5%, which is usually considered the cutoff for defining different species (Figure 1C; Data S2) [27].”
BackgroundInfluentialDelmont, T. O., Kiefl, E., Kilinc, O., Esen, Ö. C., Uysal, I., Rappé, M. S., Giovannoni, S. J., & Eren, A. M. (2019) · eLife · doi:10.7554/elife.46497 · Cited by 142
“…short reads (ANIr) recruited from environmental metagenomes using reference genomes, show an interesting discontinuity among sequence-discrete populations at sequence identity levels between 80% and 90–95% (Konstantinidis and DeLong, 2008; Caro-Quintero and Konstantinidis, 2012; Jain et al., 2018).”
Background
Metadata
- Authors
- Jain, C., Rodriguez-R, L. M., Phillippy, A. M., Konstantinidis, K. T., & Aluru, S.
- Affiliations
- National Institutes of Health (US)
- Georgia Institute of Technology (US)
- Corresponding author
- Konstantinidis, Konstantinos T.
- Aluru, Srinivas
- ORCID
- Venue
- Nature Communications
- Published
- 2018-11-30
- Volume
- 9
- Issue
- 1
- Pages
- 5114-5114
- ISSN
- 2041-1723 (ISSN-L)
- PMC
- PMC6269478
- OpenAlex
- W2951254987
- Cited by
- 5,748
- References
- 40
- Citations by year
- 2026: 1107 · 2025: 1110 · 2024: 977 · 2023: 789 · 2022: 695 · 2021: 617 · 2020: 305 · 2019: 128 · 2018: 16
- FWCI
- 96.11
- Type
- journal article
- Language
- en
- Open access
- gold
- doi.org
- Locations
- Nature Communications (publishedVersion, cc-by)
- bioRxiv (Cold Spring Harbor Laboratory) (acceptedVersion, cc-by)
- Europe PMC (PubMed Central) (publishedVersion, other-oa)
- PubMed Central (publishedVersion, cc-by)
- PubMed (publishedVersion)
- RePEc: Research Papers in Economics (submittedVersion)
- DOAJ (DOAJ: Directory of Open Access Journals) (submittedVersion, cc-by-sa)
- DOAJ (DOAJ: Directory of Open Access Journals) (submittedVersion)
- Funders
- National Science Foundation (1416259, 1816027, 1356288)
- Topics
- Life Sciences › Biochemistry, Genetics and Molecular Biology › Molecular Biology › Genomics and Phylogenetic Studies
- Health Sciences › Medicine › Microbiology (medical) › Bacterial Identification and Susceptibility Testing
- Physical Sciences › Environmental Science › Ecology › Microbial Community Ecology and Physiology
- Keywords
- average nucleotide identity, prokaryotic genomes, species boundaries, taxonomic classification, draft genome sequence
- MeSH terms
- Phylogeny, Prokaryotic Cells, Genetic Variation, Databases, Factual, Genome, Bacterial, Sequence Analysis, DNA
About these checks
Registry, retraction, Cites and statistics results are computed, not judged, with one exception: a printed reference that no index lists is read once by a model before it counts as a citation error. Claims are extracted by a model and kept only when their quote appears verbatim in the text; each cited source is then checked, with a model’s help, for whether it says what the claim relies on. Those verdicts can be wrong — read the claim’s quote and the cited source before relying on one.
Statistics and arithmetic are recomputed, not judged.
Confidence bands are shown only for fields calibrated on our annotated test set. None is calibrated yet, so no band is shown.
What counts as a claim ›How we measure confidence ›How we check this ›
Are you an author, or do you see a problem with this page? Request a review
