

The DOI matches its Crossref record, with a small difference in title or year; 58 of the 58 references it cites were found in a registry or an index.
Immunological imprinting of the antibody response in COVID-19 patients
Open accessPublished version of a preprint
Abstract
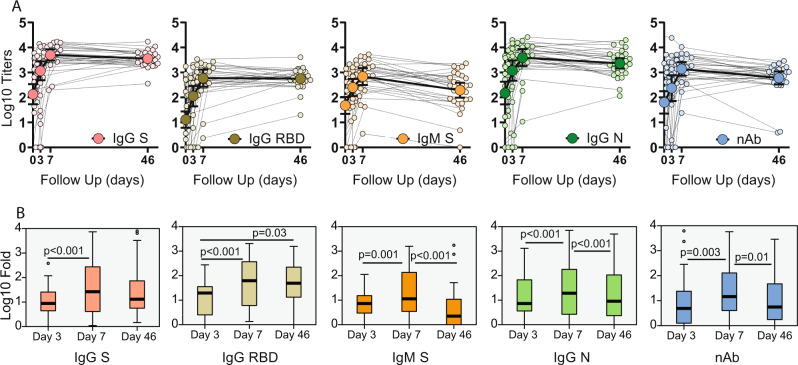
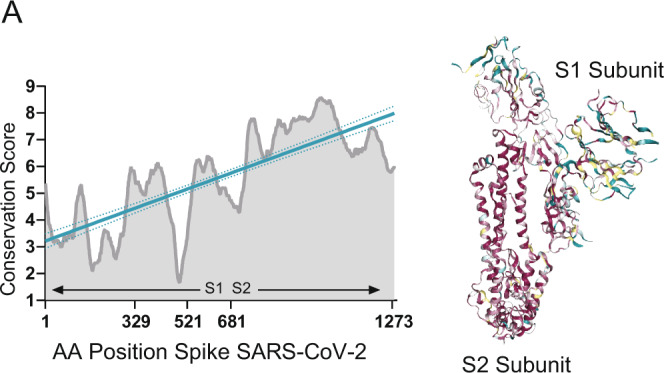
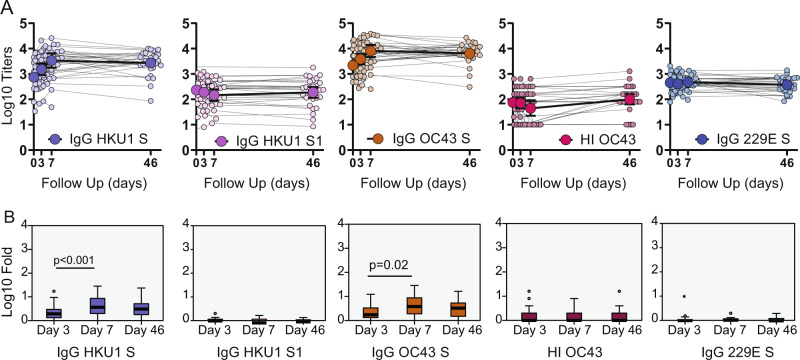
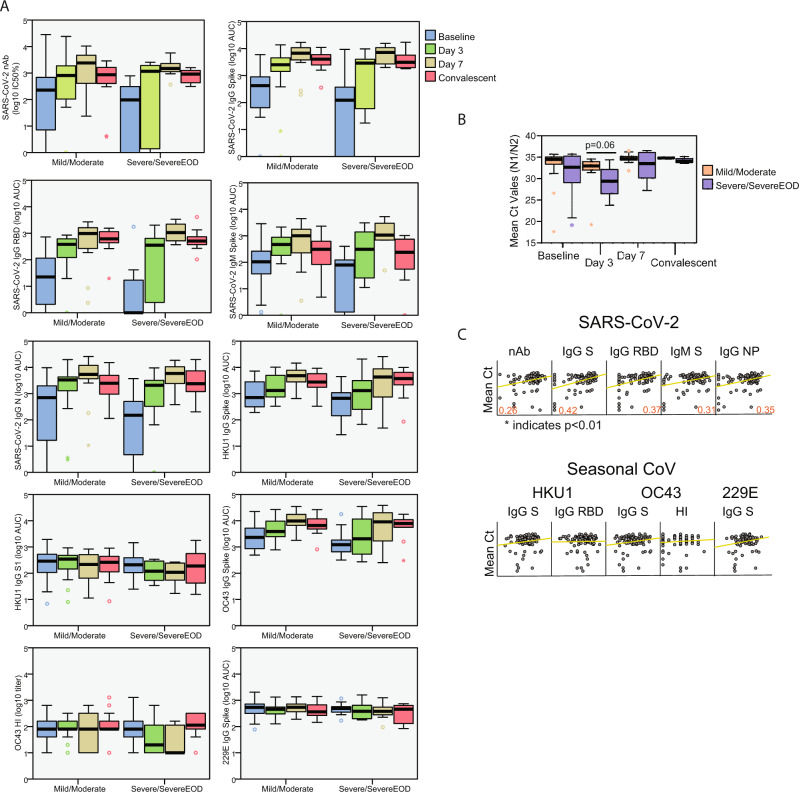
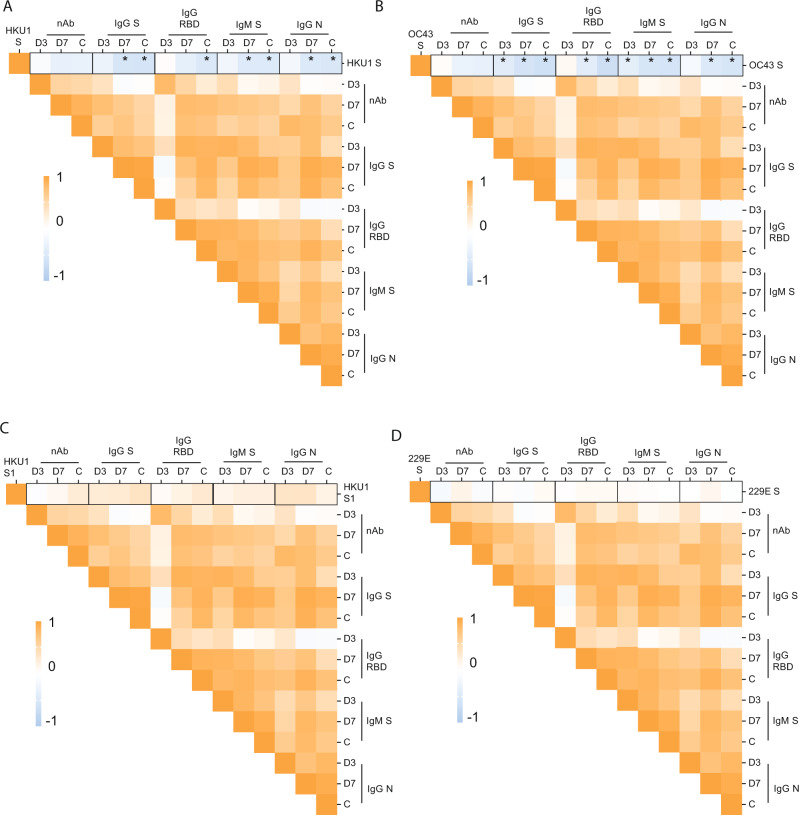
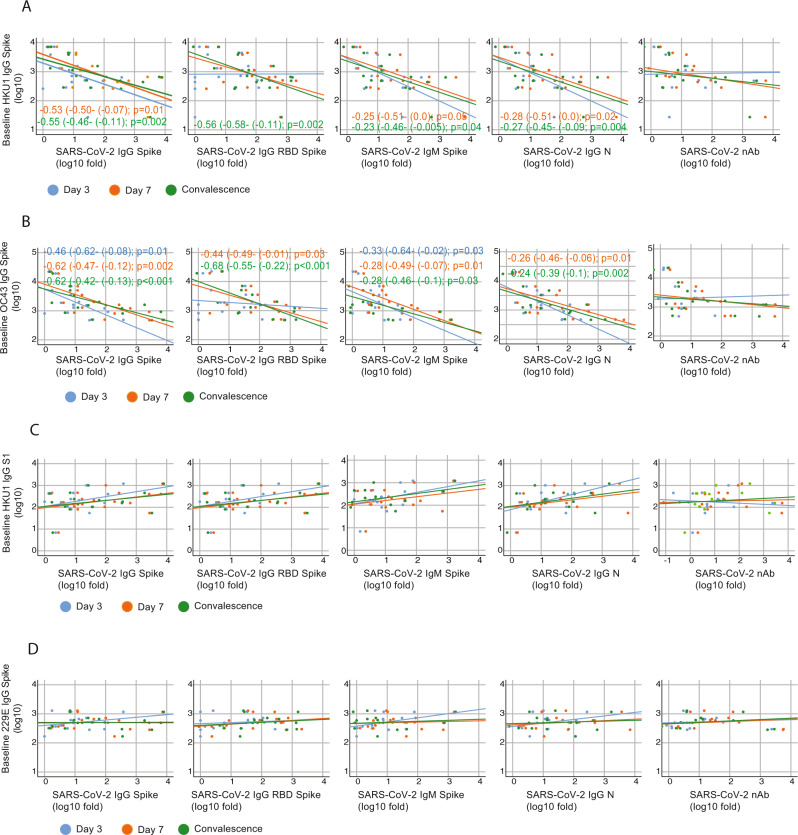
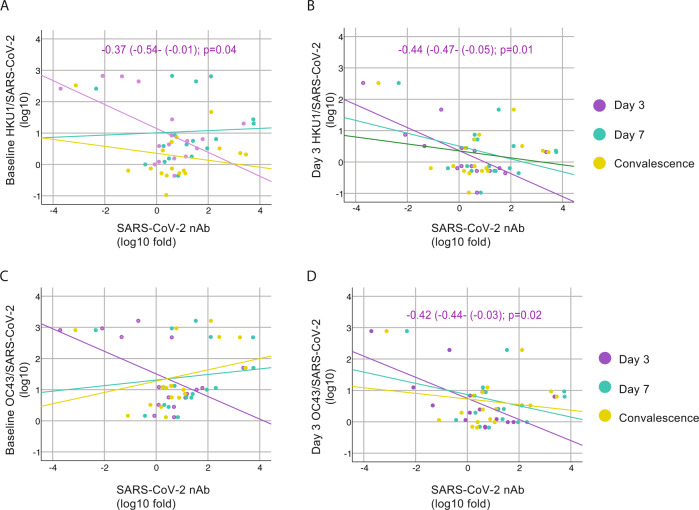
In addition to severe acute respiratory syndrome coronavirus 2 (SARS-CoV-2), humans are also susceptible to six other coronaviruses, for which consecutive exposures to antigenically related and divergent seasonal coronaviruses are frequent. Despite the prevalence of COVID-19 pandemic and ongoing research, the nature of the antibody response against severe acute respiratory syndrome coronavirus 2 (SARS-CoV-2) is unclear. Here we longitudinally profile the early humoral immune response against SARS-CoV-2 in hospitalized coronavirus disease 2019 (COVID-19) patients and quantify levels of pre-existing immunity to OC43, HKU1 and 229E seasonal coronaviruses, and find a strong back-boosting effect to conserved but not variable regions of OC43 and HKU1 betacoronaviruses spike protein. However, such antibody memory boost to human coronaviruses negatively correlates with the induction of IgG and IgM against SARS-CoV-2 spike and nucleocapsid protein. Our findings thus provide evidence of immunological imprinting by previous seasonal coronavirus infections that can potentially modulate the antibody profile to SARS-CoV-2 infection.
Overview
The claims and statistics of this paper haven’t been checked yet.
Run the check — free, no account needed. It reads the open-access text and checks the sources it cites.
Integrity signals
Registry
Cites
Statistics
Figures
Verification
Claims the paper makes
The claims and statistics of this paper haven’t been checked yet.
Run the check — free, no account needed. It reads the open-access text and checks the sources it cites.
Claims other papers make about this one
Each is checked against this paper’s own text: does it say what the citing paper says it does?
In the citing paper
“It has been reported that SARS-CoV-2 infection induces an original antigenic sin-type immune response against human coronaviruses (hCoVs) to which the majority of the human population has pre-existing immunity”
From SARS-CoV-2 mRNA vaccination induces functionally diverse antibodies to NTD, RBD, and S2 (2021) · cites this paper as Aydillo et al., 2021
In the citing paper
“has already been shown for natural infection with SARS-CoV-2 where a “backboost” to β-coronaviruses was also found (Aydillo et al., 2021; Song et al., 2020).”
From SARS-CoV-2 mRNA vaccination induces functionally diverse antibodies to NTD, RBD, and S2 (2021) · cites this paper as Aydillo et al., 2021
Self-check
Percentages, sums and reported differences re-computed from the paper’s own numbers.
The self-check needs the paper’s full text.
Citations
Cites
A novel coronavirus from patients with pneumonia in China, 2019
Zhu, N., Zhang, D., Wang, W., Li, X., Yang, B., Song, J., Zhao, X., Huang, B., Shi, W., Lu, R., et al. (2020) · New England Journal of Medicine · doi:10.1056/nejmoa2001017 · Cited by 28,244
Structure, function and antigenicity of the SARS-CoV-2 spike glycoprotein
Walls, A. C., Park, Y.-J., Tortorici, M. A., Wall, A., McGuire, A. T., & Veesler, D. (2020) · doi:10.1101/2020.02.19.956581 · Cited by 8,586
Isolation of a Novel Coronavirus from a Man with Pneumonia in Saudi Arabia
Zaki, A. M., van Boheemen, S., Bestebroer, T. M., Osterhaus, A. D. M. E., & Fouchier, R. A. M. (2012) · New England Journal of Medicine · doi:10.1056/nejmoa1211721 · Cited by 5,677
Grifoni, A., Weiskopf, D., Ramirez, S. I., Mateus, J., Dan, J. M., Moderbacher, C. R., Rawlings, S. A., Sutherland, A., Premkumar, L., Jadi, R. S., et al. (2020) · Cell · doi:10.1016/j.cell.2020.05.015 · Cited by 3,595
Self-citationAn mRNA Vaccine against SARS-CoV-2 — Preliminary Report
Jackson, L. A., Anderson, E. J., Rouphael, N. G., Roberts, P. C., Makhene, M., Coler, R. N., McCullough, M. P., Chappell, J. D., Denison, M. R., Stevens, L. J., et al. (2020) · New England Journal of Medicine · doi:10.1056/nejmoa2022483 · Cited by 3,237
Letko, M., Marzi, A., & Munster, V. (2020) · Nature Microbiology · doi:10.1038/s41564-020-0688-y · Cited by 3,109
Coronavirus as a possible cause of severe acute respiratory syndrome
Peiris, M. J. S., Lai, S., Poon, L. L. M., Guan, Y., Yam, L., Lim, W., Nicholls, J. M., Yee, W., Yan, W., Cheung, M., et al. (2003) · The Lancet · doi:10.1016/s0140-6736(03)13077-2 · Cited by 2,916
Structural and Functional Basis of SARS-CoV-2 Entry by Using Human ACE2
Wang, Q., Zhang, Y., Wu, L., Niu, S., Song, C., Zhang, Z., Lu, G., Qiao, C., Hu, Y., Yuen, K.-Y., et al. (2020) · Cell · doi:10.1016/j.cell.2020.03.045 · Cited by 2,892
An inflammatory cytokine signature predicts COVID-19 severity and survival
Del Valle, D. M., Kim-Schulze, S., Huang, H.-H., Beckmann, N. D., Nirenberg, S., Wang, B., Lavin, Y., Swartz, T. H., Madduri, D., Stock, A., et al. (2020) · Nature Medicine · doi:10.1038/s41591-020-1051-9 · Cited by 2,605
Bi, Q., Wu, Y., Mei, S., Ye, C., Zou, X., Zhang, Z., Liu, X., Wei, L., Truelove, S., Zhang, T., et al. (2020) · The Lancet Infectious Diseases · doi:10.1016/s1473-3099(20)30287-5 · Cited by 1,960
Isolation and characterization of a bat SARS-like coronavirus that uses the ACE2 receptor
Ge, X.-Y., Li, J.-L., Yang, X.-L., Chmura, A. A., Zhu, G., Epstein, J. H., Mazet, J. K., Hu, B., Zhang, W., Peng, C., et al. (2013) · Nature · doi:10.1038/nature12711 · Cited by 1,778
A serological assay to detect SARS-CoV-2 seroconversion in humans
Amanat, F., Stadlbauer, D., Strohmeier, S., Nguyen, T. H. O., Chromikova, V., McMahon, M., Jiang, K., Arunkumar, G. A., Jurczyszak, D., Polanco, J., et al. (2020) · Nature Medicine · doi:10.1038/s41591-020-0913-5 · Cited by 1,769
Self-citationHuman neutralizing antibodies elicited by SARS-CoV-2 infection
Ju, B., Zhang, Q., Ge, J., Wang, R., Sun, J., Ge, X., Yu, J., Shan, S., Zhou, B., Song, S., et al. (2020) · Nature · doi:10.1038/s41586-020-2380-z · Cited by 1,667
A highly conserved cryptic epitope in the receptor binding domains of SARS-CoV-2 and SARS-CoV
Yuan, M., Wu, N. C., Zhu, X., Lee, C.-C. D., So, R. T. Y., Lv, H., Mok, C. K. P., & Wilson, I. A. (2020) · Science · doi:10.1126/science.abb7269 · Cited by 1,429
Piccoli, L., Park, Y.-J., Tortorici, M. A., Czudnochowski, N., Walls, A. C., Beltramello, M., Silacci-Fregni, C., Pinto, D., Rosen, L. E., Bowen, J. E., et al. (2020) · Cell · doi:10.1016/j.cell.2020.09.037 · Cited by 1,395
SARS-CoV-2-reactive T cells in healthy donors and patients with COVID-19
Braun, J., Loyal, L., Frentsch, M., Wendisch, D., Georg, P., Kurth, F., Hippenstiel, S., Dingeldey, M., Kruse, B., Fauchere, F., et al. (2020) · Nature · doi:10.1038/s41586-020-2598-9 · Cited by 1,310
A human neutralizing antibody targets the receptor-binding site of SARS-CoV-2
Shi, R., Shan, C., Duan, X., Chen, Z., Liu, P., Song, J., Song, T., Bi, X., Han, C., Wu, L., et al. (2020) · Nature · doi:10.1038/s41586-020-2381-y · Cited by 1,286
Structure, Function, and Antigenicity of the SARS-CoV-2 Spike Glycoprotein
Walls, A. C., Park, Y., Tortorici, M. A., Wall, A., McGuire, A. T., & Veesler, D. (2020) · Cell · doi:10.1016/j.cell.2020.11.032 · Cited by 1,283
SARS-CoV-2 Vaccines: Status Report
Amanat, F., & Krammer, F. (2020) · Immunity · doi:10.1016/j.immuni.2020.03.007 · Cited by 1,120
Self-citationSelective and cross-reactive SARS-CoV-2 T cell epitopes in unexposed humans
Mateus, J., Grifoni, A., Tarke, A., Sidney, J., Ramirez, S. I., Dan, J. M., Burger, Z. C., Rawlings, S. A., Smith, D. M., Phillips, E., et al. (2020) · Science · doi:10.1126/science.abd3871 · Cited by 1,120
Evolutionary origins of the SARS-CoV-2 sarbecovirus lineage responsible for the COVID-19 pandemic
Boni, M. F., Lemey, P., Jiang, X., Lam, T. T.-Y., Perry, B. W., Castoe, T. A., Rambaut, A., & Robertson, D. L. (2020) · Nature Microbiology · doi:10.1038/s41564-020-0771-4 · Cited by 1,014
ChAdOx1 nCoV-19 vaccine prevents SARS-CoV-2 pneumonia in rhesus macaques
van Doremalen, N., Lambe, T., Spencer, A., Belij-Rammerstorfer, S., Purushotham, J. N., Port, J. R., Avanzato, V. A., Bushmaker, T., Flaxman, A., Ulaszewska, M., et al. (2020) · Nature · doi:10.1038/s41586-020-2608-y · Cited by 914
Weiskopf, D., Schmitz, K. S., Raadsen, M. P., Grifoni, A., Okba, N. M. A., Endeman, H., van den Akker, J. P. C., Molenkamp, R., Koopmans, M. P. G., van Gorp, E. C. M., et al. (2020) · Science Immunology · doi:10.1126/sciimmunol.abd2071 · Cited by 907
Preexisting and de novo humoral immunity to SARS-CoV-2 in humans
Ng, K. W., Faulkner, N., Cornish, G. H., Rosa, A., Harvey, R., Hussain, S., Ulferts, R., Earl, C., Wrobel, A. G., Benton, D. J., et al. (2020) · Science · doi:10.1126/science.abe1107 · Cited by 886
Single-Shot Ad26 Vaccine Protects Against SARS-CoV-2 in Rhesus Macaques
Mercado, N. B., Zahn, R., Wegmann, F., Loos, C., Chandrashekar, A., Yu, J., Liu, J., Peter, L., McMahan, K., Tostanoski, L. H., et al. (2020) · Nature · doi:10.1038/s41586-020-2607-z · Cited by 789
Emerging Pandemic Diseases: How We Got to COVID-19
Morens, D. M., & Fauci, A. S. (2020) · Cell · doi:10.1016/j.cell.2020.08.021 · Cited by 780
Structural Basis for RNA Replication by the SARS-CoV-2 Polymerase
Wang, Q., Wu, J., Wang, H., Gao, Y., Liu, Q., Mu, A., Ji, W., Yan, L., Zhu, Y., Zhu, C., et al. (2020) · Cell · doi:10.1016/j.cell.2020.05.034 · Cited by 773
Molecular Evolution of Human Coronavirus Genomes
Forni, D., Cagliani, R., Clerici, M., & Sironi, M. (2016) · Trends in Microbiology · doi:10.1016/j.tim.2016.09.001 · Cited by 751
Viral epitope profiling of COVID-19 patients reveals cross-reactivity and correlates of severity
Shrock, E., Fujimura, E., Kula, T., Timms, R. T., Lee, I.-H., Leng, Y., Robinson, M. L., Sie, B. M., Li, M. Z., Chen, Y., et al. (2020) · Science · doi:10.1126/science.abd4250 · Cited by 678
Stadlbauer, D., Amanat, F., Chromikova, V., Jiang, K., Strohmeier, S., Arunkumar, G. A., Tan, J., Bhavsar, D., Capuano, C., Roubidoux, E. K., et al. (2020) · Current Protocols in Microbiology · doi:10.1002/cpmc.100 · Cited by 635
Self-citationImbalance of Regulatory and Cytotoxic SARS-CoV-2-Reactive CD4+ T Cells in COVID-19
Meckiff, B. J., Ramírez-Suástegui, C., Fajardo, V., Chee, S., Kusnadi, A., Simon, H. A., Eschweiler, S., Grifoni, A., Pelosi, E., Weiskopf, D., et al. (2020) · Cell · doi:10.1016/j.cell.2020.10.001 · Cited by 581
Addetia, A., Crawford, K. H. D., Dingens, A., Zhu, H., Roychoudhury, P., Huang, M.-L., Jerome, K. R., Bloom, J. D., & Greninger, A. L. (2020) · Journal of Clinical Microbiology · doi:10.1128/jcm.02107-20 · Cited by 525
Ultrapotent human antibodies protect against SARS-CoV-2 challenge via multiple mechanisms
Tortorici, M. A., Beltramello, M., Lempp, F. A., Pinto, D., Dang, H. V., Rosen, L. E., McCallum, M., Bowen, J., Minola, A., Jaconi, S., et al. (2020) · Science · doi:10.1126/science.abe3354 · Cited by 510
A SARS-CoV-2 Infection Model in Mice Demonstrates Protection by Neutralizing Antibodies
Hassan, A. O., Case, J. B., Winkler, E. S., Thackray, L. B., Kafai, N. M., Bailey, A. L., McCune, B. T., Fox, J. M., Chen, R. E., Alsoussi, W. B., et al. (2020) · Cell · doi:10.1016/j.cell.2020.06.011 · Cited by 482
Antibody landscapes after influenza virus infection or vaccination
Fonville, J. M., Wilks, S. H., James, S. L., Fox, A., Ventresca, M., Aban, M., Xue, L., Jones, T. C., H., L. N. M., Thái, P. Q., et al. (2014) · Science · doi:10.1126/science.1256427 · Cited by 475
Erbelding, E. J., Post, D. J., Stemmy, E. J., Roberts, P. C., Augustine, A. D., Ferguson, S. E., Paules, C. I., Graham, B. S., & Fauci, A. S. (2018) · The Journal of Infectious Diseases · doi:10.1093/infdis/jiy103 · Cited by 440
Cross-reactive Antibody Response between SARS-CoV-2 and SARS-CoV Infections
Lv, H., Wu, N. C., Tsang, O. T.-Y., Yuan, M., Perera, R. A. P. M., Leung, W.-S., So, R. T. Y., Chan, J. M. C., Yip, G. K., Chik, T. S., et al. (2020) · Cell Reports · doi:10.1016/j.celrep.2020.107725 · Cited by 406
Hulswit, R. J. G., Lang, Y., Bakkers, M. J. G., Li, W., Li, Z., Schouten, A., Ophorst, B., van Kuppeveld, F. J. M., Boons, G., Bosch, B., et al. (2019) · Proceedings of the National Academy of Sciences · doi:10.1073/pnas.1809667116 · Cited by 384
Original Antigenic Sin in Dengue
Halstead, S. B., Rojanasuphot, S., & SANGKAWIBHA, N. (1983) · American Journal of Tropical Medicine and Hygiene · doi:10.4269/ajtmh.1983.32.154 · Cited by 291
ChAdOx1 nCoV-19 vaccination prevents SARS-CoV-2 pneumonia in rhesus macaques
van Doremalen, N., Lambe, T., Spencer, A., Belij-Rammerstorfer, S., Purushotham, J. N., Port, J. R., Avanzato, V., Bushmaker, T., Flaxman, A., Ulaszewska, M., et al. (2020) · doi:10.1101/2020.05.13.093195 · Cited by 246
Nguyen-Contant, P., Embong, A. K., Kanagaiah, P., Chaves, F. A., Yang, H., Branche, A. R., Topham, D. J., & Sangster, M. Y. (2020) · mBio · doi:10.1128/mbio.01991-20 · Cited by 204
An In-Depth Analysis of Original Antigenic Sin in Dengue Virus Infection
Midgley, C. M., Bajwa-Joseph, M., Vasanawathana, S., Limpitikul, W., Wills, B. A., Flanagan, A., Waiyaiya, E., Tran, H. B., Cowper, A. E., Chotiyarnwon, P., et al. (2010) · Journal of Virology · doi:10.1128/jvi.01826-10 · Cited by 201
The Doctrine of Original Antigenic Sin: Separating Good From Evil
Monto, A. S., Malosh, R. E., Petrie, J. G., & Martin, E. T. (2017) · The Journal of Infectious Diseases · doi:10.1093/infdis/jix173 · Cited by 180
Prevalence of Antibodies to Four Human Coronaviruses Is Lower in Nasal Secretions than in Serum
Gorse, G. J., Patel, G. B., Vitale, J. N., & O’Connor, T. (2010) · Clinical and Vaccine Immunology · doi:10.1128/cvi.00278-10 · Cited by 166
Che, X., Qiu, L., Liao, Z., Wang, Y., Wen, K., Pan, Y., Hao, W., Mei, Y., Cheng, V. C., & Yuen, K. (2005) · The Journal of Infectious Diseases · doi:10.1086/430355 · Cited by 165
Gostic, K. M., Bridge, R., Brady, S., Viboud, C. G., Worobey, M., & Lloyd‐Smith, J. O. (2019) · PLoS Pathogens · doi:10.1371/journal.ppat.1008109 · Cited by 163
Ieven, M. M., Coenen, S., Loens, K., Lammens, C., Coenjaerts, F. E. J., Vanderstraeten, A., Henriques‐Normark, B., Crook, D. W., Huygen, K., Butler, C., et al. (2018) · Clinical Microbiology and Infection · doi:10.1016/j.cmi.2018.02.004 · Cited by 162
Elslande, J. V., Decru, B., Jonckheere, S., Wijngaerden, E. V., Houben, E., Vandecandelaere, P., Indevuyst, C., Depypere, M., Desmet, S., André, E., et al. (2020) · Clinical Microbiology and Infection · doi:10.1016/j.cmi.2020.07.038 · Cited by 145
Dugan, H. L., Guthmiller, J. J., Arevalo, P., Huang, M., Chen, Y.-Q., Neu, K. E., Henry, C., Zheng, N., Lan, L. Y.-L., Tepora, M. E., et al. (2020) · Science Translational Medicine · doi:10.1126/scitranslmed.abd3601 · Cited by 121
Self-citationSaletti, G., Gerlach, T. H., Jansen, J. M., Molle, A., Elbahesh, H., Ludlow, M., Li, W., Bosch, B., Osterhaus, A. D. M. E., & Rimmelzwaan, G. F. (2020) · Scientific Reports · doi:10.1038/s41598-020-78506-9 · Cited by 74
Meade, P. S., Kuan, G. M., Strohmeier, S., Maier, H. E., Amanat, F., Balmaseda, Á., Ito, K., Roubidoux, E. K., Javier, A., Gresh, L., et al. (2020) · mBio · doi:10.1128/mbio.03243-19 · Cited by 67
Self-citationInfluenza imprinting in childhood and the influence on vaccine response later in life
Kelvin, A. A., & Zambon, M. C. F. A. (2019) · Eurosurveillance · doi:10.2807/1560-7917.es.2019.24.48.1900720 · Cited by 57
Involvement of Aminopeptidase N (CD13) in Infection of Human Neural Cells by Human Coronavirus 229E
Lachance, C., Arbour, N., Cashman, N. R., & Talbot, P. J. (1998) · Journal of Virology · doi:10.1128/jvi.72.8.6511-6519.1998 · Cited by 48
Single-Cell Transcriptomic Analysis of SARS-CoV-2 Reactive CD4 + T CellsPreprint
Meckiff, B. J., Ramírez-Suástegui, C., Fajardo, V., Chee, S., Kusnadi, A., Simon, H. A., Grifoni, A., Pelosi, E., Weiskopf, D., Sette, A., et al. (2020) · SSRN Electronic Journal · doi:10.2139/ssrn.3641939 · Cited by 47
Single-cell transcriptomic analysis of SARS-CoV-2 reactive CD4 + T cellsPreprint
Meckiff, B. J., Ramírez-Suástegui, C., Fajardo, V., et al. (2020) · bioRxiv (Cold Spring Harbor Laboratory) · doi:10.1101/2020.06.12.148916 · Cited by 45
Amanat, F., Thapa, M., Lei, T., Ahmed, S. M. S., Adelsberg, D. C., Carreño, J. M., Strohmeier, S., Schmitz, A. J., Zafar, S., Zhou, J. Q., et al. (2021) · medRxiv · doi:10.1101/2021.03.07.21253098 · Cited by 41
Self-citationAydillo, T., Escalera, A., Strohmeier, S., Aslam, S., Sánchez‐Céspedes, J., Ayllón, J., Roca-Oporto, C., Pérez‐Romero, P., Montejo, M., Gavaldà, J., et al. (2020) · Cell Reports Medicine · doi:10.1016/j.xcrm.2020.100130 · Cited by 30
Self-citationde Vries, R. D. (2020) · Signal Transduction and Targeted Therapy · doi:10.1038/s41392-020-00338-w · Cited by 17
Cited by
Sorted by citations
Adaptive immunity to SARS-CoV-2 and COVID-19
Sette, A., & Crotty, S. (2021) · Cell · doi:10.1016/j.cell.2021.01.007 · Cited by 1,860
Dispinseri, S., Secchi, M., Pirillo, M. F., Tolazzi, M., Borghi, M., Brigatti, C., Angelis, M. L. D., Baratella, M., Bazzigaluppi, E., Venturi, G., et al. (2021) · Nature Communications · doi:10.1038/s41467-021-22958-8 · Cited by 338
Maturation and persistence of the anti-SARS-CoV-2 memory B cell response
Sokal, A., Chappert, P., Barba-Spaeth, G., Roeser, A., Fourati, S., Azzaoui, I., Vandenberghe, A., Fernandez, I., Meola, A., Bouvier-Alias, M., et al. (2021) · Cell · doi:10.1016/j.cell.2021.01.050 · Cited by 340
SARS-CoV-2 mRNA vaccination induces functionally diverse antibodies to NTD, RBD, and S2
Amanat, F., Thapa, M., Lei, T., Ahmed, S. M. S., Adelsberg, D. C., Carreño, J. M., Strohmeier, S., Schmitz, A. J., Zafar, S., Zhou, J. Q., et al. (2021) · Cell · doi:10.1016/j.cell.2021.06.005 · Cited by 273
Self-citationHumoral Responses and Serological Assays in SARS-CoV-2 Infections
Galipeau, Y., Greig, M., Liu, C., Driedger, M., & Langlois, M. (2020) · Frontiers in Immunology · doi:10.3389/fimmu.2020.610688 · Cited by 247
Metadata
- Authors
- Aydillo, T., Rombauts, A., Stadlbauer, D., Aslam, S., Abelenda-Alonso, G., Escalera, A., Amanat, F., Jiang, K., Krammer, F., Carratala, J., & García-Sastre, A.
- Affiliations
- Icahn School of Medicine at Mount Sinai (US)
- Instituto de Salud Carlos III (ES)
- Corresponding author
- Krammer, Florian
- ORCID
- Venue
- Nature Communications
- Published
- 2021-06-18
- Volume
- 12
- Issue
- 1
- Pages
- 3781-3781
- ISSN
- 2041-1723 (ISSN-L)
- PMC
- PMC8213790
- OpenAlex
- W3171762393
- Cited by
- 223
- References
- 57
- Citations by year
- 2026: 14 · 2025: 24 · 2024: 25 · 2023: 46 · 2022: 69 · 2021: 44
- FWCI
- 14.57
- Type
- journal article
- Language
- en
- Open access
- gold
- doi.org
- Locations
- Nature Communications (publishedVersion, cc-by)
- medRxiv (acceptedVersion, cc-by-nc-nd)
- PubMed Central (publishedVersion, cc-by)
- PubMed (publishedVersion)
- Dipòsit Digital de la Universitat de Barcelona (Universitat de Barcelona) (submittedVersion, cc-by)
- RePEc: Research Papers in Economics (submittedVersion)
- DOAJ (DOAJ: Directory of Open Access Journals) (submittedVersion, cc-by-sa)
- ImmPort
- Funders
- Division of Intramural Research, National Institute of Allergy and Infectious Diseases (75N93019C00051)
- Topics
- Health Sciences › Medicine › Infectious Diseases › SARS-CoV-2 and COVID-19 Research
- Life Sciences › Immunology and Microbiology › Immunology › Immune responses and vaccinations
- Health Sciences › Medicine › Infectious Diseases › COVID-19 Clinical Research Studies
- Keywords
- immunological imprinting, SARS-CoV-2, COVID-19 pandemic, antibody response, humoral immunity, seasonal coronaviruses, HCoV-OC43, HCoV-HKU1, 229E, spike protein, nucleocapsid protein, pre-existing immunity, IgG, IgM, hospitalized patients
- MeSH terms
- COVID-19, SARS-CoV-2, Aged, Antibodies, Viral, Antibody Formation, Cross Reactions, Female, Humans, Male, Spike Glycoprotein, Coronavirus
About these checks
Registry, retraction, Cites and statistics results are computed, not judged, with one exception: a printed reference that no index lists is read once by a model before it counts as a citation error. Claims are extracted by a model and kept only when their quote appears verbatim in the text; each cited source is then checked, with a model’s help, for whether it says what the claim relies on. Those verdicts can be wrong — read the claim’s quote and the cited source before relying on one.
Statistics and arithmetic are recomputed, not judged.
Confidence bands are shown only for fields calibrated on our annotated test set. None is calibrated yet, so no band is shown.
What counts as a claim ›How we measure confidence ›How we check this ›
Are you an author, or do you see a problem with this page? Request a review
