

The DOI matches its Crossref record; 73 of the 79 references it cites were found in a registry or an index; 54 of the 66 sources its claims cite were checked for support.
Rare variant associations with plasma protein levels in the UK Biobank
Open accessAbstract
Integrating human genomics and proteomics can help elucidate disease mechanisms, identify clinical biomarkers and discover drug targets 1–4 . Because previous proteogenomic studies have focused on common variation via genome-wide association studies, the contribution of rare variants to the plasma proteome remains largely unknown. Here we identify associations between rare protein-coding variants and 2,923 plasma protein abundances measured in 49,736 UK Biobank individuals. Our variant-level exome-wide association study identified 5,433 rare genotype–protein associations, of which 81% were undetected in a previous genome-wide association study of the same cohort 5 . We then looked at aggregate signals using gene-level collapsing analysis, which revealed 1,962 gene–protein associations. Of the 691 gene-level signals from protein-truncating variants, 99.4% were associated with decreased protein levels. STAB1 and STAB2 , encoding scavenger receptors involved in plasma protein clearance, emerged as pleiotropic loci, with 77 and 41 protein associations, respectively. We demonstrate the utility of our publicly accessible resource through several applications. These include detailing an allelic series in NLRC4 , identifying potential biomarkers for a fatty liver disease-associated variant in HSD17B13 and bolstering phenome-wide association studies by integrating protein quantitative trait loci with protein-truncating variants in collapsing analyses. Finally, we uncover distinct proteomic consequences of clonal haematopoiesis (CH), including an association between TET2- CH and increased FLT3 levels. Our results highlight a considerable role for rare variation in plasma protein abundance and the value of proteogenomics in therapeutic discovery.
Overview
AI snapshot
Written from the paper’s full text.
TL;DR
Rare protein-coding variant association testing in UK Biobank plasma proteomics identified thousands of variant- and gene-level protein associations, most of which were not detected by common-variant GWAS. The resource links rare variation to plasma protein levels and demonstrates applications in allelic series, biomarker discovery, clonal haematopoiesis, and pQTL-augmented PheWAS.
Key findings
- In 49,736 UK Biobank individuals with 2,923 plasma protein abundances, variant-level ExWAS found 151,491 significant genotype–protein associations, including 5,433 rare-variant associations (MAF ≤ 0.1%); 81% of rare associations were undetected in a previous GWAS of the same cohort. Gene-level collapsing analysis found 1,962 unique gene–protein associations, and of 691 gene-level signals from protein-truncating variants, 99.4% were associated with decreased protein levels.
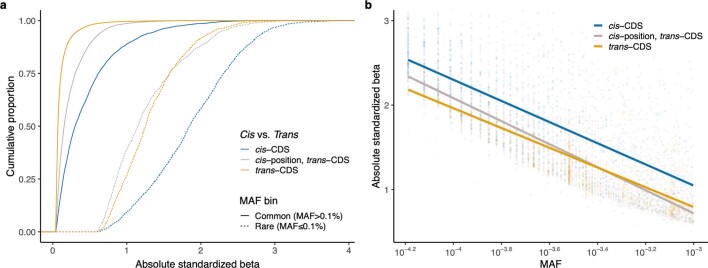
- Rare cis-CDS pQTLs had larger effects than common cis-CDS pQTLs (median |β| = 1.85 versus 0.3; Wilcoxon P < 10−300), and rare trans-CDS pQTLs had larger effects than common trans-CDS pQTLs (median |β| = 1.26 versus 0.08; Wilcoxon P < 10−300). Among 538 rare cis-CDS PTV pQTLs, 518 (96%) decreased protein abundance.
- STAB1 and STAB2 emerged as pleiotropic loci with 77 and 41 protein associations, respectively; ASGR1 had 186 and GNPTAB had 37. GNPTAB trans-CDS pQTLs included 35 of 37 (95%) lysosomal proteins, all increased in PTV carriers.
- Clonal haematopoiesis analyses found 36 trans associations with JAK2-CH, 15 with TET2-CH, 8 with ASXL1-CH, and 4 each with SF3B1-CH and SRSF2-CH. TET2-CH was associated with increased FLT3 (P = 3.4 × 10⁻¹⁶; β = 0.50) and decreased FLT3LG (P = 6.4 × 10−64; β = −0.97).
Methods
- UKB-PPP plasma proteomics used the Olink Explore 3072 platform, measuring 2,923 unique proteins across 54,219 plasma samples; exome sequencing was available for 52,217 participants, and after quality control 49,736 multi-ancestry samples were analyzed, including 46,327 of European ancestry.
- Variant-level ExWAS tested 617,073 variants against 2,923 plasma proteins using linear regression with covariates; gene-level collapsing analyses aggregated rare qualifying variants across 18,885 genes using nine non-synonymous models plus a synonymous negative-control model, with study-wide significance P ≤ 1 × 10⁻⁸.
- Additional analyses included pan-ancestry collapsing, somatic CH variant calling with GATK Mutect2 in 15 recurrently mutated genes, and pQTL-augmented PheWAS models (`ptvolink`, `ptvolink2pcnt`) incorporating cis-CDS missense pQTLs with negative β.
Limitations
- The paper states that potential epitope effects could confound cis-CDS pQTLs; one possible epitope effect was observed in GOT1, and antibody binding-site data were unavailable on request. It also states that putatively novel associations should be validated with orthogonal experiments and that the pQTL-informed collapsing approach is constrained by the UKB-PPP sample size used for pQTL discovery.
- Evident from the text: the main analyses are predominantly European-ancestry (46,327 of 49,736; 93%), limiting generalizability, although a pan-ancestry analysis was also performed. The Olink platform measures 2,923 proteins rather than the full plasma proteome, and the UK Biobank cohort is middle-aged to older adults.
Model-written summary. Check it against the paper before relying on it.
Integrity signals
Registry
Cites
Statistics
Figures
Verification
Claims the paper makes
84 Own result · 21 Own method · 16 Partly supported · 15 Supported · 15 Own interpretation · 6 No basis given · 5 Couldn’t confirm · 5 No full text of the sources · 3 Supported so far · accuracy not yet measured
The cited sources support only part of this claim — read each source’s verdict below.
In the paper
“However, their influence on the plasma proteome is largely unknown because previous rare variant proteogenomic studies have been limited in scale9,10.”
§ Rare variant associations with plasma protein levels in the UK Biobank > Main
What the sources say
- Supportedcites [9] Kierczak, M. et al. Contribution of rare whole-genome sequencing variants to plasma protein levels and the missing heritability. Nat. Commun. 13, 2532 (2022). source
The Discussion (page unavailable) says few gene-based studies had used whole-genome sequencing to find rare-variant associations with proteins, and that low numbers of observations limit the power to detect rare-variant effects. This supports the claim that the influence of rare variants on plasma proteins remained incompletely understood because earlier work was limited in scale. (LLM, conf=0.84)
- Partly supportedcites [10] Katz, D. H. et al. Whole genome sequence analysis of the plasma proteome in Black adults provides novel insights into cardiovascular disease. Circulation 145, 357–370 (2022). sourceExperimental — accuracy not yet measured
The Introduction (page unavailable) says earlier proteogenomic findings came nearly entirely from European populations using genotyping arrays, and the Discussion (page unavailable) describes this study as the largest of its kind in a Black population. This supports a gap in knowledge about genetic determinants of the plasma proteome, but the paper does not say that previous rare-variant proteogenomic studies were limited in scale or identify that as the reason rare variants’ influence was largely unknown. (LLM, conf=0.77)
plain- Asserted: passes — The authors put it forward as true.
- Checkable: passes — It can be checked against evidence.
- Load-bearing: passes — The paper’s conclusions depend on it.
- Based: passes — The paper gives a reason why it holds.
- Supported
The cited sources support only part of this claim — read each source’s verdict below.
In the paper
“To date, most pQTLs have been discovered via genome-wide association studies (GWASs), which predominantly focus on common variants3,5–8.”
§ Rare variant associations with plasma protein levels in the UK Biobank > Main
What the sources say
- Partly supportedcites [3] Pietzner, M. et al. Mapping the proteo-genomic convergence of human diseases. Science 374, eabj1541 (2021). sourceExperimental — accuracy not yet measured
The paper describes its own genome–proteome-wide association study as identifying pQTLs (Abstract) and says it concentrated on common genetic variation (Discussion; page unavailable). It does not establish the broader claim that most pQTLs discovered to date came from GWASs. (LLM, conf=0.84)
- Supportedcites [5] Sun, B. B. et al. Plasma proteomic associations with genetics and health in the UK Biobank. Nature https://doi.org/10.1038/s41586-023-06592-6 (2023). source
The Discovery of pQTLs section describes genome-wide mapping of 16.1 million variants and reports that only 5.5% of its primary associations had a minor allele frequency below 1%. The Cross-referencing with previously identified pQTLs section uses published proteomic GWAS and the GWAS Catalog to identify earlier discoveries. Together, these passages support the broad characterization, though they do not quantify the share of all historical pQTLs found by GWAS. (LLM, conf=0.84)
- Supportedcites [6] Sun, B. B. et al. Genomic atlas of the human plasma proteome. Nature 558, 73–79 (2018). source
The Methods section ('Replication of previous pQTLs'; page unavailable) treats GWAS as a source of previously reported pQTLs. The paper also reports a genome-wide association analysis finding 1,927 pQTLs; its 'Genetic architecture of the plasma proteome' section identifies only 23 rare-variant and 208 low-frequency-variant associations, consistent with a predominant focus on common variants. (LLM, conf=0.85)
- Partly supportedcites [7] Folkersen, L. et al. Genomic and drug target evaluation of 90 cardiovascular proteins in 30,931 individuals. Nat. Metab. 2, 1135–1148 (2020). sourceExperimental — accuracy not yet measured
The Results section, “Genome-wide meta-analysis of 90 proteins” (page unavailable), reports discovering hundreds of pQTLs through a GWAS meta-analysis, supporting GWAS as a pQTL discovery method. The paper does not establish that most pQTLs discovered to date came from GWAS or that GWAS predominantly focus on common variants; its Online Methods instead describe filtering by a minimum minor-allele count. (LLM, conf=0.79)
- Not checked — no full text of the sourcecites [8] Ferkingstad, E. et al. Large-scale integration of the plasma proteome with genetics and disease. Nat. Genet. 53, 1712–1721 (2021). source
plaincorrelational- Asserted: passes — The authors put it forward as true.
- Checkable: passes — It can be checked against evidence.
- Load-bearing: passes — The paper’s conclusions depend on it.
- Based: passes — The paper gives a reason why it holds.
- Partly supported
The cited sources support only part of this claim — read each source’s verdict below.
In the paper
“In a separate array-based GWAS on the UKB-PPP cohort, we tested for the association between common variants (MAF > 0.1%) and 2,922 protein assays, resulting in 14,287 primary genetic associations5.”
§ Rare variant associations with plasma protein levels in the UK Biobank > Variant-level associations
What the sources say
- Partly supportedcites [5] Sun, B. B. et al. Plasma proteomic associations with genetics and health in the UK Biobank. Nature https://doi.org/10.1038/s41586-023-06592-6 (2023). sourceExperimental — accuracy not yet measured
The 'Discovery of pQTLs' section reports testing 2,922 proteins and finding 14,287 primary associations, but those results came from a European-ancestry discovery subset of 34,557 participants, not the full UKB-PPP cohort. The 'Replication of pQTLs' section reports 23,588 primary associations for the full cohort. The methods describe imputed variants and a minor-allele-count filter, not the claimed MAF > 0.1% cutoff. (LLM, conf=0.88)
plaincorrelational- Asserted: passes — The authors put it forward as true.
- Checkable: passes — It can be checked against evidence.
- Load-bearing: passes — The paper’s conclusions depend on it.
- Based: passes — The paper gives a reason why it holds.
- Partly supported
Every source the paper cites for this claim was checked and supports it.
In the paper
“Using an n-of-one permutation analysis as previously described11, we identified P ≤ 1 × 10⁻⁸ as an appropriate P value threshold (Methods and Supplementary Table 3).”
§ Rare variant associations with plasma protein levels in the UK Biobank > Variant-level associations
What the sources say
- Supportedcites [11] Wang, Q. et al. Rare variant contribution to human disease in 281,104 UK Biobank exomes. Nature 597, 527–532 (2021). source
The citation attaches to “n-of-one permutation analysis as previously described,” not to the citing authors’ own choice of P ≤ 1 × 10⁻⁸. The source’s Methods section describes using an n-of-1 permutation to set significance thresholds. It chose P ≤ 2 × 10⁻⁹ for its own analyses; that difference does not undermine the method citation. (LLM, conf=0.92)
plain- Asserted: passes — The authors put it forward as true.
- Checkable: passes — It can be checked against evidence.
- Load-bearing: passes — The paper’s conclusions depend on it.
- Based: passes — The paper gives a reason why it holds.
- Supported
Every source the paper cites for this claim was checked and supports it.
In the paper
“The effect sizes (β) of nominally significant ExWAS pQTLs (P < 1 × 10⁻⁴) strongly correlated with the GWAS-derived pQTLs5 (r2 = 0.96; Supplementary Fig. 2).”
§ Rare variant associations with plasma protein levels in the UK Biobank > Variant-level associations
What the sources say
- Supportedcites [5] Sun, B. B. et al. Plasma proteomic associations with genetics and health in the UK Biobank. Nature https://doi.org/10.1038/s41586-023-06592-6 (2023). source
The citation is attached to “GWAS-derived pQTLs,” identifying the source of the comparison data. The source’s Discovery of pQTLs section reports genome-wide mapping of genetic variants to protein levels. The r² = 0.96 comparison is presented as the citing paper’s own Supplementary Fig. 2 result, not as a finding attributed to this source. (LLM, conf=0.90)
boostedcorrelational- Asserted: passes — The authors put it forward as true.
- Checkable: passes — It can be checked against evidence.
- Load-bearing: passes — The paper’s conclusions depend on it.
- Based: passes — The paper gives a reason why it holds.
- Supported
The sources with a verdict support this claim; the rest weren’t checked yet, have no full text we could read, or their verdicts aren’t rated yet.
In the paper
“ASGR1, which encodes a subunit of the asialoglycoprotein receptor, also emerged as a hotspot in the UKB-PPP GWAS and other large pQTL studies5,6,8.”
§ Rare variant associations with plasma protein levels in the UK Biobank > Gene-level protein abundance associations
What the sources say
- Supportedcites [5] Sun, B. B. et al. Plasma proteomic associations with genetics and health in the UK Biobank. Nature https://doi.org/10.1038/s41586-023-06592-6 (2023). source
Figure 2 labels ASGR1 with 359 associated protein targets; its caption explains that regions with more than 100 targets are labelled. This supports calling ASGR1 a hotspot in this paper’s UKB-PPP GWAS. The separate claim about other pQTL studies is accompanied by other citations and is not established by this paper’s figure. (LLM, conf=0.92)
- Could not verifycites [6] Sun, B. B. et al. Genomic atlas of the human plasma proteome. Nature 558, 73–79 (2018). sourceExperimental — accuracy not yet measured
The ‘trans pQTLs identify pathways to disease’ section describes twelve hotspot regions and names examples, but does not identify ASGR1 as one. Searches for ASGR1 and the asialoglycoprotein receptor found no passage in our copy establishing the claimed ASGR1 hotspot. (LLM, conf=0.72)
- Not checked — no full text of the sourcecites [8] Ferkingstad, E. et al. Large-scale integration of the plasma proteome with genetics and disease. Nat. Genet. 53, 1712–1721 (2021). source
plaincorrelational- Asserted: passes — The authors put it forward as true.
- Checkable: passes — It can be checked against evidence.
- Load-bearing: unclear — It is unclear whether the paper’s conclusions depend on it.
- Based: passes — The paper gives a reason why it holds.
- Supported
The cited sources support only part of this claim — read each source’s verdict below.
In the paper
“This likely reflects the enrichment of HBB PTVs in individuals of South Asian ancestries, as observed in our UKB PheWAS11.”
§ Rare variant associations with plasma protein levels in the UK Biobank > Pan-ancestry collapsing analysis
What the sources say
- Partly supportedcites [11] Wang, Q. et al. Rare variant contribution to human disease in 281,104 UK Biobank exomes. Nature 597, 527–532 (2021). sourceExperimental — accuracy not yet measured
The Pan-ancestry collapsing analysis reports a significant association between HBB protein-truncating variants and thalassaemia in participants of South Asian ancestry. It does not report that HBB PTVs are enriched in that group relative to other ancestries or connect them to an HBB–SLC16A1 association, so it supports only part of the attributed explanation. (LLM, conf=0.83)
hedgedconditional- Asserted: passes — The authors put it forward as true.
- Checkable: passes — It can be checked against evidence.
- Load-bearing: unclear — It is unclear whether the paper’s conclusions depend on it.
- Based: passes — The paper gives a reason why it holds.
- Partly supported
Every source the paper cites for this claim was checked and supports it.
In the paper
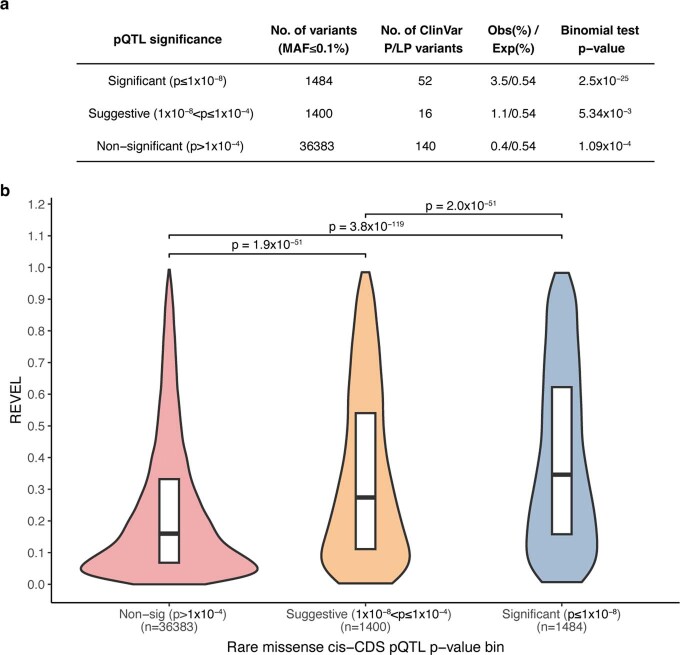
“We found a significant enrichment of ClinVar15 pathogenic and likely pathogenic variants among the 1,484 significant rare missense and in-frame indel cis-CDS pQTLs (observed: 3.5%; expected: 0.54%; two-tail binomial P = 2.5 × 10⁻²⁵; Extended Data Fig. 3a).”
§ Rare variant associations with plasma protein levels in the UK Biobank > Assessing epitope effects
What the sources say
- Supportedcites [15] Landrum, M. J. et al. ClinVar: improving access to variant interpretations and supporting evidence. Nucleic Acids Res. 46, D1062–D1067 (2018). source
The Introduction describes ClinVar as an archive of human variants and interpretations of their clinical significance, and ‘Improvements to Searching ClinVar’ discusses its pathogenic classifications (pages not specified). The citation identifies the source of the variant classifications; the enrichment and statistical figures are presented as the citing authors’ own findings, not attributed to this paper. (LLM, conf=0.90)
plaincorrelational- Asserted: passes — The authors put it forward as true.
- Checkable: passes — It can be checked against evidence.
- Load-bearing: passes — The paper’s conclusions depend on it.
- Based: passes — The paper gives a reason why it holds.
- Supported
The cited sources that could be checked couldn’t confirm or dispute this claim.
In the paper
“For example, PTVs in EPOR, encoding the erythropoietin receptor, were associated with increased erythropoietin, an example of compensatory upregulation (‘ptv’ model; P = 3.5 × 10⁻²⁴; β = 1.78; 95% confidence interval (CI), 1.43 to 2.12)28.”
§ Rare variant associations with plasma protein levels in the UK Biobank > Gene-level protein abundance associations
What the sources say
- Could not verifycites [28] Harlow, C. E. et al. Identification and single-base gene-editing functional validation of a cis-EPO variant as a genetic predictor for EPO-increasing therapies. Am. J. Hum. Genet. 109, 1638–1652 (2022). sourceExperimental — accuracy not yet measured
The Results (Table 1; page unavailable) report an association between a cis-EPO variant and circulating EPO levels, not an analysis of protein-truncating variants in EPOR. Searches of our copy for EPOR, protein-truncating variants, compensatory upregulation, and the stated P value found no passage reporting the claimed association or statistics. (LLM, conf=0.76)
plaincorrelational- Asserted: passes — The authors put it forward as true.
- Checkable: passes — It can be checked against evidence.
- Load-bearing: passes — The paper’s conclusions depend on it.
- Based: passes — The paper gives a reason why it holds.
- Could not verify
The cited sources that could be checked couldn’t confirm or dispute this claim.
In the paper
“Ten of the 20 PTVs associated with increased protein abundances (50%) were predicted to escape nonsense-mediated decay because they occurred within the last exon, the penultimate exon within 50 base pairs (bp) of the 3′ junction or the first exon within the first 200 nucleotides of the coding sequence12.”
§ Rare variant associations with plasma protein levels in the UK Biobank > Variant-level associations
What the sources say
- Could not verifycites [12] Coban-Akdemir, Z. et al. Identifying genes whose mutant transcripts cause dominant disease traits by potential gain-of-function alleles. Am. J. Hum. Genet. 103, 171–187 (2018). sourceExperimental — accuracy not yet measured
The supplied passage has no section or page label and contains only links, not findings about protein abundance or nonsense-mediated decay. Searches for the 10-of-20 PTV count and the stated exon-position criteria returned the same links, so our copy does not verify the claim. (LLM, conf=0.75)
plaincorrelational- Asserted: passes — The authors put it forward as true.
- Checkable: passes — It can be checked against evidence.
- Load-bearing: unclear — It is unclear whether the paper’s conclusions depend on it.
- Based: passes — The paper gives a reason why it holds.
- Could not verify
- Probably not a substantial claim. 43
- It may state two separate claims as one. 36
The cited sources support only part of this claim — read each source’s verdict below.
In the paper
“Integrating human genomics and proteomics can help elucidate disease mechanisms, identify clinical biomarkers and discover drug targets1–4.”
§ Rare variant associations with plasma protein levels in the UK Biobank > Abstract
What the sources say
- Not checked — no full text of the sourcecites [1] Suhre, K., McCarthy, M. I. & Schwenk, J. M. Genetics meets proteomics: perspectives for large population-based studies. Nat. Rev. Genet. 22, 19–37 (2021). source
- Partly supportedcites [2] Zheng, J. et al. Phenome-wide Mendelian randomization mapping the influence of the plasma proteome on complex diseases. Nat. Genet. 52, 1122–1131 (2020). sourceExperimental — accuracy not yet measured
The Discussion (page unavailable) says that combining genetic instruments for plasma proteins with disease-phenotype data can reveal potentially causal associations and help prioritize drug targets. That supports the disease-mechanism and drug-target parts of the claim. The paper does not report identifying clinical biomarkers; the only retrieved use of “biomarkers” is in a reference title. (LLM, conf=0.87)
- Partly supportedcites [3] Pietzner, M. et al. Mapping the proteo-genomic convergence of human diseases. Science 374, eabj1541 (2021). sourceExperimental — accuracy not yet measured
The paper’s Discussion describes the integration of proteomic and genomic data as providing mechanistic understanding and identifying potential causal disease genes. Its introductory passage also links the approach to drug-target discovery. The passages found do not say that this integration identifies clinical biomarkers; the Results mention biomarkers measured in biobanks, but not their discovery through this approach. (LLM, conf=0.86)
- Supportedcites [4] Png, G. et al. Mapping the serum proteome to neurological diseases using whole genome sequencing. Nat. Commun. 12, 7042 (2021). source
The Introduction says the combined protein and genetic analysis aimed to identify biomarkers, clarify disease pathways, and find drug opportunities. The Results’ Drug target evaluation links proteins with genetic evidence for disease to potential treatments, supporting the broad claim about drug-target discovery. Our copy provides section labels but no page numbers for these passages. (LLM, conf=0.90)
plainconditional- Asserted: passes — The authors put it forward as true.
- Checkable: fails — It may be too vague to check against evidence.
- Load-bearing: passes — The paper’s conclusions depend on it.
- Based: passes — The paper gives a reason why it holds.
Probably not a substantial claim. It may be too vague to check against evidence. It may state two separate claims as one.
The cited sources support only part of this claim — read each source’s verdict below.
In the paper
“Of the 37 GNPTAB trans-CDS pQTLs detected in the collapsing model, 35 (95%) are lysosomal proteins25,26, 18 of which have been associated with other LSDs (Supplementary Table 9).”
§ Rare variant associations with plasma protein levels in the UK Biobank > Gene-level protein abundance associations
What the sources say
- Partly supportedcites [25] Ponnaiyan, S., Akter, F., Singh, J. & Winter, D. Comprehensive draft of the mouse embryonic fibroblast lysosomal proteome by mass spectrometry based proteomics. Sci. Data 7, 68 (2020). sourceExperimental — accuracy not yet measured
The Methods (Data processing – DDA) describe a curated lysosomal-protein list, and Technical Validation (Draft map of the MEF lysosomal proteome) reports 740 proteins of known lysosomal origin. This supports using the paper to identify lysosomal proteins, the part to which the citation is attached. The paper does not report GNPTAB pQTLs or establish that 35 of the citing study’s 37 proteins are lysosomal; the 18 associated with other LSDs is attributed to the citing study’s Supplementary Table 9, not this citation. (LLM, conf=0.82)
- Partly supportedcites [26] Mosen, P., Sanner, A., Singh, J. & Winter, D. Targeted quantification of the lysosomal proteome in complex samples. Proteomes https://doi.org/10.3390/proteomes9010004 (2021). sourceExperimental — accuracy not yet measured
Section 3.3 (PRM Assay Development; page unavailable) describes a reference list of 374 lysosomal proteins, supporting the use of this paper to identify proteins as lysosomal. Our copy does not identify the 35 GNPTAB-associated proteins or establish that 35 of the 37 pQTL proteins are on that list. The 18 LSD associations are attributed to the citing paper’s Supplementary Table 9, not to this source. (LLM, conf=0.78)
plaincorrelational- Asserted: passes — The authors put it forward as true.
- Checkable: passes — It can be checked against evidence.
- Load-bearing: passes — The paper’s conclusions depend on it.
- Based: passes — The paper gives a reason why it holds.
It may state two separate claims as one.
- Partly supported
The sources with a verdict support this claim; the rest weren’t checked yet, have no full text we could read, or their verdicts aren’t rated yet.
In the paper
“Identifying allelic series, in which multiple variants in a gene associate with a phenotype with varying effect sizes, can help prioritize candidate drug targets13,14.”
§ Rare variant associations with plasma protein levels in the UK Biobank > Variant-level associations
What the sources say
- Not checked — no full text of the sourcecites [13] Plenge, R. M., Scolnick, E. M. & Altshuler, D. Validating therapeutic targets through human genetics. Nat. Rev. Drug. Discov. 12, 581–594 (2013). source
- Supportedcites [14] Nag, A. et al. Human genetics uncovers MAP3K15 as an obesity-independent therapeutic target for diabetes. Sci. Adv. 8, eadd5430 (2022). source
The Results (MAP3K15 variant-level analyses; page not provided) identify a potential allelic series: different MAP3K15 variants have differing effects on diabetes risk. The Discussion says that protective loss-of-function mutations present therapeutic targets and identifies MAP3K15 as one, supporting the claim that such genetic evidence can help prioritize a candidate target. (LLM, conf=0.88)
plainconditional- Asserted: passes — The authors put it forward as true.
- Checkable: passes — It can be checked against evidence.
- Load-bearing: passes — The paper’s conclusions depend on it.
- Based: passes — The paper gives a reason why it holds.
Probably not a substantial claim.
The cited sources support only part of this claim — read each source’s verdict below.
In the paper
“Including individuals of non-European ancestries in genetic studies promotes healthcare equity and boosts genetic discoveries11,30.”
§ Rare variant associations with plasma protein levels in the UK Biobank > Pan-ancestry collapsing analysis
What the sources say
- Supportedcites [11] Wang, Q. et al. Rare variant contribution to human disease in 281,104 UK Biobank exomes. Nature 597, 527–532 (2021). source
The Pan-ancestry collapsing analysis section explicitly states that including individuals from non-European ancestries is crucial for health-care equity and genetic discovery. It also reports 26 significant gene–phenotype associations found in the pan-ancestry analysis that were not significant in the European-only analyses. (LLM, conf=0.95)
- Partly supportedcites [30] Petrovski, S. & Goldstein, D. B. Unequal representation of genetic variation across ancestry groups creates healthcare inequality in the application of precision medicine. Genome Biol. 17, 157 (2016). sourceExperimental — accuracy not yet measured
The Conclusions (page unavailable) say that increasing ancestry diversity in sequenced reference cohorts improves genomic interpretation for non-European individuals and helps prevent healthcare inequalities. The paper also describes improved identification of candidate variants, but it does not establish the broader claim that inclusion boosts genetic discoveries. (LLM, conf=0.82)
plaindirectn = 49,736- Asserted: passes — The authors put it forward as true.
- Checkable: fails — It may be too vague to check against evidence.
- Load-bearing: passes — The paper’s conclusions depend on it.
- Based: passes — The paper gives a reason why it holds.
Probably not a substantial claim. It may be too vague to check against evidence. It may state two separate claims as one.
- Supported
The sources with a verdict support this claim; the rest weren’t checked yet, have no full text we could read, or their verdicts aren’t rated yet.
In the paper
“Prosaposin and progranulin are key regulators of lysosomal function, and recessive mutations in either gene can cause separate LSDs32,33.”
§ Rare variant associations with plasma protein levels in the UK Biobank > Protein–protein interactions
What the sources say
- Supportedcites [32] Kretz, K. A. et al. Characterization of a mutation in a family with saposin B deficiency: a glycosylation site defect. Proc. Natl Acad. Sci. USA 87, 2541–2544 (1990). source
The abstract (p. 2541) identifies prosaposin as the precursor of saposins required for lysosomal sphingolipid hydrolysis. It reports a disease-causing mutation in prosaposin cDNA in a family with autosomal-recessive saposin B deficiency. This supports the prosaposin portion of the jointly cited sentence; the paper is not being relied on here for the progranulin portion. (LLM, conf=0.91)
- Not checked — no full text of the sourcecites [33] Smith, K. R. et al. Strikingly different clinicopathological phenotypes determined by progranulin-mutation dosage. Am. J. Hum. Genet. 90, 1102–1107 (2012). source
plaindirect- Asserted: passes — The authors put it forward as true.
- Checkable: passes — It can be checked against evidence.
- Load-bearing: fails — The paper’s conclusions may not depend on it.
- Based: passes — The paper gives a reason why it holds.
Probably not a substantial claim. The paper’s conclusions may not depend on it. It may state two separate claims as one.
- Supported
The cited sources support only part of this claim — read each source’s verdict below.
In the paper
“In total, 13 of the 14 cis-CDS pQTLs (93%) replicated in the biomarker ExWAS (P ≤ 1 × 10⁻⁸), with effect sizes showing complete directional concordance (Supplementary Table 6).”
§ Rare variant associations with plasma protein levels in the UK Biobank > Assessing epitope effects
What the sources say
- Partly supportedcites [11] Wang, Q. et al. Rare variant contribution to human disease in 281,104 UK Biobank exomes. Nature 597, 527–532 (2021). sourceExperimental — accuracy not yet measured
The Variant-level associations section describes an ExWAS that included quantitative phenotypes, and the Methods > ExWAS analyses section explains its significance threshold (page numbers unavailable). These passages support identifying the cited work as an ExWAS, but our copy does not report that 13 of 14 cis-CDS pQTLs replicated, the five Olink proteins, immunoturbidimetric measurements, or complete directional concordance. (LLM, conf=0.84)
- Could not verifycites [17] Nag, A. et al. Effects of protein-coding variants on blood metabolite measurements and clinical biomarkers in the UK Biobank. Am. J. Hum. Genet. 110, 487–498 (2023). sourceExperimental — accuracy not yet measured
The Material and methods section specifies a p < 1 × 10⁻⁸ threshold for ExWAS, but that does not establish the claimed replication result. Searches for Olink, cis-CDS pQTLs, immunoturbidimetric assays, 13 of 14 replications, and directional concordance found no passage in our copy reporting those findings. The indexed passages provide section labels but no page numbers. (LLM, conf=0.72)
plaincorrelational- Asserted: passes — The authors put it forward as true.
- Checkable: passes — It can be checked against evidence.
- Load-bearing: passes — The paper’s conclusions depend on it.
- Based: passes — The paper gives a reason why it holds.
It may state two separate claims as one.
- Partly supported
The cited sources support only part of this claim — read each source’s verdict below.
In the paper
“Prosaposin heterodimerizes with progranulin, regulating its levels and facilitating its transport to the lysosome35,36.”
§ Rare variant associations with plasma protein levels in the UK Biobank > Protein–protein interactions
What the sources say
- Partly supportedcites [35] Zhou, X., Sullivan, P. M., Sun, L. & Hu, F. The interaction between progranulin and prosaposin is mediated by granulins and the linker region between saposin B and C. J. Neurochem. 143, 236–243 (2017). sourceExperimental — accuracy not yet measured
The Abstract reports that prosaposin physically interacts with progranulin and helps target it to lysosomes. The Introduction says PSAP polymorphisms affect plasma progranulin levels. The paper describes a complex, but the cited passages do not establish that it is specifically a heterodimer. (LLM, conf=0.83)
- Partly supportedcites [36] Nicholson, A. M. et al. Prosaposin is a regulator of progranulin levels and oligomerization. Nat. Commun. 7, 11992 (2016). sourceExperimental — accuracy not yet measured
The Results (PSAP–PGRN interaction; page unavailable) show that prosaposin binds progranulin, and the paper reports that prosaposin regulates progranulin levels. But the Results describe a prosaposin–progranulin heterodimer as a possibility, not an established fact. The Discussion (page unavailable) says prosaposin itself is transported to lysosomes; it does not establish that prosaposin facilitates progranulin’s transport there. (LLM, conf=0.90)
plaindirect- Asserted: passes — The authors put it forward as true.
- Checkable: passes — It can be checked against evidence.
- Load-bearing: unclear — It is unclear whether the paper’s conclusions depend on it.
- Based: passes — The paper gives a reason why it holds.
It may state two separate claims as one.
- Partly supported
The cited sources support only part of this claim — read each source’s verdict below.
In the paper
“STAB1 and STAB2 are located on different chromosomes (3 and 12, respectively), but both encode related scavenger receptors expressed on macrophages and liver sinusoidal endothelial cells that mediate the clearance of aged plasma proteins and other waste molecules21,22.”
§ Rare variant associations with plasma protein levels in the UK Biobank > Gene-level protein abundance associations
What the sources say
- Partly supportedcites [21] Schledzewski, K. et al. Deficiency of liver sinusoidal scavenger receptors stabilin-1 and -2 in mice causes glomerulofibrotic nephropathy via impaired hepatic clearance of noxious blood factors. J. Clin. Invest. 121, 703–714 (2011). sourceExperimental — accuracy not yet measured
Split into 2 atoms — 0 confirmed, 2 partially supported, 0 disputed, 0 misattributed, 0 unverifiable. Expand the claim to see per-atom verdicts.
- Partly supportedcites [22] Manta, C. P. et al. Targeting of scavenger receptors Stabilin-1 and Stabilin-2 ameliorates atherosclerosis by a plasma proteome switch mediating monocyte/macrophage suppression. Circulation 146, 1783–1799 (2022). sourceExperimental — accuracy not yet measured
Split into 2 atoms — 0 confirmed, 1 partially supported, 0 disputed, 0 misattributed, 1 unverifiable. Expand the claim to see per-atom verdicts.
plaindirect- Asserted: passes — The authors put it forward as true.
- Checkable: passes — It can be checked against evidence.
- Load-bearing: fails — The paper’s conclusions may not depend on it.
- Based: passes — The paper gives a reason why it holds.
Probably not a substantial claim. The paper’s conclusions may not depend on it. It may state two separate claims as one.
- Partly supported
Every source the paper cites for this claim was checked and supports it.
In the paper
“Here, we used ten QV models introduced in our previous UKB phenome-wide association study (PheWAS), including one synonymous variant model as an empirical negative control11 (Extended Data Table 1; www.azphewas.com).”
§ Rare variant associations with plasma protein levels in the UK Biobank > Gene-level protein abundance associations
What the sources say
- Supportedcites [11] Wang, Q. et al. Rare variant contribution to human disease in 281,104 UK Biobank exomes. Nature 597, 527–532 (2021). source
The ‘Rare variant collapsing analyses’ section reports 12 qualifying-variant models, including a synonymous model used as an empirical negative control; Methods (‘Collapsing analyses’) confirms this. The citing sentence says its authors used ten models introduced in that study, not that the earlier study had only ten. (LLM, conf=0.88)
plain- Asserted: passes — The authors put it forward as true.
- Checkable: passes — It can be checked against evidence.
- Load-bearing: fails — The paper’s conclusions may not depend on it.
- Based: passes — The paper gives a reason why it holds.
Probably not a substantial claim. The paper’s conclusions may not depend on it. It may state two separate claims as one.
- Supported
Every source the paper cites for this claim was checked and supports it.
In the paper
“These results are consistent with the well-established association between CH and immune dysfunction55.”
§ Rare variant associations with plasma protein levels in the UK Biobank > Clonal haematopoiesis pQTLs
What the sources say
- Supportedcites [55] Belizaire, R., Wong, W. J., Robinette, M. L. & Ebert, B. L. Clonal haematopoiesis and dysregulation of the immune system. Nat. Rev. Immunol. https://doi.org/10.1038/s41577-023-00843-3 (2023). source
The Future directions section states that immune cells harbouring clonal mutations drive immune dysfunction. The Introduction also describes associations and mechanistic connections between CH and dysregulated immune-cell function. These passages support the cited background association; no page numbers are provided in our copy. (LLM, conf=0.94)
boostedcorrelational- Asserted: passes — The authors put it forward as true.
- Checkable: passes — It can be checked against evidence.
- Load-bearing: fails — The paper’s conclusions may not depend on it.
- Based: passes — The paper gives a reason why it holds.
Probably not a substantial claim. The paper’s conclusions may not depend on it.
- Supported
Every source the paper cites for this claim was checked and supports it.
In the paper
“Roughly 30% of patients with acute myeloid leukaemia carry FLT3-activating mutations, the presence of which portends poor outcomes48.”
§ Rare variant associations with plasma protein levels in the UK Biobank > Clonal haematopoiesis pQTLs
What the sources say
- Supportedcites [48] Ravandi, F. et al. Outcome of patients with FLT3-mutated acute myeloid leukemia in first relapse. Leuk. Res. 34, 752–756 (2010). source
The Introduction states that FLT3 mutations occur in approximately 30% of patients with newly diagnosed AML and describes an association with poor prognosis. The Initial induction regimens section reports shorter disease-free and overall survival among patients with FLT3-mutated AML than among those with wild-type FLT3. (LLM, conf=0.90)
plaincorrelational- Asserted: passes — The authors put it forward as true.
- Checkable: passes — It can be checked against evidence.
- Load-bearing: fails — The paper’s conclusions may not depend on it.
- Based: passes — The paper gives a reason why it holds.
Probably not a substantial claim. The paper’s conclusions may not depend on it. It may state two separate claims as one.
- Supported
Every source the paper cites for this claim was checked and supports it.
In the paper
“There are FLT3 inhibitors that improve the survival of patients with acute myeloid leukaemia49,50.”
§ Rare variant associations with plasma protein levels in the UK Biobank > Clonal haematopoiesis pQTLs
What the sources say
- Supportedcites [49] Perl, A. E. et al. Gilteritinib or chemotherapy for relapsed or refractory FLT3-mutated AML. N. Engl. J. Med. 381, 1728–1740 (2019). source
The Efficacy section (page not supplied) reports significantly longer overall survival with the FLT3 inhibitor gilteritinib than with chemotherapy: 9.3 versus 5.6 months. The trial studied patients with relapsed or refractory FLT3-mutated AML, providing an example that supports the citing sentence’s claim. (LLM, conf=0.92)
- Supportedcites [50] Stone, R. M. et al. Midostaurin plus chemotherapy for acute myeloid leukemia with a FLT3 mutation. N. Engl. J. Med. 377, 454–464 (2017). source
The Discussion reports that adding the FLT3 inhibitor midostaurin to chemotherapy lowered the risk of death by 22% compared with chemotherapy plus placebo. The finding applies to patients aged 18–59 with AML and a FLT3 mutation, providing an example of an inhibitor that improves survival in this patient group. (LLM, conf=0.91)
plaindirect- Asserted: passes — The authors put it forward as true.
- Checkable: passes — It can be checked against evidence.
- Load-bearing: passes — The paper’s conclusions depend on it.
- Based: passes — The paper gives a reason why it holds.
Probably not a substantial claim.
- Supported
Every source the paper cites for this claim was checked and supports it.
In the paper
“We excluded from analyses 118 (0.025%) sequences that achieved a VerifyBAMID freemix (contamination) level of 4% or higher68, and an additional five sequences (0.001%) where less than 94.5% of the CCDS (release 22) achieved a minimum of tenfold read depth69.”
§ Rare variant associations with plasma protein levels in the UK Biobank > Methods > Implementing the 470,000 missense pQTL-augmented PheWAS
What the sources say
- Supportedcites [68] Jun, G. et al. Detecting and estimating contamination of human DNA samples in sequencing and array-based genotype data. Am. J. Hum. Genet. 91, 839–848 (2012). source
The Methods (Introduction; page unavailable) describe estimating the fraction of sequence reads contributed by contaminating DNA, and the Web Resources list the authors’ contamination-detection software package. Citation 68 supports the contamination-estimation method; the exclusion counts and 4% cutoff are the citing authors’ own quality-control choices, while the CCDS depth criterion carries a separate citation. (LLM, conf=0.84)
- Supportedcites [69] Pujar, S. et al. Consensus coding sequence (CCDS) database: a standardized set of human and mouse protein-coding regions supported by expert curation. Nucleic Acids Res. 46, D221–D228 (2018). source
The citation is attached to CCDS as the reference used for the read-depth threshold, not to the citing authors’ sequence exclusions. The Growth of the CCDS Dataset section identifies and describes the CCDS dataset. The source discusses releases 20 and 21, rather than documenting the cited use of release 22. (LLM, conf=0.86)
plain- Asserted: passes — The authors put it forward as true.
- Checkable: passes — It can be checked against evidence.
- Load-bearing: fails — The paper’s conclusions may not depend on it.
- Based: passes — The paper gives a reason why it holds.
Probably not a substantial claim. The paper’s conclusions may not depend on it. It may state two separate claims as one.
- Supported
Every source the paper cites for this claim was checked and supports it.
In the paper
“To demonstrate this, we examined the trans associations with a splice variant in HSD17B13 (rs72613567), known to protect against chronic liver disease42.”
§ Rare variant associations with plasma protein levels in the UK Biobank > Biomarker discovery
What the sources say
- Supportedcites [42] Abul-Husn, N. S. et al. A protein-truncating HSD17B13 variant and protection from chronic liver disease. N. Engl. J. Med. 378, 1096–1106 (2018). source
The Discussion says that the HSD17B13 rs72613567:TA allele is associated with reduced risk of alcoholic and nonalcoholic liver disease and suggests that it protects against progression to advanced stages of chronic liver disease. The Results also report reduced risks of liver disease and cirrhosis among carriers. (LLM, conf=0.93)
boosteddirect- Asserted: passes — The authors put it forward as true.
- Checkable: passes — It can be checked against evidence.
- Load-bearing: fails — The paper’s conclusions may not depend on it.
- Based: passes — The paper gives a reason why it holds.
Probably not a substantial claim. The paper’s conclusions may not depend on it.
- Supported
Every source the paper cites for this claim was checked and supports it.
In the paper
“The most prevalent JAK2 missense variant associated with CH and myeloproliferative disorders (V617F) is thought to promote venous thrombosis by activating this pathway46.”
§ Rare variant associations with plasma protein levels in the UK Biobank > Clonal haematopoiesis pQTLs
What the sources say
- Supportedcites [46] Edelmann, B. et al. JAK2-V617F promotes venous thrombosis through β1/β2 integrin activation. J. Clin. Invest. 128, 4359–4371 (2018). source
The Introduction reports that JAK2-V617F increases β2 integrin activity and that blocking β2 integrins suppresses pathological thrombosis in a mouse model. The Discussion likewise concludes that JAK2-V617F activates β1 and β2 integrin signaling in leukocytes. The citation supports the proposed thrombosis pathway; it does not imply that β2 is the only integrin involved. (LLM, conf=0.92)
hedgedconditional- Asserted: passes — The authors put it forward as true.
- Checkable: passes — It can be checked against evidence.
- Load-bearing: fails — The paper’s conclusions may not depend on it.
- Based: passes — The paper gives a reason why it holds.
Probably not a substantial claim. The paper’s conclusions may not depend on it.
- Supported
The cited sources support only part of this claim — read each source’s verdict below.
In the paper
“PTVs in this gene are a well-established cause of erythrocytosis57.”
§ Rare variant associations with plasma protein levels in the UK Biobank > pQTL-augmented PheWAS
What the sources say
- Partly supportedcites [57] Zmajkovic, J. et al. A gain-of-function mutation in EPO in familial erythrocytosis. N. Engl. J. Med. 378, 924–930 (2018). sourceExperimental — accuracy not yet measured
The Summary and Discussion describe two EPO frameshift variants associated with familial erythrocytosis. But the paper presents them as a newly identified, unusual gain-of-function mechanism—not as evidence that protein-truncating variants in EPO are a well-established cause of erythrocytosis. The discussion on p. 930 says EPO mutations should be considered when investigating inherited erythrocytosis. (LLM, conf=0.88)
boosteddirect- Asserted: passes — The authors put it forward as true.
- Checkable: passes — It can be checked against evidence.
- Load-bearing: fails — The paper’s conclusions may not depend on it.
- Based: passes — The paper gives a reason why it holds.
Probably not a substantial claim. The paper’s conclusions may not depend on it.
- Partly supported
Every source the paper cites for this claim was checked and supports it.
In the paper
“We used the ukb_gen_samples_to_remove() function from the R package ukbtools v.0.11.3 (ref. 71) to choose a subset of individuals within which no pair had a kinship coefficient exceeding 0.1769, to exclude predicted first-degree relatives.”
§ Rare variant associations with plasma protein levels in the UK Biobank > Methods > Implementing the 470,000 missense pQTL-augmented PheWAS
What the sources say
- Supportedcites [71] Hanscombe, K. B., Coleman, J. R. I., Traylor, M. & Lewis, C. M. ukbtools: an R package to manage and query UK Biobank data. PLoS ONE 14, e0214311 (2019). source
The Results > Genetic metadata passage identifies ukb_gen_samples_to_remove as a ukbtools function that selects samples to remove so that no pair exceeds a relatedness cutoff. The cited paper supports the method identification; the 0.1769 cutoff and number removed describe the citing authors’ application, not results attributed to this source. (LLM, conf=0.91)
plaindirect- Asserted: passes — The authors put it forward as true.
- Checkable: passes — It can be checked against evidence.
- Load-bearing: fails — The paper’s conclusions may not depend on it.
- Based: passes — The paper gives a reason why it holds.
Probably not a substantial claim. The paper’s conclusions may not depend on it.
- Supported
Every source the paper cites for this claim was checked and supports it.
In the paper
“We identified the participants with European genetic ancestry based on Peddy60 Pr(EUR) > 0.98 (n = 46,441).”
§ Rare variant associations with plasma protein levels in the UK Biobank > Methods > Olink proteogenomics study cohort
What the sources say
- Supportedcites [60] Pedersen, B. S. & Quinlan, A. R. Who’s who? Detecting and resolving sample anomalies in human DNA sequencing studies with Peddy. Am. J. Hum. Genet. 100, 406–413 (2017). source
The citation identifies Peddy as the tool used for ancestry prediction. The paper’s Materials and Methods section, “Ancestry Prediction,” describes how Peddy predicts individuals’ ancestry; the Pr(EUR) cutoff and participant count are the citing authors’ own analysis, not findings attributed to this source. (LLM, conf=0.91)
plainn = 46,441- Asserted: passes — The authors put it forward as true.
- Checkable: passes — It can be checked against evidence.
- Load-bearing: passes — The paper’s conclusions depend on it.
- Based: passes — The paper gives a reason why it holds.
Probably not a substantial claim.
- Supported
Every source the paper cites for this claim was checked and supports it.
In the paper
“we required that samples pass Olink NPX quality control as described in Sun et al.5, resulting in a test cohort reduction to 50,065 (96%).”
§ Rare variant associations with plasma protein levels in the UK Biobank > Methods > Olink proteogenomics study cohort
What the sources say
- Supportedcites [5] Sun, B. B. et al. Plasma proteomic associations with genetics and health in the UK Biobank. Nature https://doi.org/10.1038/s41586-023-06592-6 (2023). source
The Data processing and quality control section describes quality control of Olink proteomic measurements and says analyses used data after exclusions. The Additional information section explicitly refers to NPX quality-control procedures. The 50,065 (96%) figure describes the citing authors’ resulting test cohort, not a figure attributed to Sun et al. (LLM, conf=0.91)
plaindirect- Asserted: passes — The authors put it forward as true.
- Checkable: passes — It can be checked against evidence.
- Load-bearing: passes — The paper’s conclusions depend on it.
- Based: passes — The paper gives a reason why it holds.
Probably not a substantial claim.
- Supported
A result the paper reports from its own data — it cites no other source for it, so there is none to check. The quote shows it is in the paper.
In the paper
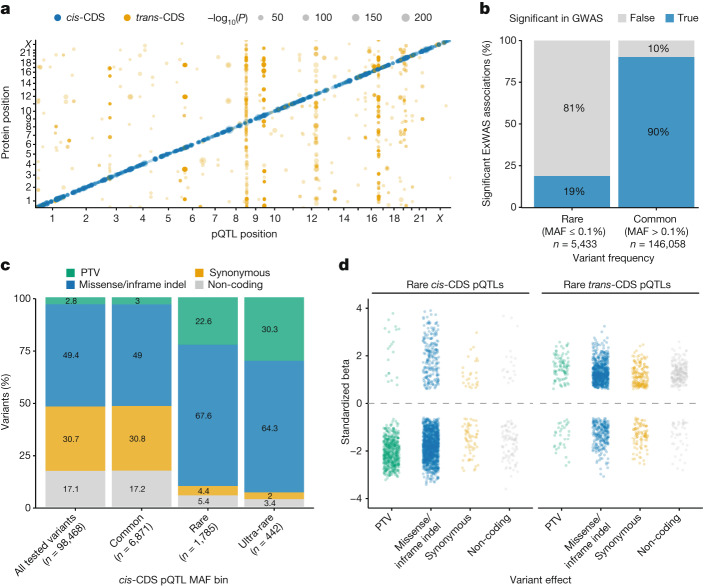
“In total, there were 151,491 significant genotype–protein associations, 5,433 of which corresponded to rare variants (MAF ≤ 0.1%).”
§ Rare variant associations with plasma protein levels in the UK Biobank > Variant-level associations
plaincorrelational- Asserted: passes — The authors put it forward as true.
- Checkable: passes — It can be checked against evidence.
- Load-bearing: passes — The paper’s conclusions depend on it.
- Based: passes — The paper gives a reason why it holds.
It may state two separate claims as one.
A result the paper reports from its own data — it cites no other source for it, so there is none to check. The quote shows it is in the paper.
In the paper
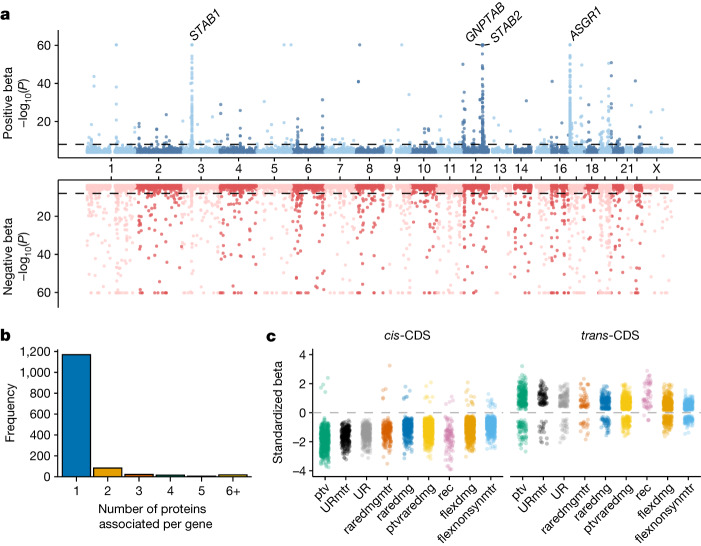
“Among these four proteins, 99% (n = 191) of the 193 trans-pQTLs had positive effect sizes compared with only 58% (n = 104 of 149 pQTLs) for the remaining 104 genes.”
§ Rare variant associations with plasma protein levels in the UK Biobank > Gene-level protein abundance associations
plaincorrelationaln = 191- Asserted: passes — The authors put it forward as true.
- Checkable: passes — It can be checked against evidence.
- Load-bearing: passes — The paper’s conclusions depend on it.
- Based: passes — The paper gives a reason why it holds.
It may state two separate claims as one.
A result the paper reports from its own data — it cites no other source for it, so there is none to check. The quote shows it is in the paper.
In the paper
“The flexdmg model accounted for 854 signals (19%), the ptvraredmg model accounted for 804 signals (18%) and the ptv model accounted for 691 signals (15%).”
§ Rare variant associations with plasma protein levels in the UK Biobank > Gene-level protein abundance associations
plain- Asserted: passes — The authors put it forward as true.
- Checkable: passes — It can be checked against evidence.
- Load-bearing: passes — The paper’s conclusions depend on it.
- Based: passes — The paper gives a reason why it holds.
It may state two separate claims as one.
A result the paper reports from its own data — it cites no other source for it, so there is none to check. The quote shows it is in the paper.
In the paper
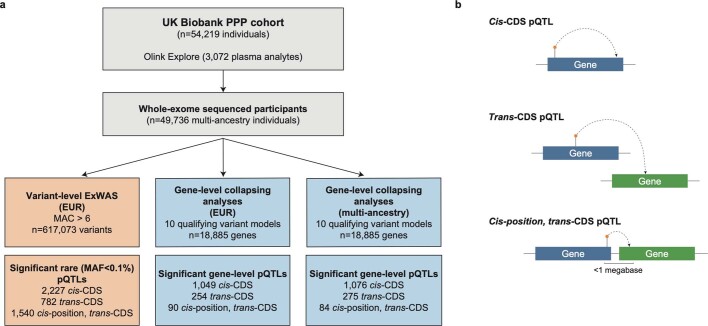
“The relative proportions of cis and trans associations were different among rare variants (MAF ≤ 0.1%), in which 2,227 (49.0%) were cis-CDS, 782 (17.2%) were trans-CDS and only 1,540 (33.8%) were cis-position, trans-CDS.”
§ Rare variant associations with plasma protein levels in the UK Biobank > Variant-level associations
plain- Asserted: passes — The authors put it forward as true.
- Checkable: passes — It can be checked against evidence.
- Load-bearing: passes — The paper’s conclusions depend on it.
- Based: passes — The paper gives a reason why it holds.
It may state two separate claims as one.
A result the paper reports from its own data — it cites no other source for it, so there is none to check. The quote shows it is in the paper.
In the paper
“The three NLRC4 pQTLs included one frameshift variant, one missense variant associated with reduced protein levels and one putatively gain-of-function missense variant associated with higher levels (Extended Data Table 2).”
§ Rare variant associations with plasma protein levels in the UK Biobank > Insights into allelic series
hedgedcorrelational- Asserted: passes — The authors put it forward as true.
- Checkable: passes — It can be checked against evidence.
- Load-bearing: passes — The paper’s conclusions depend on it.
- Based: passes — The paper gives a reason why it holds.
It may state two separate claims as one.
A result the paper reports from its own data — it cites no other source for it, so there is none to check. The quote shows it is in the paper.
In the paper
“Rare missense variants and in-frame indels also had more variable directions of effects than PTVs, although most still decreased protein abundances (n = 1,274 of 1,490; 86%).”
§ Rare variant associations with plasma protein levels in the UK Biobank > Variant-level associations
plaincorrelationaln = 1,274- Asserted: passes — The authors put it forward as true.
- Checkable: passes — It can be checked against evidence.
- Load-bearing: unclear — It is unclear whether the paper’s conclusions depend on it.
- Based: passes — The paper gives a reason why it holds.
It may state two separate claims as one.
A result the paper reports from its own data — it cites no other source for it, so there is none to check. The quote shows it is in the paper.
In the paper
“Trans associations were even more variable, with 26% (32 of 122) of PTVs and 26% (252 of 954) of missense variants/indels associated with decreased protein abundances (Fig. 1d).”
§ Rare variant associations with plasma protein levels in the UK Biobank > Variant-level associations
plaincorrelational- Asserted: passes — The authors put it forward as true.
- Checkable: passes — It can be checked against evidence.
- Load-bearing: unclear — It is unclear whether the paper’s conclusions depend on it.
- Based: passes — The paper gives a reason why it holds.
It may state two separate claims as one.
A result the paper reports from its own data — it cites no other source for it, so there is none to check. The quote shows it is in the paper.
In the paper
“Of the newly significant associations, 408 (54%) were cis, 327 (43%) were trans and 17 (2%) were cis-position, trans-gene (Supplementary Table 10).”
§ Rare variant associations with plasma protein levels in the UK Biobank > Pan-ancestry collapsing analysis
plaincorrelationaln = 49,736- Asserted: passes — The authors put it forward as true.
- Checkable: passes — It can be checked against evidence.
- Load-bearing: unclear — It is unclear whether the paper’s conclusions depend on it.
- Based: passes — The paper gives a reason why it holds.
It may state two separate claims as one.
A result the paper reports from its own data — it cites no other source for it, so there is none to check. The quote shows it is in the paper.
In the paper
“Of these, there were 1,962 unique gene–protein abundance associations, including 1,049 (53%) cis associations, 813 (41%) trans associations and 100 (5%) cis-position, trans-CDS signals.”
§ Rare variant associations with plasma protein levels in the UK Biobank > Gene-level protein abundance associations
plaincorrelationaln = 46,327- Asserted: passes — The authors put it forward as true.
- Checkable: passes — It can be checked against evidence.
- Load-bearing: passes — The paper’s conclusions depend on it.
- Based: passes — The paper gives a reason why it holds.
It may state two separate claims as one.
A result the paper reports from its own data — it cites no other source for it, so there is none to check. The quote shows it is in the paper.
In the paper
“Of the unique variants associated with at least one protein abundance measurement, 9,098 (18.7%) were cis-CDS, 14,127 (29.0%) were trans-CDS and 25,543 (52.3%) were cis-position, trans-CDS (Supplementary Table 2).”
§ Rare variant associations with plasma protein levels in the UK Biobank > Variant-level associations
plaincorrelational- Asserted: passes — The authors put it forward as true.
- Checkable: passes — It can be checked against evidence.
- Load-bearing: unclear — It is unclear whether the paper’s conclusions depend on it.
- Based: passes — The paper gives a reason why it holds.
It may state two separate claims as one.
A result the paper reports from its own data — it cites no other source for it, so there is none to check. The quote shows it is in the paper.
In the paper
“Of note, IL-6 and SCRIB also were measured on multiple panels, but we did not observe any cis-CDS pQTLs with a P < 1 × 10⁻⁴ for these proteins.”
§ Rare variant associations with plasma protein levels in the UK Biobank > Methods > ExWAS
plain- Asserted: passes — The authors put it forward as true.
- Checkable: passes — It can be checked against evidence.
- Load-bearing: fails — The paper’s conclusions may not depend on it.
- Based: passes — The paper gives a reason why it holds.
Probably not a substantial claim. The paper’s conclusions may not depend on it. It may state two separate claims as one.
A result the paper reports from its own data — it cites no other source for it, so there is none to check. The quote shows it is in the paper.
In the paper
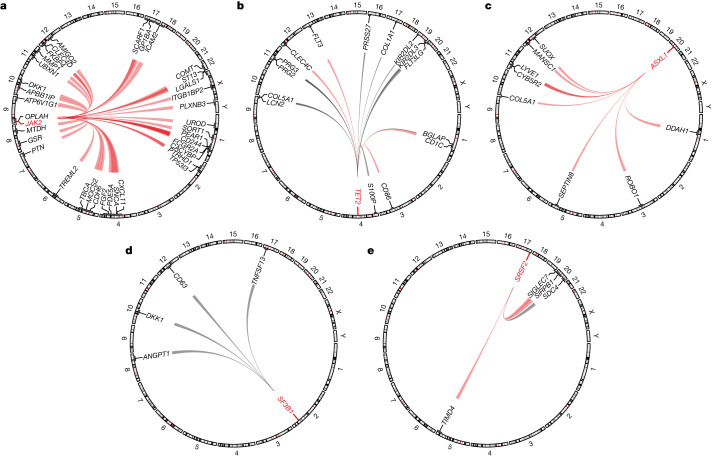
“COL5A1 was positively associated with ASXL1-CH (P = 1.6 × 10⁻¹²; β = 0.75; 95% CI, 0.54 to 0.96) and negatively associated with TET2-CH (P = 5.9 × 10⁻⁹; β = −0.35; 95% CI, −0.47 to −0.23) (Fig. 3b,c).”
§ Rare variant associations with plasma protein levels in the UK Biobank > Clonal haematopoiesis pQTLs
plaincorrelational- Asserted: passes — The authors put it forward as true.
- Checkable: passes — It can be checked against evidence.
- Load-bearing: passes — The paper’s conclusions depend on it.
- Based: passes — The paper gives a reason why it holds.
It may state two separate claims as one.
A result the paper reports from its own data — it cites no other source for it, so there is none to check. The quote shows it is in the paper.
In the paper
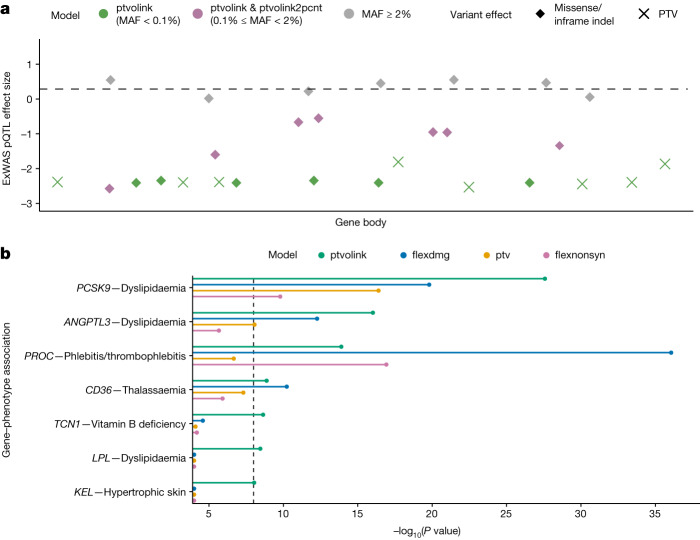
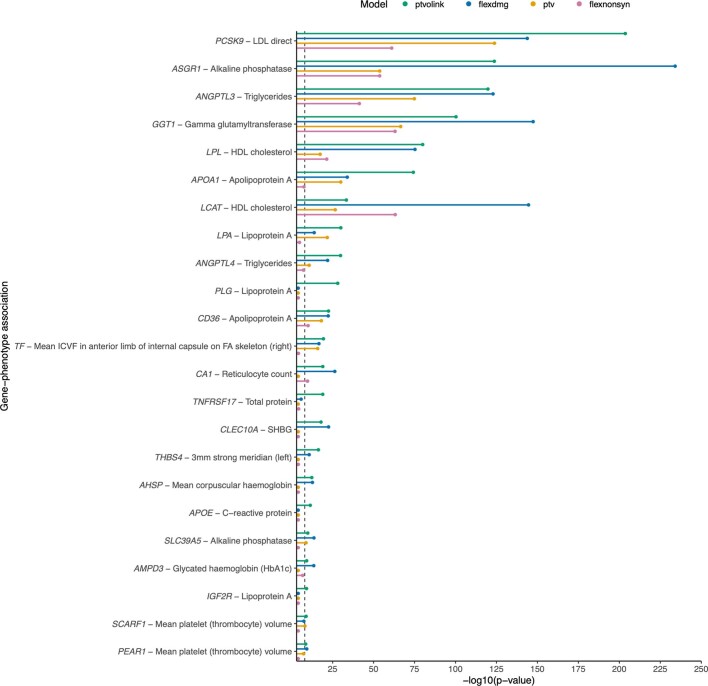
“Only two of the seven binary trait associations and ten of the 92 quantitative associations were more significant in the flexdmg model than in the ptvolink model.”
§ Rare variant associations with plasma protein levels in the UK Biobank > pQTL-augmented PheWAS
plain- Asserted: passes — The authors put it forward as true.
- Checkable: passes — It can be checked against evidence.
- Load-bearing: passes — The paper’s conclusions depend on it.
- Based: passes — The paper gives a reason why it holds.
It may state two separate claims as one.
A result the paper reports from its own data — it cites no other source for it, so there is none to check. The quote shows it is in the paper.
In the paper
“DKK1 was positively associated with JAK2-CH (P = 7.2 × 10⁻¹⁴; β = 1.57; 95% CI, 1.16 to 1.98) and negatively associated with SF3B1-CH (P = 1.8 × 10⁻¹⁰; β = −1.19; 95% CI, −0.47 to −0.23) (Fig. 3a,d).”
§ Rare variant associations with plasma protein levels in the UK Biobank > Clonal haematopoiesis pQTLs
plaincorrelational- Asserted: passes — The authors put it forward as true.
- Checkable: passes — It can be checked against evidence.
- Load-bearing: passes — The paper’s conclusions depend on it.
- Based: passes — The paper gives a reason why it holds.
It may state two separate claims as one.
A result the paper reports from its own data — it cites no other source for it, so there is none to check. The quote shows it is in the paper.
In the paper
“Somatic mutations in TET2 were associated with increased levels of the receptor tyrosine kinase FLT3 (P = 3.4 × 10⁻¹⁶; β = 0.50; 95% CI, 0.38 to 0.62) and decreased levels of the FLT3 ligand, FLT3LG (P = 6.4 × 10−64; β = −0.97; 95% CI, −1.08 to −0.86) (Fig. 3b).”
§ Rare variant associations with plasma protein levels in the UK Biobank > Clonal haematopoiesis pQTLs
plaincorrelational- Asserted: passes — The authors put it forward as true.
- Checkable: passes — It can be checked against evidence.
- Load-bearing: passes — The paper’s conclusions depend on it.
- Based: passes — The paper gives a reason why it holds.
It may state two separate claims as one.
A result the paper reports from its own data — it cites no other source for it, so there is none to check. The quote shows it is in the paper.
In the paper
“These associations included ACVRL1 and ENG with hereditary haemorrhagic telangiectasia, GRN with dementia, NOTCH1 with chronic lymphocytic leukaemia, PCSK9 and ANGPTL3 with dyslipidaemia, and others (Fig. 4b and Supplementary Table 15).”
§ Rare variant associations with plasma protein levels in the UK Biobank > pQTL-augmented PheWAS
plaincorrelational- Asserted: passes — The authors put it forward as true.
- Checkable: passes — It can be checked against evidence.
- Load-bearing: passes — The paper’s conclusions depend on it.
- Based: passes — The paper gives a reason why it holds.
It may state two separate claims as one.
The paper states this without a source or data behind it here, so there is nothing to check it against. The quote shows it is in the paper.
In the paper
“Many of these examples are well-established, including LPL and hyperlipidaemia, PROC and thrombophilia, and VWF and Von Willebrand’s disease.”
§ Rare variant associations with plasma protein levels in the UK Biobank > pQTL-augmented PheWAS
boostedcorrelational- Asserted: passes — The authors put it forward as true.
- Checkable: passes — It can be checked against evidence.
- Load-bearing: fails — The paper’s conclusions may not depend on it.
- Based: fails — The paper may give no reason why it holds.
Probably not a substantial claim. The paper’s conclusions may not depend on it. The paper may give no reason why it holds. It may state two separate claims as one.
A result the paper reports from its own data — it cites no other source for it, so there is none to check. The quote shows it is in the paper.
In the paper
“We detected 36 trans associations with JAK2-CH, 15 with TET2-CH, eight with ASXL1-CH and four each with SF3B1-CH and SRSF2-CH (Fig. 3a–e and Supplementary Table 13).”
§ Rare variant associations with plasma protein levels in the UK Biobank > Clonal haematopoiesis pQTLs
plaincorrelational- Asserted: passes — The authors put it forward as true.
- Checkable: passes — It can be checked against evidence.
- Load-bearing: passes — The paper’s conclusions depend on it.
- Based: passes — The paper gives a reason why it holds.
It may state two separate claims as one.
A result the paper reports from its own data — it cites no other source for it, so there is none to check. The quote shows it is in the paper.
In the paper
“Newly significant associations included PEAR1 (endothelial aggregation receptor) with decreased mean platelet volume (ptvolink2pcnt P = 6.9 × 10⁻²⁷; β = −0.26; 95% CI, −0.31 to −0.21) and CA1 (carbonic anhydrase) with increased reticulocyte count (P = 1.0 × 10⁻¹⁹; β = 0.40; 95% CI, 0.32 to 0.49).”
§ Rare variant associations with plasma protein levels in the UK Biobank > pQTL-augmented PheWAS
plaincorrelational- Asserted: passes — The authors put it forward as true.
- Checkable: passes — It can be checked against evidence.
- Load-bearing: passes — The paper’s conclusions depend on it.
- Based: passes — The paper gives a reason why it holds.
It may state two separate claims as one.
A result the paper reports from its own data — it cites no other source for it, so there is none to check. The quote shows it is in the paper.
In the paper
“Other examples include KEL with hypertrophic skin disorders, MICA with hypothyroidism, ANGPTL4 with hypercholesterolaemia, TNFRSF8 and protection from asthma and SPARC with special screening examinations (Fig. 4b and Supplementary Table 15).”
§ Rare variant associations with plasma protein levels in the UK Biobank > pQTL-augmented PheWAS
plaincorrelational- Asserted: passes — The authors put it forward as true.
- Checkable: passes — It can be checked against evidence.
- Load-bearing: unclear — It is unclear whether the paper’s conclusions depend on it.
- Based: passes — The paper gives a reason why it holds.
It may state two separate claims as one.
The paper states this without a source or data behind it here, so there is nothing to check it against. The quote shows it is in the paper.
In the paper
“Rarer protein-coding variants tend to confer larger biological effect sizes than common variants and are more directly interpretable.”
§ Rare variant associations with plasma protein levels in the UK Biobank > Main
plaindirect- Asserted: passes — The authors put it forward as true.
- Checkable: passes — It can be checked against evidence.
- Load-bearing: passes — The paper’s conclusions depend on it.
- Based: fails — The paper may give no reason why it holds.
Probably not a substantial claim. The paper may give no reason why it holds. It may state two separate claims as one.
The paper states this without a source or data behind it here, so there is nothing to check it against. The quote shows it is in the paper.
In the paper
“However, common variant associations are challenging to interpret because most are non-coding and tag linkage disequilibrium blocks.”
§ Rare variant associations with plasma protein levels in the UK Biobank > Main
plain- Asserted: passes — The authors put it forward as true.
- Checkable: passes — It can be checked against evidence.
- Load-bearing: passes — The paper’s conclusions depend on it.
- Based: passes — The paper gives a reason why it holds.
Probably not a substantial claim.
The paper states this without a source or data behind it here, so there is nothing to check it against. The quote shows it is in the paper.
In the paper
“Because the power to identify statistically significant variant-level associations decreases with allele frequency, we next tested rare variants in aggregate via gene-level collapsing analyses.”
§ Rare variant associations with plasma protein levels in the UK Biobank > Gene-level protein abundance associations
plaindirect- Asserted: passes — The authors put it forward as true.
- Checkable: passes — It can be checked against evidence.
- Load-bearing: passes — The paper’s conclusions depend on it.
- Based: passes — The paper gives a reason why it holds.
Probably not a substantial claim.
A conclusion the paper draws from its own results — it cites no other source for it, so there is none to check. The quote shows it is in the paper.
In the paper
“Moreover, all 37 proteins were increased in PTV carriers, suggesting reduced lysosomal targeting.”
§ Rare variant associations with plasma protein levels in the UK Biobank > Gene-level protein abundance associations
hedgeddirect- Asserted: passes — The authors put it forward as true.
- Checkable: passes — It can be checked against evidence.
- Load-bearing: passes — The paper’s conclusions depend on it.
- Based: passes — The paper gives a reason why it holds.
It may state two separate claims as one.
In the paper
“Haploinsufficiency of GRN is also associated with frontotemporal lobar degeneration34.”
§ Rare variant associations with plasma protein levels in the UK Biobank > Protein–protein interactions
What the sources say
- Not checked — no full text of the sourcecites [34] Baker, M. et al. Mutations in progranulin cause tau-negative frontotemporal dementia linked to chromosome 17. Nature 442, 916–919 (2006). source
plaincorrelational- Asserted: passes — The authors put it forward as true.
- Checkable: passes — It can be checked against evidence.
- Load-bearing: fails — The paper’s conclusions may not depend on it.
- Based: passes — The paper gives a reason why it holds.
Probably not a substantial claim. The paper’s conclusions may not depend on it.
A conclusion the paper draws from its own results — it cites no other source for it, so there is none to check. The quote shows it is in the paper.
In the paper
“This variant did not achieve a P < 1 × 10⁻⁴ in the biomarker ExWAS, and its effect was in the opposite direction, suggesting a possible epitope effect.”
§ Rare variant associations with plasma protein levels in the UK Biobank > Assessing epitope effects
hedged- Asserted: passes — The authors put it forward as true.
- Checkable: passes — It can be checked against evidence.
- Load-bearing: unclear — It is unclear whether the paper’s conclusions depend on it.
- Based: passes — The paper gives a reason why it holds.
It may state two separate claims as one.
The paper states this without a source or data behind it here, so there is nothing to check it against. The quote shows it is in the paper.
In the paper
“Genetic variants can theoretically affect antibody binding due to changes in protein conformation.”
§ Rare variant associations with plasma protein levels in the UK Biobank > Assessing epitope effects
plainconditional- Asserted: passes — The authors put it forward as true.
- Checkable: fails — It may be too vague to check against evidence.
- Load-bearing: passes — The paper’s conclusions depend on it.
- Based: fails — The paper may give no reason why it holds.
Probably not a substantial claim. It may be too vague to check against evidence. The paper may give no reason why it holds.
A conclusion the paper draws from its own results — it cites no other source for it, so there is none to check. The quote shows it is in the paper.
In the paper
“These results illustrate the importance of increasing genetic diversity in proteogenomic studies.”
§ Rare variant associations with plasma protein levels in the UK Biobank > Pan-ancestry collapsing analysis
plain- Asserted: passes — The authors put it forward as true.
- Checkable: fails — It may be too vague to check against evidence.
- Load-bearing: passes — The paper’s conclusions depend on it.
- Based: passes — The paper gives a reason why it holds.
Probably not a substantial claim. It may be too vague to check against evidence.
What the paper did — it cites no source for this, so there is none to check. The quote shows it is in the paper.
In the paper
“we performed an n-of-1 permutation on the full collapsing pQTL analysis.”
§ Rare variant associations with plasma protein levels in the UK Biobank > Methods > Collapsing analysis
plain- Asserted: passes — The authors put it forward as true.
- Checkable: passes — It can be checked against evidence.
- Load-bearing: passes — The paper’s conclusions depend on it.
- Based: passes — The paper gives a reason why it holds.
Probably not a substantial claim.
A conclusion the paper draws from its own results — it cites no other source for it, so there is none to check. The quote shows it is in the paper.
In the paper
“The second strongest association for SPARC was with basal cell carcinoma, suggesting that this signal arose from screening for skin cancer (ptvolink2pcnt P = 4.5 × 10⁻⁶; β = 2.9; 95% CI, 1.9 to 4.4).”
§ Rare variant associations with plasma protein levels in the UK Biobank > pQTL-augmented PheWAS
hedgedcorrelational- Asserted: passes — The authors put it forward as true.
- Checkable: passes — It can be checked against evidence.
- Load-bearing: unclear — It is unclear whether the paper’s conclusions depend on it.
- Based: passes — The paper gives a reason why it holds.
It may state two separate claims as one.
A conclusion the paper draws from its own results — it cites no other source for it, so there is none to check. The quote shows it is in the paper.
In the paper
“Including these cis-CDS missense pQTLs, which tended to have more modest effects on protein abundance than PTVs, resulted in weaker effect sizes but increased statistical power.”
§ Rare variant associations with plasma protein levels in the UK Biobank > pQTL-augmented PheWAS
plaindirect- Asserted: passes — The authors put it forward as true.
- Checkable: passes — It can be checked against evidence.
- Load-bearing: passes — The paper’s conclusions depend on it.
- Based: passes — The paper gives a reason why it holds.
It may state two separate claims as one.
What the paper did — it cites no source for this, so there is none to check. The quote shows it is in the paper.
In the paper
“We excluded 359 individuals diagnosed with a haematological malignancy predating sample collection”
§ Rare variant associations with plasma protein levels in the UK Biobank > Methods > Detecting CH somatic mutations
plainn = 359- Asserted: passes — The authors put it forward as true.
- Checkable: passes — It can be checked against evidence.
- Load-bearing: fails — The paper’s conclusions may not depend on it.
- Based: passes — The paper gives a reason why it holds.
Probably not a substantial claim. The paper’s conclusions may not depend on it.
What the paper did — it cites no source for this, so there is none to check. The quote shows it is in the paper.
In the paper
“and included body mass index (BMI) and pack years of smoking as additional covariates.”
§ Rare variant associations with plasma protein levels in the UK Biobank > Methods > Detecting CH somatic mutations
plain- Asserted: passes — The authors put it forward as true.
- Checkable: passes — It can be checked against evidence.
- Load-bearing: fails — The paper’s conclusions may not depend on it.
- Based: passes — The paper gives a reason why it holds.
Probably not a substantial claim. The paper’s conclusions may not depend on it.
What the paper did — it cites no source for this, so there is none to check. The quote shows it is in the paper.
In the paper
“For each gene, we validated the identified variants collectively as somatic by inspection of the age versus population prevalence profile (Supplementary Fig. 3)”
§ Rare variant associations with plasma protein levels in the UK Biobank > Methods > Detecting CH somatic mutations
plain- Asserted: passes — The authors put it forward as true.
- Checkable: passes — It can be checked against evidence.
- Load-bearing: fails — The paper’s conclusions may not depend on it.
- Based: passes — The paper gives a reason why it holds.
Probably not a substantial claim. The paper’s conclusions may not depend on it.
A conclusion the paper draws from its own results — it cites no other source for it, so there is none to check. The quote shows it is in the paper.
In the paper
“The approach is currently constrained by the UKB-PPP sample size used for pQTL discovery.”
§ Rare variant associations with plasma protein levels in the UK Biobank > pQTL-augmented PheWAS
plain- Asserted: passes — The authors put it forward as true.
- Checkable: passes — It can be checked against evidence.
- Load-bearing: fails — The paper’s conclusions may not depend on it.
- Based: passes — The paper gives a reason why it holds.
Probably not a substantial claim. The paper’s conclusions may not depend on it.
What the paper did — it cites no source for this, so there is none to check. The quote shows it is in the paper.
In the paper
“To remove potential recurrent artifacts, we filtered variants using a panel of normals created from 200 of the youngest UKB participants without a haematologic malignancy diagnosis.”
§ Rare variant associations with plasma protein levels in the UK Biobank > Methods > Detecting CH somatic mutations
plain- Asserted: passes — The authors put it forward as true.
- Checkable: passes — It can be checked against evidence.
- Load-bearing: passes — The paper’s conclusions depend on it.
- Based: passes — The paper gives a reason why it holds.
Probably not a substantial claim.
In the paper
“FLT3 is a key regulator of haematopoietic stem cell proliferation and dendritic cell differentiation47.”
§ Rare variant associations with plasma protein levels in the UK Biobank > Clonal haematopoiesis pQTLs
What the sources say
- Not checked — no full text of the sourcecites [47] Small, D. et al. STK-1, the human homolog of Flk-2/Flt-3, is selectively expressed in CD34+ human bone marrow cells and is involved in the proliferation of early progenitor/stem cells. Proc. Natl Acad. Sci. USA 91, 459–463 (1994). source
plaindirect- Asserted: passes — The authors put it forward as true.
- Checkable: passes — It can be checked against evidence.
- Load-bearing: fails — The paper’s conclusions may not depend on it.
- Based: passes — The paper gives a reason why it holds.
Probably not a substantial claim. The paper’s conclusions may not depend on it. It may state two separate claims as one.
What the paper did — it cites no source for this, so there is none to check. The quote shows it is in the paper.
In the paper
“we performed an n-of-1 permutation on the full ExWAS pQTL analysis.”
§ Rare variant associations with plasma protein levels in the UK Biobank > Methods > ExWAS
plain- Asserted: passes — The authors put it forward as true.
- Checkable: passes — It can be checked against evidence.
- Load-bearing: passes — The paper’s conclusions depend on it.
- Based: passes — The paper gives a reason why it holds.
Probably not a substantial claim.
What the paper did — it cites no source for this, so there is none to check. The quote shows it is in the paper.
In the paper
“To remove potential concerns of circularity, we repeated the above ptvolink and ptvolink2pcnt collapsing model PheWAS; however, this time we removed UKB participants from the PheWAS analyses if they were part of the UKB Proteomics cohort of 46,327 individuals adopted to select the 5,025 cis-CDS pQTL missense variants.”
§ Rare variant associations with plasma protein levels in the UK Biobank > Methods > Implementing the 470,000 missense pQTL-augmented PheWAS
plain- Asserted: passes — The authors put it forward as true.
- Checkable: passes — It can be checked against evidence.
- Load-bearing: passes — The paper’s conclusions depend on it.
- Based: passes — The paper gives a reason why it holds.
Probably not a substantial claim.
What the paper did — it cites no source for this, so there is none to check. The quote shows it is in the paper.
In the paper
“Variant-level pQTL P values were generated, adopting a linear regression (correcting for age, sex, age × sex, age × age, age × age × sex, principal component 1 (PC1), PC2, PC3, PC4, batch2, batch3, batch4, batch5, batch6, batch7 and a panel-specific measure of time between measurement and sampling).”
§ Rare variant associations with plasma protein levels in the UK Biobank > Methods > ExWAS
plaincorrelational- Asserted: passes — The authors put it forward as true.
- Checkable: passes — It can be checked against evidence.
- Load-bearing: passes — The paper’s conclusions depend on it.
- Based: passes — The paper gives a reason why it holds.
Probably not a substantial claim.
What the paper did — it cites no source for this, so there is none to check. The quote shows it is in the paper.
In the paper
“for all binary phenotypes, we matched controls by sex when the percentage of female cases was significantly different (Fisher’s exact two-sided P < 0.05) from the percentage of available female controls.”
§ Rare variant associations with plasma protein levels in the UK Biobank > Methods > Phenotypes
plain- Asserted: passes — The authors put it forward as true.
- Checkable: passes — It can be checked against evidence.
- Load-bearing: fails — The paper’s conclusions may not depend on it.
- Based: passes — The paper gives a reason why it holds.
Probably not a substantial claim. The paper’s conclusions may not depend on it.
What the paper did — it cites no source for this, so there is none to check. The quote shows it is in the paper.
In the paper
“For all models, we applied the following quality control filters:”
§ Rare variant associations with plasma protein levels in the UK Biobank > Methods > Collapsing analysis
plain- Asserted: passes — The authors put it forward as true.
- Checkable: passes — It can be checked against evidence.
- Load-bearing: passes — The paper’s conclusions depend on it.
- Based: passes — The paper gives a reason why it holds.
Probably not a substantial claim.
What the paper did — it cites no source for this, so there is none to check. The quote shows it is in the paper.
In the paper
“Gene-based pQTL P values were generated, adopting a linear regression (correcting for age, sex, age × sex, age × age, age × age × sex, PC1, PC2, PC3, PC4, batch1, batch2, batch3, batch4, batch5, batch6 and batch7).”
§ Rare variant associations with plasma protein levels in the UK Biobank > Methods > Collapsing analysis
plain- Asserted: passes — The authors put it forward as true.
- Checkable: passes — It can be checked against evidence.
- Load-bearing: passes — The paper’s conclusions depend on it.
- Based: passes — The paper gives a reason why it holds.
Probably not a substantial claim.
What the paper did — it cites no source for this, so there is none to check. The quote shows it is in the paper.
In the paper
“A minimum of 30 cases were required for a binary trait to be studied.”
§ Rare variant associations with plasma protein levels in the UK Biobank > Methods > Phenotypes
plainn = 30- Asserted: passes — The authors put it forward as true.
- Checkable: passes — It can be checked against evidence.
- Load-bearing: fails — The paper’s conclusions may not depend on it.
- Based: passes — The paper gives a reason why it holds.
Probably not a substantial claim. The paper’s conclusions may not depend on it.
What the paper did — it cites no source for this, so there is none to check. The quote shows it is in the paper.
In the paper
“Variants were required to pass the following quality control criteria:”
§ Rare variant associations with plasma protein levels in the UK Biobank > Methods > ExWAS
plain- Asserted: passes — The authors put it forward as true.
- Checkable: passes — It can be checked against evidence.
- Load-bearing: passes — The paper’s conclusions depend on it.
- Based: passes — The paper gives a reason why it holds.
Probably not a substantial claim.
What the paper did — it cites no source for this, so there is none to check. The quote shows it is in the paper.
In the paper
“We then performed finer-scale ancestry pruning of these individuals, retaining those within 4 s.d. from the mean across the first four principal components, resulting in a final cohort of 46,327 (89%) individuals for the proteogenomic analyses.”
§ Rare variant associations with plasma protein levels in the UK Biobank > Methods > Olink proteogenomics study cohort
plainn = 46,441- Asserted: passes — The authors put it forward as true.
- Checkable: passes — It can be checked against evidence.
- Load-bearing: passes — The paper’s conclusions depend on it.
- Based: passes — The paper gives a reason why it holds.
Probably not a substantial claim.
A conclusion the paper draws from its own results — it cites no other source for it, so there is none to check. The quote shows it is in the paper.
In the paper
“Moreover, in the context of this assessment, the inclusion of missense pQTLs would be expected to act conservatively (that is, diluting the value of including such missense in the PTV proteogenomic-augmented PheWAS collapsing analyses).”
§ Rare variant associations with plasma protein levels in the UK Biobank > Methods > Implementing the 470,000 missense pQTL-augmented PheWAS
hedgedconditional- Asserted: passes — The authors put it forward as true.
- Checkable: passes — It can be checked against evidence.
- Load-bearing: fails — The paper’s conclusions may not depend on it.
- Based: passes — The paper gives a reason why it holds.
Probably not a substantial claim. The paper’s conclusions may not depend on it.
- Rests on an assumption: In collapsing analysis, antibody-binding disruption events represent only a modest fraction of a gene's complete allelic series.
What the paper did — it cites no source for this, so there is none to check. The quote shows it is in the paper.
In the paper
“For the pan-ancestry analysis we included additional categorical covariates to capture broad ancestry (European, African, East Asian and South Asian).”
§ Rare variant associations with plasma protein levels in the UK Biobank > Methods > Collapsing analysis
plain- Asserted: passes — The authors put it forward as true.
- Checkable: passes — It can be checked against evidence.
- Load-bearing: fails — The paper’s conclusions may not depend on it.
- Based: passes — The paper gives a reason why it holds.
Probably not a substantial claim. The paper’s conclusions may not depend on it.
What the paper did — it cites no source for this, so there is none to check. The quote shows it is in the paper.
In the paper
“we further restricted the European ancestry cohort to those within ±4 s.d. across the top four principal component means. This resulted in 419,387 (89.3%) participants of European ancestry who were included in these cis-CDS pQTL modified analyses.”
§ Rare variant associations with plasma protein levels in the UK Biobank > Methods > Implementing the 470,000 missense pQTL-augmented PheWAS
plain- Asserted: passes — The authors put it forward as true.
- Checkable: passes — It can be checked against evidence.
- Load-bearing: passes — The paper’s conclusions depend on it.
- Based: passes — The paper gives a reason why it holds.
Probably not a substantial claim.
The paper relies on this without support.
The Olink Explore 3072 antibody-based measurements accurately reflect plasma protein abundances.
“Proteomic profiling on blood plasma was performed with the Olink Explore 3072 platform, which measures 2,941 protein analytes across 2,923 unique proteins (Supplementary Table 1).”
The paper relies on this without support.
Exome sequencing and variant calling accurately identify rare protein-coding variants.
“Exome sequencing data were available for 52,217 (96%) of these participants, which we processed through our previously published cloud-based pipeline11 (Extended Data Fig. 1a).”
The paper relies on this without support.
In collapsing analysis, antibody-binding disruption events represent only a modest fraction of a gene's complete allelic series.
“In the setting of collapsing analysis, in which we aggregate many variant effects in a gene, we expect these events to represent only a modest fraction of a gene’s complete allelic series.”
Claims other papers make about this one
Each is checked against this paper’s own text: does it say what the citing paper says it does?
The cited source says what the claim attributes to it.
In the citing paper
“Protein quantitative trait loci (pQTL), or associations between circulating protein abundances and genetic variants either within or nearby (cis-) to the protein-encoding gene or elsewhere in the genome (trans-), are commonly detected in large-scale studies1–6.”
From Cross-ancestry comparison of aptamer and antibody protein measures (2026) · cites this paper as [6]
Self-check
Percentages, sums and reported differences re-computed from the paper’s own numbers.
Each contradiction between two passages listed here was confirmed by an independent check.
Rated major: it would touch a result — a value a result rests on, reported and recomputed p-values on opposite sides of the significance level, two passages that conflict with no sign which is right, or a cited work retracted before this paper was published.
In the paper
“99% (n = 191) of the 193 trans-pQTLs had positive effect sizes compared with only 58% (n = 104 of 149 pQTLs) for the remaining 104 genes.”
§ Rare variant associations with plasma protein levels in the UK Biobank > Gene-level protein abundance associations
Reported 58 · recomputed 69.798658
Rated minor: it would not touch a result — a value no result rests on, a p-value that stays on the same side of the significance level, or a conflict that is clerical, resolved elsewhere in the paper, or outside its own findings.
In the paper
§ Rare variant associations with plasma protein levels in the UK Biobank > Methods > Olink proteogenomics study cohort
“This platform measured 2,923 protein analytes, reflecting 2,941 unique proteins measured across the Olink panels that comprise the 3072 panel”
§ Rare variant associations with plasma protein levels in the UK Biobank > UKB Pharma Plasma Proteome cohort characteristics
“which measures 2,941 protein analytes across 2,923 unique proteins”
Citations
Cites
Sudlow, C., Gallacher, J., Allen, N., Beral, V., Burton, P., Danesh, J., Downey, P., Elliott, P., Green, J., Landray, M., et al. (2015) · PLOS Medicine · doi:10.1371/journal.pmed.1001779 · Cited by 12,728
Cingolani, P., Platts, A., Wang, L. L., Coon, M., Nguyen, T., Wang, L., Land, S. J., Lu, X., & Ruden, D. M. (2012) · Fly · doi:10.4161/fly.19695 · Cited by 11,816
The mutational constraint spectrum quantified from variation in 141,456 humans
Karczewski, K. J., Francioli, L. C., Tiao, G., Cummings, B. B., Alföldi, J., Wang, Q., Collins, R. L., Laricchia, K. M., Ganna, A., Birnbaum, D. P., et al. (2020) · Nature · doi:10.1038/s41586-020-2308-7 · Cited by 9,434
Self-citationThe UK Biobank resource with deep phenotyping and genomic data
Bycroft, C., Freeman, C., Petkova, D., Band, G., Elliott, L. T., Sharp, K., Motyer, A., Vukcevic, D., Delaneau, O., O’Connell, J., et al. (2018) · Nature · doi:10.1038/s41586-018-0579-z · Cited by 8,876
Sensitive detection of somatic point mutations in impure and heterogeneous cancer samples
Cibulskis, K., Lawrence, M. S., Carter, S. L., Sivachenko, A., Jaffe, D. B., Sougnez, C. L., Gabriel, S., Meyerson, M. M., Lander, E. S., & Getz, G. A. (2013) · Nature Biotechnology · doi:10.1038/nbt.2514 · Cited by 4,965
ClinVar: improving access to variant interpretations and supporting evidence
Landrum, M. J., Lee, J. M., Benson, M., Brown, G. R., Chao, C., Chitipiralla, S., Gu, B., Hart, J., Hoffman, D., Jang, W., et al. (2018) · Nucleic Acids Research · doi:10.1093/nar/gkx1153 · Cited by 4,196 · cited 1×
“See above H Clarity and context: lucidity of abstract/summary, appropriateness of abstract, introduction and conclusions Could be improved with flow diagram as suggested in section F.”
BackgroundDrugBank: a comprehensive resource for in silico drug discovery and exploration
Wishart, D. S. (2006) · Nucleic Acids Research · doi:10.1093/nar/gkj067 · Cited by 3,892
Robust relationship inference in genome-wide association studies
Manichaikul, A., Mychaleckyj, J. C., Rich, S. S., Daly, K., Sale, M., & Chen, W.-M. (2010) · Bioinformatics · doi:10.1093/bioinformatics/btq559 · Cited by 3,541
REVEL: An Ensemble Method for Predicting the Pathogenicity of Rare Missense Variants
Ioannidis, N. M., Rothstein, J. H., Pejaver, V., Middha, S., McDonnell, S. K., Baheti, S., Musolf, A., Li, Q., Holzinger, E., Karyadi, D., et al. (2016) · The American Journal of Human Genetics · doi:10.1016/j.ajhg.2016.08.016 · Cited by 2,908
Clonal hematopoiesis and risk of atherosclerotic cardiovascular disease
Jaiswal, S., Natarajan, P., Silver, A. J., Gibson, C. J., Bick, A. G., Shvartz, E., McConkey, M., Gupta, N., Gabriel, S., Ardissino, D., et al. (2017) · New England Journal of Medicine · doi:10.1056/nejmoa1701719 · Cited by 2,683
Genomic atlas of the human plasma proteome
Sun, B. B., Maranville, J. C., Peters, J. E., Stacey, D., Staley, J. R., Blackshaw, J., Burgess, S., Jiang, T., Paige, E., Surendran, P., et al. (2018) · Nature · doi:10.1038/s41586-018-0175-2 · Cited by 2,268
Self-citationMidostaurin plus Chemotherapy for Acute Myeloid Leukemia with a FLT3 Mutation
Stone, R. M., Mandrekar, S. J., Sanford, B. L., Laumann, K., Geyer, S., Bloomfield, C. D., Thiede, C., Prior, T. W., Döhner, K., Marcucci, G., et al. (2017) · New England Journal of Medicine · doi:10.1056/nejmoa1614359 · Cited by 2,250
Mutations in progranulin cause tau-negative frontotemporal dementia linked to chromosome 17
Baker, M., Mackenzie, I. R., Pickering-Brown, S. M., Gass, J., Rademakers, R., Lindholm, C., Snowden, J., Adamson, J., Sadovnick, A. D., Rollinson, S., et al. (2006) · Nature · doi:10.1038/nature05016 · Cited by 2,058
Plasma proteomic associations with genetics and health in the UK Biobank
Sun, B. B., Chiou, J., Traylor, M., Benner, C., Hsu, Y.-H., Richardson, T. G., Surendran, P., Mahajan, A., Robins, C., Vasquez-Grinnell, S. G., et al. (2023) · Nature · doi:10.1038/s41586-023-06592-6 · Cited by 1,880
Self-citationLarge-scale integration of the plasma proteome with genetics and disease
Ferkingstad, E., Sulem, P., Atlason, B. A., Sveinbjornsson, G., Magnusson, M. I., Styrmisdottir, E. L., Gunnarsdottir, K., Helgason, A., Oddsson, A., Halldorsson, B. V., et al. (2021) · Nature Genetics · doi:10.1038/s41588-021-00978-w · Cited by 1,697
The mutational constraint spectrum quantified from variation in 141,456 humans
Karczewski, K. J., Francioli, L. C., Tiao, G., Cummings, B. B., Alföldi, J., Wang, Q., Collins, R. L., Laricchia, K. M., Ganna, A., Birnbaum, D. P., et al. (2019) · doi:10.1101/531210 · Cited by 1,662
Self-citationPID: the Pathway Interaction Database
Schaefer, C. F., Anthony, K., Krupa, S., Buchoff, J., Day, M., Hannay, T., & Buetow, K. H. (2009) · Nucleic Acids Research · doi:10.1093/nar/gkn653 · Cited by 1,603
Howe, K. L., Achuthan, P., Allen, J. E., Allen, J., Álvarez-Jarreta, J., Amode, M., Armean, I., Azov, A., Bennett, R., Bhai, J., et al. (2020) · Nucleic Acids Res. · doi:10.1093/nar/gkaa942 · Cited by 1,355
Human dendritic cell subsets: an update
Collin, M., & Bigley, V. (2018) · Immunology · doi:10.1111/imm.12888 · Cited by 1,301 · cited 1×
“These two papers are highly complementary and we better outline these differences in lines 96-102.”
BackgroundGilteritinib or Chemotherapy for Relapsed or Refractory FLT3 -Mutated AML
Perl, A. E., Martinelli, G., Cortes, J. E., Neubauer, A., Berman, E., Paolini, S., Montesinos, P., Baer, M. R., Larson, R. A., Ustun, C., et al. (2019) · New England Journal of Medicine · doi:10.1056/nejmoa1902688 · Cited by 1,287
Cytoplasmic flagellin activates caspase-1 and secretion of interleukin 1β via Ipaf
Miao, E. A., Alpuche-Aranda, C. M., Dors, M., Clark, A. E., Bader, M. W., Miller, S. I., & Aderem, A. (2006) · Nature Immunology · doi:10.1038/ni1344 · Cited by 1,127
A draft network of ligand–receptor-mediated multicellular signalling in human
Ramilowski, J. A., Goldberg, T., Harshbarger, J., Kloppmann, E., Lizio, M., Satagopam, V. P., Itoh, M., Kawaji, H., Carninci, P., Rost, B., et al. (2015) · Nature Communications · doi:10.1038/ncomms8866 · Cited by 887
Prediction of acute myeloid leukaemia risk in healthy individuals
Abelson, S., Collord, G., Ng, S. W. K., Weissbrod, O., Mendelson Cohen, N., Niemeyer, E., Barda, N., Zuzarte, P. C., Heisler, L., Sundaravadanam, Y., et al. (2018) · Nature · doi:10.1038/s41586-018-0317-6 · Cited by 850
A Protein-Truncating HSD17B13 Variant and Protection from Chronic Liver Disease
Abul-Husn, N. S., Cheng, X., Li, A. H., Xin, Y., Schurmann, C., Stevis, P., Liu, Y., Kozlitina, J., Stender, S., Wood, G. C., et al. (2018) · New England Journal of Medicine · doi:10.1056/nejmoa1712191 · Cited by 827
Zheng, J., Haberland, V., Baird, D., Walker, V., Haycock, P., Hurle, M., Gutteridge, A., Erola, P., Liu, Y., Luo, S., et al. (2019) · doi:10.1101/627398 · Cited by 812
Self-citationDisease variant prediction with deep generative models of evolutionary data
Frazer, J., Notin, P., Dias, M., Gomez, A., Min, J. K., Brock, K., Gal, Y., & Marks, D. S. (2021) · Nature · doi:10.1038/s41586-021-04043-8 · Cited by 791
Colonna, M., & Samaridis, J. (1995) · Science · doi:10.1126/science.7716543 · Cited by 736
Validating therapeutic targets through human genetics
Plenge, R. M., Scolnick, E. M., & Altshuler, D. (2013) · Nature Reviews Drug Discovery · doi:10.1038/nrd4051 · Cited by 712
Genomic and drug target evaluation of 90 cardiovascular proteins in 30,931 individuals
Folkersen, L., Gustafsson, S., Wang, Q., Hansen, D. H., Hedman, Å. K., Schork, A., Page, K., Zhernakova, D. V., Wu, Y., Peters, J., et al. (2020) · Nature Metabolism · doi:10.1038/s42255-020-00287-2 · Cited by 705
Self-citationMapping the proteo-genomic convergence of human diseases
Pietzner, M., Wheeler, E., Carrasco-Zanini, J., Cortes, A., Koprulu, M., Wörheide, M. A., Oerton, E., Cook, J., Stewart, I. D., Kerrison, N. D., et al. (2021) · Science · doi:10.1126/science.abj1541 · Cited by 657
Self-citationRare variant contribution to human disease in 281,104 UK Biobank exomes
Wang, Q., Dhindsa, R. S., Carss, K., Harper, A. R., Nag, A., Tachmazidou, I., Vitsios, D., Deevi, S. V. V., Mackay, A., Muthas, D., et al. (2021) · Nature · doi:10.1038/s41586-021-03855-y · Cited by 604
Self-citationExome sequencing and characterization of 49,960 individuals in the UK Biobank
Van Hout, C. V., Tachmazidou, I., Backman, J. D., Hoffman, J. D., Liu, D., Pandey, A. K., Gonzaga-Jauregui, C., Khalid, S., Ye, B., Banerjee, N., et al. (2020) · Nature · doi:10.1038/s41586-020-2853-0 · Cited by 561
Self-citationMutation of NLRC4 causes a syndrome of enterocolitis and autoinflammation
Romberg, N. D., Moussawi, K. A., Nelson-Williams, C. J., Stiegler, A. L., Loring, E. C., Choi, M., Overton, J. D., Meffre, E., Khokha, M. K., Huttner, A. J., et al. (2014) · Nature Genetics · doi:10.1038/ng.3066 · Cited by 522
Strikingly Different Clinicopathological Phenotypes Determined by Progranulin-Mutation Dosage
Smith, K. R., Damiano, J., Franceschetti, S., Carpenter, S., Canafoglia, L., Morbin, M., Rossi, G., Pareyson, D., Mole, S. E., Staropoli, J. F., et al. (2012) · The American Journal of Human Genetics · doi:10.1016/j.ajhg.2012.04.021 · Cited by 489
Self-citationJun, G., Flickinger, M., Hetrick, K. N., Romm, J. M., Doheny, K. F., Abecasis, G. R., Boehnke, M., & Kang, H. M. (2012) · The American Journal of Human Genetics · doi:10.1016/j.ajhg.2012.09.004 · Cited by 484
Genetics meets proteomics: perspectives for large population-based studies
Suhre, K., McCarthy, M. I., & Schwenk, J. M. (2021) · Nature Reviews Genetics · doi:10.1038/s41576-020-0268-2 · Cited by 478
Small, D., Levenstein, M., Kim, E., Carow, C., Amin, S., Rockwell, P., Witte, L., Burrow, C., Ratajczak, M. Z., & Gewirtz, A. M. (1994) · Proceedings of the National Academy of Sciences · doi:10.1073/pnas.91.2.459 · Cited by 429
Activation of basophil and mast cell histamine release by eosinophil granule major basic protein.
O'Donnell, M. C., Ackerman, S. J., Gleich, G. J., & Thomas, L. L. (1983) · The Journal of experimental medicine · doi:10.1084/jem.157.6.1981 · Cited by 321
SERUM-ALPHA-FETOPROTEIN LEVELS IN PATIENTS WITH ATAXIA-TELANGIECTASIA
Waldmann, T., & Mcintire, K. R. (1972) · The Lancet · doi:10.1016/s0140-6736(72)92717-1 · Cited by 319
Synonymous mutations in representative yeast genes are mostly strongly non-neutral
Shen, X., Song, S., Li, C., & Zhang, J. (2022) · Nature · doi:10.1038/s41586-022-04823-w · Cited by 298
Mannose-6-phosphate pathway: A review on its role in lysosomal function and dysfunction
Coutinho, M. F., Prata, M. J., & Alves, S. (2011) · Molecular Genetics and Metabolism · doi:10.1016/j.ymgme.2011.12.012 · Cited by 277
Petrovski, S., & Goldstein, D. B. (2016) · Genome Biology · doi:10.1186/s13059-016-1016-y · Cited by 255
Self-citationAn Exome Sequencing Study to Assess the Role of Rare Genetic Variation in Pulmonary Fibrosis
Petrovski, S., Todd, J. L., Durheim, M. T., Wang, Q., Chien, J. W., Kelly, F. L., Frankel, C. W., Mebane, C. M., Ren, Z., Bridgers, J., et al. (2017) · American Journal of Respiratory and Critical Care Medicine · doi:10.1164/rccm.201610-2088oc · Cited by 244
Self-citationWho’s Who? Detecting and Resolving Sample Anomalies in Human DNA Sequencing Studies with Peddy
Pedersen, B. S., & Quinlan, A. R. (2017) · The American Journal of Human Genetics · doi:10.1016/j.ajhg.2017.01.017 · Cited by 237
Coban-Akdemir, Z., White, J. J., Song, X., Jhangiani, S. N., Fatih, J. M., Gambin, T., Bayram, Y., Chinn, I. K., Karaca, E., Punetha, J., et al. (2018) · The American Journal of Human Genetics · doi:10.1016/j.ajhg.2018.06.009 · Cited by 219
Rare-variant collapsing analyses for complex traits: guidelines and applications
Povysil, G., Petrovski, S., Hostyk, J. A., Aggarwal, V. S., Allen, A. S., & Goldstein, D. B. (2019) · Nature Reviews Genetics · doi:10.1038/s41576-019-0177-4 · Cited by 211
Self-citationMolecular basis of variant pseudo-Hurler polydystrophy (mucolipidosis IIIC)
Raas‐Rothschild, A., Cormier‐Daire, V., Bao, M., Génin, E., Salomon, R., Brewer, K., Zeigler, M., Mandel, H., Toth, S., Roe, B. A., et al. (2000) · Journal of Clinical Investigation · doi:10.1172/jci5826 · Cited by 196
Genetics of trans-regulatory variation in gene expression
Albert, F. W., Bloom, J. S., Siegel, J. J., Day, L., & Kruglyak, L. (2018) · eLife · doi:10.7554/elife.35471 · Cited by 186
Traynelis, J. L., Silk, M. A., Wang, Q., Berkovic, S. F., Liu, L., Ascher, D. B., Balding, D. J., & Petrovski, S. (2017) · Genome Research · doi:10.1101/gr.226589.117 · Cited by 169
Self-citationClonal haematopoiesis and dysregulation of the immune system
Belizaire, R., Wong, W. J., Robinette, M. L., & Ebert, B. L. (2023) · Nature Reviews Immunology · doi:10.1038/s41577-023-00843-3 · Cited by 161
Schledzewski, K., Géraud, C., Arnold, B., Wang, S., Gröne, H.-J., Kempf, T., Wollert, K. C., Straub, B. K., Schirmacher, P., Demory, A., et al. (2011) · Journal of Clinical Investigation · doi:10.1172/jci44740 · Cited by 154
Pujar, S., O’Leary, N. A., Farrell, C. M., Loveland, J. E., Mudge, J. M., Wallin, C., Girón, C. G., Diekhans, M., Barnes, I., Bennett, R., et al. (2018) · Nucleic Acids Research · doi:10.1093/nar/gkx1031 · Cited by 147
JAK2-V617F promotes venous thrombosis through β1/β2 integrin activation
Edelmann, B., Gupta, N., Schnoeder, T. M., Oelschlegel, A. M., Shahzad, K., Goldschmidt, J., Philipsen, L., Weinert, S., Ghosh, A., Saalfeld, F. C., et al. (2018) · Journal of Clinical Investigation · doi:10.1172/jci90312 · Cited by 138
Outcome of patients with FLT3-mutated acute myeloid leukemia in first relapse
Ravandi, F., Kantarjian, H., Faderl, S., Garcia-Manero, G., O’Brien, S., Koller, C., Pierce, S., Brandt, M., Kennedy, D., Cortes, J., et al. (2010) · Leukemia Research · doi:10.1016/j.leukres.2009.10.001 · Cited by 125
Characterization of a mutation in a family with saposin B deficiency: a glycosylation site defect.
Kretz, K. A., Carson, G. S., Morimoto, S., Kishimoto, Y., Fluharty, A. L., & O'Brien, J. S. (1990) · Proceedings of the National Academy of Sciences · doi:10.1073/pnas.87.7.2541 · Cited by 118
Katz, D. H., Tahir, U. A., Bick, A. G., Pampana, A., Ngo, D., Benson, M. D., Yu, Z., Robbins, J. M., Chen, Z.-Z., Cruz, D. E., et al. (2022) · Circulation · doi:10.1161/circulationaha.121.055117 · Cited by 92
Prosaposin is a regulator of progranulin levels and oligomerization
Nicholson, A. M., Finch, N. A., Almeida, M., Perkerson, R. B., van Blitterswijk, M., Wojtas, A., Cenik, B., Rotondo, S., Inskeep, V., Almasy, L., et al. (2016) · Nature Communications · doi:10.1038/ncomms11992 · Cited by 91
Manta, C.-P., Leibing, T., Friedrich, M., Nolte, H., Adrian, M., Schledzewski, K., Krzistetzko, J., Kirkamm, C., David Schmid, C., Xi, Y., et al. (2022) · Circulation · doi:10.1161/circulationaha.121.058615 · Cited by 84
A Gain-of-Function Mutation in EPO in Familial Erythrocytosis
Zmajkovic, J., Lundberg, P., Nienhold, R., Torgersen, M. L., Sundan, A., Waage, A., & Skoda, R. C. (2018) · New England Journal of Medicine · doi:10.1056/nejmoa1709064 · Cited by 56
Mapping the serum proteome to neurological diseases using whole genome sequencing
Png, G., Barysenka, A., Repetto, L., Navarro, P., Shen, X., Pietzner, M., Wheeler, E., Wareham, N. J., Langenberg, C., Tsafantakis, E., et al. (2021) · Nature Communications · doi:10.1038/s41467-021-27387-1 · Cited by 55
Self-citationukbtools: An R package to manage and query UK Biobank data
Hanscombe, K. B., Coleman, J. R. I., Traylor, M., & Lewis, C. M. (2019) · PLOS ONE · doi:10.1371/journal.pone.0214311 · Cited by 54
Zhou, X., Sullivan, P. M., Sun, L., & Hu, F. (2017) · Journal of Neurochemistry · doi:10.1111/jnc.14110 · Cited by 44
Self-citationLiu, L., Lee, W., Doray, B., & Kornfeld, S. A. (2017) · Molecular Therapy — Methods & Clinical Development · doi:10.1016/j.omtm.2017.03.006 · Cited by 41
A minimal role for synonymous variation in human disease
Dhindsa, R. S., Wang, Q., Vitsios, D., Burren, O. S., Hu, F., DiCarlo, J. E., Kruglyak, L., MacArthur, D. G., Hurles, M. E., & Petrovski, S. (2022) · The American Journal of Human Genetics · doi:10.1016/j.ajhg.2022.10.016 · Cited by 38
Self-citationHuman genetics uncovers MAP3K15 as an obesity-independent therapeutic target for diabetes
Nag, A., Dhindsa, R. S., Mitchell, J., Vasavda, C., Harper, A. R., Vitsios, D., Ahnmark, A., Bilican, B., Madeyski-Bengtson, K., Zarrouki, B., et al. (2022) · Science Advances · doi:10.1126/sciadv.add5430 · Cited by 36
Self-citationSVEP1 is an endogenous ligand for the orphan receptor PEAR1
Elenbaas, J. S., Pudupakkam, U., Ashworth, K. J., Kang, C. J., Patel, V., Santana, K., Jung, I., Lee, P. C., Burks, K. H., Amrute, J., et al. (2023) · Nature Communications · doi:10.1038/s41467-023-36486-0 · Cited by 30
Ponnaiyan, S., Akter, F., Singh, J., & Winter, D. (2020) · Scientific Data · doi:10.1038/s41597-020-0399-5 · Cited by 29
Targeted Quantification of the Lysosomal Proteome in Complex Samples
Mosen, P., Sanner, A., Singh, J., & Winter, D. (2021) · Proteomes · doi:10.3390/proteomes9010004 · Cited by 26
Kierczak, M., Rafati, N., Höglund, J., Gourlé, H., Lo Faro, V., Schmitz, D., Ek, W. E., Gyllensten, U., Enroth, S., Ekman, D., et al. (2022) · Nature Communications · doi:10.1038/s41467-022-30208-8 · Cited by 22
Nag, A., Dhindsa, R. S., Middleton, L., Jiang, X., Vitsios, D., Wigmore, E., Allman, E. L., Reznichenko, A., Carss, K., Smith, K. R., et al. (2023) · The American Journal of Human Genetics · doi:10.1016/j.ajhg.2023.02.002 · Cited by 22
Self-citationHarlow, C. E., Gandawijaya, J., Bamford, R. A., Martin, E.-R., Wood, A. R., van der Most, P. J., Tanaka, T., Leonard, H. L., Etheridge, A. S., Innocenti, F., et al. (2022) · The American Journal of Human Genetics · doi:10.1016/j.ajhg.2022.08.004 · Cited by 13
Plager, D. A., Weiler, D. A., Loegering, D. A., Johnson, W. B., Haley, L., Eddy, R. L., Shows, T. B., & Gleich, G. J. (2001) · Genomics · doi:10.1006/geno.2000.6391 · Cited by 8
Schledzewski, K., Géraud, C., Arnold, B., Wang, S., Gröne, H., Kempf, T., Wollert, K. C., Straub, B. K., Schirmacher, P., Demory, A., et al. (2012) · Vascular Pharmacology · doi:10.1016/j.vph.2011.08.116 · Cited by 7
Cited by
Sorted by citations
Atlas of the plasma proteome in health and disease in 53,026 adults
Deng, Y., You, J., He, Y., Zhang, Y., Li, H., Wu, X., Cheng, J.-Y., Guo, Y. A., Long, Z.-W., Chen, Y.-L., et al. (2024) · Cell · doi:10.1016/j.cell.2024.10.045 · Cited by 320
Plasma proteomic profiles predict future dementia in healthy adults
Guo, Y., You, J., Zhang, Y., Liu, W., Huang, Y., Zhang, Y.-R., Zhang, W., Dong, Q., Feng, J., Cheng, W., et al. (2024) · Nature Aging · doi:10.1038/s43587-023-00565-0 · Cited by 327
Whole-genome sequencing of 490,640 UK Biobank participants
Manuscript Writing Group, Carss, K., Halldórsson, B. V., Hou, L., Liu, J. Z., Wheeler, E., Lo, Y., Kundu, K., Huang, Z., Lacey, B., et al. (2025) · Nature · doi:10.1038/s41586-025-09272-9 · Cited by 236
Self-citationAggregation-Induced Emission Luminogen: Role in Biopsy for Precision Medicine
Duo, Y., Han, L., Yang, Y., Wang, Z., Wang, L., Chen, J., Xiang, Z., Yoon, J., Luo, G., & Tang, B. Z. (2024) · Chemical Reviews · doi:10.1021/acs.chemrev.4c00244 · Cited by 119
Garg, M., Karpiński, M., Matelska, D., Middleton, L., Burren, O. S., Hu, F., Wheeler, E., Smith, K. R., Fabre, M. A., Mitchell, J., et al. (2024) · Nature Genetics · doi:10.1038/s41588-024-01898-1 · Cited by 134
Self-citation
Metadata
- Authors
- Dhindsa, R. S., Burren, O. S., Sun, B. B., Prins, B. P., Matelska, D., Wheeler, E., Mitchell, J., Oerton, E., Hristova, V. A., Smith, K. R., Carss, K., Wasilewski, S., Harper, A. R., Paul, D. S., Fabre, M. A., Runz, H., Viollet, C., Challis, B., Platt, A., Initiative, A. G., Ågren, R., Anderson-Dring, L., Atanur, S., Baker, D., Barrett, C., Belvisi, M., Bohlooly-Y, M., Buvall, L., Camacho, N., Cazares, L., Cameron-Christie, S., Chen, M., Cohen, S., Danielson, R. F., Das, S., Davis, A., Deevi, S. V. V., Ding, W., Dougherty, B., Fairhurst-Hunter, Z., Garg, M., Georgi, B., Rangel, C. G., Haefliger, C., Hammar, M., Hanna, R. N., Hansen, P. B. L., Harrow, J., Henry, I., Hess, S., Hollis, B., Hu, F., Jiang, X., Kundu, K., Lai, Z., Lal, M., Lassi, G., Liang, Y., Lopes, M., Lythgow, K., MacArthur, S., Maisuria-Armer, M., March, R., Martins, C., Megy, K., Menzies, R., Michaëlsson, E., Middleton, F., Mowrey, B., Muthas, D., Nag, A., O’Dell, S., Ohne, Y., Olsson, H., O’Neill, A., Ostridge, K., Pullman, B., Rae, W., Raies, A., Reznichenko, A., Ros, X. R., Ryaboshapkina, M., Sanganee, H., Sidders, B., Snowden, M., Stankovic, S., Stevens, H., Tachmazidou, I., Taiy, H., Tian, L., Underwood, C., Walentinsson, A., Wang, Q.-D., Zehir, A., Zou, Z., Vitsios, D., Ashley, E. A., Whelan, C. D., Pangalos, M. N., Wang, Q., & Petrovski, S.
- Affiliations
- AstraZeneca (United States) (US)
- AstraZeneca (United Kingdom) (GB)
- Biogen (United States) (US)
- AstraZeneca (Sweden) (SE)
- Alexion Pharmaceuticals (United States) (US)
- The University of Melbourne (AU)
- Corresponding author
- Dhindsa, Ryan S.
- Petrovski, Slavé
- ORCID
- Dhindsa, Ryan S.
- Burren, Oliver S.
- Sun, Benjamin B.
- Prins, Bram P.
- Matelska, Dorota
- Wheeler, Eleanor
- Mitchell, Jonathan
- Oerton, Erin
- Hristova, Ventzislava A.
- Smith, Katherine R.
- Carss, Keren
- Harper, Andrew R.
- Paul, Dirk S.
- Fabre, Margarete A.
- Runz, Heiko
- Viollet, Coralie
- Challis, Benjamin
- Platt, Adam
- Ågren, Rasmus
- Atanur, Santosh
- Belvisi, Maria
- Buvall, Lisa
- Camacho, Niedzica
- Cazares, Lisa
- Deevi, Sri Vishnu Vardhan
- Ding, Wei
- Dougherty, Brian
- Garg, Manik
- Haefliger, Carolina
- Hansen, Pernille B. L.
- Harrow, Jennifer
- Henry, Ian
- Hess, Sonja
- Hu, Fengyuan
- Jiang, Xiao
- Kundu, Kousik
- Lai, Zhongwu
- Lal, Mark
- Lassi, Glenda
- Liang, Yupu
- MacArthur, Stewart
- March, Ruth
- Michaëlsson, Erik
- Muthas, Daniel
- Nag, Abhishek
- O’Dell, Sean
- Ohne, Yoichiro
- Olsson, Henric
- Ostridge, Kristoffer
- Pullman, Benjamin
- Rae, William
- Raies, Arwa
- Ros, Xavier Romero
- Ryaboshapkina, Maria
- Sidders, Ben
- Stankovic, Stasa
- Tachmazidou, Ioanna
- Tian, Lifeng
- Walentinsson, Anna
- Wang, Qing-Dong
- Zehir, Ahmet
- Vitsios, Dimitrios
- Ashley, Euan A.
- Whelan, Christopher D.
- Pangalos, Menelas N.
- Wang, Quanli
- Petrovski, Slavé
- Venue
- Nature
- Published
- 2023-10-04
- Volume
- 622
- Issue
- 7982
- Pages
- 339-347
- ISSN
- 0028-0836 (ISSN-L)
- 1476-4687
- PMC
- PMC10567546
- OpenAlex
- W4387354365
- Cited by
- 193
- References
- 79
- Citations by year
- 2026: 68 · 2025: 72 · 2024: 47 · 2023: 6
- FWCI
- 32.04
- Type
- journal article
- Language
- en
- Open access
- hybrid
- doi.org
- Locations
- Nature (publishedVersion, cc-by)
- PubMed Central (publishedVersion, cc-by)
- PubMed (publishedVersion)
- RePEc: Research Papers in Economics (submittedVersion)
- Funders
- Amgen
- Bristol-Myers Squibb
- Pfizer
- AstraZeneca
- Biogen
- Alnylam Pharmaceuticals
- Regeneron Pharmaceuticals
- Novo Nordisk
- Genentech
- Janssen Pharmaceuticals
- Topics
- Life Sciences › Biochemistry, Genetics and Molecular Biology › Genetics › Genetic Associations and Epidemiology
- Life Sciences › Biochemistry, Genetics and Molecular Biology › Genetics › Genomics and Rare Diseases
- Life Sciences › Biochemistry, Genetics and Molecular Biology › Molecular Biology › Bioinformatics and Genomic Networks
- Keywords
- rare variants, plasma protein levels, proteogenomics, truncating mutations, stabilin-1, stabilin-2, scavenger receptors, protein clearance, NLRC4, HSD17B13, hepatic steatosis, TET2, clonal hematopoiesis, FLT3, protein quantitative trait loci, biomarkers, therapeutic target
- MeSH terms
- Alleles, Blood Proteins, Calcium-Binding Proteins, DNA-Binding Proteins, United Kingdom, Hematopoiesis, Humans, Mutation, Plasma, 17-Hydroxysteroid Dehydrogenases, Biomarkers, Cell Adhesion Molecules, Neuronal, Receptors, Lymphocyte Homing, Databases, Factual, Biological Specimen Banks, Genomics, Proteomics, Dioxygenases, fms-Like Tyrosine Kinase 3, CARD Signaling Adaptor Proteins, Genetic Association Studies, Exome
About these checks
Registry, retraction, Cites and statistics results are computed, not judged, with one exception: a printed reference that no index lists is read once by a model before it counts as a citation error. Claims are extracted by a model and kept only when their quote appears verbatim in the text; each cited source is then checked, with a model’s help, for whether it says what the claim relies on. Those verdicts can be wrong — read the claim’s quote and the cited source before relying on one.
A language model drew the claims from the paper on 2026-10-31, under version 3 of the claim definition (model deepseek-v4.1-flash, prompt extract-v3).
A second model labelled each claim on 2026-10-31 (model jev-1.13-20260917, definition revision gold-guideline-v0.2).
Cited sources are checked with a language model’s help (gpt-6-sol).
Statistics and arithmetic are recomputed, not judged.
Confidence bands are shown only for fields calibrated on our annotated test set. None is calibrated yet, so no band is shown.
What counts as a claim ›How we measure confidence ›How we check this ›
Are you an author, or do you see a problem with this page? Request a review
