

The DOI matches its Crossref record; 11 of the 11 references it cites were found in a registry or an index.
Moderate lifelong overexpression of tuberous sclerosis complex 1 (TSC1) improves health and survival in mice
Abstract
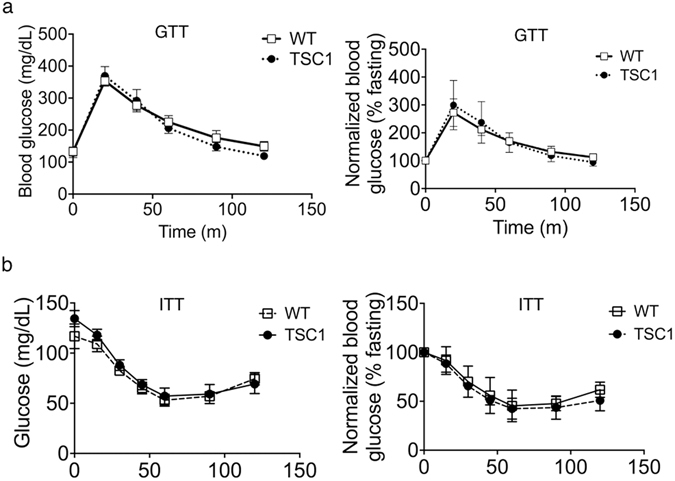
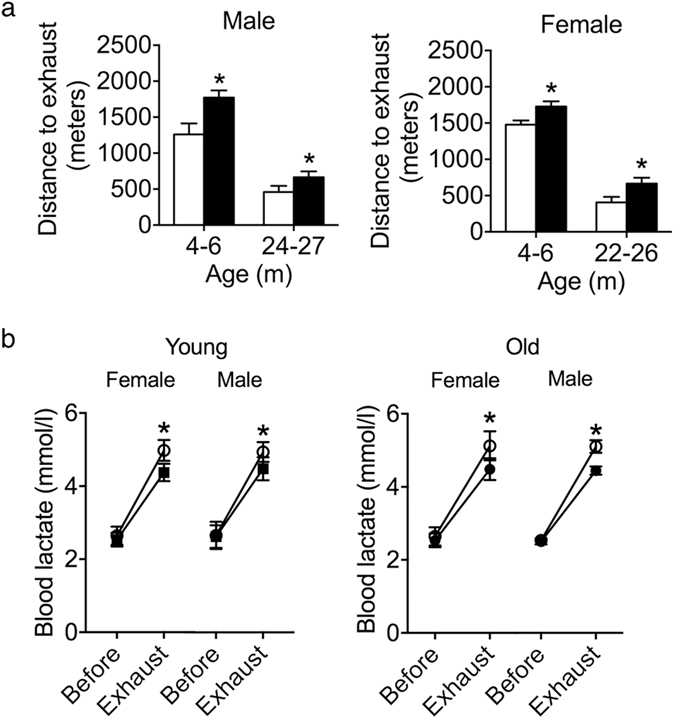
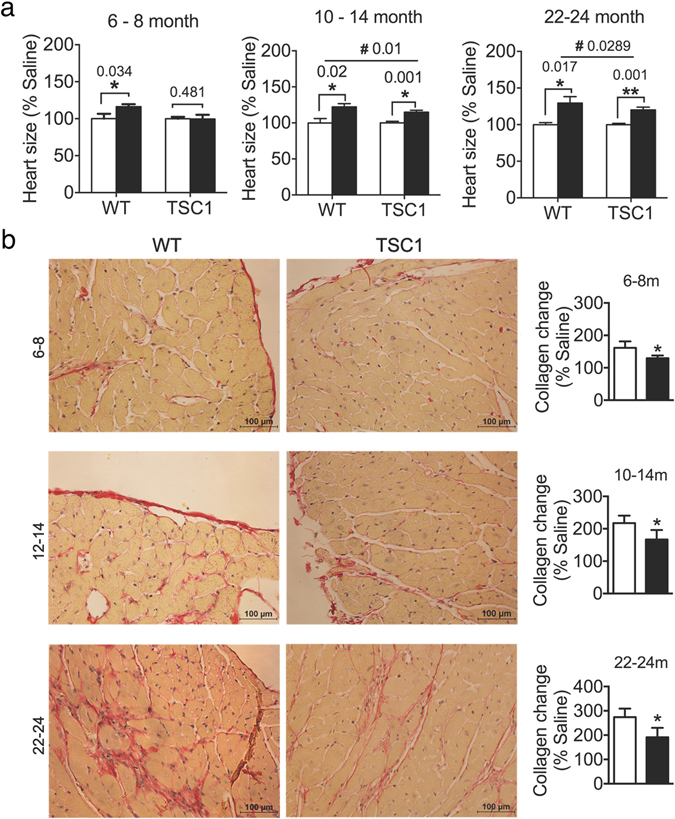
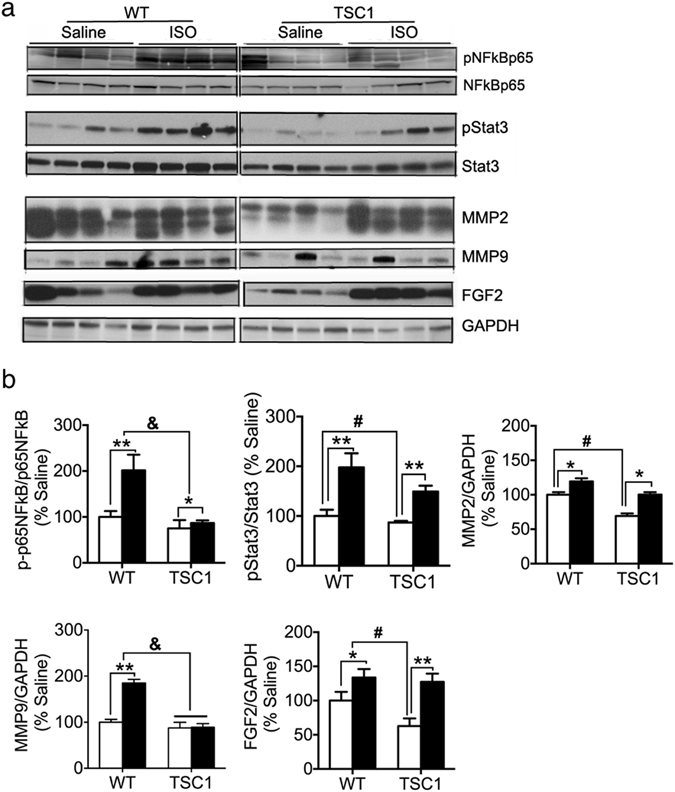
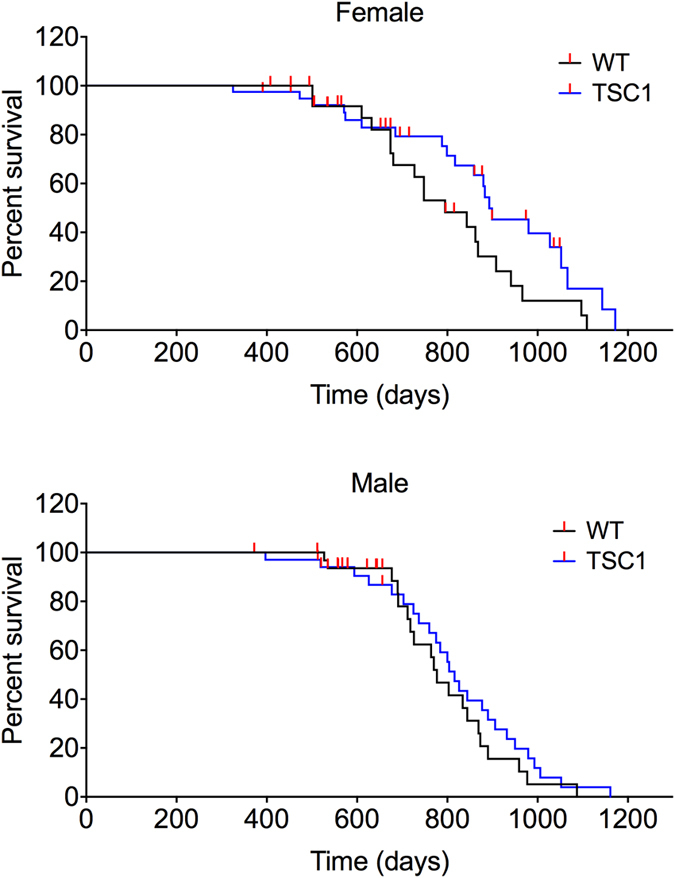
The tuberous sclerosis complex 1/2 (TSC1/2) is an endogenous regulator of the mechanistic target of rapamycin (mTOR). While mTOR has been shown to play an important role in health and aging, the role of TSC1/2 in aging has not been fully investigated. In the current study, a constitutive TSC1 transgenic (Tsc1 tg ) mouse model was generated and characterized. mTORC1 signaling was reduced in majority of the tissues, except the brain. In contrast, mTORC2 signaling was enhanced in Tsc1 tg mice. Tsc1 tg mice are more tolerant to exhaustive exercises and less susceptible to isoproterenol-induced cardiac hypertrophy at both young and advanced ages. Tsc1 tg mice have less fibrosis and inflammation in aged as well as isoproterenol-challenged heart than age-matched wild type mice. The female Tsc1 tg mice exhibit a higher fat to lean mass ratio at advanced ages than age-matched wild type mice. More importantly, the lifespan increased significantly in female Tsc1 tg mice, but not in male Tsc1 tg mice. Collectively, our data demonstrated that moderate increase of TSC1 expression can enhance overall health, particularly cardiovascular health, and improve survival in a gender-specific manner.
Overview
The claims and statistics of this paper haven’t been checked yet.
Run the check — free, no account needed. It reads the open-access text and checks the sources it cites.
Integrity signals
Registry
Cites
Statistics
Figures
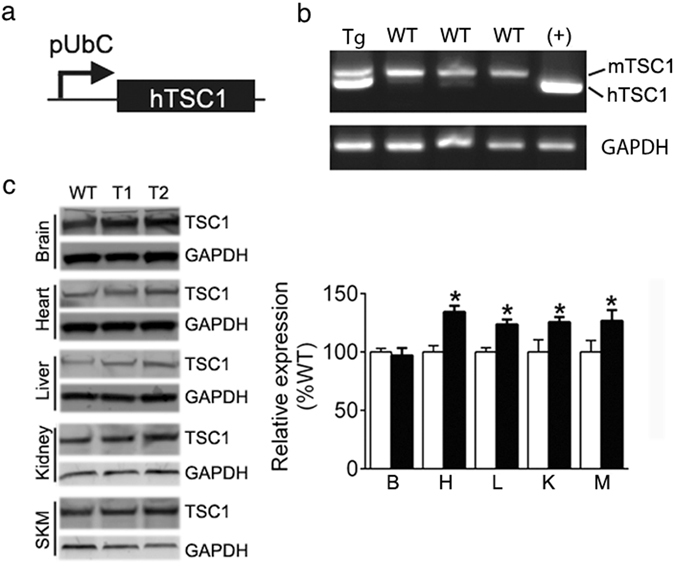
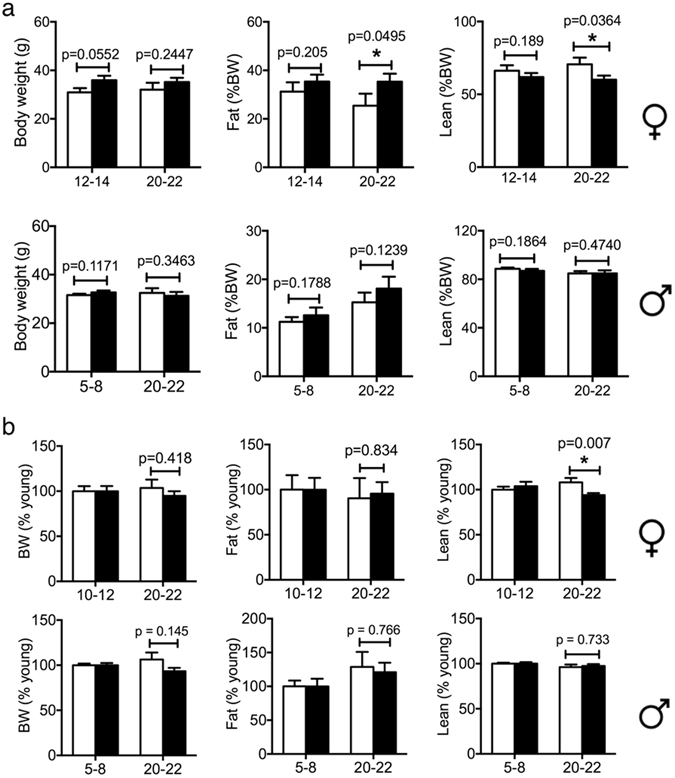
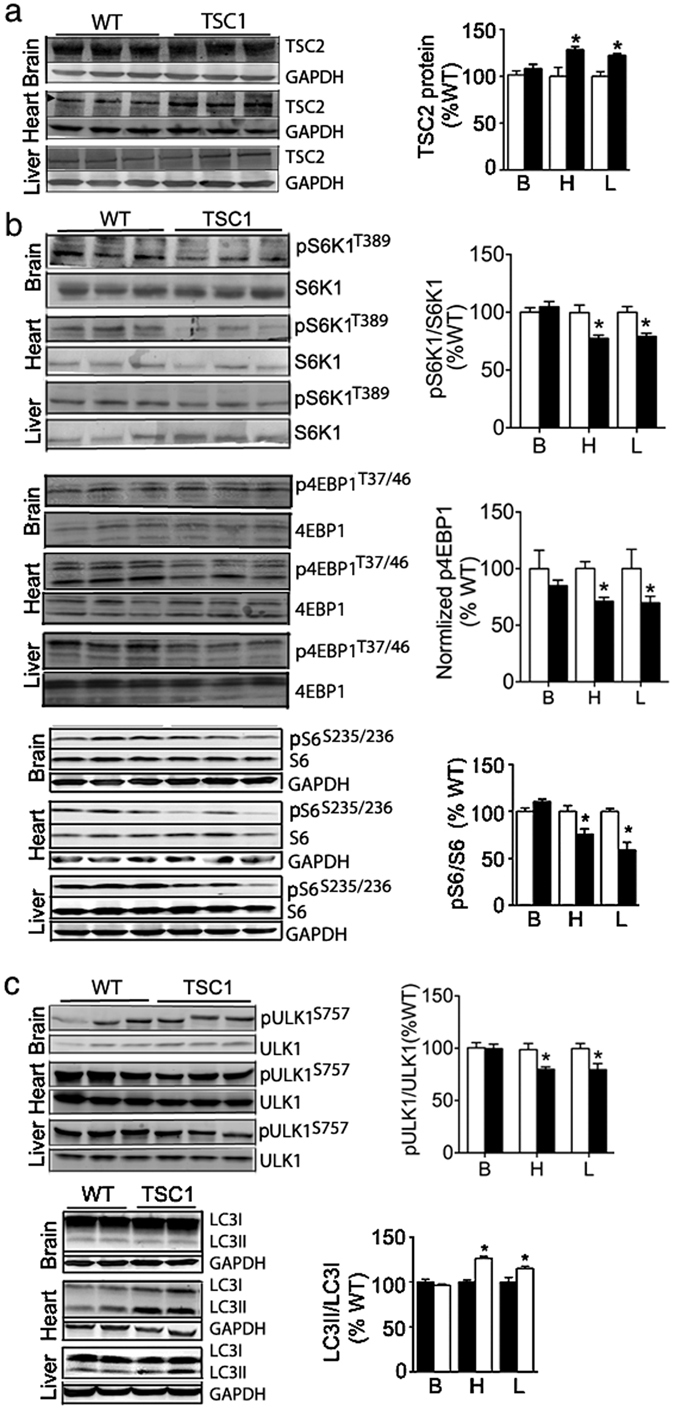
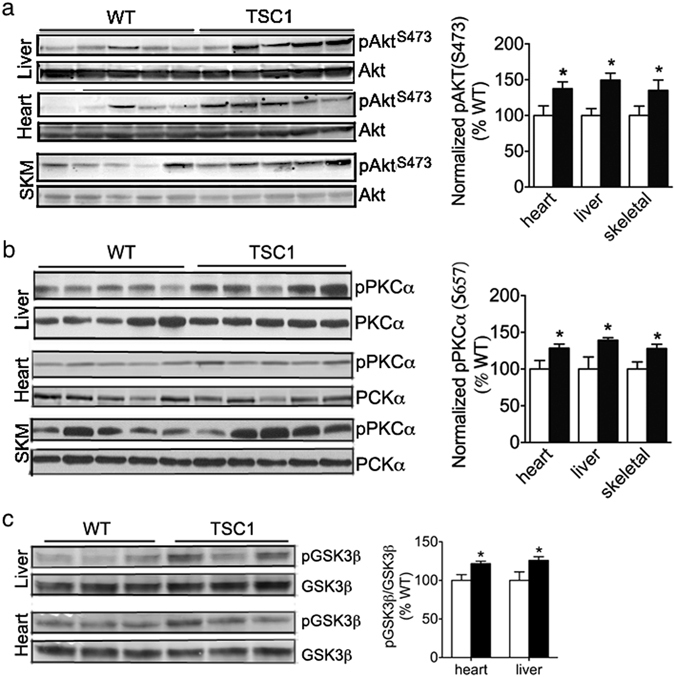
Verification
Claims the paper makes
The claims and statistics of this paper haven’t been checked yet.
Run the check — free, no account needed. It reads the open-access text and checks the sources it cites.
Claims other papers make about this one
Each is checked against this paper’s own text: does it say what the citing paper says it does?
The cited source says what the claim attributes to it.
In the citing paper
“Even partial inhibition of mTORC1 in genetic mouse models (e.g., S6K1−/−, mTOR+/− mLST8+/−, mTORΔ/Δ, TSC1tg) can extend lifespan and healthspan in mice 13,17–19.”
From Targeting the biology of aging with mTOR inhibitors (2023) · cites this paper as [19]
Self-check
Percentages, sums and reported differences re-computed from the paper’s own numbers.
The self-check needs the paper’s full text.
Citations
Cites
Rapamycin fed late in life extends lifespan in genetically heterogeneous mice
Harrison, D. E., Strong, R., Sharp, Z. D., Nelson, J. F., Astle, C. M., Flurkey, K., Nadon, N. L., Wilkinson, J. E., Frenkel, K., Carter, C. S., et al. (2009) · Nature · doi:10.1038/nature08221 · Cited by 3,766
Rheb GTPase is a direct target of TSC2 GAP activity and regulates mTOR signaling
Inoki, K., Li, Y., Xu, T., & Guan, K.-L. (2003) · Genes & Development · doi:10.1101/gad.1110003 · Cited by 1,911
mTOR is a key modulator of ageing and age-related disease
Johnson, S. C., Rabinovitch, P. S., & Kaeberlein, M. (2013) · Nature · doi:10.1038/nature11861 · Cited by 1,676
The TSC1–TSC2 complex: a molecular switchboard controlling cell growth
Huang, J., & Manning, B. D. (2008) · Biochemical Journal · doi:10.1042/bj20080281 · Cited by 1,237
Ribosomal Protein S6 Kinase 1 Signaling Regulates Mammalian Life Span
Selman, C., Tullet, J. M. A., Wieser, D., Irvine, E., Lingard, S. J., Choudhury, A. I., Claret, M., Al-Qassab, H., Carmignac, D., Ramadani, F., et al. (2009) · Science · doi:10.1126/science.1177221 · Cited by 1,120
Influence of TOR kinase on lifespan in C. elegans
Vellai, T., Takacs-Vellai, K., Zhang, Y., Kovacs, A. L., Orosz, L., & Müller, F. (2003) · Nature · doi:10.1038/426620a · Cited by 1,057
Self-citationTee, A. R., Fingar, D. C., Manning, B. D., Kwiatkowski, D. J., Cantley, L. C., & Blenis, J. (2002) · Proceedings of the National Academy of Sciences · doi:10.1073/pnas.202476899 · Cited by 827
A complex interplay between Akt, TSC2 and the two mTOR complexes
Huang, J., & Manning, B. D. (2009) · Biochemical Society Transactions · doi:10.1042/bst0370217 · Cited by 724
Dazert, E., & Hall, M. N. (2011) · Current Opinion in Cell Biology · doi:10.1016/j.ceb.2011.09.003 · Cited by 460
Duration of Rapamycin Treatment Has Differential Effects on Metabolism in Mice
Fang, Y., Westbrook, R., Hill, C., Boparai, R. K., Arum, O., Spong, A., Wang, F., Javors, M. A., Chen, J., Sun, L. Y., et al. (2013) · Cell Metabolism · doi:10.1016/j.cmet.2013.02.008 · Cited by 195
Research works printed but not linked: 55
- Tsang, C. K., Qi, H., Liu, L. F. & Zheng, X. F. Targeting mammalian target of rapamycin (mTOR) for health and diseases. Drug Discov Today 12, 112–124 (2007). · DOI
- Laplante, M. & Sabatini, D. M. mTOR signaling in growth control and disease. Cell 149, 274–293, doi:10.1016/j.cell.2012.03.017 (2012). · DOI · Paper page
- Schieke, S. M. & Finkel, T. TOR and aging: less is more. Cell Metab 5, 233–235 (2007). · DOI
- McCormick, M. A., Tsai, S. Y. & Kennedy, B. K. TOR and ageing: a complex pathway for a complex process. Philos Trans R Soc Lond B Biol Sci. 366, 17–27, doi:10.1098/rstb.2010.0198 (2011). · DOI
- Miller, R. A. et al. Rapamycin-mediated lifespan increase in mice is dose and sex dependent and metabolically distinct from dietary restriction. Aging cell 13, 468–477, doi:10.1111/acel.12194 (2014). · DOI
- Miller, R. A. et al. Rapamycin, but not resveratrol or simvastatin, extends life span of genetically heterogeneous mice. The journals of gerontology. Series A, Biological sciences and medical sciences 66, 191–201, doi:10.1093/gerona/glq178 (2011). · DOI · Paper page
- Zhang, Y. et al. Rapamycin extends life and health in C57BL/6 mice. The journals of gerontology. Series A, Biological sciences and medical sciences 69, 119–130, doi:10.1093/gerona/glt056 (2014). · DOI
- Wu, J. J. et al. Increased mammalian lifespan and a segmental and tissue-specific slowing of aging after genetic reduction of mTOR expression. Cell Rep. 4, 913–920, doi:10.1016/j.celrep.2013.07.030 (2013). · DOI · Paper page
- Kapahi, P. et al. Regulation of lifespan in Drosophila by modulation of genes in the TOR signaling pathway. Curr Biol. 14, 885–890 (2004). · DOI · Paper page
- Kaeberlein, M. et al. Regulation of yeast replicative life span by TOR and Sch9 in response to nutrients. Science 310, 1193–1196 (2005). · DOI · Paper page
- Powers, R. W. 3rd, Kaeberlein, M., Caldwell, S. D., Kennedy, B. K. & Fields, S. Extension of chronological life span in yeast by decreased TOR pathway signaling. Genes Dev. 20, 174–184 (2006). · DOI · Paper page
- Hansen, M. et al. Lifespan extension by conditions that inhibit translation in Caenorhabditis elegans. Aging Cell 6, 95–110 (2007). · DOI · Paper page
- Zoncu, R., Efeyan, A. & Sabatini, D. M. mTOR: from growth signal integration to cancer, diabetes and ageing. Nature reviews. Molecular cell biology 12, 21–35, doi:10.1038/nrm3025 (2011). · DOI · Paper page
- Kennedy, B. K. & Lamming, D. W. The Mechanistic Target of Rapamycin: The Grand ConducTOR of Metabolism and Aging. Cell Metab 23, 990–1003, doi:10.1016/j.cmet.2016.05.009 (2016). · DOI · Paper page
- Hsu, P. P. et al. The mTOR-regulated phosphoproteome reveals a mechanism of mTORC1-mediated inhibition of growth factor signaling. Science 332, 1317–1322, doi:10.1126/science.1199498 (2011). · DOI · Paper page
- Wan, M. et al. Muscle atrophy in transgenic mice expressing a human TSC1 transgene. FEBS Lett. 580, 5621–5627 (2006). · DOI
- Zhu, L. et al. TSC1 controls macrophage polarization to prevent inflammatory disease. Nature communications 5, 4696, doi:10.1038/ncomms5696 (2014). · DOI
- Plank, T. L., Logginidou, H., Klein-Szanto, A. & Henske, E. P. The expression of hamartin, the product of the TSC1 gene, in normal human tissues and in TSC1- and TSC2-linked angiomyolipomas. Mod Pathol. 12, 539–545 (1999).
- Benvenuto, G. et al. The tuberous sclerosis-1 (TSC1) gene product hamartin suppresses cell growth and augments the expression of the TSC2 product tuberin by inhibiting its ubiquitination. Oncogene 19, 6306–6316, doi:10.1038/sj.onc.1204009 (2000). · DOI
- Hay, N. & Sonenberg, N. Upstream and downstream of mTOR. Genes Dev. 18, 1926–1945 (2004). · DOI · Paper page
- Mizushima, N., Yoshimori, T. & Levine, B. Methods in mammalian autophagy research. Cell 140, 313–326, doi:10.1016/j.cell.2010.01.028 (2010). · DOI · Paper page
- Guertin, D. A. et al. Ablation in mice of the mTORC components raptor, rictor, or mLST8 reveals that mTORC2 is required for signaling to Akt-FOXO and PKCalpha, but not S6K1. Dev Cell 11, 859–871 (2006). · DOI
- Deblon, N. et al. Chronic mTOR inhibition by rapamycin induces muscle insulin resistance despite weight loss in rats. British journal of pharmacology 165, 2325–2340, doi:10.1111/j.1476-5381.2011.01716.x (2012). · DOI
- Lamming, D. W. et al. Rapamycin-induced insulin resistance is mediated by mTORC2 loss and uncoupled from longevity. Science 335, 1638–1643, doi:10.1126/science.1215135 (2012). · DOI · Paper page
- Pereira, M. J. et al. mTOR inhibition with rapamycin causes impaired insulin signalling and glucose uptake in human subcutaneous and omental adipocytes. Molecular and cellular endocrinology 355, 96–105, doi:10.1016/j.mce.2012.01.024 (2012). · DOI
- Yang, S. B. et al. Rapamycin induces glucose intolerance in mice by reducing islet mass, insulin content, and insulin sensitivity. J Mol Med (Berl) 90, 575–585, doi:10.1007/s00109-011-0834-3 (2012). · DOI
- Inoki, K., Zhu, T. & Guan, K. L. TSC2 mediates cellular energy response to control cell growth and survival. Cell 115, 577–590 (2003). · DOI · Paper page
- Fulop, T. et al. Aging, frailty and age-related diseases. Biogerontology 11, 547–563, doi:10.1007/s10522-010-9287-2 (2010). · DOI
- Watorek, E., Szymczak, M., Boratynska, M., Patrzalek, D. & Klinger, M. Cardiovascular risk in kidney transplant recipients receiving mammalian target of rapamycin inhibitors. Transplantation proceedings 43, 2967–2969, doi:10.1016/j.transproceed.2011.08.009 (2011). · DOI
- Soesanto, W. et al. Mammalian target of rapamycin is a critical regulator of cardiac hypertrophy in spontaneously hypertensive rats. Hypertension 54, 1321–1327 (2009). · DOI
- Turska-Kmiec, A. et al. Reversal of tacrolimus-related hypertrophic cardiomyopathy after conversion to rapamycin in a pediatric liver transplant recipient. Pediatr Transplant 11, 319–323 (2007). · DOI
- Kuzman, J. A., O’Connell, T. D. & Gerdes, A. M. Rapamycin prevents thyroid hormone-induced cardiac hypertrophy. Endocrinology 148, 3477–3484 (2007). · DOI
- McMullen, J. R. et al. Inhibition of mTOR signaling with rapamycin regresses established cardiac hypertrophy induced by pressure overload. Circulation 109, 3050–3055 (2004). · DOI
- Shioi, T. et al. Rapamycin attenuates load-induced cardiac hypertrophy in mice. Circulation 107, 1664–1670 (2003). · DOI
- Boluyt, M. O. et al. Rapamycin inhibits alpha 1-adrenergic receptor-stimulated cardiac myocyte hypertrophy but not activation of hypertrophy-associated genes. Evidence for involvement of p70 S6 kinase. Circ Res 81, 176–186 (1997). · DOI
- Sadoshima, J. & Izumo, S. Rapamycin selectively inhibits angiotensin II-induced increase in protein synthesis in cardiac myocytes in vitro. Potential role of 70-kD S6 kinase in angiotensin II-induced cardiac hypertrophy. Circulation research 77, 1040–1052 (1995). · DOI
- Leenen, F. H., White, R. & Yuan, B. Isoproterenol-induced cardiac hypertrophy: role of circulatory versus cardiac renin-angiotensin system. American journal of physiology. Heart and circulatory physiology 281, H2410–2416 (2001). · DOI
- Smeets, P. J. et al. Cardiac hypertrophy is enhanced in PPAR alpha−/− mice in response to chronic pressure overload. Cardiovasc Res 78, 79–89, doi:10.1093/cvr/cvn001 (2008). · DOI
- Itoh, N. & Ohta, H. Pathophysiological roles of FGF signaling in the heart. Front Physiol 4, 247, doi:10.3389/fphys.2013.00247 (2013). · DOI
- Smeets, P. J. et al. Inflammatory pathways are activated during cardiomyocyte hypertrophy and attenuated by peroxisome proliferator-activated receptors PPARalpha and PPARdelta. J Biol Chem 283, 29109–29118 (2008). · DOI
- Wilkinson, J. E. et al. Rapamycin slows aging in mice. Aging cell 11, 675–682, doi:10.1111/j.1474-9726.2012.00832.x (2012). · DOI · Paper page
- Austad, S. N. & Bartke, A. Sex Differences in Longevity and in Responses to Anti-Aging Interventions: A Mini-Review. Gerontology 62, 40–46, doi:10.1159/000381472 (2015). · DOI
- Arriola Apelo, S. I., Pumper, C. P., Baar, E. L., Cummings, N. E. & Lamming, D. W. Intermittent Administration of Rapamycin Extends the Life Span of Female C57BL/6J Mice. J Gerontol A Biol Sci Med Sci 71, 876–881, doi:10.1093/gerona/glw064 (2016). · DOI
- Jankiewicz, M., Groner, B. & Desrivieres, S. Mammalian target of rapamycin regulates the growth of mammary epithelial cells through the inhibitor of deoxyribonucleic acid binding Id1 and their functional differentiation through Id2. Mol Endocrinol 20, 2369–2381, doi:10.1210/me.2006-0071 (2006). · DOI
- Bionaz, M. & Loor, J. J. Gene networks driving bovine mammary protein synthesis during the lactation cycle. Bioinform Biol Insights 5, 83–98, doi:10.4137/BBI.S7003 (2011). · DOI
- Baar, E. L., Carbajal, K. A., Ong, I. M. & Lamming, D. W. Sex- and tissue-specific changes in mTOR signaling with age in C57BL/6J mice. Aging Cell 15, 155–166, doi:10.1111/acel.12425 (2016). · DOI · Paper page
- Balasubramanian, S. et al. mTOR in growth and protection of hypertrophying myocardium. Cardiovasc Hematol Agents Med Chem 7, 52–63 (2009). · DOI
- Das, A. et al. Mammalian target of rapamycin (mTOR) inhibition with rapamycin improves cardiac function in type 2 diabetic mice: potential role of attenuated oxidative stress and altered contractile protein expression. The Journal of biological chemistry 289, 4145–4160, doi:10.1074/jbc.M113.521062 (2014). · DOI
- Dai, D. F. et al. Altered proteome turnover and remodeling by short-term caloric restriction or rapamycin rejuvenate the aging heart. Aging cell 13, 529–539, doi:10.1111/acel.12203 (2014). · DOI
- Aoyagi, T. et al. Cardiac mTOR protects the heart against ischemia-reperfusion injury. American journal of physiology. Heart and circulatory physiology 303, H75–85, doi:10.1152/ajpheart.00241.2012 (2012). · DOI
- Hernandez, G. et al. A novel cardioprotective p38-MAPK/mTOR pathway. Experimental cell research 317, 2938–2949, doi:10.1016/j.yexcr.2011.09.011 (2011). · DOI
- Huang, J., Dibble, C. C., Matsuzaki, M. & Manning, B. D. The TSC1-TSC2 complex is required for proper activation of mTOR complex 2. Mol Cell Biol 28, 4104–4115 (2008). · DOI
- Shende, P. et al. Cardiac mTOR complex 2 preserves ventricular function in pressure-overload hypertrophy. Cardiovasc Res. 109, 103–114, doi:10.1093/cvr/cvv252 (2016). · DOI
- Ikeno, Y. et al. Housing density does not influence the longevity effect of calorie restriction. The journals of gerontology. Series A, Biological sciences and medical sciences 60, 1510–1517 (2005). · DOI · Paper page
- Yano, H. et al. Exhaustive exercise reduces TNF-alpha and IFN-alpha production in response to R-848 via toll-like receptor 7 in mice. Eur J Appl Physiol 110, 797–803, doi:10.1007/s00421-010-1560-1 (2010). · DOI
Cited by
Sorted by citations
Molecular mechanisms of dietary restriction promoting health and longevity
Green, C. L., Lamming, D. W., & Fontana, L. (2022) · Nature Reviews Molecular Cell Biology · doi:10.1038/s41580-021-00411-4 · Cited by 714
Targeting the biology of aging with mTOR inhibitors
Mannick, J. B., & Lamming, D. W. (2023) · Nature Aging · doi:10.1038/s43587-023-00416-y · Cited by 372
TOR‐mediated regulation of metabolism in aging
Antikainen, H., Driscoll, M., Haspel, G., & Dobrowolski, R. (2017) · Aging Cell · doi:10.1111/acel.12689 · Cited by 122
“that overexpression of TSC1 in mice extends their lifespan and healthspan (Zhang et al., 2017).”
BackgroundSex-Specific Gene Expression and Life Span Regulation
Tower, J. (2017) · Trends in Endocrinology & Metabolism · doi:10.1016/j.tem.2017.07.002 · Cited by 118
Metadata
- Authors
- Zhang, H.-M., Diaz, V., Walsh, M. E., & Zhang, Y.
- Venue
- Scientific Reports
- Published
- 2017-04-11
- Volume
- 7
- Issue
- 1
- ISSN
- 2045-2322
- PMC
- PMC5429778
- Cited by
- 31
- References
- 11
- Language
- en
About these checks
Registry, retraction, Cites and statistics results are computed, not judged, with one exception: a printed reference that no index lists is read once by a model before it counts as a citation error. Claims are extracted by a model and kept only when their quote appears verbatim in the text; each cited source is then checked, with a model’s help, for whether it says what the claim relies on. Those verdicts can be wrong — read the claim’s quote and the cited source before relying on one.
Statistics and arithmetic are recomputed, not judged.
Confidence bands are shown only for fields calibrated on our annotated test set. None is calibrated yet, so no band is shown.
What counts as a claim ›How we measure confidence ›How we check this ›
Are you an author, or do you see a problem with this page? Request a review
