

The DOI matches its Crossref record; 80 of the 80 references it cites were found in a registry or an index.
Species composition and environmental adaptation of indigenous Chinese cattle
Open accessPublished version of a preprint
Abstract
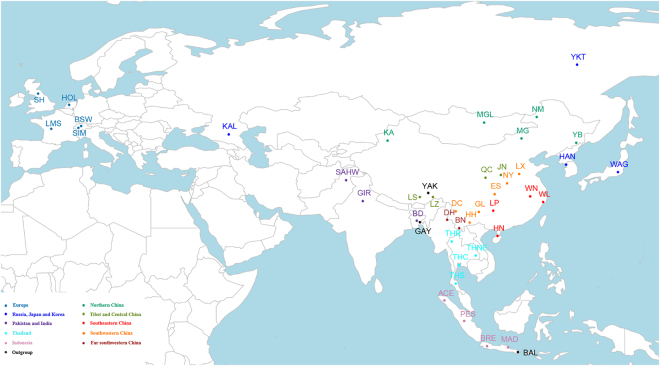
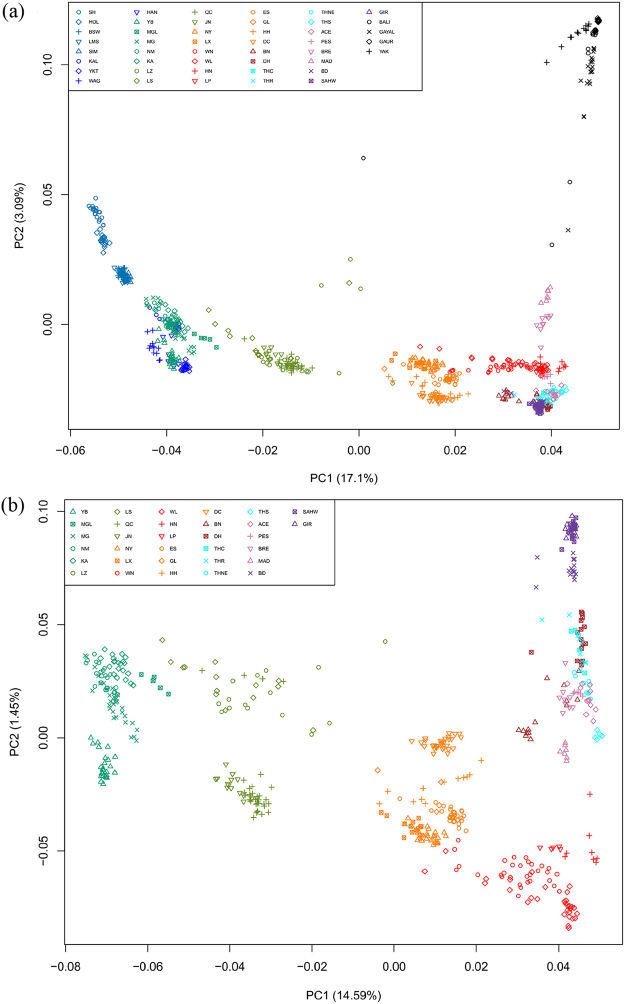
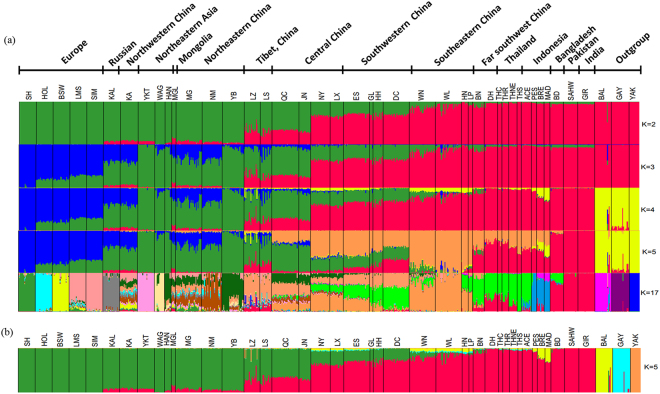
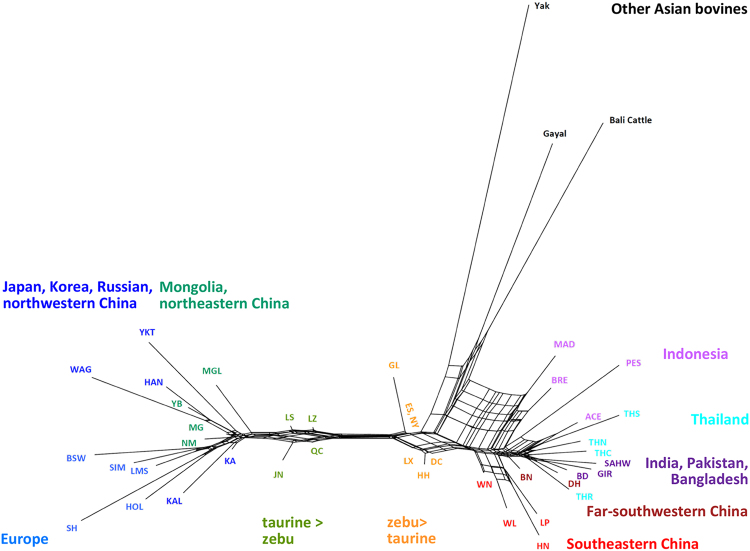
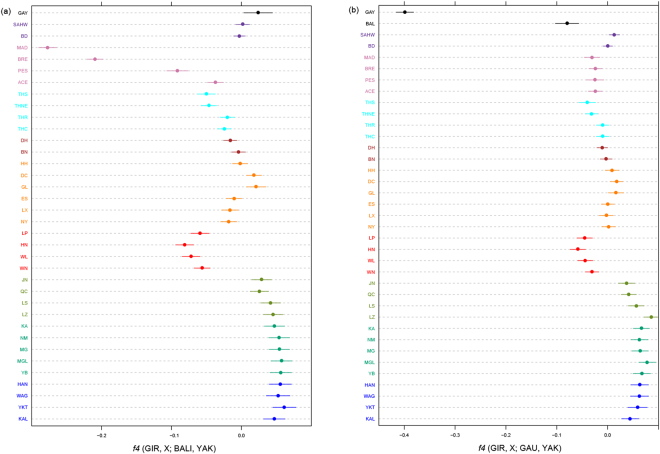
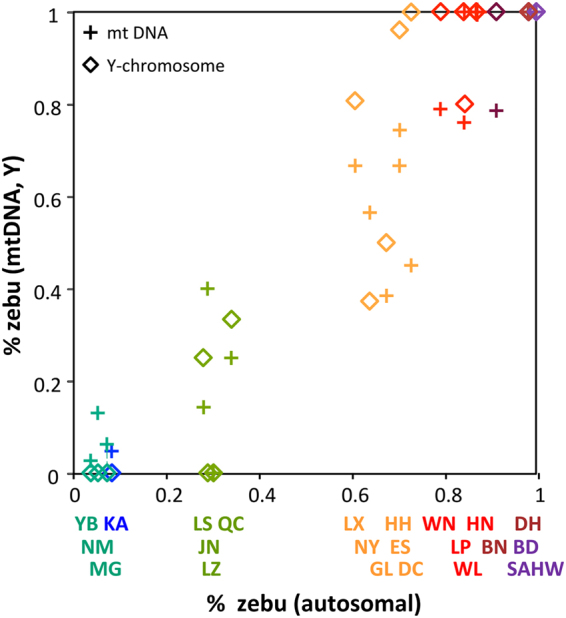
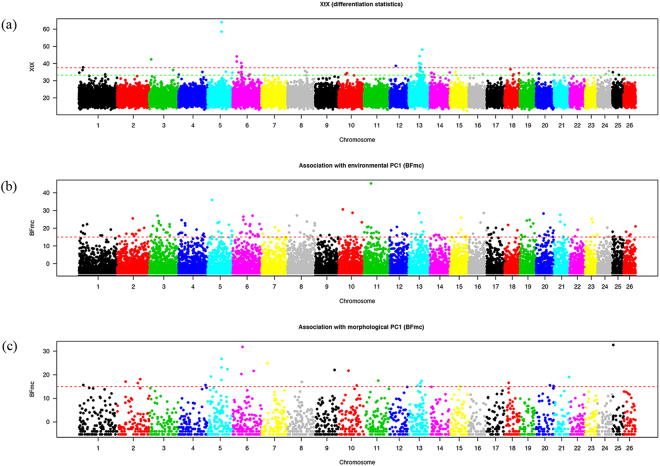
Indigenous Chinese cattle combine taurine and indicine origins and occupy a broad range of different environments. By 50 K SNP genotyping we found a discontinuous distribution of taurine and indicine cattle ancestries with extremes of less than 10% indicine cattle in the north and more than 90% in the far south and southwest China. Model-based clustering and f4-statistics indicate introgression of both banteng and gayal into southern Chinese cattle while the sporadic yak influence in cattle in or near Tibetan area validate earlier findings of mitochondrial DNA analysis. Geographic patterns of taurine and indicine mitochondrial and Y-chromosomal DNA diversity largely agree with the autosomal cline. The geographic distribution of the genomic admixture of different bovine species is proposed to be the combined effect of prehistoric immigrations, gene flow, major rivers acting as genetic barriers, local breeding objectives and environmental adaptation. Whole-genome scan for genetic differentiation and association analyses with both environmental and morphological covariables are remarkably consistent with previous studies and identify a number of genes implicated in adaptation, which include TNFRSF19, RFX4, SP4 and several coat color genes. We propose indigenous Chinese cattle as a unique and informative resource for gene-level studies of climate adaptation in mammals.
Overview
The claims and statistics of this paper haven’t been checked yet.
Run the check — free, no account needed. It reads the open-access text and checks the sources it cites.
Integrity signals
Registry
Cites
Statistics
Figures
Verification
Claims the paper makes
The claims and statistics of this paper haven’t been checked yet.
Run the check — free, no account needed. It reads the open-access text and checks the sources it cites.
Claims other papers make about this one
Each is checked against this paper’s own text: does it say what the citing paper says it does?
The source backs part of the claim, not all of it — or backs it for a different population, condition or comparison.
In the citing paper
“The rapid adaptation of East Asian cattle to hot and humid environments and high-altitude environments was promoted by localized introgression from other bovine species [65,66].”
From The Genomic Landscape of Cattle: Domestication, Dispersal, and Adaptive Evolution (2026) · cites this paper as [65]
Experimental — accuracy not yet measured
Self-check
Percentages, sums and reported differences re-computed from the paper’s own numbers.
The self-check needs the paper’s full text.
Citations
Cites
PLINK: a tool set for whole-genome association and population-based linkage analyses.
Purcell, S., Neale, B., Todd-Brown, K., Thomas, L., Ferreira, M. A. R., Bender, D., Maller, J., Sklar, P., de Bakker, P. I. W., Daly, M. J., et al. (2007) · The American Journal of Human Genetics · doi:10.1086/519795 · Cited by 34,089
DnaSP v5: a software for comprehensive analysis of DNA polymorphism data
Librado, P., & Rozas, J. (2009) · Bioinformatics · doi:10.1093/bioinformatics/btp187 · Cited by 16,147
Fast model-based estimation of ancestry in unrelated individuals
Alexander, D. H., Novembre, J., & Lange, K. (2009) · Genome Research · doi:10.1101/gr.094052.109 · Cited by 9,898
Application of Phylogenetic Networks in Evolutionary Studies
Huson, D. H., & Bryant, D. (2005) · Molecular Biology and Evolution · doi:10.1093/molbev/msj030 · Cited by 8,895
distruct : a program for the graphical display of population structure
Rosenberg, N. A. (2003) · Molecular Ecology Notes · doi:10.1046/j.1471-8286.2003.00566.x · Cited by 4,959
Ancient Admixture in Human History
Patterson, N., Moorjani, P., Luo, Y., Mallick, S., Rohland, N., Zhan, Y., Genschoreck, T., Webster, T., & Reich, D. (2012) · Genetics · doi:10.1534/genetics.112.145037 · Cited by 2,848
A high-performance computing toolset for relatedness and principal component analysis of SNP data
Zheng, X., Levine, D., Shen, J., Gogarten, S. M., Laurie, C. C., & Weir, B. S. (2012) · Bioinformatics · doi:10.1093/bioinformatics/bts606 · Cited by 2,510
Todesco, M., Pascual, M. A., Owens, G. L., Ostevik, K. L., Moyers, B. T., Hübner, S., Heredia, S. M., Hahn, M. A., Caseys, C., Bock, D. G., et al. (2016) · Evolutionary Applications · doi:10.1111/eva.12367 · Cited by 867
Robust Identification of Local Adaptation from Allele Frequencies
Günther, T., & Coop, G. (2013) · Genetics · doi:10.1534/genetics.113.152462 · Cited by 615
Hagen, G., Müller, S., Beato, M., & Suske, G. (1992) · Nucleic Acids Research · doi:10.1093/nar/20.21.5519 · Cited by 560
Genome-Wide Scan for Adaptive Divergence and Association with Population-Specific Covariates
Gautier, M. (2015) · Genetics · doi:10.1534/genetics.115.181453 · Cited by 532
Worldwide Patterns of Ancestry, Divergence, and Admixture in Domesticated Cattle
Decker, J. E., McKay, S. D., Rolf, M. M., Kim, J., Molina Alcalá, A., Sonstegard, T. S., Hanotte, O., Götherström, A., Seabury, C. M., Praharani, L., et al. (2014) · PLoS Genetics · doi:10.1371/journal.pgen.1004254 · Cited by 521
Mitochondrial Genomes of Extinct Aurochs Survive in Domestic Cattle
Achilli, A., Olivieri, A., Pellecchia, M., Uboldi, C., Colli, L., Al-Zahery, N., Accetturo, M., Pala, M., Kashani, B. H., Perego, U. A., et al. (2008) · Current Biology · doi:10.1016/j.cub.2008.01.019 · Cited by 290
The Genome Landscape of Indigenous African Cattle
Kim, J., Hanotte, O., Mwai, O. A., Dessie, T., Bashir, S., Diallo, B., Agaba, M., Kim, K., Kwak, W., Sung, S., et al. (2017) · Genome biology · doi:10.1186/s13059-017-1153-y · Cited by 271
Zebu Cattle Are an Exclusive Legacy of the South Asia Neolithic
Chen, S., Lin, B.-Z., Baig, M., Mitra, B., Lopes, R. J., Santos, A. M., Magee, D. A., Azevedo, M., Tarroso, P., Sasazaki, S., et al. (2010) · Molecular Biology and Evolution · doi:10.1093/molbev/msp213 · Cited by 248
Resolving the evolution of extant and extinct ruminants with high-throughput phylogenomics
Decker, J. E., Pires, J. C., Conant, G. C., McKay, S., Heaton, M. P., Chen, K., Cooper, A., Vilkki, J., Seabury, C. M., Caetano, A. R., et al. (2009) · Proceedings of the National Academy of Sciences · doi:10.1073/pnas.0904691106 · Cited by 225
New World Cattle Show Ancestry from Multiple Independent Domestication Events
McTavish, E. J., Decker, J. E., Schnabel, R. D., Taylor, J. F., & Hillis, D. M. (2013) · Proceedings of the National Academy of Sciences · doi:10.1073/pnas.1303367110 · Cited by 218
Insights into the Genetic History of French Cattle from Dense SNP Data on 47 Worldwide Breeds
Gautier, M., Laloë, D., & Moazami‐Goudarzi, K. (2010) · PLoS ONE · doi:10.1371/journal.pone.0013038 · Cited by 214
Genomic Signatures Reveal New Evidences for Selection of Important Traits in Domestic Cattle
Xu, L., Bickhart, D. M., Cole, J. B., Schroeder, S., Song, J., Tassell, C. P. V., Sonstegard, T. S., & Liu, G. E. (2014) · Molecular Biology and Evolution · doi:10.1093/molbev/msu333 · Cited by 204
A whole genome Bayesian scan for adaptive genetic divergence in West African cattle
Gautier, M., Flori, L., Riebler, A., Jaffrézic, F., Laloë, D., Gut, I. G., Moazami‐Goudarzi, K., & Foulley, J. (2009) · BMC Genomics · doi:10.1186/1471-2164-10-550 · Cited by 200
Mannen, H., Kohno, M., Nagata, Y., Tsuji, S., Bradley, D. G., Yeo, J. S., Nyamsamba, D., Zagdsuren, Y., Yokohama, M., Nomura, K., et al. (2004) · Molecular Phylogenetics and Evolution · doi:10.1016/j.ympev.2004.01.010 · Cited by 187
On the History of Cattle Genetic Resources
Felius, M., Beerling, M.-L., Buchanan, D., Theunissen, B., Koolmees, P., & Lenstra, J. (2014) · Diversity · doi:10.3390/d6040705 · Cited by 176
Self-citationFootprints of selection in the ancestral admixture of a New World Creole cattle breed
Gautier, M., & Navès, M. (2011) · Molecular Ecology · doi:10.1111/j.1365-294x.2011.05163.x · Cited by 168
The Genetic Architecture of Climatic Adaptation of Tropical Cattle
Porto-Neto, L. R., Reverter, A., Prayaga, K. C., Chan, E. K. F., Johnston, D. J., Hawken, R., Fordyce, G., Garcia, J. F., Sonstegard, T. S., Bolormaa, S., et al. (2014) · PLoS ONE · doi:10.1371/journal.pone.0113284 · Cited by 163
Liu, Y., Qin, X., Song, X., Jiang, H., Shen, Y., Durbin, K. J., Lien, S., Kent, M., Sodeland, M., Ren, Y., et al. (2009) · BMC Genomics · doi:10.1186/1471-2164-10-180 · Cited by 159
A working model of the deep relationships of diverse modern human genetic lineages outside of Africa
Lipson, M., & Reich, D. (2016) · Molecular Biology and Evolution · doi:10.1093/molbev/msw293 · Cited by 146
Genetic Diversity and Origin of Chinese Cattle Revealed by mtDNA D-Loop Sequence Variation
Lai, S.-J., Liu, Y.-P., Liu, Y.-X., Li, X.-W., & Yao, Y.-G. (2006) · Molecular Phylogenetics and Evolution · doi:10.1016/j.ympev.2005.06.013 · Cited by 143
Detection of selective sweeps in cattle using genome-wide SNP data
Ramey, H. R., Decker, J. E., McKay, S., Rolf, M. M., Schnabel, R. D., & Taylor, J. F. (2013) · BMC Genomics · doi:10.1186/1471-2164-14-382 · Cited by 132
Gage, P. J., Qian, M., Wu, D., & Rosenberg, K. I. (2008) · Developmental Biology · doi:10.1016/j.ydbio.2008.02.030 · Cited by 132
Identification and characterization of novel human tissue-specific RFX transcription factors
Aftab, S., Semenec, L., Chu, J. S.-C., & Chen, N. (2008) · BMC Evolutionary Biology · doi:10.1186/1471-2148-8-226 · Cited by 129
Tropical Cattle: Origins, Breeds and Breeding Policies
Payne, W. J. A., & Hodges, J. R. (1997) · Medical Entomology and Zoology · Cited by 110
Gutiérrez‐Gil, B., Arranz, J. J., & Wiener, P. (2015) · Frontiers in Genetics · doi:10.3389/fgene.2015.00167 · Cited by 110
Blackshear, P. J., Graves, J. P., Stumpo, D. J., Cobos, I., Rubenstein, J. L. R., & Zeldin, D. C. (2003) · Development · doi:10.1242/dev.00661 · Cited by 110
Maternal and paternal genealogy of Eurasian taurine cattle (Bos taurus)
Kantanen, J., Edwards, C. J., Bradley, D. G., Viinalass, H., Thessler, S., Ivanova, Z., Kiselyova, T., Ćinkulov, M., Popov, R. G., Stojanović, S., et al. (2009) · Heredity · doi:10.1038/hdy.2009.68 · Cited by 107
A Meta-Assembly of Selection Signatures in Cattle
Randhawa, I. A. S., Khatkar, M. S., Thomson, P. C., & Raadsma, H. W. (2016) · PLoS ONE · doi:10.1371/journal.pone.0153013 · Cited by 103
Origin and Phylogeographical Structure of Chinese Cattle
Lei, C. Z., Chen, H., Zhang, H. C., Cai, X., Liu, R. Y., Luo, L. Y., Wang, C. F., Zhang, W., Ge, Q. L., Zhang, R. F., et al. (2006) · Animal Genetics · doi:10.1111/j.1365-2052.2006.01524.x · Cited by 98
The evolution of tropical adaptation: comparing taurine and zebu cattle
Chan, E. K. F., Nagaraj, S. H., & Reverter, A. (2010) · Animal Genetics · doi:10.1111/j.1365-2052.2010.02053.x · Cited by 97
Genome-Wide Mapping of Loci Explaining Variance in Scrotal Circumference in Nellore Cattle
Utsunomiya, Y. T., do Carmo, A. S., Neves, H. H. D. R., Carvalheiro, R., Matos, M. C., Zavarez, L. B., Ito, P. K. R. K., O’Brien, A. M. P., Sölkner, J., Porto-Neto, L. R., et al. (2014) · PLoS ONE · doi:10.1371/journal.pone.0088561 · Cited by 96
Uncovering Adaptation from Sequence Data: Lessons from Genome Resequencing of Four Cattle Breeds
Boitard, S., Boussaha, M., Capitan, A., Rocha, D., & Servin, B. (2016) · Genetics · doi:10.1534/genetics.115.181594 · Cited by 90
Edwards, C. J., Ginja, C., Kantanen, J., Pérez-Pardal, L., Tresset, A., Stock, F., Gama, L. T., Penedo, M. C. T., Bradley, D. G., Lenstra, J. A., et al. (2011) · PLoS ONE · doi:10.1371/journal.pone.0015922 · Cited by 88
Adaptive admixture in the W est A frican bovine hybrid zone: insight from the B orgou population
Flori, L., Thévenon, S., Dayo, G., Sènou, M., Sylla, S., Berthier, D., Moazami‐Goudarzi, K., & Gautier, M. (2014) · Molecular Ecology · doi:10.1111/mec.12816 · Cited by 87
On the Origin of Indonesian Cattle
Mohamad, K., Olsson, M., van Tol, H. T. A., Mikko, S., Vlamings, B. H., Andersson, G., Rodríguez‐Martínez, H., Purwantara, B., Paling, R. W., Colenbrander, B., et al. (2009) · PLoS ONE · doi:10.1371/journal.pone.0005490 · Cited by 86
The Origins of Chinese Domestic Cattle as Revealed by Ancient DNA Analysis
Cai, D., Sun, Y., Tang, Z., Hu, S., Li, W., Zhao, X., Xiang, H., & Zhou, H. (2014) · Journal of Archaeological Science · doi:10.1016/j.jas.2013.09.003 · Cited by 85
Zhang, Y., Lu, Y., Yindee, M., Li, K., Kuo, H.-Y., Ju, Y., Ye, S., Faruque, M. O., Li, Q., Wang, Y., et al. (2015) · Molecular Ecology · doi:10.1111/mec.13518 · Cited by 85
Kikkawa, Y., Takada, T., Sutopo, S., Nomura, K., NAMIKAWA, T., Yonekawa, H., & Amano, T. (2003) · Animal Genetics · doi:10.1046/j.1365-2052.2003.00956.x · Cited by 84
Pispa, J., Mikkola, M. L., Mustonen, T., & Thesleff, I. (2003) · Gene Expression Patterns · doi:10.1016/s1567-133x(03)00092-9 · Cited by 78
Fortes, M. R. S., Snelling, W. M., Reverter, A., Nagaraj, S. H., Lehnert, S. A., Hawken, R., DeAtley, K. L., PETERS, S. O., Silver, G. A., Rincón, G., et al. (2012) · Journal of Animal Science · doi:10.2527/jas.2011-4601 · Cited by 76
Choi, J.-W., Choi, B., Lee, S. H., Lee, S. S., Kim, H., Yu, D., Chung, W., Lee, K., Chai, H., Cho, Y.-M., et al. (2015) · Molecules and Cells · doi:10.14348/molcells.2015.0019 · Cited by 74
Cai, X. M., Chen, H., Lei, C., Wang, S., Xue, K., & Bao, Z. (2007) · Genetica · doi:10.1007/s10709-006-9129-y · Cited by 69
Lenstra, J. A., Ajmone‐Marsan, P., Beja‐Pereira, A., Bollongino, R., Bradley, D. G., Colli, L., Gaetano, A. D., Edwards, C. J., Felius, M., Ferretti, L., et al. (2014) · Diversity · doi:10.3390/d6010178 · Cited by 69
Mbole-Kariuki, M. N., Sonstegard, T., Orth, A., Thumbi, S. M., Bronsvoort, B. M. D. C., Kiara, H., Toye, P., Conradie, I., Jennings, A., Coetzer, K., et al. (2014) · Heredity · doi:10.1038/hdy.2014.31 · Cited by 69
Transcription Factor SP4 Is a Susceptibility Gene for Bipolar Disorder
Zhou, X., Tang, W., Greenwood, T. A., Guo, S., He, L., Geyer, M. A., & Kelsoe, J. R. (2009) · PLoS ONE · doi:10.1371/journal.pone.0005196 · Cited by 65
Qi, X. B., Jianlin, H., Wang, G., Rege, J. E. O., & Hanotte, O. (2009) · Animal Genetics · doi:10.1111/j.1365-2052.2009.01989.x · Cited by 64
Pausch, H., Wang, X., Jung, S., Krogmeier, D., Edel, C., Emmerling, R., Götz, K., & Fries, R. (2012) · PLoS ONE · doi:10.1371/journal.pone.0036346 · Cited by 64
Biology of epidermal and hair pigmentation in cattle: a mini‐review
Seo, K.-S., Mohanty, T. R., Choi, T., & Hwang, I. (2007) · Veterinary Dermatology · doi:10.1111/j.1365-3164.2007.00634.x · Cited by 64
Picardo, M., & Cardinali, G. (2011) · Journal of Investigative Dermatology · doi:10.1038/jid.2011.67 · Cited by 63
Mitochondrial DNA variation in cattle of South China: origin and introgression
Yu, Y., Nie, L., He, Z.-Q., Wen, J., Jian, C.-S., & Zhang, Y. (1999) · Animal Genetics · doi:10.1046/j.1365-2052.1999.00483.x · Cited by 61
Characterization of TNFRSF19, a Novel Member of the Tumor Necrosis Factor Receptor Superfamily
Hu, S., Tamada, K., Ni, J., Vincenz, C., & Chen, L. (1999) · Genomics · doi:10.1006/geno.1999.5979 · Cited by 61
Miller, J. M., Kijas, J., Heaton, M. P., McEwan, J. C., & Coltman, D. W. (2012) · Molecular Ecology Resources · doi:10.1111/1755-0998.12017 · Cited by 61
Development and Characterization of a High Density SNP Genotyping Assay for Cattle
Matukumalli, L. K., Lawley, C. T., Schnabel, R. D., et al. (2009) · PLoS ONE · doi:10.1371/journal.pone.0005350 · Cited by 59
Cattle genome-wide analysis reveals genetic signatures in trypanotolerant N’Dama
Kim, S., Ka, S., Ha, J.-W., Kim, J., Yoo, D., Kim, K., Lee, H., Lim, D., Cho, S., Hanotte, O., et al. (2017) · BMC Genomics · doi:10.1186/s12864-017-3742-2 · Cited by 51
Systematics and phylogeny of cattle.
Hassanin, A. (2014) · CABI eBooks · doi:10.1079/9781780642215.0001 · Cited by 50
Zhang, G. X., Wang, Z., Chen, W. S., Wu, C., Han, X., Chang, H., Zan, L., Li, R., Wang, J. H., Song, W. T., et al. (2007) · Animal Genetics · doi:10.1111/j.1365-2052.2007.01644.x · Cited by 46
Gou, X., Wang, Y., Yang, S., Deng, W., & Mao, H. (2010) · Journal of Animal Breeding and Genetics · doi:10.1111/j.1439-0388.2009.00807.x · Cited by 40
Paternal Origins of Chinese Cattle
Li, R., Zhang, X. M., Campana, M. G., Huang, J. P., Chang, Z. H., Qi, X. B., Shi, H., Su, B., Zhang, R. F., Lan, X. Y., et al. (2013) · Animal Genetics · doi:10.1111/age.12022 · Cited by 40
A new insight into cattle's maternal origin in six Asian countries
Jia, S., Zhou, Y., Lei, C., Yao, R., Zhang, Z., Fang, X., & Chen, H. (2010) · Journal of genetics and genomics/Journal of Genetics and Genomics · doi:10.1016/s1673-8527(09)60035-7 · Cited by 37
The Origin of Indonesian Cattle and Conservation Genetics of the Bali Cattle Breed
Mohamad, K., Olsson, M., Andersson, G., Purwantara, B., van Tol, H. T. A., Rodríguez‐Martínez, H., Colenbrander, B., & Lenstra, J. A. (2011) · Reproduction in Domestic Animals · doi:10.1111/j.1439-0531.2011.01960.x · Cited by 37
Pinacho, R., Valdizán, E. M., Pilar-Cuéllar, F., Prades, R., Tarragó, T., Haro, J. M., Ferrer, I., & Ramos, B. (2014) · Journal of Psychiatric Research · doi:10.1016/j.jpsychires.2014.08.006 · Cited by 33
Sharma, A., Lee, S. H., Lim, D., Chai, H., Choi, B., & Cho, Y. (2016) · BMC Genetics · doi:10.1186/s12863-016-0444-8 · Cited by 31
Mitochondrial DNA Variation and Genetic Relationships in Japanese and Korean Cattle
Sasazaki, S., Odahara, S., HIURA, C., Mukai, F., & Mannen, H. (2006) · Asian-Australasian Journal of Animal Sciences · doi:10.5713/ajas.2006.1394 · Cited by 27
Genetic Analysis of Thai Cattle Reveals a Southeast Asian Indicine Ancestry
Wangkumhang, P., Wilantho, A., Shaw, P. J., Flori, L., Moazami-Goudarzi, K., Gautier, M., Duangjinda, M., Assawamakin, A., & Tongsima, S. (2015) · PeerJ · doi:10.7717/peerj.1318 · Cited by 26
Use of canonical discriminant analysis to study signatures of selection in cattle
Sorbolini, S., Gaspa, G., Steri, R., Dimauro, C., Cellesi, M., Stella, A., Marras, G., Ajmone‐Marsan, P., Valentini, A., & Macciotta, N. P. P. (2016) · Genetics Selection Evolution · doi:10.1186/s12711-016-0236-7 · Cited by 26
When and how did Bos indicus introgress into Mongolian cattle?
Yue, X., Li, R., Li, L., Zhang, Y., Huang, J., Chang, Z., Dang, R., Lan, X., Chen, H., & Lei, C. (2014) · Gene · doi:10.1016/j.gene.2013.12.066 · Cited by 21
Origins of cattle on Chirikof Island, Alaska, elucidated from genome-wide SNP genotypes
Decker, J. E., Taylor, J. F., Kantanen, J., Millbrooke, A., Schnabel, R. D., Alexander, L. J., & MacNeil, M. D. (2016) · Heredity · doi:10.1038/hdy.2016.7 · Cited by 16
Bonfiglio, S., Gaetano, A. D., Tesfaye, K., Grugni, V., Semino, O., & Ferretti, L. (2012) · Animal Genetics · doi:10.1111/j.1365-2052.2012.02328.x · Cited by 15
Diversity of Chinese yellow cattle breeds and their conservation
You-chun, C., & Honghe, C. (2001) · Biodiversity Science · doi:10.17520/biods.2001042 · Cited by 14
Hudson, N. J., Porto-Neto, L. R., Kijas, J., McWilliam, S. M., Taft, R. J., & Reverter, A. (2014) · BMC Bioinformatics · doi:10.1186/1471-2105-15-66 · Cited by 12
Black‐ear gene and blood polymorphism in four southern Chinese cattle groups
Chen, Y., Wang, Y., Cao, H., Pang, Z., & Yang, G. (1994) · Animal Genetics · doi:10.1111/j.1365-2052.1994.tb00408.x · Cited by 6
Jia, S. H. I., Qiao, H., Hosoi, E., & OZAWA, S. (2004) · Nihon Chikusan Gakkaiho · doi:10.2508/chikusan.75.513 · Cited by 5
Ying-ha, Z. (2013) · china Cattle Science · Cited by 2
Research works printed but not linked: 1
- China National Commission of Animal Genetics Resources. Animal genetic resources in China – Bovine. (China Agriculture Press, 2011).
Cited by
Sorted by citations
Chen, N., Cai, Y., Chen, Q., Li, R., Wang, K., Huang, Y., Hu, S., Huang, S., Zhang, H., Zheng, Z., et al. (2018) · Nature Communications · doi:10.1038/s41467-018-04737-0 · Cited by 403
Self-citationGenomic clues of the evolutionary history of Bos indicus cattle
Utsunomiya, Y. T., Milanesi, M., Fortes, M. R. S., Porto‐Neto, L. R., Utsunomiya, A. T. H., Silva, M. V. G. B., Garcia, J. F., & Ajmone‐Marsan, P. (2019) · Animal Genetics · doi:10.1111/age.12836 · Cited by 128
Gorssen, W., Meyermans, R., Janssens, S., & Buys, N. (2021) · Genetics Selection Evolution · doi:10.1186/s12711-020-00599-7 · Cited by 142
Yurchenko, A. A., Daetwyler, H. D., Yudin, N., Schnabel, R. D., Vander Jagt, C. J., Soloshenko, V., Lhasaranov, B., Popov, R., Taylor, J. F., & Larkin, D. M. (2018) · Scientific Reports · doi:10.1038/s41598-018-31304-w · Cited by 117
Weldenegodguad, M., Popov, R. G., Pokharel, K., Ammosov, I., Ming, Y., Ivanova, Z., & Kantanen, J. (2019) · Frontiers in Genetics · doi:10.3389/fgene.2018.00728 · Cited by 100
Metadata
- Authors
- Gao, Y., Gautier, M., Ding, X., Zhang, H., Wang, Y., Wang, X., Faruque, M. O., Li, J., Ye, S., Gou, X., Han, J., Lenstra, J. A., & Zhang, Y.
- Affiliations
- China Agricultural University (CN)
- Centre de Coopération Internationale en Recherche Agronomique pour le Développement (FR)
- Shanxi Academy of Agricultural Sciences (CN)
- Bangladesh Agricultural University (BD)
- Chinese Academy of Agricultural Sciences (CN)
- Yunnan Agricultural University (CN)
- Utrecht University (NL)
- Corresponding author
- Zhang, Yi
- ORCID
- Venue
- Scientific Reports
- Published
- 2017-11-23
- Volume
- 7
- Issue
- 1
- Pages
- 16196-16196
- ISSN
- 2045-2322 (ISSN-L)
- PMC
- PMC5700937
- OpenAlex
- W2952597679
- Cited by
- 112
- References
- 80
- Citations by year
- 2026: 8 · 2025: 16 · 2024: 9 · 2023: 6 · 2022: 16 · 2021: 25 · 2020: 11 · 2019: 10 · 2018: 11
- FWCI
- 5.79
- Type
- journal article
- Language
- en
- Open access
- gold
- doi.org
- Locations
- Scientific Reports (publishedVersion, cc-by)
- Europe PMC (PubMed Central) (publishedVersion, other-oa)
- PubMed Central (publishedVersion, cc-by)
- PubMed (publishedVersion)
- HAL (submittedVersion, other-oa)
- Utrecht University Repository (Utrecht University) (submittedVersion, other-oa)
- Funders
- Universidade do Porto
- China Agricultural Research System (CARS‐37)
- Badan Penelitian dan Pengembangan Pertanian
- Topics
- Life Sciences › Biochemistry, Genetics and Molecular Biology › Genetics › Genetic and phenotypic traits in livestock
- Life Sciences › Biochemistry, Genetics and Molecular Biology › Genetics › Genetic diversity and population structure
- Life Sciences › Biochemistry, Genetics and Molecular Biology › Genetics › Forensic and Genetic Research
- Keywords
- mitochondrial DNA diversity, genetic admixture, climate change adaptation, whole genome scan, genetic differentiation, environmental adaptation, coat color genes, TNFRSF19, Sp4
- MeSH terms
- Alleles, Animals, Cattle, China, DNA, Mitochondrial, Gene Frequency, Haplotypes, Genetic Variation, Y Chromosome, Microsatellite Repeats, Polymorphism, Single Nucleotide
About these checks
Registry, retraction, Cites and statistics results are computed, not judged, with one exception: a printed reference that no index lists is read once by a model before it counts as a citation error. Claims are extracted by a model and kept only when their quote appears verbatim in the text; each cited source is then checked, with a model’s help, for whether it says what the claim relies on. Those verdicts can be wrong — read the claim’s quote and the cited source before relying on one.
Statistics and arithmetic are recomputed, not judged.
Confidence bands are shown only for fields calibrated on our annotated test set. None is calibrated yet, so no band is shown.
What counts as a claim ›How we measure confidence ›How we check this ›
Are you an author, or do you see a problem with this page? Request a review
