

The DOI matches its Crossref record; 122 of the 122 references it cites were found in a registry or an index; 20 of the 56 sources its claims cite were checked for support.
How digital media drive affective polarization through partisan sorting
Open accessAbstract
Politics has in recent decades entered an era of intense polarization. Explanations have implicated digital media, with the so-called echo chamber remaining a dominant causal hypothesis despite growing challenge by empirical evidence. This paper suggests that this mounting evidence provides not only reason to reject the echo chamber hypothesis but also the foundation for an alternative causal mechanism. To propose such a mechanism, the paper draws on the literatures on affective polarization, digital media, and opinion dynamics. From the affective polarization literature, we follow the move from seeing polarization as diverging issue positions to rooted in sorting: an alignment of differences which is effectively dividing the electorate into two increasingly homogeneous megaparties. To explain the rise in sorting, the paper draws on opinion dynamics and digital media research to present a model which essentially turns the echo chamber on its head: it is not isolation from opposing views that drives polarization but precisely the fact that digital media bring us to interact outside our local bubble. When individuals interact locally, the outcome is a stable plural patchwork of cross-cutting conflicts. By encouraging nonlocal interaction, digital media drive an alignment of conflicts along partisan lines, thus effacing the counterbalancing effects of local heterogeneity. The result is polarization, even if individual interaction leads to convergence. The model thus suggests that digital media polarize through partisan sorting, creating a maelstrom in which more and more identities, beliefs, and cultural preferences become drawn into an all-encompassing societal division.
Overview
AI snapshot
Written from the paper’s full text.
TL;DR
The paper proposes a computational model in which digital media drive affective polarization not through echo chambers but through nonlocal interaction that aligns local political cultures into partisan sorting. Simulations show that increasing nonlocal interaction can sharply raise sorting when influence homophily is high, while purely local interaction keeps sorting low.
Key findings
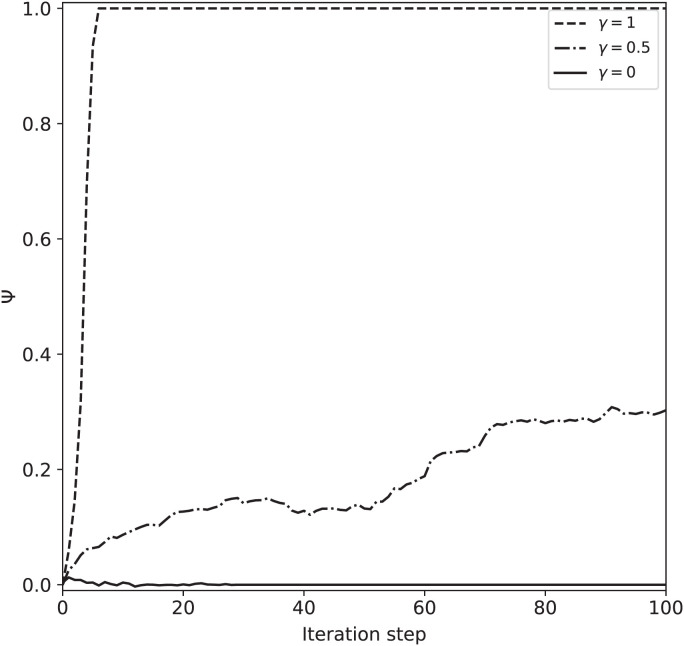
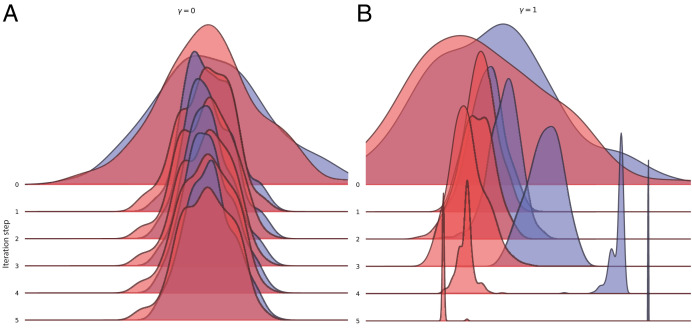
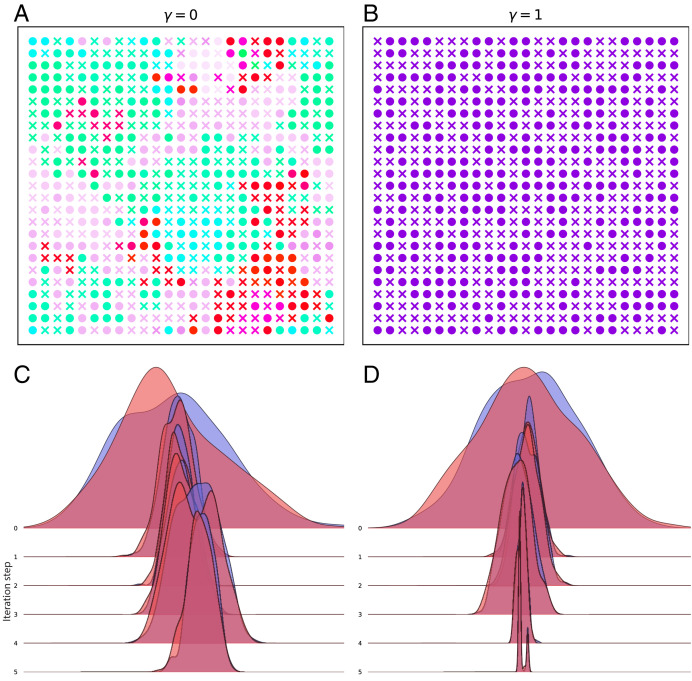
- In example runs with high influence homophily (h = 8; n = 10, |A| = 196, c = 4, m = 10), γ = 1 quickly reaches a high sorting value ψ; γ = 0.5 rises more slowly and settles around ψ = 0.3; γ = 0 remains near the expected ψ = 0.
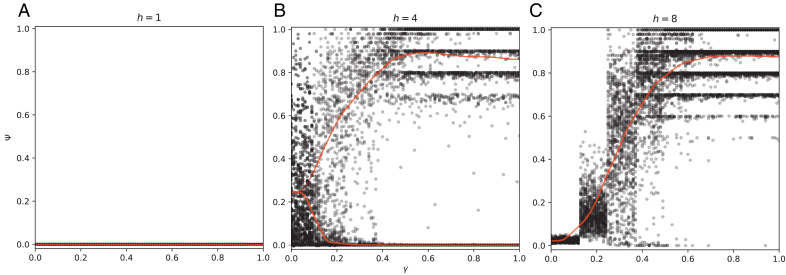
- Across 8,000 simulation runs varying γ and h, low influence homophily (h = 1) produces no partisan sorting regardless of γ; high homophily (h = 8) produces a rapid increase in sorting past a threshold of nonlocal interaction; intermediate homophily (h = 4) shows bistability between low- and high-sorting end states.
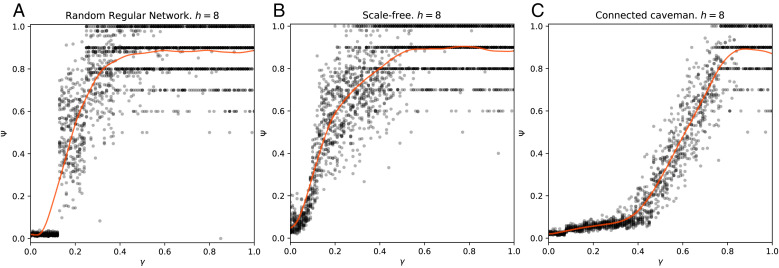
- The same general γ–ψ relationship appears on random regular, scale-free, and connected caveman networks (1,600 runs over the parameter space), though the clique-dominated caveman network requires higher γ before sorting rises.
- With n = 10 dynamic attributes and m = 10 possible states, the chance that two groups share at least one attribute is about 65% (1 − (9/10)^10 ≈ 0.65), which can prevent sorting from reaching 1 and affects convergence probability.
Methods
- Agent-based opinion-dynamics model: agents on a graph (primarily a two-dimensional torus lattice with Moore neighborhood), each with n dynamic attributes taking integer values 1–m and a fixed partisan attribute S (k = 2); partisanship is weighted by c = 4. Each asynchronous update selects a random agent; interlocutors are local neighbors with fraction γ replaced by nodes sampled randomly from the entire network; influence follows an urn model based on relative similarity with homophily parameter h; sorting ψ is the fraction of shared dynamic attributes among same-party agents minus that among different-party agents.
- Simulations: 8,000 runs varying γ and h (Fig. 2 reports h = 1, 4, 8), plus 1,600 runs on three common network structures (random regular, scale-free, connected caveman). Convergence is operationalized as no update during 10 runs across the full number of agents, or after 1,000,000 iterations.
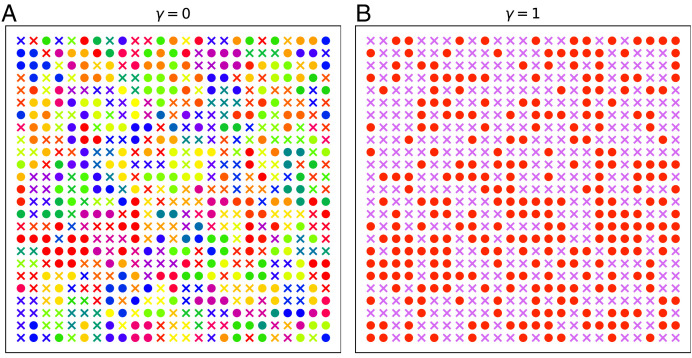
- Analysis: final ψ as a function of γ; PCA on the matrix of distances between agents and ridgeline plots to visualize group distributions over time; grid visualizations treating dynamic attributes as a base-m number.
Limitations
- Stated: partisan affiliation is treated as fixed, assuming it changes on a slower timescale; the model focuses on k = 2 bipolarization (though expandable to k > 2); nonlocal interlocutors are chosen without self-similarity bias, leaving selective-exposure-like bias to future research; the torus lattice is a poor representation of real-world networks, though other network structures are tested; convergence is challenging to prove analytically, so an empirically chosen stopping metric is used.
- Stated: the model is minimal and theoretical; it does not directly measure affective polarization but uses sorting ψ as a proxy linked in the literature; no empirical validation against real-world digital media data is presented.
- Evident: parameter choices (c = 4, h values, n = 10, m = 10, |A| = 196 or 625) and simulation stopping rules may affect results; causal claims about digital media are model-derived, not empirically tested; the paper notes academic debate about how far political divisions dominate cultural life, and cites a study finding most lifestyle preferences remain shared across the political divide.
Model-written summary. Check it against the paper before relying on it.
Integrity signals
Registry
Cites
Statistics
Figures
Verification
Claims the paper makes
18 Own interpretation · 13 No basis given · 8 Partly supported · 8 No full text of the sources · 8 Own result · 4 Supported so far · 2 Supported · 2 Sources not found · 2 Not checked yet · 1 Own method · accuracy not yet measured
The cited sources support only part of this claim — read each source’s verdict below.
In the paper
“Research using internet traffic data has even suggested that the online news audience is in fact less ideologically segregated than in-person interactions with family, friends, coworkers, and political discussants (70–72).”
§ How digital media drive affective polarization through partisan sorting > Media and Polarization
What the sources say
- Partly supportedcites [70] M. Gentzkow, J. M. Shapiro, Ideological segregation online and offline. Q. J. Econ. 126, 1799– 1839 (2011). sourceExperimental — accuracy not yet measured
Section 4.1 reports that Internet news segregation is lower than segregation in face-to-face interactions involving families, workplaces, and trusted acquaintances. Section 2.3 describes measures for friends and acquaintances, but our copy does not identify political discussants as a measured group, so that specific comparison is not established by this source. (LLM, conf=0.84)
- Partly supportedcites [71] D. C. Mutz, P. S. Martin, Facilitating communication across lines of political difference: The role of mass media. Am. Polit. Sci. Rev. 95, 97– 114 (2001). sourceExperimental — accuracy not yet measured
The section “Sources of Exposure to Cross-Cutting Political Views” finds that newspapers and television news expose people to more differing political views than interpersonal discussants, including workplace contacts. It does not establish the claim about online news audiences or use internet traffic data; “Implications of Availability and Selectivity” instead notes that people may select political websites that share their views. Page numbers are unavailable in our copy. (LLM, conf=0.88)
- Not checked — no full text of the sourcecites [72] D. C. Mutz, J. J. Mondak, The workplace as a context for cross-cutting political discourse. J. Polit. 68, 140– 155 (2006). source
hedged- Asserted: passes — The authors put it forward as true.
- Checkable: passes — It can be checked against evidence.
- Load-bearing: unclear — It is unclear whether the paper’s conclusions depend on it.
- Based: passes — The paper gives a reason why it holds.
- Partly supported
The cited sources support only part of this claim — read each source’s verdict below.
In the paper
“Bail et al. (75) similarly found in a field experiment on Twitter that individuals who were exposed to opposing views became more polarized, not less (see also ref. 25).”
§ How digital media drive affective polarization through partisan sorting > Media and Polarization
What the sources say
- Partly supportedcites [75] C. A. Bail, Exposure to opposing views on social media can increase political polarization. Proc. Natl. Acad. Sci. U.S.A. 115, 9216– 9221 (2018). 30154168 PMC6140520 sourceExperimental — accuracy not yet measured
The Abstract reports that Republicans expressed substantially more conservative views after following a liberal Twitter bot. Democrats became only slightly more liberal after following a conservative bot, and that effect was not statistically significant. The citing sentence overgeneralizes the increase in polarization to exposed individuals as a whole; the Discussion and Conclusion also cautions against generalizing beyond the study population. (LLM, conf=0.88)
plaindirect- Asserted: passes — The authors put it forward as true.
- Checkable: passes — It can be checked against evidence.
- Load-bearing: passes — The paper’s conclusions depend on it.
- Based: passes — The paper gives a reason why it holds.
- Partly supported
The sources with a verdict support this claim; the rest weren’t checked yet, have no full text we could read, or their verdicts aren’t rated yet.
In the paper
“The parameter γ thus represents a simple way of capturing the empirically observed effect of digital media: digital media means that individuals are brought into interaction with others outside their local network.”
§ How digital media drive affective polarization through partisan sorting > Model Description
What the sources say
- Not checked — no full text of the sourcecites [25] C. A. Bail, Breaking the Social Media Prism: How to Make Our Platforms Less Polarizing (Princeton University Press, 2021). source
- Not matchedcites [26] A. Guess, B. Nyhan, B. Lyons, J. Reifler, Avoiding the echo chamber about echo chambers. Knight Foundation 2, 1– 25 (2018).
Couldn’t be matched to a paper in Crossref, so it can’t be checked.
- Supportedcites [27] P. Törnberg, J. Uitermark, Tweeting ourselves to death: The cultural logic of digital capitalism. Media Cult. Soc. 44, 1– 20 (2022). source
The Introduction (page unavailable) contrasts local audiences with the Internet’s ability to reach audiences anywhere in the world. “Political discourse as self-presentation” (page unavailable) describes social media users participating in communities and interacting in groups formed around shared traits. Together, these passages support the paraphrase that digital media enables interaction beyond a local network. (LLM, conf=0.84)
plaindirect- Asserted: passes — The authors put it forward as true.
- Checkable: passes — It can be checked against evidence.
- Load-bearing: passes — The paper’s conclusions depend on it.
- Based: passes — The paper gives a reason why it holds.
The sources with a verdict support this claim; the rest weren’t checked yet, have no full text we could read, or their verdicts aren’t rated yet.
In the paper
“Correspondingly, when cleavages and conflicts come to align—what we will refer to as sorting—the effects are synergetic in terms of intensifying prejudice and conflict between opposing political groups (18, 44).”
§ How digital media drive affective polarization through partisan sorting > Affective Polarization and the Alignment of Difference
What the sources say
- Supportedcites [18] L. Mason, A cross-cutting calm: How social sorting drives affective polarization. Public Opin. Q. 80, 351– 377 (2016). source
The “Multiple Identities” section says that when cross-cutting cleavages align, partisan conflict is expected to increase substantially. It also links aligned identities to greater intolerance of outgroups and more volatile emotional reactions, supporting the claim’s characterization of intensified prejudice and conflict. (LLM, conf=0.90)
- Not checked — no full text of the sourcecites [44] S. Roccas, M. B. Brewer, Social identity complexity. Pers. Soc. Psychol. Rev. 6, 88– 106 (2002). source
plaindirect- Asserted: passes — The authors put it forward as true.
- Checkable: passes — It can be checked against evidence.
- Load-bearing: passes — The paper’s conclusions depend on it.
- Based: passes — The paper gives a reason why it holds.
- Supported
The sources with a verdict support this claim; the rest weren’t checked yet, have no full text we could read, or their verdicts aren’t rated yet.
In the paper
“Many scholars link these negative feelings to shifts in identity, with partisanship emerging as an important social identity under which many societal divisions and conflicts are coming to align (15–18).”
§ How digital media drive affective polarization through partisan sorting > Affective Polarization and the Alignment of Difference
What the sources say
- Not checked — no full text of the sourcecites [15] S. Iyengar, G. Sood, Y. Lelkes, Affect, not ideology: A social identity perspective on polarization. Public Opin. Q. 76, 405– 431 (2012). source
- Not checked — no full text of the sourcecites [16] S. Iyengar, S. J. Westwood, Fear and loathing across party lines: New evidence on group polarization. Am. J. Pol. Sci. 59, 690– 707 (2015). source
- Not checked — no full text of the sourcecites [17] L. Mason, “I disrespectfully agree”: The differential effects of partisan sorting on social and issue polarization. Am. J. Pol. Sci. 59, 128– 145 (2015). source
- Supportedcites [18] L. Mason, A cross-cutting calm: How social sorting drives affective polarization. Public Opin. Q. 80, 351– 377 (2016). source
The Abstract describes American partisan identities as increasingly linked with religious, racial, and other political identities. The Multiple Identities section says that when social divisions align along a single dimension, partisan conflict is expected to increase. Page numbers were not provided in our copy. (LLM, conf=0.93)
plaincorrelational- Asserted: passes — The authors put it forward as true.
- Checkable: passes — It can be checked against evidence.
- Load-bearing: passes — The paper’s conclusions depend on it.
- Based: passes — The paper gives a reason why it holds.
Every source the paper cites for this claim was checked and supports it.
In the paper
“The suggestion is, in short, that polarization on digital media is driven by conflict rather than isolation (117), affording a form of politics rooted in identity rather than opinion (4).”
§ How digital media drive affective polarization through partisan sorting > Conclusions
What the sources say
- Supportedcites [4] P. Törnberg, C. Andersson, K. Lindgren, S. Banisch, Modeling the emergence of affective polarization in the social media society. PLoS One 16, e0258259 (2021). 34634056 PMC8504759 source
The Conclusion says that digital media’s effects on polarization can turn opinions and arguments into symbols of identity. It explicitly contrasts this account with one in which polarization takes place within the space of opinions. (LLM, conf=0.93)
hedgeddirect- Asserted: passes — The authors put it forward as true.
- Checkable: passes — It can be checked against evidence.
- Load-bearing: passes — The paper’s conclusions depend on it.
- Based: passes — The paper gives a reason why it holds.
- Supported
A result the paper reports from its own data — it cites no other source for it, so there is none to check. The quote shows it is in the paper.
In the paper
“When γ is high, ψ quickly reaches a high level; when γ is 0.5, ψ rises more slowly and settles on a lower value; and with γ = 0, ψ remains fixed at a low level.”
§ How digital media drive affective polarization through partisan sorting > Results
plain- Asserted: passes — The authors put it forward as true.
- Checkable: passes — It can be checked against evidence.
- Load-bearing: passes — The paper’s conclusions depend on it.
- Based: passes — The paper gives a reason why it holds.
- The authors state this as an assumption: Partisan affiliation is fixed throughout the model run, assuming it changes on a slower timescale than other attributes.
- The authors state this as an assumption: Social similarity is relative to the larger social context.
- The authors state this as an assumption: Nonlocal interlocutors are chosen without bias toward self-similarity.
A result the paper reports from its own data — it cites no other source for it, so there is none to check. The quote shows it is in the paper.
In the paper
“At high levels of influence homophily (h = 8; Fig. 2C), the result is a rapid increase in sorting at a certain threshold of nonlocal interaction.”
§ How digital media drive affective polarization through partisan sorting > Results
plaindirect- Asserted: passes — The authors put it forward as true.
- Checkable: passes — It can be checked against evidence.
- Load-bearing: passes — The paper’s conclusions depend on it.
- Based: passes — The paper gives a reason why it holds.
- The authors state this as an assumption: Partisan affiliation is fixed throughout the model run, assuming it changes on a slower timescale than other attributes.
- The authors state this as an assumption: Social similarity is relative to the larger social context.
- The authors state this as an assumption: Nonlocal interlocutors are chosen without bias toward self-similarity.
A result the paper reports from its own data — it cites no other source for it, so there is none to check. The quote shows it is in the paper.
In the paper
“Fig. 1 shows that the evolution of ψ indeed depends on γ.”
§ How digital media drive affective polarization through partisan sorting > Results
boostedcorrelational- Asserted: passes — The authors put it forward as true.
- Checkable: passes — It can be checked against evidence.
- Load-bearing: passes — The paper’s conclusions depend on it.
- Based: passes — The paper gives a reason why it holds.
- The authors state this as an assumption: Partisan affiliation is fixed throughout the model run, assuming it changes on a slower timescale than other attributes.
- The authors state this as an assumption: Social similarity is relative to the larger social context.
- The authors state this as an assumption: Nonlocal interlocutors are chosen without bias toward self-similarity.
A result the paper reports from its own data — it cites no other source for it, so there is none to check. The quote shows it is in the paper.
In the paper
“When γ is high, ψ quickly reaches a high level; when γ is 0.5, ψ rises more slowly and settles on a lower value; and with γ = 0, ψ remains fixed at a low level.”
§ How digital media drive affective polarization through partisan sorting > Results
plaindirect- Asserted: passes — The authors put it forward as true.
- Checkable: passes — It can be checked against evidence.
- Load-bearing: passes — The paper’s conclusions depend on it.
- Based: passes — The paper gives a reason why it holds.
- The authors state this as an assumption: Partisan affiliation is fixed throughout the model run, assuming it changes on a slower timescale than other attributes.
- The authors state this as an assumption: Social similarity is relative to the larger social context.
- The authors state this as an assumption: Nonlocal interlocutors are chosen without bias toward self-similarity.
- It may state two separate claims as one. 24
- Probably not a substantial claim. 7
The cited sources support only part of this claim — read each source’s verdict below.
In the paper
“This literature suggests that digital media do not isolate us from opposing ideas; au contraire, they bring us to interact with individuals outside our local bubble, and they throw us into a political war, in which we are forced to take sides (25–27).”
§ How digital media drive affective polarization through partisan sorting > Abstract
What the sources say
- Not checked — no full text of the sourcecites [25] C. A. Bail, Breaking the Social Media Prism: How to Make Our Platforms Less Polarizing (Princeton University Press, 2021). source
- Not matchedcites [26] A. Guess, B. Nyhan, B. Lyons, J. Reifler, Avoiding the echo chamber about echo chambers. Knight Foundation 2, 1– 25 (2018).
Couldn’t be matched to a paper in Crossref, so it can’t be checked.
- Partly supportedcites [27] P. Törnberg, J. Uitermark, Tweeting ourselves to death: The cultural logic of digital capitalism. Media Cult. Soc. 44, 1– 20 (2022). sourceExperimental — accuracy not yet measured
In “Political discourse as self-presentation” (page unavailable), the paper says messages from opposing groups are common on social media and can fuel outrage and strengthen group identity; it also describes a broader political culture war. But it says social media cluster users into echo chambers or filter bubbles, and it does not establish that users interact with people outside those groups or are forced to take sides. (LLM, conf=0.84)
hedgeddirect- Asserted: passes — The authors put it forward as true.
- Checkable: passes — It can be checked against evidence.
- Load-bearing: passes — The paper’s conclusions depend on it.
- Based: passes — The paper gives a reason why it holds.
It may state two separate claims as one.
The sources with a verdict support this claim; the rest weren’t checked yet, have no full text we could read, or their verdicts aren’t rated yet.
In the paper
“While the political divide has remained relatively stable in the United States in terms of issue positions (33), many other indicators point to a significant increase in partisan polarization and animosity in the mass public (18, 34): Democrats and Republicans are growing increasingly cold to each other, coming to dislike or even disdain their partisan opponents (15).”
§ How digital media drive affective polarization through partisan sorting > Affective Polarization and the Alignment of Difference
What the sources say
- Not matchedcites [33] M. P. Fiorina, Unstable Majorities: Polarization, Party Sorting, and Political Stalemate (Hoover Press, 2017).
Couldn’t be matched to a paper in Crossref, so it can’t be checked.
- Supportedcites [18] L. Mason, A cross-cutting calm: How social sorting drives affective polarization. Public Opin. Q. 80, 351– 377 (2016). source
The stable-issue-positions clause is attributed to citation 33, not this paper. For the clause citing this paper, the Data and Methods—American National Election Studies section reports rising anger toward opposing presidential candidates from 1980 to 2012, alongside growing partisan social sorting; the Abstract describes an increasingly affectively polarized electorate. Page numbers are not provided in our copy. (LLM, conf=0.91)
- Not matchedcites [34] Pew Research Center, Partisanship and Political Animosity in 2016: Highly Negative Views of the Opposing Party and Its Members (2016). https://www.pewresearch.org/politics/2016/06/22/partisanship-and-political-animosity-in-2016/. Accessed 17 September 2022.
Couldn’t be matched to a paper in Crossref, so it can’t be checked.
- Not checked — no full text of the sourcecites [15] S. Iyengar, G. Sood, Y. Lelkes, Affect, not ideology: A social identity perspective on polarization. Public Opin. Q. 76, 405– 431 (2012). source
plain- Asserted: passes — The authors put it forward as true.
- Checkable: passes — It can be checked against evidence.
- Load-bearing: passes — The paper’s conclusions depend on it.
- Based: passes — The paper gives a reason why it holds.
It may state two separate claims as one.
- Not matched
The cited sources support only part of this claim — read each source’s verdict below.
In the paper
“Research on social media data tells a similar story: while partisan social media users do tend to interact across the ideological divide (62), this interaction is not characterized by rational arguments and deliberation but tends to be contentious and conflictual, suggesting that users may not be engaging in good faith attempts at seeing things through other perspectives (98–100).”
§ How digital media drive affective polarization through partisan sorting > Media and Polarization
What the sources say
- Not checked — no full text of the sourcecites [62] P. Barberá, J. T. Jost, J. Nagler, J. A. Tucker, R. Bonneau, Tweeting from left to right: Is online political communication more than an echo chamber? Psychol. Sci. 26, 1531– 1542 (2015). 26297377 source
- Partly supportedcites [98] G. Evolvi, Hate in a tweet: Exploring internet-based islamophobic discourses. Religions (Basel) 9, 307 (2018). sourceExperimental — accuracy not yet measured
Section 3 (Brexit and Twitter Islamophobia; page unavailable) says Islamophobic Twitter groups rarely converse with Muslims and instead establish an antagonistic relationship with them. Section 5.2 describes derogatory tweets intended to upset other users. This supports the contentious-interaction portion of the citing sentence, but the paper’s post-Brexit Islamophobia findings do not establish that characterization for partisan social media users generally. The separate claim that users interact across the ideological divide is cited to another source (62). (LLM, conf=0.85)
- Partly supportedcites [99] R. Moernaut, J. Mast, M. Temmerman, M. Broersma, Hot weather, hot topic. Polarization and sceptical framing in the climate debate on Twitter. Inform. Commun. Soc. 25, 1047– 1066 (2022). sourceExperimental — accuracy not yet measured
The Conclusion reports that when interactions occurred between climate sceptics and believers on Twitter, they tended to be antagonistic and aimed at delegitimizing the other group rather than fostering constructive debate. This supports the contentious-interaction portion attributed to this source, but the study does not establish that pattern for partisan social media users generally. The separate claim that users interact across the ideological divide is cited to another source (62). (LLM, conf=0.85)
- Not checked — no full text of the sourcecites [100] A. Gruzd, J. Roy, Investigating political polarization on Twitter: A Canadian perspective. Policy Internet 6, 28– 45 (2014). source
hedgedcorrelational- Asserted: passes — The authors put it forward as true.
- Checkable: passes — It can be checked against evidence.
- Load-bearing: passes — The paper’s conclusions depend on it.
- Based: passes — The paper gives a reason why it holds.
It may state two separate claims as one.
The cited sources support only part of this claim — read each source’s verdict below.
In the paper
“This evidence has been taken to suggest that in contrast to the assumptions of the selective exposure hypothesis, social media is in fact characterized by intense interaction across the political divide (73).”
§ How digital media drive affective polarization through partisan sorting > Media and Polarization
What the sources say
- Partly supportedcites [73] A. Keuchenius, P. Törnberg, J. Uitermark, Why it is important to consider negative ties when studying polarized debates: A signed network analysis of a Dutch cultural controversy on Twitter. PLoS One 16, e0256696 (2021). 34464396 PMC8407581 sourceExperimental — accuracy not yet measured
The Results (Coalitions and divisions in the debate; page unavailable) document antagonistic interaction between opposing groups in the Dutch Black Pete debate on Twitter. But the Conclusion and discussion says the study concerns one debate, time period, country, and platform, and leaves broader generalization to future research. It does not establish that social media generally is characterized by intense interaction across political divides. (LLM, conf=0.84)
hedgedcorrelational- Asserted: passes — The authors put it forward as true.
- Checkable: passes — It can be checked against evidence.
- Load-bearing: fails — The paper’s conclusions may not depend on it.
- Based: passes — The paper gives a reason why it holds.
Probably not a substantial claim. The paper’s conclusions may not depend on it.
- Partly supported
The cited sources support only part of this claim — read each source’s verdict below.
In the paper
“Studies on social media have found limited evidence for the described homogeneous clusters on most social media platforms: while users may be unlikely to rebroadcast content from the opposing side, they are often exposed to it and may even respond (11, 62–69).”
§ How digital media drive affective polarization through partisan sorting > Media and Polarization
What the sources say
- Partly supportedcites [11] R. Karlsen, K. Steen-Johnsen, D. Wollebaek, B. Enjolras, Echo chamber and trench warfare dynamics in online debates. Eur. J. Commun. 32, 257– 273 (2017). 28690351 PMC5482382 sourceExperimental — accuracy not yet measured
The Trench warfare dynamics section says there is little evidence that people avoid political diversity online, and the Conclusion reports that people frequently encounter opposing arguments and can interact with those holding opposite views. The paper does not establish this pattern across most social media platforms or address whether users rebroadcast opposing content; its Conclusion cautions that the dynamics may differ by platform. (LLM, conf=0.84)
- Not checked — no full text of the sourcecites [62] P. Barberá, J. T. Jost, J. Nagler, J. A. Tucker, R. Bonneau, Tweeting from left to right: Is online political communication more than an echo chamber? Psychol. Sci. 26, 1531– 1542 (2015). 26297377 source
- Not checked — no full text of the sourcecites [63] S. Goel, W. Mason, D. J. Watts, Real and perceived attitude agreement in social networks. J. Pers. Soc. Psychol. 99, 611– 621 (2010). 20731500 source
- Not checked — no full text of the sourcecites [64] E. Bakshy, S. Messing, L. A. Adamic, Exposure to ideologically diverse news and opinion on Facebook. Science 348, 1130– 1132 (2015). 25953820 source
- Not checked — no full text of the sourcecites [65] E. Colleoni, A. Rozza, A. Arvidsson, Echo chamber or public sphere? Predicting political orientation and measuring political homophily in Twitter using big data. J. Commun. 64, 317– 332 (2014). source
- Partly supportedcites [66] E. Lawrence, J. Sides, H. Farrell, Self-segregation or deliberation? Blog readership, participation, and polarization in American politics. Perspect. Polit. 8, 141– 157 (2010). sourceExperimental — accuracy not yet measured
The Blog Authors section says cross-ideological links are infrequent, but some involve substantive argument and conversation, supporting the possibility of responses to opposing views. The Homophily and Polarization in the Blogosphere section instead finds that 94% of political blog readers read only blogs from one ideological side. The paper studies political blogs, not most social media platforms, and does not establish that users are often exposed to opposing content. (LLM, conf=0.86)
- Partly supportedcites [67] C. Vaccari, Of echo chambers and contrarian clubs: Exposure to political disagreement among German and Italian users of Twitter. Soc. Media Soc. 2, 1– 24 (2016). sourceExperimental — accuracy not yet measured
The Introduction and Conclusion report that German and Italian Twitter users encountered opposing views, even though homogeneity was the modal outcome. The paper does not establish that homogeneous clusters have limited evidence across most social media platforms, nor do the cited passages assess whether users rebroadcast or respond to opposing content. Our copy provides no page numbers for these passages. (LLM, conf=0.86)
- Not checked — no full text of the sourcecites [68] S. Yardi, D. Boyd, Dynamic debates: An analysis of group polarization over time on twitter. Bull. Sci. Technol. Soc. 30, 316– 327 (2010). source
- Partly supportedcites [69] G. De Francisci Morales, C. Monti, M. Starnini, No echo in the chambers of political interactions on Reddit. Sci. Rep. 11, 2818 (2021). 33531520 PMC7854755 sourceExperimental — accuracy not yet measured
The Introduction and Discussion (pages unavailable) report that, in Reddit discussions of the 2016 US election, opposing political groups interacted more often than expected and Clinton supporters were particularly likely to answer Trump supporters. That supports the possibility of exposure and response, but the paper does not establish limited homogeneous clustering on most social media platforms; its Discussion describes echo chambers on other platforms. It also does not establish a general pattern of users declining to rebroadcast opposing content. (LLM, conf=0.88)
hedged- Asserted: passes — The authors put it forward as true.
- Checkable: passes — It can be checked against evidence.
- Load-bearing: passes — The paper’s conclusions depend on it.
- Based: passes — The paper gives a reason why it holds.
It may state two separate claims as one.
- Partly supported
The cited sources support only part of this claim — read each source’s verdict below.
In the paper
“In other words, partisans consume media from across the partisan divide but do not trust in what opposing media channels tell them.”
§ How digital media drive affective polarization through partisan sorting > Media and Polarization
What the sources say
- Partly supportedcites [96] A. M. Guess, P. Barberá, S. Munzert, J. Yang, The consequences of online partisan media. Proc. Natl. Acad. Sci. U.S.A. 118, e2013464118 (2021). 33782116 PMC8040813 sourceExperimental — accuracy not yet measured
The Discussion (page not available) says exposure to cross-cutting information is relatively common. It also reports reduced overall trust in mainstream media and suggests people may discount challenging content. It does not establish that partisans specifically distrust what opposing media channels tell them; that conclusion is more definite and more source-specific than the paper's finding. (LLM, conf=0.86)
- Not matchedcites [97] M. Jurkowitz, A. Mitchell, E. Shearer, M. Walker, US media polarization and the 2020 election: A nation divided (Pew Research Center, 2020). https://www.pewresearch.org/journalism/2020/01/24/u-s-media-polarization-and-the-2020-election-a-nation-divided/. Accessed 17 September 2022.
Couldn’t be matched to a paper in Crossref, so it can’t be checked.
plain- Asserted: passes — The authors put it forward as true.
- Checkable: passes — It can be checked against evidence.
- Load-bearing: passes — The paper’s conclusions depend on it.
- Based: passes — The paper gives a reason why it holds.
It may state two separate claims as one.
- Partly supported
The cited sources support only part of this claim — read each source’s verdict below.
In the paper
“This has brought researchers to conclude that negative influence effect is elusive, with limited relevance for politics outside the laboratory (88, 90, 93–95): while we may be less influenced by our political opponents, we are unlikely to be negatively influenced by them.”
§ How digital media drive affective polarization through partisan sorting > Media and Polarization
What the sources say
- Not checked — no full text of the sourcecites [88] D. M. Kahan, “The politically motivated reasoning paradigm, part 1: What politically motivated reasoning is and how to measure it” in Emerging Trends in the Social and Behavioral Sciences: An Interdisciplinary, Searchable, and Linkable Resource, R. A. Scott, S. M. Kosslyn, Eds. (John Wiley & Sons, Hoboken, NJ, 2015), pp. 1– 16. source
- Not checked — no full text of the sourcecites [90] T. Wood, E. Porter, The elusive backfire effect: Mass attitudes’ steadfast factual adherence. Polit. Behav. 41, 135– 163 (2019). source
- Not checked — no full text of the sourcecites [93] R. S. Nickerson, Confirmation bias: A ubiquitous phenomenon in many guises. Rev. Gen. Psychol. 2, 175 (1998). source
- Could not verifycites [94] D. M. Kahan, Ideology, motivated reasoning, and cognitive reflection: An experimental study. Judgm. Decis. Mak. 8, 407– 424 (2012). sourceExperimental — accuracy not yet measured
Section 5.1 reports ideologically motivated reasoning in an experiment, and Section 3.3 discusses how biased assessment of evidence might polarize beliefs. Neither passage addresses whether messages from political opponents cause a negative influence or backfire effect, or whether such an effect is rare outside the laboratory. Searches for those terms and for opposing-message effects found no passage settling the claim. (LLM, conf=0.72)
- Partly supportedcites [95] K. Takács, A. Flache, M. Mäs, Discrepancy and disliking do not induce negative opinion shifts. PLoS One 11, 1– 21 (2016). PMC4917087 27333160 sourceExperimental — accuracy not yet measured
The Summary and Conclusion reports no support for negative opinion shifts in the authors’ controlled experiments. It does not establish that the effect has limited relevance to politics outside the laboratory: the authors explicitly say they cannot exclude negative influence in field settings, and they did not study political opponents as such. (LLM, conf=0.86)
hedged- Asserted: passes — The authors put it forward as true.
- Checkable: passes — It can be checked against evidence.
- Load-bearing: unclear — It is unclear whether the paper’s conclusions depend on it.
- Based: passes — The paper gives a reason why it holds.
It may state two separate claims as one.
Every source the paper cites for this claim was checked and supports it.
In the paper
“The model thus suggests rethinking digital media as not merely arenas for rational deliberation and political debate but as spaces for social identity formation and for symbolic displays of solidarity with allies and difference from outgroups (27).”
§ How digital media drive affective polarization through partisan sorting > Conclusions
What the sources say
- Supportedcites [27] P. Törnberg, J. Uitermark, Tweeting ourselves to death: The cultural logic of digital capitalism. Media Cult. Soc. 44, 1– 20 (2022). source
In “Political discourse as self-presentation,” the paper says social media strengthen group identities and that messages from opposing groups affirm common identities and intensify outgroup dislike. The same section describes political expression as symbolic self-presentation grounded in identity and group belonging. The Conclusion likewise says public discourse is drawn into a logic of identity and difference. (LLM, conf=0.91)
hedged- Asserted: passes — The authors put it forward as true.
- Checkable: passes — It can be checked against evidence.
- Load-bearing: passes — The paper’s conclusions depend on it.
- Based: passes — The paper gives a reason why it holds.
It may state two separate claims as one.
- Supported
A result the paper reports from its own data — it cites no other source for it, so there is none to check. The quote shows it is in the paper.
In the paper
“When γ is high, ψ quickly reaches a high level; when γ is 0.5, ψ rises more slowly and settles on a lower value; and with γ = 0, ψ remains fixed at a low level.”
§ How digital media drive affective polarization through partisan sorting > Results
plaindirect- Asserted: passes — The authors put it forward as true.
- Checkable: passes — It can be checked against evidence.
- Load-bearing: passes — The paper’s conclusions depend on it.
- Based: passes — The paper gives a reason why it holds.
It may state two separate claims as one.
- The authors state this as an assumption: Partisan affiliation is fixed throughout the model run, assuming it changes on a slower timescale than other attributes.
- The authors state this as an assumption: Social similarity is relative to the larger social context.
- The authors state this as an assumption: Nonlocal interlocutors are chosen without bias toward self-similarity.
The paper states this without a source or data behind it here, so there is nothing to check it against. The quote shows it is in the paper.
In the paper
“The result is the crystallization of conflicting identities and the intensification of polarization, driven by a process in which sorting begets sorting and polarization begets polarization.”
§ How digital media drive affective polarization through partisan sorting > Conclusions
plaindirect- Asserted: passes — The authors put it forward as true.
- Checkable: passes — It can be checked against evidence.
- Load-bearing: passes — The paper’s conclusions depend on it.
- Based: passes — The paper gives a reason why it holds.
It may state two separate claims as one.
A conclusion the paper draws from its own results — it cites no other source for it, so there is none to check. The quote shows it is in the paper.
In the paper
“This paper provides a causal mechanism to explain this rise in polarization, by identifying how digital media may drive a sorting of differences, which has been linked to a breakdown of social cohesion and rising affective polarization.”
§ How digital media drive affective polarization through partisan sorting > Abstract
hedgedconditional- Asserted: passes — The authors put it forward as true.
- Checkable: passes — It can be checked against evidence.
- Load-bearing: passes — The paper’s conclusions depend on it.
- Based: passes — The paper gives a reason why it holds.
It may state two separate claims as one.
- The authors state this as an assumption: Partisan affiliation is fixed throughout the model run, assuming it changes on a slower timescale than other attributes.
- The authors state this as an assumption: Social similarity is relative to the larger social context.
- The authors state this as an assumption: Nonlocal interlocutors are chosen without bias toward self-similarity.
A conclusion the paper draws from its own results — it cites no other source for it, so there is none to check. The quote shows it is in the paper.
In the paper
“The suggested mechanism essentially turns the echo chamber on its head: it is not that isolation drives divergence of opinions but that the diverse and nonlocal interactions of digital media drive plural conflicts to align along partisan lines.”
§ How digital media drive affective polarization through partisan sorting > Abstract
plaindirect- Asserted: passes — The authors put it forward as true.
- Checkable: passes — It can be checked against evidence.
- Load-bearing: passes — The paper’s conclusions depend on it.
- Based: passes — The paper gives a reason why it holds.
It may state two separate claims as one.
- The authors state this as an assumption: Partisan affiliation is fixed throughout the model run, assuming it changes on a slower timescale than other attributes.
- The authors state this as an assumption: Social similarity is relative to the larger social context.
- The authors state this as an assumption: Nonlocal interlocutors are chosen without bias toward self-similarity.
The paper states this without a source or data behind it here, so there is nothing to check it against. The quote shows it is in the paper.
In the paper
“At the same time, such exposure does not seem to lead to political moderation: individuals are readily influenced by those they view as already similar to themselves, while disregarding messages from those they view as the outgroup.”
§ How digital media drive affective polarization through partisan sorting > Media and Polarization
hedged- Asserted: passes — The authors put it forward as true.
- Checkable: passes — It can be checked against evidence.
- Load-bearing: passes — The paper’s conclusions depend on it.
- Based: unclear — It is unclear why the paper says it holds.
It may state two separate claims as one.
A conclusion the paper draws from its own results — it cites no other source for it, so there is none to check. The quote shows it is in the paper.
In the paper
“The model thus suggests that digital media can intensify affective polarization by contributing to a runaway process in which more and more issues become drawn into a single growing social and cultural divide, in turn driving a breakdown of social cohesion.”
§ How digital media drive affective polarization through partisan sorting > Abstract
hedgedconditional- Asserted: passes — The authors put it forward as true.
- Checkable: passes — It can be checked against evidence.
- Load-bearing: passes — The paper’s conclusions depend on it.
- Based: passes — The paper gives a reason why it holds.
It may state two separate claims as one.
- The authors state this as an assumption: Partisan affiliation is fixed throughout the model run, assuming it changes on a slower timescale than other attributes.
- The authors state this as an assumption: Social similarity is relative to the larger social context.
- The authors state this as an assumption: Nonlocal interlocutors are chosen without bias toward self-similarity.
A conclusion the paper draws from its own results — it cites no other source for it, so there is none to check. The quote shows it is in the paper.
In the paper
“The suggestion of this paper is that these two points of empirical evidence may not only be reason to reject the echo chamber hypothesis (26), but they also provide the foundation for an alternative hypothesis for media polarization.”
§ How digital media drive affective polarization through partisan sorting > Media and Polarization
hedgeddirect- Asserted: passes — The authors put it forward as true.
- Checkable: passes — It can be checked against evidence.
- Load-bearing: passes — The paper’s conclusions depend on it.
- Based: passes — The paper gives a reason why it holds.
Probably not a substantial claim. It may state two separate claims as one.
In the paper
“Following the idea that we are more influenced by those similar to us, the node is then influenced as a function of the similarity with its interlocutors.”
§ How digital media drive affective polarization through partisan sorting > Model Description
What the sources say
- Not checked — no full text of the sourcecites [104] R. Axelrod, The dissemination of culture: A model with local convergence and global polarization. J. Conflict Resolut. 41, 203– 226 (1997). source
plaindirect- Asserted: passes — The authors put it forward as true.
- Checkable: passes — It can be checked against evidence.
- Load-bearing: passes — The paper’s conclusions depend on it.
- Based: passes — The paper gives a reason why it holds.
Probably not a substantial claim.
None of the sources cited for this claim have been checked yet.
In the paper
“In summary, the empirical literature suggests that digitalization does not appear to lead to a reduction of interaction across political divide, but quite the opposite: it confronts us with diverse individuals, perspectives, and viewpoints, often in contentious ways.”
§ How digital media drive affective polarization through partisan sorting > Media and Polarization
hedged- Asserted: passes — The authors put it forward as true.
- Checkable: passes — It can be checked against evidence.
- Load-bearing: passes — The paper’s conclusions depend on it.
- Based: passes — The paper gives a reason why it holds.
It may state two separate claims as one.
In the paper
“The degree to which political divisions have come to dominate cultural life, however, remains subject to academic debate, with a recent study finding that while some lifestyle preferences are politically polarized, most remain shared across the political divide (54).”
§ How digital media drive affective polarization through partisan sorting > Affective Polarization and the Alignment of Difference
What the sources say
- Not checked — no full text of the sourcecites [54] S. Praet, A. M. Guess, J. A. Tucker, R. Bonneau, J. Nagler, What’s not to like? Facebook page likes reveal limited polarization in lifestyle preferences. Polit. Commun. 39, 311– 338 (2022). source
hedged- Asserted: passes — The authors put it forward as true.
- Checkable: passes — It can be checked against evidence.
- Load-bearing: fails — The paper’s conclusions may not depend on it.
- Based: passes — The paper gives a reason why it holds.
Probably not a substantial claim. The paper’s conclusions may not depend on it. It may state two separate claims as one.
In the paper
“According to these scholars, sorting is thus central to understanding the rise in polarization and the growing sense of difference, distrust, and disdain between opposing partisans, suggesting that the causal link between digital media and polarization runs not through divergence of opinions but rather via the dynamics of partisan sorting (19).”
§ How digital media drive affective polarization through partisan sorting > Abstract
What the sources say
- Not checked — no full text of the sourcecites [19] M. Levendusky, The Partisan Sort: How Liberals Became Democrats and Conservatives Became Republicans (University of Chicago Press, 2009). source
hedgeddirect- Asserted: passes — The authors put it forward as true.
- Checkable: passes — It can be checked against evidence.
- Load-bearing: passes — The paper’s conclusions depend on it.
- Based: passes — The paper gives a reason why it holds.
Probably not a substantial claim.
In the paper
“The suggestion of this paper has been that these two points of empirical evidence may not only be reason to reject the echo chamber hypothesis (26), but that they also provide the foundation for an alternative emergent causal mechanism underlying the polarizing effects of digital media.”
§ How digital media drive affective polarization through partisan sorting > Conclusions
What the sources say
- Not matchedcites [26] A. Guess, B. Nyhan, B. Lyons, J. Reifler, Avoiding the echo chamber about echo chambers. Knight Foundation 2, 1– 25 (2018).
Couldn’t be matched to a paper in Crossref, so it can’t be checked.
hedgedconditional- Asserted: passes — The authors put it forward as true.
- Checkable: unclear — It is unclear whether it could be checked against evidence.
- Load-bearing: passes — The paper’s conclusions depend on it.
- Based: passes — The paper gives a reason why it holds.
It may state two separate claims as one.
- Not matched
What the paper did — it cites no source for this, so there is none to check. The quote shows it is in the paper.
In the paper
“Unless otherwise specified, the simulations here therefore use an empirically chosen metric for when convergence has occurred, verified on a large number of cases and with substantial margin: the simulation ends either when no update has occurred during 10 runs across the full number of agents or to prevent runs becoming infinitely stuck in a dynamic equilibrium, after 1,000,000 iterations.”
§ How digital media drive affective polarization through partisan sorting > Model Description
plain- Asserted: passes — The authors put it forward as true.
- Checkable: passes — It can be checked against evidence.
- Load-bearing: fails — The paper’s conclusions may not depend on it.
- Based: passes — The paper gives a reason why it holds.
Probably not a substantial claim. The paper’s conclusions may not depend on it. It may state two separate claims as one.
A conclusion the paper draws from its own results — it cites no other source for it, so there is none to check. The quote shows it is in the paper.
In the paper
“Digital media intensify polarization not as echo chambers but as a sorting machine, fueling a runaway social process that destabilizes plural societies by drawing more and more issues into a single expanding social and cultural divide.”
§ How digital media drive affective polarization through partisan sorting > Conclusions
plaindirect- Asserted: passes — The authors put it forward as true.
- Checkable: passes — It can be checked against evidence.
- Load-bearing: passes — The paper’s conclusions depend on it.
- Based: passes — The paper gives a reason why it holds.
It may state two separate claims as one.
A conclusion the paper draws from its own results — it cites no other source for it, so there is none to check. The quote shows it is in the paper.
In the paper
“in turn reducing their mutual social influence which further intensifies the process of sorting.”
§ How digital media drive affective polarization through partisan sorting > Conclusions
plaindirect- Asserted: passes — The authors put it forward as true.
- Checkable: passes — It can be checked against evidence.
- Load-bearing: passes — The paper’s conclusions depend on it.
- Based: passes — The paper gives a reason why it holds.
It may state two separate claims as one.
A conclusion the paper draws from its own results — it cites no other source for it, so there is none to check. The quote shows it is in the paper.
In the paper
“This is a striking result, showing that if individuals are more influenced by those who are similar to them, interaction outside of local bubbles can result in increased partisan sorting, in turn associated to affective polarization.”
§ How digital media drive affective polarization through partisan sorting > Results
plaindirect- Asserted: passes — The authors put it forward as true.
- Checkable: passes — It can be checked against evidence.
- Load-bearing: passes — The paper’s conclusions depend on it.
- Based: passes — The paper gives a reason why it holds.
It may state two separate claims as one.
- The authors state this as an assumption: Partisan affiliation is fixed throughout the model run, assuming it changes on a slower timescale than other attributes.
- The authors state this as an assumption: Social similarity is relative to the larger social context.
- The authors state this as an assumption: Nonlocal interlocutors are chosen without bias toward self-similarity.
A conclusion the paper draws from its own results — it cites no other source for it, so there is none to check. The quote shows it is in the paper.
In the paper
“it is not lack of exposure to competing ideas that lead to polarization but precisely that digital media brings us to interact outside of our local bubble.”
§ How digital media drive affective polarization through partisan sorting > Conclusions
plaindirect- Asserted: passes — The authors put it forward as true.
- Checkable: passes — It can be checked against evidence.
- Load-bearing: passes — The paper’s conclusions depend on it.
- Based: passes — The paper gives a reason why it holds.
It may state two separate claims as one.
A conclusion the paper draws from its own results — it cites no other source for it, so there is none to check. The quote shows it is in the paper.
In the paper
“creating a maelstrom in which additional identities, beliefs, and cultural belonging become sucked into a growing and all-encompassing societal division, which threatens the very foundation of social cohesion.”
§ How digital media drive affective polarization through partisan sorting > Conclusions
plaindirect- Asserted: passes — The authors put it forward as true.
- Checkable: fails — It may be too vague to check against evidence.
- Load-bearing: passes — The paper’s conclusions depend on it.
- Based: passes — The paper gives a reason why it holds.
Probably not a substantial claim. It may be too vague to check against evidence. It may state two separate claims as one.
A conclusion the paper draws from its own results — it cites no other source for it, so there is none to check. The quote shows it is in the paper.
In the paper
“Digital media do not isolate us from opposing ideas; au contraire, they throw us into a national political war, in which we are forced to take sides.”
§ How digital media drive affective polarization through partisan sorting > Conclusions
plaindirect- Asserted: passes — The authors put it forward as true.
- Checkable: unclear — It is unclear whether it could be checked against evidence.
- Load-bearing: passes — The paper’s conclusions depend on it.
- Based: unclear — It is unclear why the paper says it holds.
It may state two separate claims as one.
The authors state this as an assumption.
Partisan affiliation is fixed throughout the model run, assuming it changes on a slower timescale than other attributes.
“Each agent i also has a single attribute, Si, corresponding to partisan affiliation, which held fixed throughout the model run (see also ref. 58).”
“We here treat partisan affiliation as fixed, assuming that it will change on a slower timescale than the other attributes.”
The authors state this as an assumption.
Social similarity is relative to the larger social context.
“The social similarity is in other words treated as relative: that is, how similar we see ourselves to a particular individual depends on the larger social context (for instance, while the differences between Trotskyists and Stalinists may appear as a large chasm for members of the Party, they may for outsiders appear as a matter of relatively trivial detail).”
The authors state this as an assumption.
Nonlocal interlocutors are chosen without bias toward self-similarity.
“While the selective exposure hypothesis would suggest that these individuals would be selected with a bias toward self-similarity, we will here let the choice be unbiased as we are seeking to examine whether sorting can appear without such empirically questioned assumptions.”
Claims other papers make about this one
Each is checked against this paper’s own text: does it say what the citing paper says it does?
The source backs part of the claim, not all of it — or backs it for a different population, condition or comparison.
In the citing paper
“Because there is such a large volume of people to connect with in the online context, there are significantly more extreme voices to affiliate with than there were in prior social groups that were limited by geography (Petersen et al. 2020, Törnberg 2022).”
From Social Media and Morality. (2024) · cites this paper as Törnberg 2022
Experimental — accuracy not yet measuredThe source backs part of the claim, not all of it — or backs it for a different population, condition or comparison.
In the citing paper
“algo que permite afirmar -de nuevo-que no solo la homogeneidad polariza, la interacción intergrupal también lo hace (Törnberg, 2022).”
From Política, uso de medios y polarización afectiva en España (2024) · cites this paper as Törnberg, 2022
Experimental — accuracy not yet measured
Self-check
Percentages, sums and reported differences re-computed from the paper’s own numbers.
Each contradiction between two passages listed here was confirmed by an independent check.
Rated minor: it would not touch a result — a value no result rests on, a p-value that stays on the same side of the significance level, or a conflict that is clerical, resolved elsewhere in the paper, or outside its own findings.
In the paper
§ How digital media drive affective polarization through partisan sorting > Results
“we carry out 8,000 simulation runs for three values of h (1, 2, 5)”
§ How digital media drive affective polarization through partisan sorting > Results
“when the level of influence homophily is (A) low (h = 1), (B) medium (h = 4), and (C) high (h = 8).”
Citations
Cites
Confirmation Bias: A Ubiquitous Phenomenon in Many Guises
Nickerson, R. S. (1998) · Review of General Psychology · doi:10.1037/1089-2680.2.2.175 · Cited by 7,267
Modernity and self-identity: self and society in the late modern age
(1992) · Choice Reviews Online · doi:10.5860/choice.29-3618 · Cited by 5,667
The Social Self: On Being the Same and Different at the Same Time
Brewer, M. B. (1991) · Personality and Social Psychology Bulletin · doi:10.1177/0146167291175001 · Cited by 5,107
Motivated Skepticism in the Evaluation of Political Beliefs
Taber, C. S., & Lodge, M. (2006) · American Journal of Political Science · doi:10.1111/j.1540-5907.2006.00214.x · Cited by 4,344
Exposure to ideologically diverse news and opinion on Facebook
Bakshy, E., Messing, S., & Adamic, L. A. (2015) · Science · doi:10.1126/science.aaa1160 · Cited by 3,245
When Corrections Fail: The Persistence of Political Misperceptions
Nyhan, B., & Reifler, J. (2010) · Political Behavior · doi:10.1007/s11109-010-9112-2 · Cited by 3,173 · cited 1×
“Some earlier studies even suggested that messages from the opposing side can be rejected so strongly as to lead individuals to shift their position in the opposite direction—what is referred to as “negative influence” or the “backfire effect” (83).”
BackgroundIyengar, S., Sood, G., & Lelkes, Y. (2012) · Public Opinion Quarterly · doi:10.1093/poq/nfs038 · Cited by 2,996
Party Systems and Voter Alignments. Cross National Perspectives
Birnbaum, P., Lipset, S. M., & Rokkan, S. (1968) · Revue Française de Sociologie · doi:10.2307/3320570 · Cited by 2,802
The Functions of Social Conflict.
Levy, M. J. J., & Coser, L. A. (1957) · American Sociological Review · doi:10.2307/2088776 · Cited by 2,611
Fear and loathing across party lines: New evidence on group polarization
Iyengar, S., & Westwood, S. J. (2015) · American Journal of Political Science · doi:10.1111/ajps.12152 · Cited by 2,452
Research works printed but not linked: 7
- C. R. Sunstein, Echo Chambers: Bush v. Gore, Impeachment, and Beyond (Princeton University Press, Princeton, NJ, 2001).
- A. Guess, B. Nyhan, B. Lyons, J. Reifler, Avoiding the echo chamber about echo chambers. Knight Foundation 2, 1–25 (2018).
- E. A. Nordlinger, Conflict Regulation in Divided Societies (Center for International Affairs, Harvard University, 1972).
- S. Levitsky, D. Ziblatt, How Democracies Die (Broadway Books, 2018).
- M. W. Macy J. A. Kitts A. Flache S. Benard "Polarization in dynamic networks: A Hopfield model of emergent structure" in Dynamic Social Network Modeling and Analysis R. Breiger K. Carley P. Pattison Eds. (National Academies Press Washington DC 2003) pp.162–173.
- R. P. Abelson “Mathematical models of the distribution of attitudes under controversy” in Contributions to Mathematical Psychology N. Fredericksen H. Gullicksen Eds. (Holt Rinehart and Winston New York NY 1964) pp.142–165.
- E. Klein, Why We’re Polarized (Simon and Schuster, 2020).
Cited by
Sorted by citations
Items 201–288 of 288
From Disagreement to Discord: How Social Media Platforms Fuel Conflict Instead of Bridging Divides
Boutsikaris, L., & Polykalas, S. E. (2025) · IT Professional · doi:10.1109/mitp.2025.3536006
“May/June 2025 it’s commonly believed that filter bubbles create a radicalizing effect by limiting exposure to dissenting views, recent studies 4 suggest a better understanding of their impact on our cognitive processes and world-view.”
How advocacy groups on Twitter and media coverage can drive US firearm acquisition: A causal study
Slote, K., Daley, K., Succar, R., Ventura, R. B., Porfiri, M., & Belykh, I. V. (2025) · PNAS Nexus · doi:10.1093/pnasnexus/pgaf195 · Cited by 1
“Studies have shown that social media platforms amplify partisan sorting, where individuals increasingly engage with extreme rather than moderate views, deepening divisions between opposing political groups (62).”
Watching the wheels: who is monitoring lobbying at Westminster?
Worthy, B., Morgan, C., & Langehennig, S. R. (2025) · Interest Groups & Advocacy · doi:10.1057/s41309-025-00241-1
Schmidt, J. (2025) · Springer eBooks · doi:10.1007/978-3-031-25143-6_52-1
Mitchell, B. D. (2025) · Springer eBooks · doi:10.1007/978-3-031-94354-6_11
Sohn, D. (2025) · Communication Research · doi:10.1177/00936502251362278
Westling, C. E. I., Bjurling, O., Bronson, J., Berggren, P., & Johansson, B. J. E. (2025) · European Conference on Cognitive Ergonomics · doi:10.1145/3746175.3746191
The world wide web was meant to unite us, but is tearing us apart instead. Is there another way?
Buchanan, G. R., & McKay, D. (2025) · doi:10.64628/aa.xjyyy6wye
Burst: Collaborative Curation in Connected Social Media Communities
Zhang, Y., Kang, T., Yeh, S., Baddepudi, A., Popowski, L., Piccardi, T., & Bernstein, M. S. (2025) · Proceedings of the ACM on Human-Computer Interaction · doi:10.1145/3757563 · Cited by 5
Explosive opinion polarization and depolarization with asymmetric perception
Qian, H., & Asllani, M. (2025) · Physical review. E · doi:10.1103/km1w-fmfr · Cited by 1
Physical partisan proximity outweighs online ties in predicting US voting outcomes
Tonin, M., Lepri, B., & Tizzoni, M. (2025) · PNAS Nexus · doi:10.1093/pnasnexus/pgaf308
Educación Mediática Crítica con y en Inteligencia Artificial Generativa
Santoveña, I. P., & Murias, T. F. (2025) · VISUAL REVIEW International Visual Culture Review / Revista Internacional de Cultura Visual · doi:10.62161/revvisual.v17.5948
Matsuo, A., & Ueno, T. (2025) · Personality and Social Psychology Bulletin · doi:10.1177/01461672251384355
“Indeed, affective polarization was found to be driven by digital media (Törnberg, 2022).”
Podcasts in intimisierter Öffentlichkeit
Wagner, E. (2025) · Springer eBooks · doi:10.1007/978-3-662-72095-0_13
Novotná, M., & Vochocová, L. (2025) · Mass Communication & Society · doi:10.1080/15205436.2025.2592231
22713 From Local News to Polarized Views: The Nationalization of the American Media
McCrain, J. (2025) · De Gruyter eBooks · doi:10.1515/9783111591902-013
MengLv, & GuangYang (2025) · Concurrency and Computation Practice and Experience · doi:10.1002/cpe.70519
Evolution of swing voters under strategic campaigns in presidential elections
Liu, Z., Wang, X., Lu, J., Liu, L., Zheng, H., & Tang, S. (2026) · Physical Review Research · doi:10.1103/jdyh-t4rp
Yeaton, M., Anshuman, S., & Srivastava, S. B. (2026) · American Journal of Sociology · doi:10.1086/740301
Fox news cable consumption and trust in conservative political iconographies
Mencken, F. C., & Johnson, R. (2026) · Sociological Spectrum · doi:10.1080/02732173.2025.2608033
“In a report to the National Academy of Sciences, Törnberg (2022) points out that half of Americans now expect a civil war, and that 1 in 5 Americans now believe that political violence is justified.”
Widler, V., Kamińska, B., Martins, A. C. R., et al. (2026) · Computational social sciences · doi:10.1007/978-3-032-01373-6_10
Political polarization as a co-adaptive process
Soroka, S., Kernell, G., & Lamberson, P. J. (2026) · Journal of Communication · doi:10.1093/joc/jqag001
Members of Congress and the pictures in their heads: The impact of social media on elected officials
Tremayne, M. (2026) · Online Journal of Communication and Media Technologies · doi:10.30935/ojcmt/17895
Twitter (X) as a Catalyst for Change: Digital Dilemma in Destabilizing Hasina’s Wajed's Government
Saleem, K., Ansari, N. A., & Ghafoor, I. (2026) · Qlantic journal of social sciences. · doi:10.55737/qjss.vii-i.26472
Rim, N., Jackson, J. C., Berman, M. G., & Leong, Y. C. (2026) · Communications Psychology · doi:10.1038/s44271-026-00430-x · Cited by 1
“Language on these forums can therefore serve as a mechanism through which affective polarization is further entrenched via social in fl uence and ideological sorting 62,63 .”
The effects of political advertising on Facebook and Instagram before the 2020 US election
Allcott, H., Gentzkow, M. A., Levy, R., Crespo-Tenorio, A., Dumas, N., Mason, W., Moehler, D., Barberá, P., Brown, T., Cisneros, J. C., et al. (2026) · Nature Human Behaviour · doi:10.1038/s41562-025-02328-w · Cited by 1
“…reduce participation and turnout ( 47–49 ); that political ads can be polarizing and that this is likely to be especially true for digital ads ( 31,32 ); that 2020 political ads and political micro-targeting were effective in undermining confidence in the electoral system ( 33, 34 ); and that…”
Frossard, C. M. (2026) · Digital Geography and Society · doi:10.1016/j.diggeo.2026.100166
The Spectacle of Power: Hybridisation and Digital Populism in White House Communication (2025)
Molpeceres, A. M. V., Hernández, J. R., & Fernández, E. O. (2026) · Social Sciences · doi:10.3390/socsci15030186
Competing feedback channels drive phase transitions in collective emotion
Wu, J., & Liu, Z. (2026) · Chaos Solitons & Fractals · doi:10.1016/j.chaos.2026.118303
From being there to becoming together : Organizing co-presence in hybrid modes of working
Bancou, L. (2024) · theses.fr (ABES) · doi:10.70675/69248936z4049z4567z86f9z406de426680a
Automatic News Analysis for Polarization Understanding
Dufraisse, E. (2024) · theses.fr (ABES) · doi:10.70675/29624c9cz4601z4ac8z85f6z0908edba32a3
When social networks polarize: On the number of clusters in the Hegselmann–Krause model
de Vos, W., Michel Grabisch, B., & Rusinowska, A. (2026) · Mathematical Social Sciences · doi:10.1016/j.mathsocsci.2026.102530
Polarization in Online Communication
Erdoğan, E. (2026) · Springer eBooks · doi:10.1007/978-3-031-52643-5_193-1
Liu, Z., Wu, H., Fang, X., et al. (2026) · Information Processing & Management · doi:10.1016/j.ipm.2026.104887
Jang, K., & Baek, Y. M. (2026) · Behaviour and Information Technology · doi:10.1080/0144929x.2026.2675625
Rao, H., & Greve, H. R. (2026) · Oxford University Press eBooks · doi:10.1093/9780197772324.003.0009
Topic Modeling and Word Embedding
Rao, H., & Greve, H. R. (2026) · Oxford University Press eBooks · doi:10.1093/9780197772324.005.0001
Linguistic Patterns in Online Conspiracy Theory
Rao, H., & Greve, H. R. (2026) · Oxford University Press eBooks · doi:10.1093/9780197772324.003.0001
Opportunities for Future Research
Rao, H., & Greve, H. R. (2026) · Oxford University Press eBooks · doi:10.1093/9780197772324.003.0010
Rao, H., & Greve, H. R. (2026) · Oxford University Press eBooks · doi:10.1093/9780197772324.003.0005
From Mindsets and Algorithms to a Cultural Toolkit
Rao, H., & Greve, H. R. (2026) · Oxford University Press eBooks · doi:10.1093/9780197772324.003.0004
Why Do Online Conspiracy Theories Matter?
Rao, H., & Greve, H. R. (2026) · Oxford University Press eBooks · doi:10.1093/9780197772324.003.0002
Rao, H., & Greve, H. R. (2026) · Oxford University Press eBooks · doi:10.1093/9780197772324.002.0001
Online Conspiracy Theorizing as Conversational Coordination
Rao, H., & Greve, H. R. (2026) · Oxford University Press eBooks · doi:10.1093/9780197772324.003.0008
Fake News, Rumors, Folk Theories
Rao, H., & Greve, H. R. (2026) · Oxford University Press eBooks · doi:10.1093/9780197772324.003.0003
Online Conspiracy Rabbit Hole as a Semantic Cascade
Rao, H., & Greve, H. R. (2026) · Oxford University Press eBooks · doi:10.1093/9780197772324.003.0006
Rao, H., & Greve, H. R. (2026) · Oxford University Press eBooks · doi:10.1093/9780197772324.002.0006
How We Studied Conspiracy Theories
Rao, H., & Greve, H. R. (2026) · Oxford University Press eBooks · doi:10.1093/9780197772324.005.0002
Rao, H., & Greve, H. R. (2026) · Oxford University Press eBooks · doi:10.1093/9780197772324.002.0007
Rao, H., & Greve, H. R. (2026) · doi:10.1093/9780197772324.001.0001
Linguistic Signature of Superspreaders
Rao, H., & Greve, H. R. (2026) · Oxford University Press eBooks · doi:10.1093/9780197772324.003.0007
Psycholinguistic patterns in digital discourse on the Israel–Palestine conflict
Karadağlı, K., & Bogatekin, M. A. (2026) · Opus uluslararası toplum araştırmaları dergisi · doi:10.26466/opusjsr.1864676
Vochocová, L., & Rosenfeldová, J. (2026) · Social Media + Society · doi:10.1177/20563051261449018
“…topic from different theoretical perspectives including identity theory (Hogg, 2023; Martinsson & Ericson, 2023) and discursive community formation (Törnberg, 2022; Törnberg & Törnberg, 2024), they describe a similar process: crisis times cause rising self-uncertainty which nurtures people’s need…”
InfluentialUnderstanding and Supporting Online Discussion with Opinionated Chatbots
Song, T., Yang, C.-L., Liu, Z., Xu, Z., Feng, Y., & Lee, Y.-C. (2026) · Proceedings of the ACM on Human-Computer Interaction · doi:10.1145/3817024
“A large body of prior work, particularly in social media contexts, has shown that exposure to opposing political opinions can intensify polarization [3, 71].”
39317 An introduction to agent-based modeling for communication research
Cruz, S. M., Vogel, E., Vu, N. C., & Wang, R. Y. (2026) · De Gruyter eBooks · doi:10.1515/9783111203577-017 · Cited by 1
Die Corona-Pandemie als Krise in der digitalen Öffentlichkeit
Neuberger, C., & Primig, F. (2026) · Springer eBooks · doi:10.1007/978-3-658-47239-9_21-1
Kurella, A. (2026) · Public Choice · doi:10.1007/s11127-026-01424-3
Mulcahy, R., & Simpson, J. (2026) · Emerald Group Publishing Limited eBooks · doi:10.1108/978-1-83797-787-120261002
Lv, M., & Yang, G. (2026) · Digital Scholarship in the Humanities · doi:10.1093/llc/fqag085 · Cited by 1
Wang, X., Liu, Y., Wu, S., Zhao, Z., Hu, Y., Li, W., & Bai, Q. (2026) · Neurocomputing · doi:10.1016/j.neucom.2026.134333 · Cited by 2
Duarte, L., & Boente, A. N. P. (2026) · RECIMA21 - Revista Científica Multidisciplinar · doi:10.47820/recima21.v7i7.8406
Exposure to news and political content on TikTok: A Case Study Around the 2024 US Election
Ge, C., Gautam, N., Vajjhala, S., Ng, C., Hasell, A., & Tomkins, S. (2026) · ACM Conference on Fairness, Accountability, and Transparency (FAccT) · doi:10.1145/3805689.3812207
“This may explain why people who rely on social media platforms to show them important political information often end up with more polarized political attitudes and less factually accurate political knowledge, especially when they do not actively seek out news media in other contexts [19, 58].”
Avatars, Identity, and Radicalization: the Psychological and Neurobiological Risks of VR for Youth
Brasi, C., Seccomandi, B., & Sanfilippo, F. (2025) · Asian Conference on Communication and Networks (ASIANComNet) · doi:10.1109/asiancomnet68615.2025.11579669
“This mechanism explains how the low empathy toward external groups a hallmark of parochial empathy develops [41].”
Political Fandom and Anti-fandom on Instagram During the 2024 European Parliament Election Campaign
Barbieri, G., & Consonni, S. (2026) · Springer eBooks · doi:10.1007/978-3-032-25247-0_6
Algorithms and Targeted Content
Erdoğan, E. (2026) · Springer eBooks · doi:10.1007/978-3-031-52643-5_61-1
Sahlan, M. (2026) · International Journal of Research and Review · doi:10.52403/ijrr.20260720
Pierce, G., Hernandez, A., Connolly, R. E., et al. (2026) · ACS ES&T Water · doi:10.1021/acsestwater.6c00325
Learning About Polarization from Simulation: A Comparative Analysis of Four Models
Baillie, E., Smith, W., & Geard, N. L. (2026) · Springer proceedings in complexity · doi:10.1007/978-3-032-31712-4_1
Online Toxicity: Birthed from Polarization, Raised by Platforms
Giannouli, I., & Karadimitriou, A. (2026) · Platforms · doi:10.3390/platforms4030016
Partisan conflict and economic policy uncertainty: insights from a time-varying causality approach
Antonakakis, N., Tiruneh, M. W., Gabauer, D., Schubert, S. R., & Παπαδοπούλου-Κελίδου, Λ. (2026) · Public Choice · doi:10.1007/s11127-026-01451-0
Nachrichten und politische Inhalte
Ohme, J., & Marquart, F. (2026) · Springer eBooks · doi:10.1007/978-3-658-46851-4_40-1
Do Cultural Exports Shape Country Image? Evidence From Chinese Film Releases and Global Media Data
Liu, F., Zheng, M., Wu, X., et al. (2026) · World Economy · doi:10.1111/twec.70141
What drives affective polarization? A systematic literature review
Kogel, M. J., & Zinnatullin, A. (2026) · European Political Science · doi:10.1017/s1682098326100642 · Cited by 1
Nationalization, network structure and partisan polarization
Li, J. (2026) · PLOS complex systems. · doi:10.1371/journal.pcsy.0000121
“As shown in previous studies [15,34], the more partisan interactions are online and not bounded by neighborhood proximity and geographical distance, the less face-to-face interactions and a higher level of nationalized partisan interactions and a higher exposure to salient partisan media and news…”
Ethics, Transparency, and Algorithmic Accountability in Broadcast Media
Özkan, A. V. C. I., & Gültepe, M. (2026) · Advances in computational intelligence and robotics book series · doi:10.4018/979-8-2600-3965-6.ch001
Intersectional identity and framing of Black Lives Matter news coverage
Haenschen, K., & Smith, M. A. L. (2026) · Politics Groups and Identities · doi:10.1080/21565503.2026.2672962
Levin, S. H., Wang, R., Seo, J., Leong, Y. Y., Bennett, E., Yang, D., Yang, Z.-H., Chen, M., Zhang, Y.-N., & Suk, J. (2026) · Political Communication · doi:10.1080/10584609.2026.2717428
Boakye, D. (2026) · Howard Journal of Communications · doi:10.1080/10646175.2026.2725650
Toward an integrated and globally equitable understanding of political polarization
Falkenberg, M., Cinelli, M., Galeazzi, A., Bail, C. A., Benito, R. M., Bruns, A., Gruzd, A. A., Lazer, D., Lee, J. K., McCoy, J., et al. (2026) · Nature Communications · doi:10.1038/s41467-026-76110-5 · Cited by 13
“In both cases, researchers have argued that the news media and social media play a key role in facilitating growing issue or identity alignment 68 .”
InfluentialDong, B., Zhang, Q., & Liang, Z. (2026) · Chaos An Interdisciplinary Journal of Nonlinear Science · doi:10.1063/5.0337453
The limits of nuance: how social media undermine nuanced political communication
Zarouali, B. (2026) · Online Information Review · doi:10.1108/oir-04-2026-0383
Examining the Role of Race and Sector of Employment in Public Participation
Wang, R., Prince, W. G., & Amirkhanyan, A. A. (2026) · Public Performance & Management Review · doi:10.1080/15309576.2026.2735631
Science-Integrated Munakahat Learning as Sex Education for High School Students
Zein, N., İlhami, A., Irawati, I., et al. (2026) · Berkala Ilmiah Pendidikan · doi:10.51214/bip.v6i3.1892
Media Convergence-Based Journalistic Competency Model in Journalistic Education in the Digital Era
Zulkarnain, I. (2025) · Berkala Ilmiah Pendidikan · doi:10.51214/bip.v5i2.2295
“These findings align with the concept of journalistic professionalism, which identifies journalistic knowledge, honesty, respect for others' rights, responsibility, ethics, meticulousness, and accuracy as elements of professionalism (Törnberg 2022).”
Socially Interactive Agent for Group Debate Mediation
Gomez, N. (2026) · INTERNATIONAL CONFERENCE ON MULTIMODAL INTERACTION · doi:10.1145/3776574.3828966
“Political polarization has become a critical societal challenge, intensified by social media echo chambers and the growing difficulty of productive cross-partisan dialogue [40].”
The evolving study of political polarization
Erdogan, E., Jaworsky, B. N., Álvares, C., Bodroža, B., Butkevičienė, E., Cela, E., Dodeigne, J., Fahmy, S. S., Schäfer, S. H., Scott, G., et al. (2026) · Open Research Europe · doi:10.12688/openreseurope.23252.1
“These models allow researchers to test “ what-if ” scenarios, such as how algorithmic personalization or bot amplification might drive affective divides, even in the absence of ideological extremism (Törnberg, 2022; Pescetelli et al., 2022).”
Metadata
- Authors
- Törnberg, P.
- Affiliations
- University of Neuchâtel (CH)
- Corresponding author
- Törnberg, Petter
- ORCID
- Törnberg, Petter
- Venue
- Proceedings of the National Academy of Sciences
- Publisher
- National Academy of Sciences
- Published
- 2022-10-10
- Volume
- 119
- Issue
- 42
- Pages
- e2207159119-e2207159119
- ISSN
- 0027-8424 (ISSN-L)
- 1091-6490
- PMC
- PMC9586282
- OpenAlex
- W4304098849
- Semantic Scholar
- ab19b3fdc1f28d16e01c7ca9fdd1ba217428a298
- Cited by
- 288
- References
- 110
- Citations by year
- 2026: 76 · 2025: 75 · 2024: 79 · 2023: 52 · 2022: 6
- FWCI
- 81.17
- Type
- journal article
- Language
- en
- Open access
- hybrid
- doi.org
- Licence
- Locations
- Proceedings of the National Academy of Sciences (publishedVersion, cc-by-nc-nd)
- PubMed (publishedVersion)
- UvA-DARE (University of Amsterdam) (acceptedVersion, cc-by-nc-nd)
- PubMed Central (submittedVersion, cc-by-nc-nd)
- RePEc: Research Papers in Economics (submittedVersion)
- Data Archiving and Networked Services (DANS) (submittedVersion, other-oa)
- Funders
- Nederlandse Organisatie voor Wetenschappelijk Onderzoek (VI.Veni.201S.006)
- Topics
- Social Sciences › Communication › Social Media and Politics
- Social Sciences › Political Science and International Relations › Electoral Systems and Political Participation
- Physical Sciences › Physics and Astronomy › Statistical and Nonlinear Physics › Opinion Dynamics and Social Influence
- Keywords
- affective polarization, digital media, partisan sorting, opinion dynamics, nonlocal interactions, local interactions, political polarization, social media
- MeSH terms
- Attitude, Humans, Politics, Internet
About these checks
Registry, retraction, Cites and statistics results are computed, not judged, with one exception: a printed reference that no index lists is read once by a model before it counts as a citation error. Claims are extracted by a model and kept only when their quote appears verbatim in the text; each cited source is then checked, with a model’s help, for whether it says what the claim relies on. Those verdicts can be wrong — read the claim’s quote and the cited source before relying on one.
A language model drew the claims from the paper on 2026-10-13, under version 3 of the claim definition (model deepseek-v4.1-flash, prompt extract-v3).
A second model labelled each claim on 2026-10-13 (model jev-1.13-20260917, definition revision gold-guideline-v0.2).
Cited sources are checked with a language model’s help (gpt-6-sol).
Statistics and arithmetic are recomputed, not judged.
Confidence bands are shown only for fields calibrated on our annotated test set. None is calibrated yet, so no band is shown.
What counts as a claim ›How we measure confidence ›How we check this ›
Are you an author, or do you see a problem with this page? Request a review
