

The DOI matches its Crossref record; 57 of the 57 references it cites were found in a registry or an index.
Proteasome and p97 mediate mitophagy and degradation of mitofusins induced by Parkin
Open accessAbstract
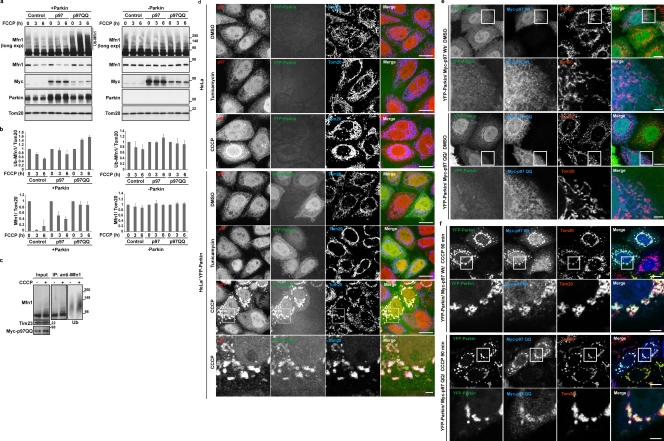
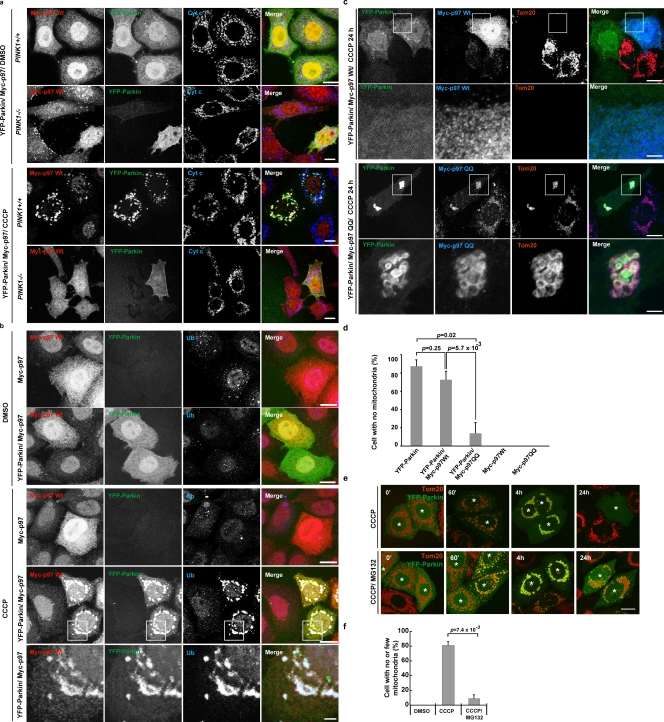
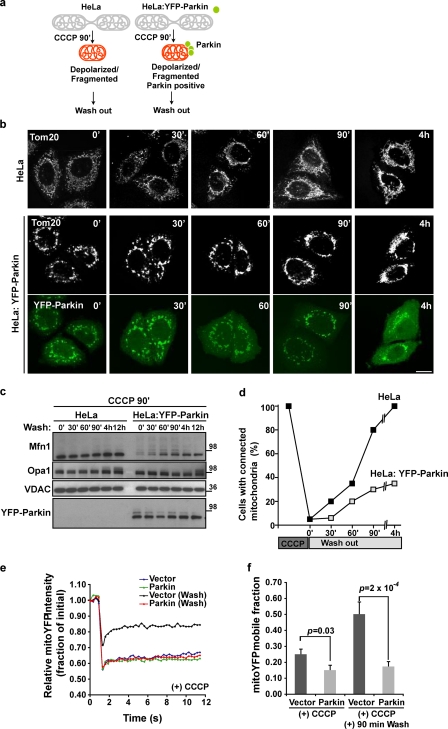
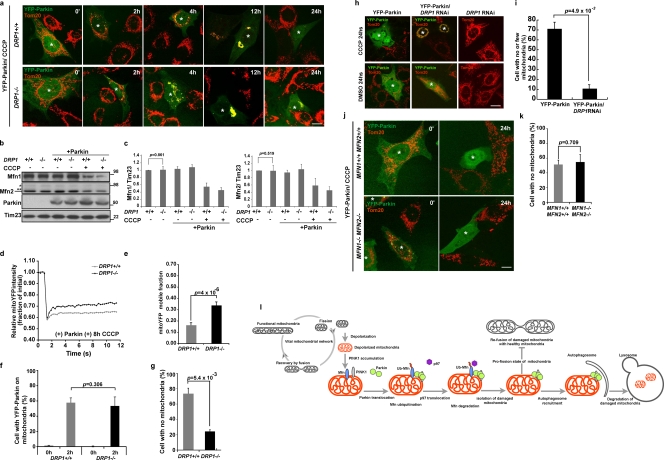
Damage to mitochondria can lead to the depolarization of the inner mitochondrial membrane, thereby sensitizing impaired mitochondria for selective elimination by autophagy. However, fusion of uncoupled mitochondria with polarized mitochondria can compensate for damage, reverse membrane depolarization, and obviate mitophagy. Parkin, an E3 ubiquitin ligase that is mutated in monogenic forms of Parkinson’s disease, was recently found to induce selective autophagy of damaged mitochondria. Here we show that ubiquitination of mitofusins Mfn1 and Mfn2, large GTPases that mediate mitochondrial fusion, is induced by Parkin upon membrane depolarization and leads to their degradation in a proteasome- and p97-dependent manner. p97, a AAA+ ATPase, accumulates on mitochondria upon uncoupling of Parkin-expressing cells, and both p97 and proteasome activity are required for Parkin-mediated mitophagy. After mitochondrial fission upon depolarization, Parkin prevents or delays refusion of mitochondria, likely by the elimination of mitofusins. Inhibition of Drp1-mediated mitochondrial fission, the proteasome, or p97 prevents Parkin-induced mitophagy.
Overview
The claims and statistics of this paper haven’t been checked yet.
Run the check — free, no account needed. It reads the open-access text and checks the sources it cites.
Integrity signals
Registry
Cites
Statistics
Figures
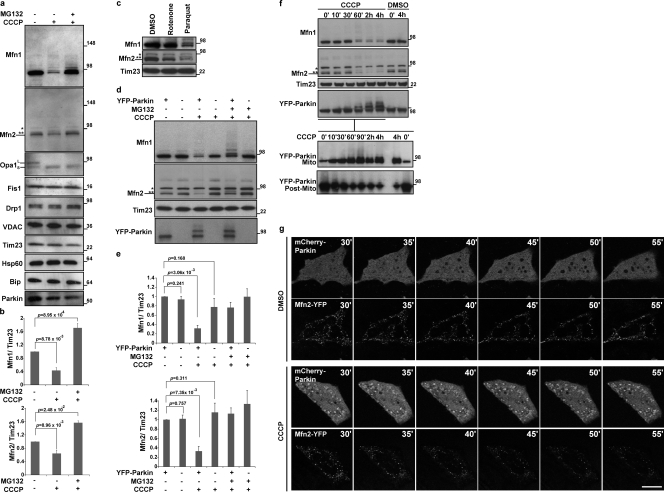
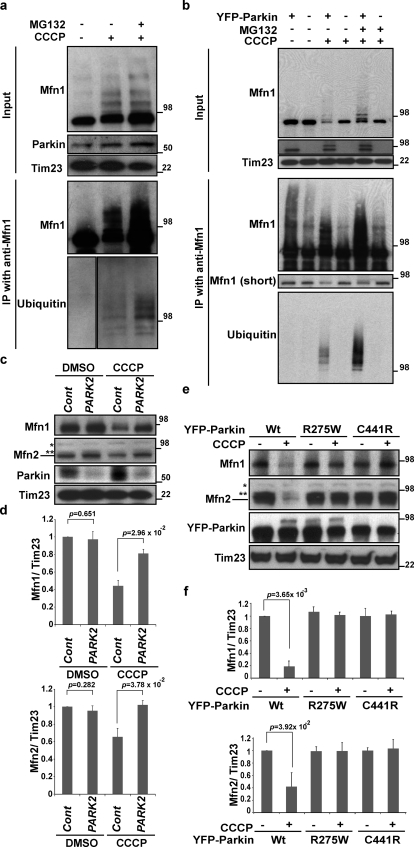
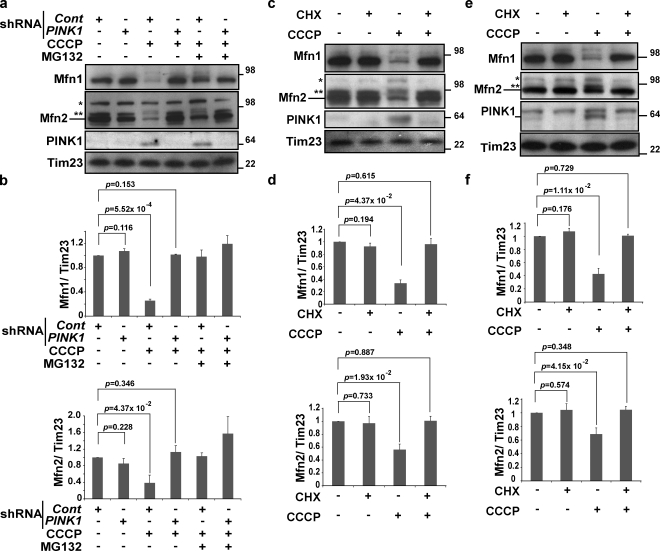
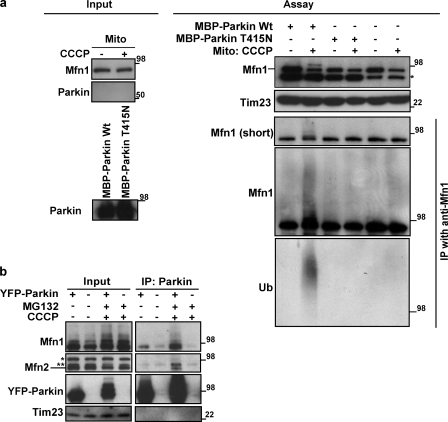
Verification
Claims the paper makes
The claims and statistics of this paper haven’t been checked yet.
Run the check — free, no account needed. It reads the open-access text and checks the sources it cites.
Claims other papers make about this one
Each is checked against this paper’s own text: does it say what the citing paper says it does?
The source backs part of the claim, not all of it — or backs it for a different population, condition or comparison.
In the citing paper
“p97/VCP is critical in the retrotranslocation and degradation of endoplasmic reticulum-associated proteins (ERAD) [47] and mitochondrial proteins ( MAD) [49, 50].”
From The connection between the dynamic remodeling of the mitochondrial network and the regulation of muscle mass (2021) · cites this paper as [49]
Experimental — accuracy not yet measuredIn the citing paper
“p97 provides the driving force to extract Mfn1, Mfn2, and the anti-apoptotic protein MCL1 from the OMM and chaperone them to the proteasome [49, 50].”
From The connection between the dynamic remodeling of the mitochondrial network and the regulation of muscle mass (2021) · cites this paper as [49]
In the citing paper
“Parkin inhibits refusion after mitochondrial fission upon depolarization by inducing the proteasomal degradation of mitofusins (97).”
From From mitochondria to sarcopenia: role of 17β-estradiol and testosterone (2023) · cites this paper as [97]
In the citing paper
“Latent Parkin, in the cytosol, is activated and relocalized to the outer mitochondrial membrane, ubiquitinating mitochondrial proteins such as Mitofusin and Miro (Liu et al., 2012, Tanaka et al., 2010, Wang et al., 2011).”
From A Cell-Based High-Throughput Screening Identified Two Compounds that Enhance PINK1-Parkin Signaling (2020) · cites this paper as Tanaka et al., 2010
Self-check
Percentages, sums and reported differences re-computed from the paper’s own numbers.
The self-check needs the paper’s full text.
Citations
Cites
Mutations in the parkin gene cause autosomal recessive juvenile parkinsonism
Kitada, T., Asakawa, S., Hattori, N., Matsumine, H., Yamamura, Y., Minoshima, S., Yokochi, M., Mizuno, Y., & Shimizu, N. (1998) · Nature · doi:10.1038/33416 · Cited by 5,227
Parkin is recruited selectively to impaired mitochondria and promotes their autophagy
Narendra, D., Tanaka, A., Suen, D.-F., & Youle, R. J. (2008) · The Journal of Cell Biology · doi:10.1083/jcb.200809125 · Cited by 4,026
Self-citationChronic systemic pesticide exposure reproduces features of Parkinson's disease
Betarbet, R. S., Sherer, T., MacKenzie, G. M., Garcia‐Osuna, M., Panov, A. V., & Greenamyre, J. T. (2000) · Nature Neuroscience · doi:10.1038/81834 · Cited by 3,770
Hereditary Early-Onset Parkinson's Disease Caused by Mutations in PINK1
Valente, E. M., Abou-Sleiman, P. M., Caputo, V., Muqit, M. M. K., Harvey, K., Gispert, S., Ali, Z., Del Turco, D., Bentivoglio, A. R., Healy, D. G., et al. (2004) · Science · doi:10.1126/science.1096284 · Cited by 3,481
Fission and selective fusion govern mitochondrial segregation and elimination by autophagy
Twig, G., Elorza, A., Molina, A. J. A., Mohamed, H., Wikstrom, J. D., Walzer, G., Stiles, L., Haigh, S. E., Katz, S., Las, G., et al. (2008) · The EMBO Journal · doi:10.1038/sj.emboj.7601963 · Cited by 3,082
PINK1 Is Selectively Stabilized on Impaired Mitochondria to Activate Parkin
Narendra, D. P., Jin, S. M., Tanaka, A., Suen, D.-F., Gautier, C. A., Shen, J., Cookson, M. R., & Youle, R. J. (2010) · PLoS Biology · doi:10.1371/journal.pbio.1000298 · Cited by 2,944
Self-citationPINK1/Parkin-mediated mitophagy is dependent on VDAC1 and p62/SQSTM1
Geisler, S., Holmström, K. M., Skujat, D., Fiesel, F. C., Rothfuss, O. C., Kahle, P. J., & Springer, W. (2010) · Nature Cell Biology · doi:10.1038/ncb2012 · Cited by 2,835
Close Contacts with the Endoplasmic Reticulum as Determinants of Mitochondrial Ca 2+ Responses
Rizzuto, R., Pinton, P., Carrington, W., Fay, F. S., Fogarty, K. E., Lifshitz, L. M., Tuft, R. A., & Pozzan, T. (1998) · Science · doi:10.1126/science.280.5370.1763 · Cited by 2,257
Matsuda, N., Sato, S., Shiba, K., Okatsu, K., Saisho, K., Gautier, C. A., Sou, Y.-S., Saiki, S., Kawajiri, S., Sato, F., et al. (2010) · Journal of Cell Biology · doi:10.1083/jcb.200910140 · Cited by 1,969
Drosophila pink1 is required for mitochondrial function and interacts genetically with parkin
Clark, I. E., Dodson, M. W., Jiang, C., Cao, J. H., Huh, J. R., Seol, J. H., Yoo, S. J., Hay, B. A., & Guo, M. (2006) · Nature · doi:10.1038/nature04779 · Cited by 1,788
Cited by
Sorted by citations
Autophagy: Renovation of Cells and Tissues
Mizushima, N., & Komatsu, M. (2011) · Cell · doi:10.1016/j.cell.2011.10.026 · Cited by 6,615
Guidelines for the use and interpretation of assays for monitoring autophagy (3rd edition).
Klionsky, D. J., Abdelmohsen, K., Abe, A., Abedin, M. J., Abeliovich, H., Acevedo Arozena, A., Adachi, H., Adams, C. M., Adams, P. D., Adeli, K., et al. (2016) · Autophagy · doi:10.1080/15548627.2015.1100356 · Cited by 5,894
Guidelines for the use and interpretation of assays for monitoring autophagy
Klionsky, D. J., Abdalla, F. C., Abeliovich, H., Abraham, R. T., Acevedo-Arozena, A., Adeli, K., Agholme, L., Agnello, M., Agostinis, P., Aguirre-Ghiso, J. A., et al. (2012) · Autophagy · doi:10.4161/auto.19496 · Cited by 3,996
Mitochondrial Fission, Fusion, and Stress
Youle, R. J., & van der Bliek, A. M. (2012) · Science · doi:10.1126/science.1219855 · Cited by 3,674
Self-citationMitochondria: In Sickness and in Health
Nunnari, J., & Suomalainen, A. (2012) · Cell · doi:10.1016/j.cell.2012.02.035 · Cited by 3,479
Youle, R. J., & Narendra, D. P. (2011) · Nature Reviews Molecular Cell Biology · doi:10.1038/nrm3028 · Cited by 3,273
Self-citationThe Role of Atg Proteins in Autophagosome Formation
Mizushima, N., Yoshimori, T., & Ohsumi, Y. (2011) · Annual Review of Cell and Developmental Biology · doi:10.1146/annurev-cellbio-092910-154005 · Cited by 2,978
Guidelines for the use and interpretation of assays for monitoring autophagy (4th edition) 1
Klionsky, D. J., Abdel-Aziz, A. K., Abdelfatah, S., Abdellatif, M., Abdoli, A., Abel, S., Abeliovich, H., Abildgaard, M. H., Abudu, Y. P., Acevedo-Arozena, A., et al. (2021) · Autophagy · doi:10.1080/15548627.2020.1797280 · Cited by 2,897
The Roles of PINK1, Parkin, and Mitochondrial Fidelity in Parkinson’s Disease
Pickrell, A. M., & Youle, R. J. (2015) · Neuron · doi:10.1016/j.neuron.2014.12.007 · Cited by 2,310
Self-citationMitophagy and Quality Control Mechanisms in Mitochondrial Maintenance
Pickles, S., Vigié, P., & Youle, R. J. (2018) · Current Biology · doi:10.1016/j.cub.2018.01.004 · Cited by 2,081
Self-citationThe pathways of mitophagy for quality control and clearance of mitochondria
Ashrafi, G., & Schwarz, T. L. (2013) · Cell Death & Differentiation · doi:10.1038/cdd.2012.81 · Cited by 1,900
Synaptic Energy Use and Supply
Harris, J. J., Jolivet, R., & Attwell, D. (2012) · Neuron · doi:10.1016/j.neuron.2012.08.019 · Cited by 1,747
Mitochondrial form and function
Friedman, J. R., & Nunnari, J. (2014) · Nature · doi:10.1038/nature12985 · Cited by 1,803
The Role of Oxidative Stress in Parkinson's Disease
Dias, V., Junn, E., & Mouradian, M. M. (2013) · Journal of Parkinson’s Disease · doi:10.3233/jpd-130230 · Cited by 1,845
During autophagy mitochondria elongate, are spared from degradation and sustain cell viability
Gomes, L. C., Benedetto, G. D., & Scorrano, L. (2011) · Nature Cell Biology · doi:10.1038/ncb2220 · Cited by 1,735
Mechanisms of mitophagy in cellular homeostasis, physiology and pathology
Palikaras, K., Lionaki, E., & Tavernarakis, N. (2018) · Nature Cell Biology · doi:10.1038/s41556-018-0176-2 · Cited by 1,556
Mitochondrial Dynamics and Its Involvement in Disease
Chan, D. C. (2020) · Annual Review of Pathology: Mechanisms of Disease · doi:10.1146/annurev-pathmechdis-012419-032711 · Cited by 1,416
Autophagy, mitochondria and oxidative stress: cross-talk and redox signalling.
Lee, J., Giordano, S., & Zhang, J. (2012) · Biochemical Journal · doi:10.1042/bj20111451 · Cited by 1,438
Molecular mechanisms and physiological functions of mitophagy
Onishi, M., Yamano, K., Sato, M., Matsuda, N., & Okamoto, K. (2021) · The EMBO Journal · doi:10.15252/embj.2020104705 · Cited by 1,469
Mitochondrial Dynamics in the Regulation of Nutrient Utilization and Energy Expenditure
Liesa, M., & Shirihai, O. S. (2013) · Cell Metabolism · doi:10.1016/j.cmet.2013.03.002 · Cited by 1,341
Mitochondrial energetics in the kidney
Bhargava, P., & Schnellmann, R. G. (2017) · Nature Reviews Nephrology · doi:10.1038/nrneph.2017.107 · Cited by 1,391
PINK1 phosphorylates ubiquitin to activate Parkin E3 ubiquitin ligase activity
Kane, L. A., Lazarou, M., Fogel, A. I., Li, Y., Yamano, K., Sarraf, S. A., Banerjee, S., & Youle, R. J. (2014) · Journal of Cell Biology · doi:10.1083/jcb.201402104 · Cited by 1,298
Self-citationMitochondria and the Autophagy–Inflammation–Cell Death Axis in Organismal Aging
Green, D. R., Galluzzi, L., & Kroemer, G. (2011) · Science · doi:10.1126/science.1201940 · Cited by 1,245
Fusion and fission: interlinked processes critical for mitochondrial health
Chan, D. C. (2012) · Annual Review of Genetics · doi:10.1146/annurev-genet-110410-132529 · Cited by 1,196
Proteasomal and Autophagic Degradation Systems
Đikić, I. (2017) · Annual Review of Biochemistry · doi:10.1146/annurev-biochem-061516-044908 · Cited by 1,217
Mitochondrial Dynamics — Mitochondrial Fission and Fusion in Human Diseases
Archer, S. L. (2013) · New England Journal of Medicine · doi:10.1056/nejmra1215233 · Cited by 1,120
Mitochondrial dynamics and inheritance during cell division, development and disease
Mishra, P., & Chan, D. C. (2014) · Nature Reviews Molecular Cell Biology · doi:10.1038/nrm3877 · Cited by 1,076
Mitophagy: mechanisms, pathophysiological roles, and analysis
Ding, W.-X., & Yin, X.-M. (2012) · bchm · doi:10.1515/hsz-2012-0119 · Cited by 1,032
Landscape of the PARKIN-dependent ubiquitylome in response to mitochondrial depolarization
Sarraf, S. A., Raman, M., Guarani-Pereira, V., Sowa, M. E., Huttlin, E. L., Gygi, S. P., & Harper, J. W. (2013) · Nature · doi:10.1038/nature12043 · Cited by 1,010
The mechanisms and roles of selective autophagy in mammals
Vargas, J. N. S., Hamasaki, M., Kawabata, T., Youle, R. J., & Yoshimori, T. (2022) · Nature Reviews Molecular Cell Biology · doi:10.1038/s41580-022-00542-2 · Cited by 1,088
Self-citationBroad activation of the ubiquitin–proteasome system by Parkin is critical for mitophagy
Chan, N. C., Salazar, A. M., Pham, A. H., Sweredoski, M. J., Kolawa, N. J., Graham, R. L. J., Hess, S., & Chan, D. C. (2011) · Human Molecular Genetics · doi:10.1093/hmg/ddr048 · Cited by 993
The mitophagy pathway and its implications in human diseases
Wang, S., Long, H., Hou, L., Feng, B., Ma, Z., Wu, Y., Zeng, Y., Cai, J., Zhang, D., & Zhao, G. (2023) · Signal Transduction and Targeted Therapy · doi:10.1038/s41392-023-01503-7 · Cited by 991
Mitochondrial transport in neurons: impact on synaptic homeostasis and neurodegeneration
Sheng, Z., & Cai, Q. (2012) · Nature reviews. Neuroscience · doi:10.1038/nrn3156 · Cited by 940
Mechanisms of Mitochondrial Fission and FusionPreprint
van der Bliek, A. M., Shen, Q., & Kawajiri, S. (2013) · Cold Spring Harbor Perspectives in Biology · doi:10.1101/cshperspect.a011072 · Cited by 903
Mitochondrial Cristae: Where Beauty Meets Functionality
Cogliati, S., Enriquez, J. A., & Scorrano, L. (2016) · Trends in Biochemical Sciences · doi:10.1016/j.tibs.2016.01.001 · Cited by 816
A new pathway for mitochondrial quality control: Mitochondrial-derived vesicles
Sugiura, A., McLelland, G., Fon, E. A., & McBride, H. M. (2014) · The EMBO Journal · doi:10.15252/embj.201488104 · Cited by 862
Wong, Y. C., & Holzbaur, E. L. F. (2014) · Proceedings of the National Academy of Sciences · doi:10.1073/pnas.1405752111 · Cited by 812
Emerging functions of the VCP/p97 AAA-ATPase in the ubiquitin system
Meyer, H. H., Bug, M., & Bremer, S. (2012) · Nature Cell Biology · doi:10.1038/ncb2407 · Cited by 832
Ubiquitination and selective autophagy
Shaid, S., Brandts, C. H., Serve, H., & Dikic, I. (2013) · Cell Death & Differentiation · doi:10.1038/cdd.2012.72 · Cited by 800
Kubli, D. A., & Gustafsson, Å. B. (2012) · Circulation Research · doi:10.1161/circresaha.112.265819 · Cited by 825
The Interplay Between Mitochondrial Dynamics and Mitophagy
Twig, G., & Shirihai, O. S. (2011) · Antioxidants & Redox Signaling · doi:10.1089/ars.2010.3779 · Cited by 778
Jiang, P., & Mizushima, N. (2013) · Cell Research · doi:10.1038/cr.2013.161 · Cited by 781
Deciphering the Molecular Signals of PINK1/Parkin Mitophagy
Nguyen, T. N., Padman, B. S., & Lazarou, M. (2016) · Trends in Cell Biology · doi:10.1016/j.tcb.2016.05.008 · Cited by 758
Ubiquitin-Dependent And Independent Signals In Selective Autophagy
Khaminets, A., Behl, C., & Đikić, I. (2015) · Trends in Cell Biology · doi:10.1016/j.tcb.2015.08.010 · Cited by 754
Exner, N., Lutz, A. K., Haass, C., & Winklhofer, K. F. (2012) · The EMBO Journal · doi:10.1038/emboj.2012.170 · Cited by 677
PINK1- and Parkin-mediated mitophagy at a glance
Jin, S. M., & Youle, R. J. (2012) · Journal of Cell Science · doi:10.1242/jcs.093849 · Cited by 656
Self-citationMitochondrial dynamics, mitophagy and cardiovascular disease
Vásquez-Trincado, C., García‐Carvajal, I., Pennanen, C., Parra, V., Hill, J. A., Rothermel, B. A., & Lavandero, S. (2015) · The Journal of Physiology · doi:10.1113/jp271301 · Cited by 637
Yoshii, S. R., Kishi, C., Ishihara, N., & Mizushima, N. (2011) · Journal of Biological Chemistry · doi:10.1074/jbc.m110.209338 · Cited by 612
What Genetics Tells us About the Causes and Mechanisms of Parkinson's Disease
Corti, O., Lesage, S., & Brice, A. (2011) · Physiological Reviews · doi:10.1152/physrev.00022.2010 · Cited by 652
Okatsu, K., Oka, T., Iguchi, M., Imamura, K., Kosako, H., Tani, N., Kimura, M., Go, E., Koyano, F., Funayama, M., et al. (2012) · Nature Communications · doi:10.1038/ncomms2016 · Cited by 629
Mitophagy, Mitochondrial Homeostasis, and Cell Fate
Ma, K., Chen, G., Li, W., Kepp, O., Zhu, Y., & Chen, Q. (2020) · Frontiers in Cell and Developmental Biology · doi:10.3389/fcell.2020.00467 · Cited by 623
Understanding Dopaminergic Cell Death Pathways in Parkinson Disease
Michel, P. P., Hirsch, É. C., & Hunot, S. (2016) · Neuron · doi:10.1016/j.neuron.2016.03.038 · Cited by 622
Autophagy balances inflammation in innate immunity
Deretic, V., & Levine, B. (2018) · Autophagy · doi:10.1080/15548627.2017.1402992 · Cited by 563
Endogenous Drp1 Mediates Mitochondrial Autophagy and Protects the Heart Against Energy Stress
Ikeda, Y., Shirakabe, A., Maejima, Y., Zhai, P., Sciarretta, S., Toli, J., Nomura, M., Mihara, K., Egashira, K., Ohishi, M., et al. (2015) · Circulation Research · doi:10.1161/circresaha.116.303356 · Cited by 571
Shiba-Fukushima, K., Imai, Y., Yoshida, S., Ishihama, Y., Kanao, T., Sato, S., & Hattori, N. (2012) · Scientific Reports · doi:10.1038/srep01002 · Cited by 577
The role of mitochondria in amyotrophic lateral sclerosis
Smith, E. F., Shaw, P. J., & Vos, K. J. D. (2017) · Neuroscience Letters · doi:10.1016/j.neulet.2017.06.052 · Cited by 579
The Role of Autophagy in the Heart
Sciarretta, S., Maejima, Y., Zablocki, D., & Sadoshima, J. (2018) · Annual Review of Physiology · doi:10.1146/annurev-physiol-021317-121427 · Cited by 547
The role of PINK1–Parkin in mitochondrial quality control
Narendra, D. P., & Youle, R. J. (2024) · Nature Cell Biology · doi:10.1038/s41556-024-01513-9 · Cited by 600
Self-citationLoss of iron triggers PINK1/Parkin‐independent mitophagy
Allen, G. F. G., Toth, R., James, J., & Ganley, I. G. (2013) · The EMBO Reports · doi:10.1038/embor.2013.168 · Cited by 555
Mitochondrial Dysfunction and Biogenesis in Neurodegenerative diseases: Pathogenesis and Treatment
Golpich, M., Amini, E., Mohamed, Z., Raymond, A. A., Ibrahim, N. M., & Ahmadiani, A. (2016) · CNS Neuroscience & Therapeutics · doi:10.1111/cns.12655 · Cited by 555
Hoshino, A., Mita, Y., Okawa, Y., Ariyoshi, M., Iwai-Kanai, E., Ueyama, T., Ikeda, K., Ogata, T., & Matoba, S. (2013) · Nature Communications · doi:10.1038/ncomms3308 · Cited by 536
Mitochondrial Trafficking in Neurons
Schwarz, T. L. (2013) · Cold Spring Harbor Perspectives in Biology · doi:10.1101/cshperspect.a011304 · Cited by 525
Mitochondria: The Next (Neurode)Generation
Schon, E. A., & Przedborski, S. (2011) · Neuron · doi:10.1016/j.neuron.2011.06.003 · Cited by 568
Emerging views of mitophagy in immunity and autoimmune diseases
Xu, Y., Shen, J., & Ran, Z. (2019) · Autophagy · doi:10.1080/15548627.2019.1603547 · Cited by 533
Ge, P., Dawson, V. L., & Dawson, T. M. (2020) · Molecular Neurodegeneration · doi:10.1186/s13024-020-00367-7 · Cited by 496
A pathway coordinated by DELE1 relays mitochondrial stress to the cytosol
Fessler, E., Eckl, E.-M., Schmitt, S., Mancilla, I. A., Meyer-Bender, M., Hanf, M., Philippou‐Massier, J., Krebs, S., Zischka, H., & Jae, L. T. (2020) · Nature · doi:10.1038/s41586-020-2076-4 · Cited by 515
Zhang, X., Yan, H., Yuan, Y., Gao, J., Shen, Z., Cheng, Y., Shen, Y., Wang, R.-R., Wang, X., Hu, W.-W., et al. (2013) · Autophagy · doi:10.4161/auto.25132 · Cited by 510
Aggrephagy: Selective Disposal of Protein Aggregates by Macroautophagy
Lamark, T., & Johansen, T. (2012) · International Journal of Cell Biology · doi:10.1155/2012/736905 · Cited by 514
Amm, I., Sommer, T., & Wolf, D. H. (2013) · Biochimica et Biophysica Acta (BBA) - Molecular Cell Research · doi:10.1016/j.bbamcr.2013.06.031 · Cited by 509
Integration of cellular bioenergetics with mitochondrial quality control and autophagy
Hill, B. G., Benavides, G. A., Lancaster, J. R., Ballinger, S. W., Dell’Italia, L., Zhang, J., & Darley-Usmar, V. M. (2012) · Biological Chemistry · doi:10.1515/hsz-2012-0198 · Cited by 495
Quality control of the mitochondrial proteome
Song, J., Herrmann, J. M., & Becker, T. (2020) · Nature Reviews Molecular Cell Biology · doi:10.1038/s41580-020-00300-2 · Cited by 501
New insights into the function and regulation of mitochondrial fission
Otera, H., Ishihara, N., & Mihara, K. (2013) · Biochimica et Biophysica Acta (BBA) - Molecular Cell Research · doi:10.1016/j.bbamcr.2013.02.002 · Cited by 501
Mitochondrial fission facilitates the selective mitophagy of protein aggregates
Burman, J. L., Pickles, S., Wang, C., Sekine, S., Vargas, J. N. S., Zhang, Z., Youle, A. M., Nezich, C. L., Wu, X., Hammer, J. A., et al. (2017) · Journal of Cell Biology · doi:10.1083/jcb.201612106 · Cited by 479
Self-citationKubli, D. A., Zhang, X., Lee, Y., Hanna, R. A., Quinsay, M. N., Nguyen, C. K., Jimenez, R., Petrosyan, S., Murphy, A. N., & Gustafsson, Å. B. (2013) · Journal of Biological Chemistry · doi:10.1074/jbc.m112.411363 · Cited by 476
Mitochondrial dysfunction and oxidative stress in Parkinson's disease and monogenic parkinsonism
Hauser, D. N., & Hastings, T. G. (2012) · Neurobiology of Disease · doi:10.1016/j.nbd.2012.10.011 · Cited by 487
Spatiotemporal Control of ULK1 Activation by NDP52 and TBK1 during Selective Autophagy
Vargas, J. N. S., Wang, C., Bunker, E. N., Hao, L., Maric, D., Schiavo, G., Randow, F., & Youle, R. J. (2019) · Molecular Cell · doi:10.1016/j.molcel.2019.02.010 · Cited by 484
Self-citationMitochondrial dynamics in neurodegeneration
Itoh, K., Nakamura, K., Iijima, M., & Sesaki, H. (2012) · Trends in Cell Biology · doi:10.1016/j.tcb.2012.10.006 · Cited by 486
Mitophagy in degenerative joint diseases
Sun, K., Jing, X., Guo, J., Yao, X., & Guo, F. (2020) · Autophagy · doi:10.1080/15548627.2020.1822097 · Cited by 471
Hsieh, C.-H., Shaltouki, A., Gonzalez, A. E., da Cruz, A. B., Burbulla, L. F., Lawrence, E. S., Schüle, B., Krainc, D., Palmer, T. D., & Wang, X. (2016) · Cell stem cell · doi:10.1016/j.stem.2016.08.002 · Cited by 475
Mitochondria and cell signalling
Tait, S. W. G., & Green, D. R. (2012) · Journal of Cell Science · doi:10.1242/jcs.099234 · Cited by 453
Quality control of the mitochondrion
Ng, M. Y. W., Wai, T., & Simonsen, A. (2021) · Developmental Cell · doi:10.1016/j.devcel.2021.02.009 · Cited by 468
A Molecular Approach to Mitophagy and Mitochondrial Dynamics.
Yoo, S., & Jung, Y. (2018) · PubMed · doi:10.14348/molcells.2018.2277 · Cited by 457
Mitochondrial quality control and muscle mass maintenance.
Romanello, V., & Sandri, M. (2016) · Frontiers in Physiology · doi:10.3389/fphys.2015.00422 · Cited by 434
The VCP/p97 system at a glance: connecting cellular function to disease pathogenesis
Meyer, H. H., & Weihl, C. C. (2014) · Journal of Cell Science · doi:10.1242/jcs.093831 · Cited by 442
Metformin Improves Mitochondrial Respiratory Activity through Activation of AMPK
Wang, Y., An, H., Liu, T., Qin, C., Sesaki, H., Guo, S., Radovick, S., Hussain, M., Maheshwari, A., Wondisford, F. E., et al. (2019) · Cell Reports · doi:10.1016/j.celrep.2019.09.070 · Cited by 432
“Because fission is associated with mitochondrial respiration (Cereghetti et al., 2008; Ishihara et al., 2006; Tanaka et al., 2010) and inhibition of fission by knocking out Drp1 impairs liver function (Yamada et al., 2018), metformin-stimulated fission will increase nutrient oxidation in…”
BackgroundParkin‐independent mitophagy requires Drp1 and maintains the integrity of mammalian heart and brain
Kageyama, Y., Hoshijima, M., Seo, K., Bedja, D., Sysa‐Shah, P., Andrabi, S. A., Chen, W., Höke, A., Dawson, V. L., Dawson, T. M., et al. (2014) · The EMBO Journal · doi:10.15252/embj.201488658 · Cited by 420
Mitochondria: from cell death executioners to regulators of cell differentiation
Kasahara, A., & Scorrano, L. (2014) · Trends in Cell Biology · doi:10.1016/j.tcb.2014.08.005 · Cited by 433
VCP/p97-Mediated Unfolding as a Principle in Protein Homeostasis and Signaling
van den Boom, J., & Meyer, H. H. (2017) · Molecular Cell · doi:10.1016/j.molcel.2017.10.028 · Cited by 415
The three ‘P’s of mitophagy: PARKIN.; PINK1.; and post-translational modifications
Durcan, T. M., & Fon, E. A. (2015) · Genes & Development · doi:10.1101/gad.262758.115 · Cited by 400
PINK1/Parkin-mediated mitophagy in neurodegenerative diseases
Li, J., Yang, D., Li, Z., Zhao, M., Wang, D., Sun, Z., Wen, P., Dai, Y., Gou, F., Ji, Y., et al. (2022) · Ageing Research Reviews · doi:10.1016/j.arr.2022.101817 · Cited by 406
RALA and RALBP1 regulate mitochondrial fission at mitosis
Kashatus, D. F., Lim, K.-H., Brady, D. C., Pershing, N. L. K., Cox, A. D., & Counter, C. M. (2011) · Nature Cell Biology · doi:10.1038/ncb2310 · Cited by 380
McLelland, G., Goiran, T., Yi, W., Dorval, G., Chen, C. X., Lauinger, N. D., Krahn, A. I., Valimehr, S., Raković, A., Rouiller, I., et al. (2018) · eLife · doi:10.7554/elife.32866 · Cited by 401
Pharmacological approaches to restore mitochondrial function
Andreux, P. A., Houtkooper, R. H., & Auwerx, J. (2013) · Nature Reviews Drug Discovery · doi:10.1038/nrd4023 · Cited by 383
USP8 regulates mitophagy by removing K6‐linked ubiquitin conjugates from parkin
Durcan, T. M., Tang, M. Y., Pérusse, J. R., Dashti, E. A., Aguileta, M. A., McLelland, G., Gros, P., Shaler, T. A., Faubert, D., Coulombe, B., et al. (2014) · The EMBO Journal · doi:10.15252/embj.201489729 · Cited by 375
Structure and function of Parkin E3 ubiquitin ligase reveals aspects of RING and HECT ligases
Riley, B. E., Lougheed, J. C., Callaway, K., Velasquez, M., Brecht, E., Nguyen, L., Shaler, T. A., Walker, D., Yang, Y., Regnström, K. J., et al. (2013) · Nature Communications · doi:10.1038/ncomms2982 · Cited by 378
Liu, S., Sawada, T., Lee, S., Yu, W., Silverio, G., Alapatt, P., Millan, I., Shen, A., Saxton, W., Kanao, T., et al. (2012) · PLoS Genetics · doi:10.1371/journal.pgen.1002537 · Cited by 371
The spatial and temporal organization of ubiquitin networks
Grabbe, C., Husnjak, K., & Đikić, I. (2011) · Nature Reviews Molecular Cell Biology · doi:10.1038/nrm3099 · Cited by 375
Mitochondrial fusion/fission dynamics in neurodegeneration and neuronal plasticity
Bertholet, A. M., Delerue, T., Millet, A. M., Moulis, M. F., David, C., Daloyau, M., Arnauné-Pelloquin, L., Davezac, N., Mils, V., Miquel, M. C., et al. (2016) · Neurobiology of Disease · doi:10.1016/j.nbd.2015.10.011 · Cited by 363
Mitophagy: An Emerging Role in Aging and Age-Associated Diseases
Chen, G., Kroemer, G., & Kepp, O. (2020) · Frontiers in Cell and Developmental Biology · doi:10.3389/fcell.2020.00200 · Cited by 359
Mitofusin 2: from functions to disease
Filadi, R., Pendin, D., & Pizzo, P. (2018) · Cell Death and Disease · doi:10.1038/s41419-017-0023-6 · Cited by 373
Metadata
- Authors
- Tanaka, A., Cleland, M. M., Xu, S., Narendra, D. P., Suen, D.-F., Karbowski, M., & Youle, R. J.
- Affiliations
- National Institutes of Health (US)
- Biochemistry Section, Surgical Neurology Branch, National Institute of Neurological Disorders and Stroke, National Institutes of Health, Bethesda, MD 20892 1
- University of Maryland, Baltimore (US)
- Corresponding author
- Karbowski, Mariusz
- Venue
- Journal of Cell Biology
- Publisher
- Rockefeller University Press
- Published
- 2010-12-20
- Volume
- 191
- Issue
- 7
- Pages
- 1367-1380
- ISSN
- 0021-9525 (ISSN-L)
- 1540-8140
- PMC
- PMC3010068
- OpenAlex
- W2104412320
- Cited by
- 1,369
- References
- 57
- Citations by year
- 2026: 48 · 2025: 58 · 2024: 68 · 2023: 68 · 2022: 84 · 2021: 108 · 2020: 111 · 2019: 101 · 2018: 78 · 2017: 85 · 2016: 99 · 2015: 85 · 2014: 111 · 2013: 110 · 2012: 97
- FWCI
- 60.98
- Type
- journal article
- Language
- en
- Open access
- hybrid
- doi.org
- Licence
- cc-by-nc-sa
- Locations
- The Journal of Cell Biology (publishedVersion, cc-by-nc-sa)
- PubMed Central (publishedVersion, cc-by-nc-sa)
- PubMed (publishedVersion)
- Funders
- National Institutes of Health
- Japan Society for the Promotion of Science
- National Institute of General Medical Sciences (R01GM083131)
- National Institute of Neurological Disorders and Stroke
- Topics
- Life Sciences › Biochemistry, Genetics and Molecular Biology › Cell Biology › Autophagy in Disease and Therapy
- Health Sciences › Medicine › Clinical Neurology › Parkinson's Disease Mechanisms and Treatments
- Life Sciences › Biochemistry, Genetics and Molecular Biology › Molecular Biology › Ubiquitin and proteasome pathways
- Keywords
- mitophagy, Parkin, mitofusins, Mfn1, mitofusin 2, proteasome, VCP, AAA+ ATPase, mitochondrial fusion, mitochondrial fission, Drp1, mitochondrial depolarization, ubiquitination, selective autophagy, Parkinson's disease, ubiquitin-proteasome system
- MeSH terms
- PTEN-Induced Putative Kinase, Adenosine Triphosphatases, Animals, Autophagy, Carbonyl Cyanide m-Chlorophenyl Hydrazone, Fibroblasts, HeLa Cells, Humans, Leupeptins, Membrane Fusion, Membrane Proteins, Microtubule-Associated Proteins, Mitochondria, Models, Biological, Nuclear Proteins, Protein Binding, Protein Kinases, Mice, Knockout, GTP Phosphohydrolases, Mitochondrial Proteins, Membrane Transport Proteins, Mitochondrial Membrane Transport Proteins, Dynamins, RNA, Small Interfering, Ubiquitin-Conjugating Enzymes, Ubiquitin-Protein Ligases, HCT116 Cells, Cell Line, Tumor, Proteasome Endopeptidase Complex, Mice, Membrane Potential, Mitochondrial, Ubiquitination, Proteasome Inhibitors
About these checks
Registry, retraction, Cites and statistics results are computed, not judged, with one exception: a printed reference that no index lists is read once by a model before it counts as a citation error. Claims are extracted by a model and kept only when their quote appears verbatim in the text; each cited source is then checked, with a model’s help, for whether it says what the claim relies on. Those verdicts can be wrong — read the claim’s quote and the cited source before relying on one.
Statistics and arithmetic are recomputed, not judged.
Confidence bands are shown only for fields calibrated on our annotated test set. None is calibrated yet, so no band is shown.
What counts as a claim ›How we measure confidence ›How we check this ›
Are you an author, or do you see a problem with this page? Request a review
