

The DOI matches its Crossref record; 77 of the 77 references it cites were found in a registry or an index.
Inefficient clearance of myelin debris by microglia impairs remyelinating processes
Open accessAbstract
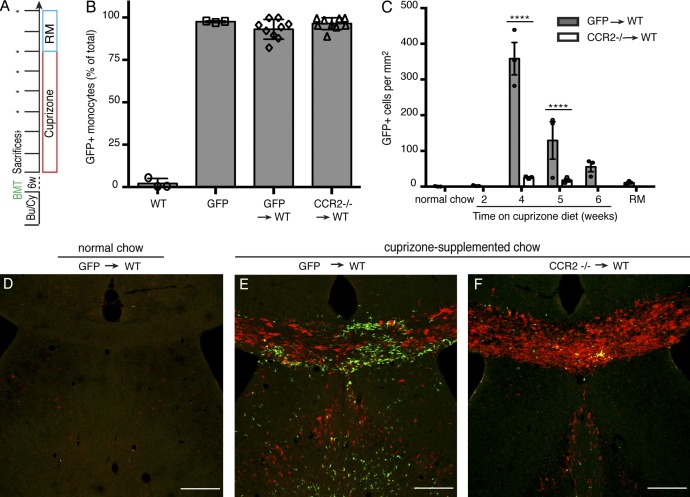
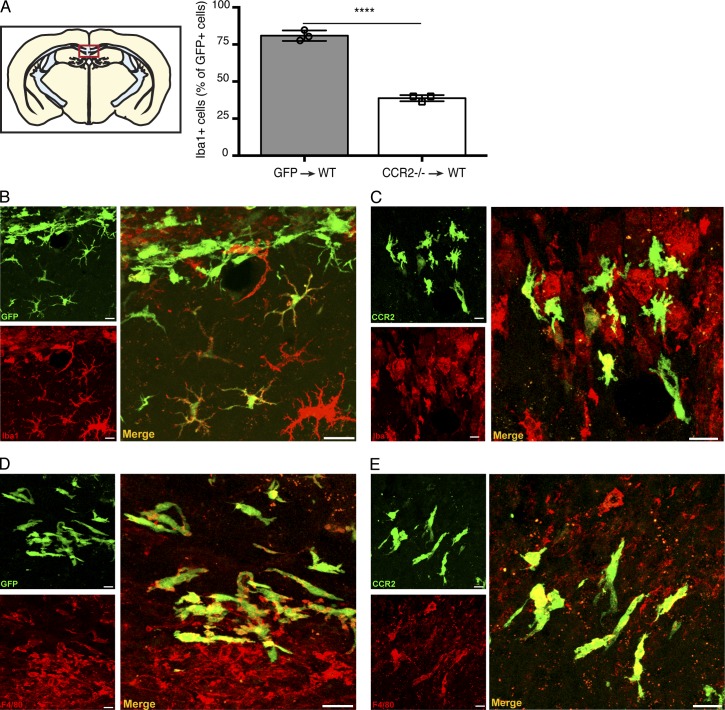
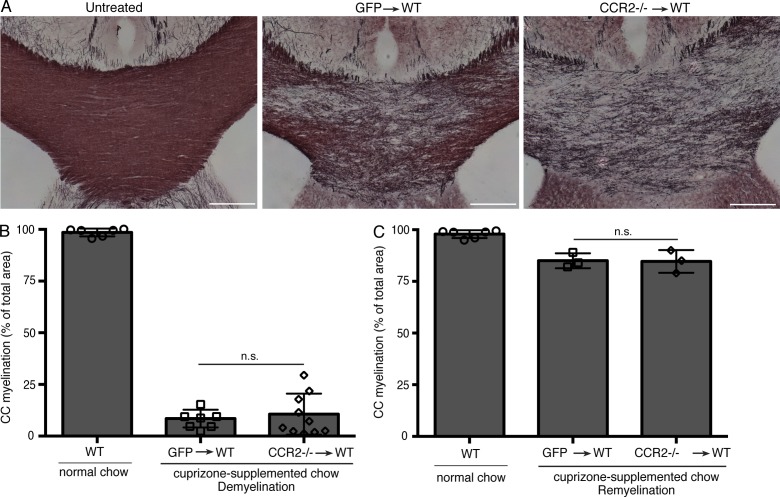
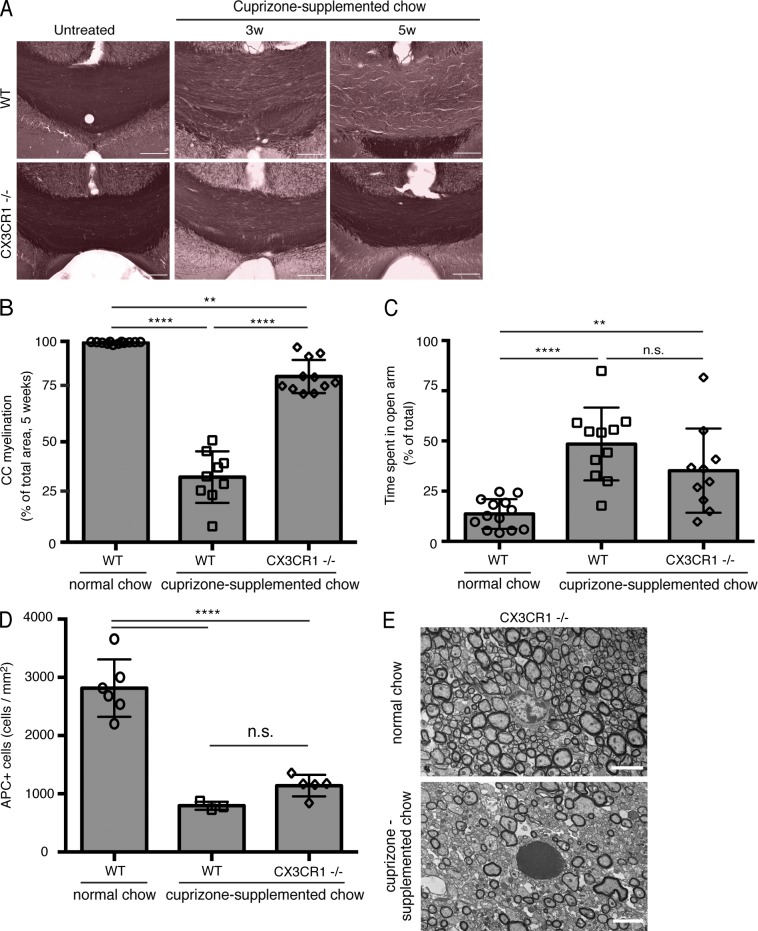
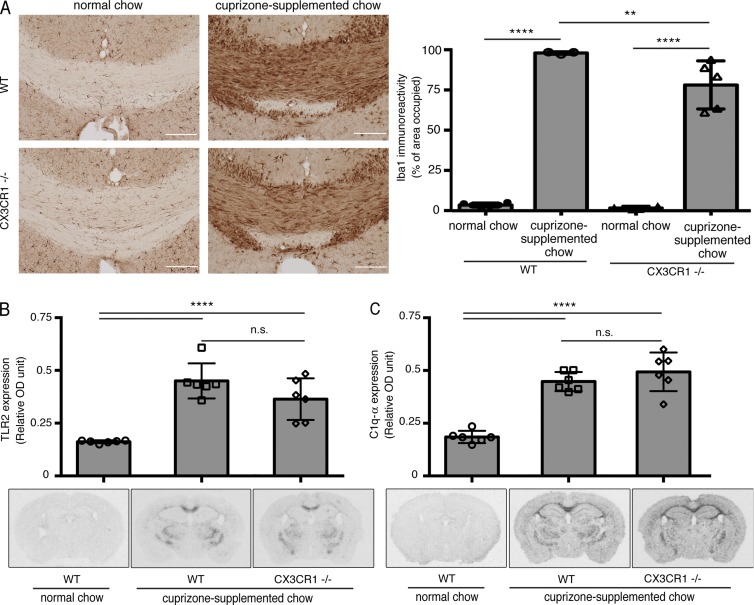
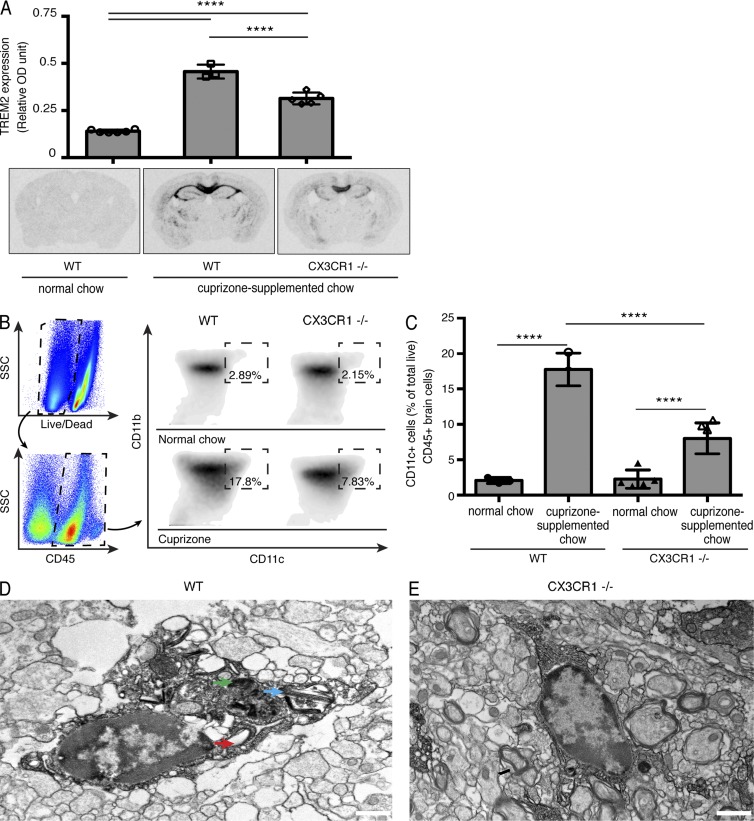
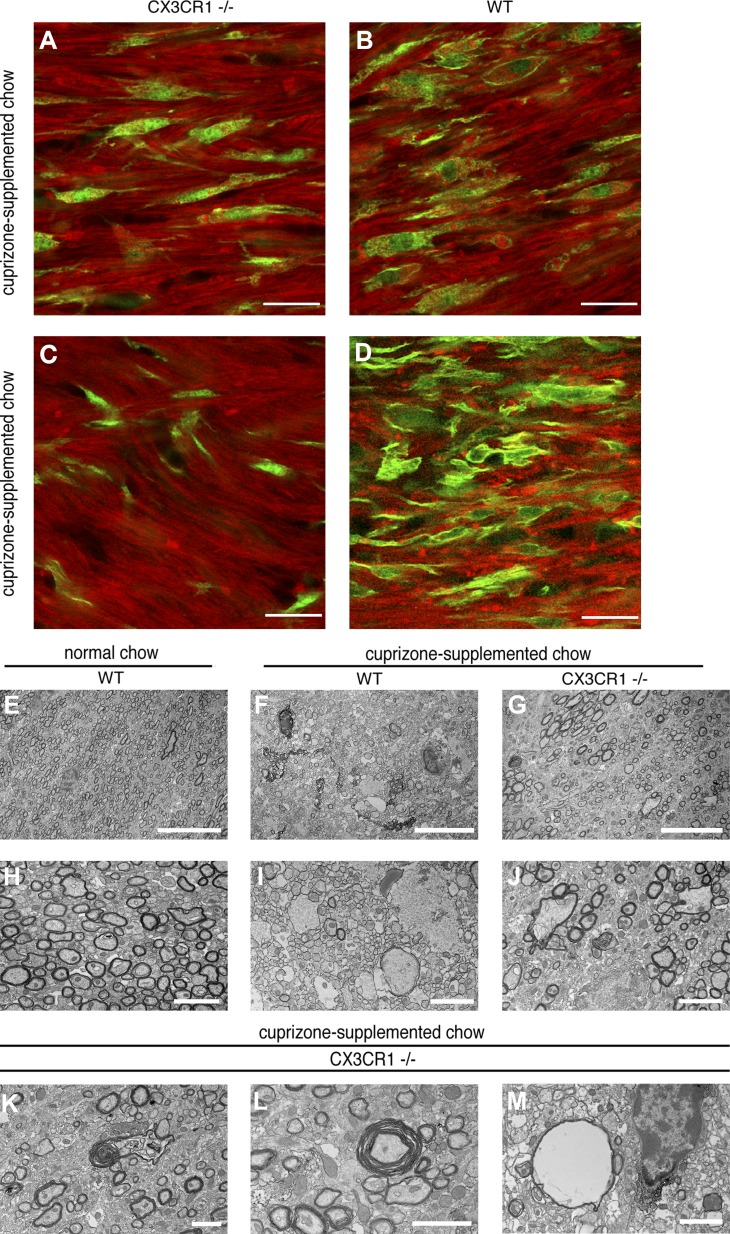
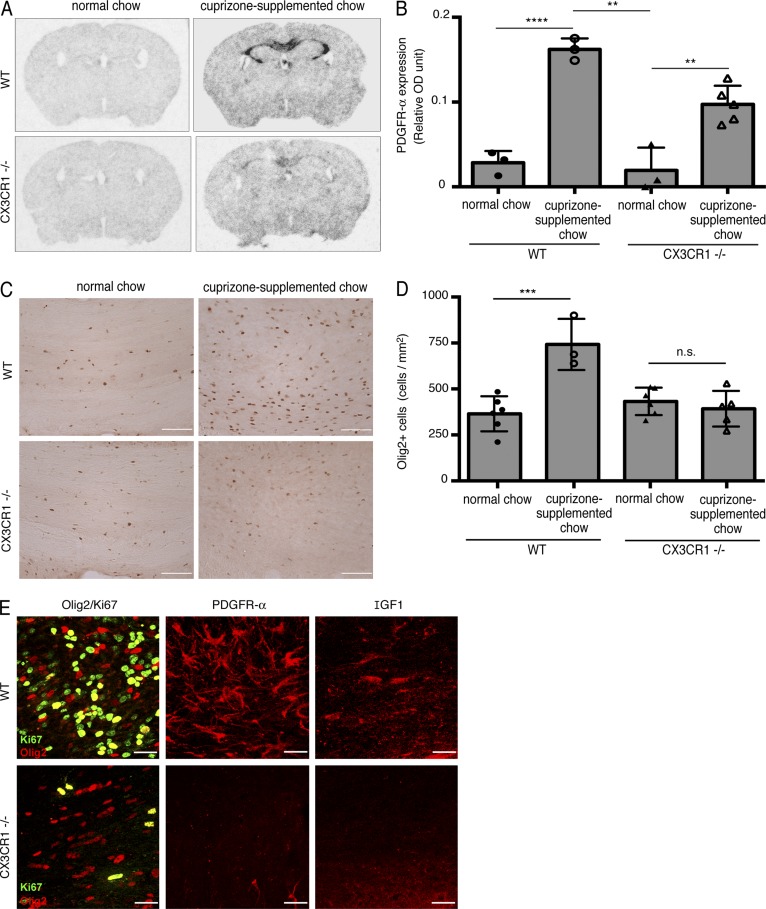
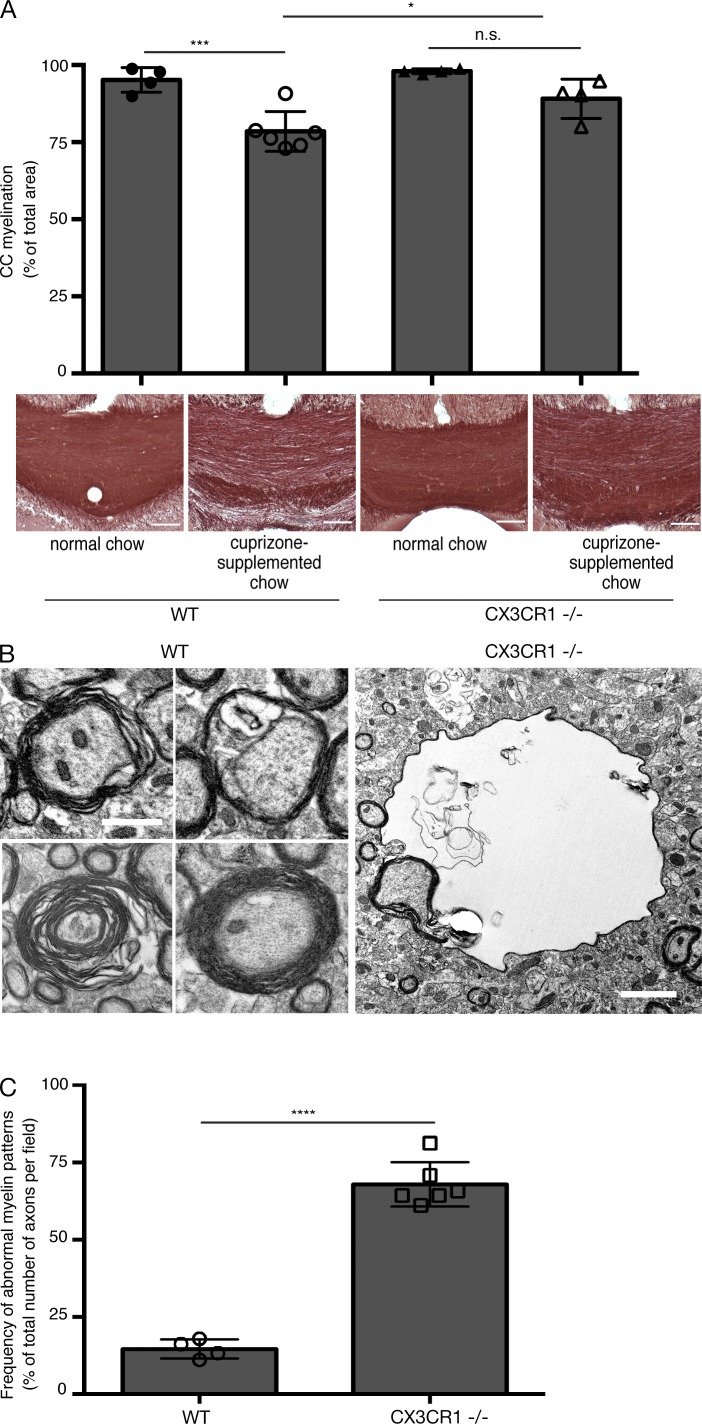
An imbalance between remyelinating and demyelinating rates underlies degenerative processes in demyelinating diseases such as multiple sclerosis. An optimal therapeutic strategy would be to stimulate remyelination while limiting demyelination. Although accumulation of myelin debris impairs remyelination, the mechanisms regulating the clearance of such debris by mononuclear phagocytic cells are poorly understood. We demonstrate that after cuprizone intoxication, CCR2-dependent infiltration of mouse bone marrow-derived cells is abundant in demyelinating areas, but that these cells do not impact demyelination. However, in CX3CR1-deficient mice, the clearance of myelin debris by microglia was blocked greatly, affecting the integrity of the axon and myelin sheaths and thus preventing proper remyelination. These results highlight the crucial role played by CX3CR1 in myelin removal and show that there can be no efficient remyelination after a primary demyelinating insult if myelin clearance by microglia is impaired.
Overview
The claims and statistics of this paper haven’t been checked yet.
Run the check — free, no account needed. It reads the open-access text and checks the sources it cites.
Integrity signals
Registry
Cites
Statistics
Figures
Verification
Claims the paper makes
The claims and statistics of this paper haven’t been checked yet.
Run the check — free, no account needed. It reads the open-access text and checks the sources it cites.
Claims other papers make about this one
Each is checked against this paper’s own text: does it say what the citing paper says it does?
The source backs part of the claim, not all of it — or backs it for a different population, condition or comparison.
In the citing paper
“Mounting evidence suggests that microglia, which are the professional phagocytes of the CNS, are critically involved in ensuring the proper containment and removal of neurotoxic material in neurodegenerative disease pathogenesis (Condello et al., 2015; Hickman et al., 2018; Lampron et al., 2015).”
From SYK coordinates neuroprotective microglial responses in neurodegenerative disease (2022) · cites this paper as Lampron et al., 2015
Experimental — accuracy not yet measuredThe source backs part of the claim, not all of it — or backs it for a different population, condition or comparison.
In the citing paper
“Cessation of cuprizone leads to subsequent remyelination, and clearance of myelin debris is believed to be crucial for remyelination and recovery [5,6].”
From Multifaceted response of microglia in the cuprizone model of demyelination (2026) · cites this paper as [5]
Experimental — accuracy not yet measuredThe source backs part of the claim, not all of it — or backs it for a different population, condition or comparison.
In the citing paper
“Microglia also clear myelin debris, and secrete trophic factors to promote oligodendrocyte growth and survival [5,11,12].”
From Multifaceted response of microglia in the cuprizone model of demyelination (2026) · cites this paper as [5]
Experimental — accuracy not yet measuredThe source backs part of the claim, not all of it — or backs it for a different population, condition or comparison.
In the citing paper
“indicating that microglial clearance of myelin debris continues following cuprizone withdrawal, as reported in previous studies [3,5].”
From Multifaceted response of microglia in the cuprizone model of demyelination (2026) · cites this paper as [5]
Experimental — accuracy not yet measuredThe source backs part of the claim, not all of it — or backs it for a different population, condition or comparison.
In the citing paper
“Accumulation of debris within lesions has been demonstrated to inhibit oligodendrocyte recruitment and differentiation (18, 41, 44) and, thus, delay recovery/remyelination.”
From Microglia depletion exacerbates demyelination and impairs remyelination in a neurotropic coronavirus infection (2020) · cites this paper as [44]
Experimental — accuracy not yet measured
The source backs part of the claim, not all of it — or backs it for a different population, condition or comparison.
In the citing paper
“Long-term demyelination occurs post-SCI, with lipid-containing myelin debris being absorbed and processed by inflammatory cells, including microglia—a process crucial for paving the way for regenerative reactions and inflammation resolution [9–11].”
From miR-223 accelerates lipid droplets clearance in microglia following spinal cord injury by upregulating ABCA1 (2024) · cites this paper as [10]
Experimental — accuracy not yet measuredThe cited source says what the claim attributes to it.
In the citing paper
“Efficient myelin debris removal and clearance by phagocytic cells are critical to eliminate inhibitory signals interfering with OPC activation, recruitment to the site of demyelination and/or differentiation into myelinating mature OLs [14, 26, 27].”
From TREM2 activation on microglia promotes myelin debris clearance and remyelination in a model of multiple sclerosis (2020) · cites this paper as [27]
The cited source says what the claim attributes to it.
In the citing paper
“Recruited cell populations included monocytes and lymphocytes.”
From Cuprizone‐induced demyelination triggers a CD8‐pronounced T cell recruitment (2021) · cites this paper as Lampron et al., 2015
The cited source says what the claim attributes to it.
In the citing paper
“In line with our observation, Lampron and colleagues demonstrated a significant infiltration of transplanted GFP-expressing bone-marrow cells into the CNS, with a peak of infiltration at weeks 4 and 5 of intoxication (Lampron et al., 2015).”
From Cuprizone‐induced demyelination triggers a CD8‐pronounced T cell recruitment (2021) · cites this paper as Lampron et al., 2015
The cited source says what the claim attributes to it.
In the citing paper
“When CCR2 -/-instead of CCR2 +/+ bone-marrow cells were transplanted, infiltration into the CNS was almost completely blocked without affecting the extent of cuprizoneinduced demyelination.”
From Cuprizone‐induced demyelination triggers a CD8‐pronounced T cell recruitment (2021) · cites this paper as Lampron et al., 2015
In the citing paper
“Activated microglia within the demyelinating areas of CPZ lesions express various cytokines, chemokines and growth factors (21, 22), and inefficient clearance of myelin debris by microglia impairs remyelinating processes in the CPZ model (23).”
From Absence of miRNA-146a Differentially Alters Microglia Function and Proteome (2020) · cites this paper as [23]
In the citing paper
“Thus, removal of myelin debris by microglia is important for oligodendrocyte proliferation and stimulation of remyelination, which can be achieved with a neuroprotective microglial phenotype (Lampron et al. 2015).”
From MiR-124 and MiR-155 as Therapeutic Targets in Microglia-Mediated Inflammation in Multiple Sclerosis (2025) · cites this paper as Lampron et al. 2015
Self-check
Percentages, sums and reported differences re-computed from the paper’s own numbers.
The self-check needs the paper’s full text.
Citations
Cites
NIH Image to ImageJ: 25 years of image analysis
Schneider, C. A., Rasband, W. S., & Eliceiri, K. W. (2012) · Nature Methods · doi:10.1038/nmeth.2089 · Cited by 64,638
Fate Mapping Analysis Reveals That Adult Microglia Derive from Primitive Macrophages
Ginhoux, F., Greter, M., Leboeuf, M., Nandi, S., See, P., Gokhan, S., Mehler, M. F., Conway, S. J., Ng, L. G., Stanley, E. R., et al. (2010) · Science · doi:10.1126/science.1194637 · Cited by 5,175
New Multiple Sclerosis Phenotypic Classification
LUBLIN, F. D. (2014) · European Neurology · doi:10.1159/000367614 · Cited by 4,277
Axonal transection in the lesions of multiple sclerosis
Trapp, B. D., Peterson, J., Ransohoff, R. M., Rudick, R., Mörk, S., & Bö, L. (1998) · New England Journal of Medicine · doi:10.1056/nejm199801293380502 · Cited by 4,029
Defining the clinical course of multiple sclerosis
LUBLIN, F. D., & Reingold, S. C. (1996) · Neurology · doi:10.1212/wnl.46.4.907 · Cited by 3,762
Defining the clinical course of multiple sclerosis: The 2013 revisions
Lublin, F. D., Reingold, S. C., Cohen, J. A., Cutter, G. R., Sørensen, P. S., Thompson, A. J., Wolinsky, J. S., Balcer, L. J., Banwell, B., Barkhof, F., et al. (2014) · Neurology · doi:10.1212/wnl.0000000000000560 · Cited by 3,177
Development of Monocytes, Macrophages, and Dendritic Cells
Geissmann, F., Manz, M. G., Jung, S., Sieweke, M. H., Merad, M., & Ley, K. (2010) · Science · doi:10.1126/science.1178331 · Cited by 3,049
The use of the elevated plus maze as an assay of anxiety-related behavior in rodents
Walf, A. A., & Frye, C. A. (2007) · Nature Protocols · doi:10.1038/nprot.2007.44 · Cited by 3,035
The use of a plus-maze to measure anxiety in the mouse
Lister, R. G. (1987) · Psychopharmacology · doi:10.1007/bf00177912 · Cited by 2,617
A Lineage of Myeloid Cells Independent of Myb and Hematopoietic Stem Cells
Schulz, C., Perdiguero, E. G., Chorro, L., Szabo-Rogers, H., Cagnard, N., Kierdorf, K., Prinz, M., Wu, B., Jacobsen, S. E. W., Pollard, J. W., et al. (2012) · Science · doi:10.1126/science.1219179 · Cited by 2,578
Cited by
Sorted by citations
Functions and mechanisms of microglia/macrophages in neuroinflammation and neurogenesis after stroke
Xiong, X., Liu, L., & Yang, Q. (2016) · Progress in Neurobiology · doi:10.1016/j.pneurobio.2016.05.001 · Cited by 713
Regenerating CNS myelin — from mechanisms to experimental medicines
Franklin, R. J. M., & ffrench-Constant, C. (2017) · Nature Reviews Neuroscience · doi:10.1038/nrn.2017.136 · Cited by 647
Microglia in Central Nervous System Inflammation and Multiple Sclerosis Pathology
Voet, S., Prinz, M., & van Loo, G. (2019) · Trends in Molecular Medicine · doi:10.1016/j.molmed.2018.11.005 · Cited by 503
Oligodendrocyte, Astrocyte, and Microglia Crosstalk in Myelin Development, Damage, and Repair
Domingues, H. S., Portugal, C. C., Socodato, R., & Relvas, J. B. (2016) · Frontiers in Cell and Developmental Biology · doi:10.3389/fcell.2016.00071 · Cited by 460
van der Knaap, M. S., & Bugiani, M. (2017) · Acta Neuropathologica · doi:10.1007/s00401-017-1739-1 · Cited by 403
Cignarella, F., Filipello, F., Bollman, B., Cantoni, C., Locca, A., Mikesell, R., Manis, M., Ibrahim, A., Deng, L., Benitez, B. A., et al. (2020) · Acta Neuropathologica · doi:10.1007/s00401-020-02193-z · Cited by 392
The pro-remyelination properties of microglia in the central nervous system
Lloyd, A. F., & Miron, V. E. (2019) · Nature Reviews Neurology · doi:10.1038/s41582-019-0184-2 · Cited by 381
Inflammatory neuroprotection following traumatic brain injury
Russo, M. V., & McGavern, D. B. (2016) · Science · doi:10.1126/science.aaf6260 · Cited by 389
Yan, Z., Gibson, S. A., Buckley, J. A., Qin, H., & Benveniste, E. N. (2018) · Clinical Immunology · doi:10.1016/j.clim.2016.09.014 · Cited by 318
SYK coordinates neuroprotective microglial responses in neurodegenerative disease
Ennerfelt, H., Frost, E. L., Shapiro, D. A., Holliday, C., Zengeler, K. E., Voithofer, G., Bolte, A. C., Lammert, C. R., Kulas, J. A., Ulland, T. K., et al. (2022) · Cell · doi:10.1016/j.cell.2022.09.030 · Cited by 297
The identity and function of microglia in neurodegeneration
Song, W. M., & Colonna, M. (2018) · Nature Immunology · doi:10.1038/s41590-018-0212-1 · Cited by 308
Microglia facilitate repair of demyelinated lesions via post-squalene sterol synthesis
Berghoff, S. A., Spieth, L., Sun, T., Hosang, L., Schlaphoff, L., Depp, C., Düking, T., Winchenbach, J., Neuber, J., Ewers, D., et al. (2021) · Nature Neuroscience · doi:10.1038/s41593-020-00757-6 · Cited by 307
Microglial TREM2/DAP12 signaling: a double-edged sword in neural diseases
Konishi, H., & Kiyama, H. (2018) · Frontiers in Cellular Neuroscience · doi:10.3389/fncel.2018.00206 · Cited by 300
van der Poel, M., Ulas, T., Mizee, M. R., Hsiao, C.-C., Miedema, S. S. M., Adelia, Schuurman, K. G., Helder, B., Tas, S. W., Schultze, J. L., et al. (2019) · Nature Communications · doi:10.1038/s41467-019-08976-7 · Cited by 306
Neurosteroids as regulators of neuroinflammation
Yılmaz, C., Karali, K., Fodelianaki, G., Gravanis, A., Chavakis, T., Charalampopoulos, I., & Alexaki, V. I. (2019) · Frontiers in Neuroendocrinology · doi:10.1016/j.yfrne.2019.100788 · Cited by 261
Zirngibl, M., Assinck, P., Sizov, A., Caprariello, A. V., & Plemel, J. R. (2022) · Molecular Neurodegeneration · doi:10.1186/s13024-022-00538-8 · Cited by 233
Myelin damage and repair in pathologic CNS: challenges and prospects
Alizadeh, A., Dyck, S. M., & Karimi‐Abdolrezaee, S. (2015) · Frontiers in Molecular Neuroscience · doi:10.3389/fnmol.2015.00035 · Cited by 246
Natrajan, M. S., de la Fuente, A. G., Crawford, A. H., Linehan, E., Núñez, V., Johnson, K. R., Wu, T., Fitzgerald, D. C., Ricote, M., Bielekova, B., et al. (2015) · Brain · doi:10.1093/brain/awv289 · Cited by 225
Transcriptional and epigenetic decoding of the microglial aging process
Li, X., Li, Y., Jin, Y., Zhang, Y., Wu, J., Xu, Z., Huang, Y., Cai, L., Gao, S., Liu, T., et al. (2023) · Nature Aging · doi:10.1038/s43587-023-00479-x · Cited by 234
White matter degeneration in vascular and other ageing‐related dementias
Hase, Y., Horsburgh, K. J., Ihara, M., & Kalaria, R. N. (2017) · Journal of Neurochemistry · doi:10.1111/jnc.14271 · Cited by 214
Phagocytic microglia and macrophages in brain injury and repair
Yu, F., Wang, Y., Stetler, R. A., Leak, R. K., Hu, X., & Chen, J. (2022) · CNS Neuroscience & Therapeutics · doi:10.1111/cns.13899 · Cited by 213
The role of microglia in multiple sclerosis
Luo, C., Jian, C., Liao, Y., Huang, Q., Wu, Y., Liu, X., Zou, D., & Wu, Y. (2017) · Neuropsychiatric Disease and Treatment · doi:10.2147/ndt.s140634 · Cited by 187
Ferroptosis Mediates Cuprizone-Induced Loss of Oligodendrocytes and Demyelination
Jhelum, P., Santos-Nogueira, E., Teo, W., Haumont, A., Lenoël, I., Stys, P. K., & David, S. (2020) · The Journal of Neuroscience · doi:10.1523/jneurosci.1749-20.2020 · Cited by 214
Nemes-Baran, A. D., White, D. R., & DeSilva, T. M. (2020) · Cell Reports · doi:10.1016/j.celrep.2020.108047 · Cited by 196
P2X4 receptor controls microglia activation and favors remyelination in autoimmune encephalitis
Zabala, A., Vazquez‐Villoldo, N., Rissiek, B., Gejo, J., Martin, A., Palomino, A., Perez‐Samartín, A., Pulagam, K. R., Lukowiak, M., Capetillo‐Zarate, E., et al. (2018) · EMBO Molecular Medicine · doi:10.15252/emmm.201708743 · Cited by 192
Neuroimmune Crosstalk through Extracellular Vesicles in Health and Disease
Delpech, J.-C., Herron, S., Botros, M. B., & Ikezu, T. (2019) · Trends in Neurosciences · doi:10.1016/j.tins.2019.02.007 · Cited by 193
Immune Surveillance of the CNS following Infection and Injury
Russo, M. V., & McGavern, D. B. (2015) · Trends in Immunology · doi:10.1016/j.it.2015.08.002 · Cited by 191
“Using this model, it was demonstrated that CCR2 monocytes had no effect on the demyelination or remyelination process [63].”
Astrocytes and Microglia as Major Players of Myelin Production in Normal and Pathological Conditions
Traiffort, É., Kassoussi, A., Zahaf, A., & Laouarem, Y. (2020) · Frontiers in Cellular Neuroscience · doi:10.3389/fncel.2020.00079 · Cited by 202
TREM2-dependent lipid droplet biogenesis in phagocytes is required for remyelination
Gouna, G., Klose, C., Bosch-Queralt, M., Liu, L., Gokce, O., Schifferer, M., Cantuti-Castelvetri, L., & Simons, M. (2021) · Journal of Experimental Medicine · doi:10.1084/jem.20210227 · Cited by 186
Microglia in multiple sclerosis: protectors turn destroyers
Yong, V. W. (2022) · Neuron · doi:10.1016/j.neuron.2022.06.023 · Cited by 185
Self-citationMicroglia Are Irrelevant for Neuronal Degeneration and Axon Regeneration after Acute Injury
Hilla, A. M., Diekmann, H., & Fischer, D. (2017) · Journal of Neuroscience · doi:10.1523/jneurosci.0584-17.2017 · Cited by 176
Animal models of multiple sclerosis: Focus on experimental autoimmune encephalomyelitis
Bjelobaba, I. M., Begović-Kuprešanin, V., Peković, S., & Lavrnja, I. C. (2018) · Journal of Neuroscience Research · doi:10.1002/jnr.24224 · Cited by 197
CD36-mediated uptake of myelin debris by macrophages and microglia reduces neuroinflammation
Grajchen, E., Wouters, E., van de Haterd, B., Haidar, M., Hardonnière, K., Dierckx, T., Broeckhoven, J. V., Erens, C., Hendrix, S., Kerdine‐Römer, S., et al. (2020) · Journal of Neuroinflammation · doi:10.1186/s12974-020-01899-x · Cited by 194
Galectin-3, a rising star in modulating microglia activation under conditions of neurodegeneration
García-Revilla, J., Boza-Serrano, A., Espinosa-Oliva, A. M., Soto, M. S., Deierborg, T., Ruiz, R., de Pablos, R. M., Burguillos, M. A., & Venero, J. L. (2022) · Cell Death & Disease · doi:10.1038/s41419-022-05058-3 · Cited by 156
Inflammation and Oxidative Stress in Multiple Sclerosis: Consequences for Therapy Development
Pegoretti, V., Swanson, K. A., Bethea, J. R., Probert, L., Eisel, U. L. M., & Fischer, R. (2020) · Oxidative Medicine and Cellular Longevity · doi:10.1155/2020/7191080 · Cited by 187
CNS remyelination and inflammation: From basic mechanisms to therapeutic opportunities
Franklin, R. J. M., & Simons, M. (2022) · Neuron · doi:10.1016/j.neuron.2022.09.023 · Cited by 184
Mechanisms underlying progression in multiple sclerosis
Absinta, M., Lassmann, H., & Trapp, B. D. (2020) · Current Opinion in Neurology · doi:10.1097/wco.0000000000000818 · Cited by 175
Mammana, S., Fagone, P., Cavalli, E., Basile, M. S., Petralia, M. C., Nicoletti, F., Bramanti, P., & Mazzon, E. (2018) · International Journal of Molecular Sciences · doi:10.3390/ijms19030831 · Cited by 171
Sen, T., Saha, P., Gupta, R. K., Foley, L. M., Jiang, T., Abakumova, O. S., Hitchens, T. K., & Sen, N. (2019) · Journal of Neuroscience · doi:10.1523/jneurosci.0718-19.2019 · Cited by 168
Microglia plasticity during health and disease: An immunological perspective
Shemer, A., Erny, D., Jung, S., & Prinz, M. (2015) · Trends in Immunology · doi:10.1016/j.it.2015.08.003 · Cited by 168
Sen, M. K., Mahns, D. A., Coorssen, J. R., & Shortland, P. J. (2022) · Glia · doi:10.1002/glia.24148 · Cited by 172
Dysfunction of Cerebrovascular Endothelial Cells: Prelude to Vascular Dementia
Wang, F., Cao, Y., Ma, L., Pei, H., Rausch, W., & Li, H. (2018) · Frontiers in Aging Neuroscience · doi:10.3389/fnagi.2018.00376 · Cited by 163
Microglial autophagy–associated phagocytosis is essential for recovery from neuroinflammation
Berglund, R., Guerreiro-Cacais, A. O., Adzemovic, M. Z., Zeitelhofer, M., Lund, H., Ewing, E., Ruhrmann, S., Nutma, E., Parsa, R., Thessen-Hedreul, M., et al. (2020) · Science Immunology · doi:10.1126/sciimmunol.abb5077 · Cited by 149
Activated microglia drive demyelination via CSF1R signaling
Marzan, D. E., Brügger‐Verdon, V., West, B. L., Liddelow, S., Samanta, J., & Salzer, J. L. (2021) · Glia · doi:10.1002/glia.23980 · Cited by 147
“These results differ from previous studies that reported modest (McMahon, Suzuki, & Matsushima, 2002) or significant (Lampron et al., 2015) numbers of macrophages in the CUP model; in the latter case, peripheral macrophage infiltration was CCR2-dependent but did not impact the extent of…”
ResultThe physiology of foamy phagocytes in multiple sclerosis
Grajchen, E., Hendriks, J. J. A., & Bogie, J. F. J. (2018) · Acta Neuropathologica Communications · doi:10.1186/s40478-018-0628-8 · Cited by 160
Local cholesterol metabolism orchestrates remyelination
Berghoff, S. A., Spieth, L., & Saher, G. (2022) · Trends in Neurosciences · doi:10.1016/j.tins.2022.01.001 · Cited by 145
TNF Production and Release from Microglia via Extracellular Vesicles: Impact on Brain Functions
Raffaele, S., Lombardi, M., Verderio, C., & Fumagalli, M. (2020) · Cells · doi:10.3390/cells9102145 · Cited by 147
Promise and pitfalls of g-ratio estimation with MRI
Campbell, J. S. W., Leppert, I. R., Narayanan, S., Boudreau, M., Duval, T., Cohen-Adad, J., Pike, G. B., & Stikov, N. (2018) · NeuroImage · doi:10.1016/j.neuroimage.2017.08.038 · Cited by 129
Microglia-driven regulation of oligodendrocyte lineage cells, myelination, and remyelination
Miron, V. E. (2017) · Journal of Leukocyte Biology · doi:10.1189/jlb.3ri1116-494r · Cited by 134
Beckmann, N., Giorgetti, E., Neuhaus, A., Zurbruegg, S., Accart, N., Smith, P., Perdoux, J., Perrot, L., Nash, M., Desrayaud, S., et al. (2018) · Acta Neuropathologica Communications · doi:10.1186/s40478-018-0510-8 · Cited by 131
Shen, K., Reichelt, M., Kyauk, R. V., Ngu, H., Shen, Y.-A. A., Foreman, O., Modrusan, Z., Friedman, B. A., Sheng, M., & Yuen, T. J. (2021) · Cell Reports · doi:10.1016/j.celrep.2021.108835 · Cited by 138
Microglial phagocytosis in aging and Alzheimer's disease
Gabandé‐Rodríguez, E., Keane, L., & Capasso, M. (2020) · Journal of Neuroscience Research · doi:10.1002/jnr.24419 · Cited by 127
Differential contribution of microglia and monocytes in neurodegenerative diseases
Baufeld, C., O'Loughlin, E. K., Calcagno, N., Madore, C., & Butovsky, O. (2017) · Journal of Neural Transmission · doi:10.1007/s00702-017-1795-7 · Cited by 128
Shobin, E., Bowley, M. P., Estrada, L. I., Heyworth, N. C., Orczykowski, M. E., Eldridge, S. A., Calderazzo, S. M., Mortazavi, F., Moore, T. L., & Rosene, D. L. (2017) · GeroScience · doi:10.1007/s11357-017-9965-y · Cited by 126
Kremer, D., Gruchot, J., Weyers, V., Oldemeier, L., Göttle, P., Healy, L. M., Jang, J. H., Xu, Y. K. T., Volsko, C. M., Dutta, R., et al. (2019) · Proceedings of the National Academy of Sciences · doi:10.1073/pnas.1901283116 · Cited by 121
Maleki, A. F., & Rivest, S. (2019) · Frontiers in Cellular Neuroscience · doi:10.3389/fncel.2019.00355 · Cited by 120
Wolf, Y., Shemer, A., Levy‐Efrati, L., Gross, M., Kim, J., Engel, A., David, E., Chappell‐Maor, L., Grozovski, J., Rotkopf, R., et al. (2018) · European Journal of Immunology · doi:10.1002/eji.201847540 · Cited by 129
Dual roles of the adenosine A2a receptor in autoimmune neuroinflammation
Ingwersen, J., Wingerath, B., Graf, J., Lepka, K., Hofrichter, M., Schröter, F., Wedekind, F., Bauer, A., Schrader, J., Hartung, H. ‐., et al. (2016) · Journal of Neuroinflammation · doi:10.1186/s12974-016-0512-z · Cited by 115
The Phagocytic Code Regulating Phagocytosis of Mammalian Cells
Cockram, T. O. J., Dundee, J. M., Popescu, A. S., & Brown, G. C. (2021) · Frontiers in Immunology · doi:10.3389/fimmu.2021.629979 · Cited by 117
Roles and regulation of microglia activity in multiple sclerosis: insights from animal models
Distéfano‐Gagné, F., Bitarafan, S., Lacroix, S., & Gosselin, D. (2023) · Nature reviews. Neuroscience · doi:10.1038/s41583-023-00709-6 · Cited by 115
Microglial Dysregulation in OCD, Tourette Syndrome, and PANDAS
Frick, L. R., & Pittenger, C. (2016) · Journal of Immunology Research · doi:10.1155/2016/8606057 · Cited by 114
Brain Ultrastructure: Putting the Pieces Together
Nahirney, P. C., & Tremblay, M. (2021) · Frontiers in Cell and Developmental Biology · doi:10.3389/fcell.2021.629503 · Cited by 111
The Molecular Basis for Remyelination Failure in Multiple Sclerosis
Gruchot, J., Weyers, V., Göttle, P., Förster, M., Hartung, H., Küry, P., & Kremer, D. (2019) · Cells · doi:10.3390/cells8080825 · Cited by 117
Neuronal integrity and complement control synaptic material clearance by microglia after CNS injury
Norris, G. T., Smirnov, I., Filiano, A. J., Shadowen, H. M., Cody, K. R., Thompson, J. A., Harris, T. H., Gaultier, A., Overall, C. C., & Kipnis, J. (2018) · Journal of Experimental Medicine · doi:10.1084/jem.20172244 · Cited by 109
Oligodendrocytes in the aging brain
Sams, E. C. (2021) · Neuronal Signaling · doi:10.1042/ns20210008 · Cited by 113
Bar, E., & Barak, B. (2019) · Glia · doi:10.1002/glia.23637 · Cited by 108
Different Approaches to Modulation of Microglia Phenotypes After Spinal Cord Injury
Akhmetzyanova, E. R., Kletenkov, K., Mukhamedshina, Y. O., & Rizvanov, A. A. (2019) · Frontiers in Systems Neuroscience · doi:10.3389/fnsys.2019.00037 · Cited by 110
Microglia and Astrocytes in Alzheimer’s Disease: Significance and Summary of Recent Advances
Deng, Q., Wu, C., Parker, E., Liu, T. C.-Y., Duan, R., & Yang, L. (2023) · Aging and disease · doi:10.14336/ad.2023.0907 · Cited by 102
Behavioural phenotypes in the cuprizone model of central nervous system demyelination
Sen, M. K., Mahns, D. A., Coorssen, J. R., & Shortland, P. J. (2019) · Neuroscience & Biobehavioral Reviews · doi:10.1016/j.neubiorev.2019.08.008 · Cited by 101
Heterogeneity of microglia and their differential roles in white matter pathology
Lee, J. C. L., Hamanaka, G., Lo, E. H., & Arai, K. (2019) · CNS Neuroscience & Therapeutics · doi:10.1111/cns.13266 · Cited by 105
Multiple Sclerosis: Inflammatory and Neuroglial Aspects
Papiri, G., D’Andreamatteo, G., Cacchiò, G., Alia, S., Silvestrini, M., Paci, C., Luzzi, S., & Vignini, A. (2023) · Current Issues in Molecular Biology · doi:10.3390/cimb45020094 · Cited by 107
Long, H., Zhou, Z.-W., Cheng, Y., Luo, H., Li, F., Xu, S., & Gao, L. (2022) · Frontiers in Aging Neuroscience · doi:10.3389/fnagi.2022.888989 · Cited by 100
Gabandé‐Rodríguez, E., Pérez‐Cañamás, A., Soto‐Huelin, B., Mitroi, D. N., Sánchez‐Redondo, S., Martínez-Sáez, E. A., Venero, C., Peinado, H., & Ledesma, M. D. (2018) · The EMBO Journal · doi:10.15252/embj.201899553 · Cited by 98
Bruce, K. D., Gorkhali, S., Given, K., Coates, A. M., Boyle, K. E., Macklin, W. B., & Eckel, R. H. (2018) · Frontiers in Molecular Neuroscience · doi:10.3389/fnmol.2018.00057 · Cited by 94
Thompson, K. K., & Tsirka, S. E. (2017) · International Journal of Molecular Sciences · doi:10.3390/ijms18030504 · Cited by 100
Sariol, A., Mackin, S., Allred, M.-G., Ma, C., Zhou, Y., Zhang, Q., Zou, X., Abrahante, J. E., Meyerholz, D. K., & Perlman, S. (2020) · Proceedings of the National Academy of Sciences · doi:10.1073/pnas.2007814117 · Cited by 91
Phagocytic astrocytes: Emerging from the shadows of microglia
Konishi, H., Koizumi, S., & Kiyama, H. (2022) · Glia · doi:10.1002/glia.24145 · Cited by 88
Jiang, T., Zhang, L., Pan, X., Zheng, H., Chen, X., Li, L., Luo, J., & Hu, X. (2017) · Frontiers in Cellular Neuroscience · doi:10.3389/fncel.2017.00404 · Cited by 91
Diet-dependent regulation of TGFβ impairs reparative innate immune responses after demyelination
Bosch-Queralt, M., Cantuti-Castelvetri, L., Damkou, A., Schifferer, M., Schlepckow, K., Alexopoulos, I., Lütjohann, D., Klose, C., Vaculčiaková, L., Masuda, T., et al. (2021) · Nature Metabolism · doi:10.1038/s42255-021-00341-7 · Cited by 88
Montilla, A., Zabala, A., Er-Lukowiak, M., Rissiek, B., Magnus, T. U., Rodríguez-Iglesias, N., Sierra, A., Matute, C., & Domercq, M. (2023) · Cell Death and Disease · doi:10.1038/s41419-023-05551-3 · Cited by 92
Microenvironmental regulation of oligodendrocyte replacement and remyelination in spinal cord injury
Alizadeh, A., & Karimi‐Abdolrezaee, S. (2016) · The Journal of Physiology · doi:10.1113/jp270895 · Cited by 93
Origin and Differentiation of Nerve-Associated Macrophages
Kolter, J., Kierdorf, K., & Henneke, P. (2020) · The Journal of Immunology · doi:10.4049/jimmunol.1901077 · Cited by 91
Guglielmetti, C., Najac, C., Didonna, A., der Linden, A. V., Ronen, S. M., & Chaumeil, M. M. (2017) · Proceedings of the National Academy of Sciences · doi:10.1073/pnas.1613345114 · Cited by 83
Hou, J., Zhou, Y., Cai, Z., Terekhova, M., Swain, A., Andhey, P. S., Guimaraes, R. M., Ulezko Antonova, A., Qiu, T., Sviben, S., et al. (2023) · Cell Reports · doi:10.1016/j.celrep.2023.112293 · Cited by 85
Lipid metabolism, remodelling and intercellular transfer in the CNS
Vanherle, S., Loix, M., Miron, V. E., Hendriks, J. J. A., & Bogie, J. F. J. (2025) · Nature reviews. Neuroscience · doi:10.1038/s41583-025-00908-3 · Cited by 96
Raffaele, S., Boccazzi, M., & Fumagalli, M. (2021) · Cells · doi:10.3390/cells10030565 · Cited by 90
Song, S., Yu, L., Hasan, M. N., Paruchuri, S. S., Mullett, S. J., Sullivan, M. L. G., Fiesler, V. M., Young, C. B., Stolz, D. B., Wendell, S. G., et al. (2022) · Communications Biology · doi:10.1038/s42003-021-02984-4 · Cited by 90
Myelination generates aberrant ultrastructure that is resolved by microglia
Djannatian, M., Radha, S., Weikert, U., Safaiyan, S., Wrede, C., Deichsel, C., Kislinger, G., Rhomberg, A., Ruhwedel, T., Campbell, D. S., et al. (2022) · The Journal of Cell Biology · doi:10.1083/jcb.202204010 · Cited by 102
Microglia: origins, homeostasis, and roles in myelin repair
Lloyd, A. F., Davies, C. L., & Miron, V. E. (2017) · Current Opinion in Neurobiology · doi:10.1016/j.conb.2017.10.001 · Cited by 85
Central Nervous System Remyelination: Roles of Glia and Innate Immune Cells
Baaklini, C. S., Rawji, K. S., Duncan, G. J., Ho, M. F. S., & Plemel, J. R. (2019) · Frontiers in Molecular Neuroscience · doi:10.3389/fnmol.2019.00225 · Cited by 88
Wang, N., Wang, M., Jeevaratnam, S., Rosenberg, C., Ikezu, T. C., Shue, F., Doss, S. V., Alnobani, A., Martens, Y. A., Wren, M., et al. (2022) · Molecular Neurodegeneration · doi:10.1186/s13024-022-00577-1 · Cited by 82
Voronova, A., Yuzwa, S. A., Wang, B. S., Zahr, S. K., Syal, C., Wang, J., Kaplan, D. R., & Miller, F. D. (2017) · Neuron · doi:10.1016/j.neuron.2017.04.018 · Cited by 78
Diversity and Function of Glial Cell Types in Multiple Sclerosis
Schirmer, L., Schafer, D. P., Bartels, T., Rowitch, D. H., & Calabresi, P. A. (2021) · Trends in Immunology · doi:10.1016/j.it.2021.01.005 · Cited by 78
Astrocytes in myelination and remyelination
Molina-González, I., & Miron, V. E. (2019) · Neuroscience Letters · doi:10.1016/j.neulet.2019.134532 · Cited by 83
Guglielmetti, C., Le Blon, D., Santermans, E., Salas-Perdomo, A., Daans, J., De Vocht, N., Shah, D., Hoornaert, C., Praet, J., Peerlings, J., et al. (2016) · Glia · doi:10.1002/glia.23053 · Cited by 76
Galectin-3-Mediated Glial Crosstalk Drives Oligodendrocyte Differentiation and (Re)myelination
Thomas, L., & Pasquini, L. A. (2018) · Frontiers in Cellular Neuroscience · doi:10.3389/fncel.2018.00297 · Cited by 76
Exploring the genetics and non-cell autonomous mechanisms underlying ALS/FTLD
Chen, H., Kankel, M. W., Su, S. C., Han, S., & Ofengeim, D. (2018) · Cell Death and Differentiation · doi:10.1038/s41418-018-0060-4 · Cited by 74
Romanelli, E., Merkler, D., Mężydło, A., Weil, M., Weber, M. S., Nikić, I., Potz, S., Meinl, E., Matznick, F. E. H., Kreutzfeldt, M., et al. (2016) · Nature Communications · doi:10.1038/ncomms13275 · Cited by 75
Tassoni, A., Farkhondeh, V., Itoh, Y., Itoh, N., Sofroniew, M. V., & Voskuhl, R. R. (2019) · Scientific Reports · doi:10.1038/s41598-019-46232-6 · Cited by 73
Microglial diversity in neuropathic pain
Tsuda, M., Masuda, T., & Kohno, K. (2023) · Trends in Neurosciences · doi:10.1016/j.tins.2023.05.001 · Cited by 81
Metadata
- Authors
- Lampron, A., Larochelle, A., Laflamme, N., Préfontaine, P., Plante, M.-M., Sánchez, M. G., Yong, V. W., Stys, P. K., Tremblay, M.-È., & Rivest, S.
- Affiliations
- Université Laval (CA)
- University of Calgary (CA)
- Corresponding author
- Rivest, Serge
- ORCID
- Venue
- Journal of Experimental Medicine
- Publisher
- Rockefeller University Press
- Published
- 2015-03-16
- Volume
- 212
- Issue
- 4
- Pages
- 481-495
- ISSN
- 0022-1007 (ISSN-L)
- 1540-9538
- PMC
- PMC4387282
- OpenAlex
- W2096423240
- Cited by
- 595
- References
- 77
- Citations by year
- 2026: 45 · 2025: 42 · 2024: 46 · 2023: 78 · 2022: 86 · 2021: 55 · 2020: 60 · 2019: 61 · 2018: 44 · 2017: 38 · 2016: 29 · 2015: 11
- FWCI
- 32.27
- Type
- journal article
- Language
- en
- Open access
- green
- www.ncbi.nlm.nih.gov
- Licence
- cc-by-nc-sa
- Locations
- The Journal of Experimental Medicine (publishedVersion)
- Europe PMC (PubMed Central) (publishedVersion, cc-by-nc-sa)
- PubMed Central (publishedVersion, cc-by-nc-sa)
- PubMed (publishedVersion)
- Funders
- Canadian Institutes of Health Research
- Topics
- Health Sciences › Medicine › Clinical Neurology › Multiple Sclerosis Research Studies
- Life Sciences › Neuroscience › Neurology › Neuroinflammation and Neurodegeneration Mechanisms
- Life Sciences › Neuroscience › Developmental Neuroscience › Neurogenesis and neuroplasticity mechanisms
- Keywords
- remyelination, myelin debris clearance, microglia, CX3CR1, CCR2, demyelination, multiple sclerosis, cuprizone, bone marrow-derived cells, axon integrity
- MeSH terms
- CX3C Chemokine Receptor 1, Animals, Axons, Bone Marrow Cells, Demyelinating Diseases, Myelin Sheath, Phagocytes, Microglia, Mice, Knockout, Receptors, Chemokine, Mice, Receptors, CCR2
About these checks
Registry, retraction, Cites and statistics results are computed, not judged, with one exception: a printed reference that no index lists is read once by a model before it counts as a citation error. Claims are extracted by a model and kept only when their quote appears verbatim in the text; each cited source is then checked, with a model’s help, for whether it says what the claim relies on. Those verdicts can be wrong — read the claim’s quote and the cited source before relying on one.
Statistics and arithmetic are recomputed, not judged.
Confidence bands are shown only for fields calibrated on our annotated test set. None is calibrated yet, so no band is shown.
What counts as a claim ›How we measure confidence ›How we check this ›
Are you an author, or do you see a problem with this page? Request a review
