

The DOI matches its Crossref record; 67 of the 68 references it cites were found in a registry or an index.
Loss of ‘homeostatic’ microglia and patterns of their activation in active multiple sclerosis
Open accessAbstract
Microglia and macrophages accumulate at the sites of active demyelination and neurodegeneration in the multiple sclerosis brain and are thought to play a central role in the disease process. We used recently described markers to characterize the origin and functional states of microglia/macrophages in acute, relapsing and progressive multiple sclerosis. We found microglia activation in normal white matter of controls and that the degree of activation increased with age. This microglia activation was more pronounced in the normal-appearing white matter of patients in comparison to controls and increased with disease duration. In contrast to controls, the normal-appearing white matter of patients with multiple sclerosis showed a significant reduction of P2RY12, a marker expressed in homeostatic microglia in rodents, which was completely lost in active and slowly expanding lesions. Early stages of demyelination and neurodegeneration in active lesions contained microglia with a pro-inflammatory phenotype, which expressed molecules involved in phagocytosis, oxidative injury, antigen presentation and T cell co-stimulation. In later stages, the microglia and macrophages in active lesions changed to a phenotype that was intermediate between pro- and anti-inflammatory activation. In inactive lesions, the density of microglia/macrophages was significantly reduced and microglia in part converted to a P2RY12+ phenotype. Analysis of TMEM119, which is expressed on microglia but not on recruited macrophages, demonstrated that on average 45% of the macrophage-like cells in active lesions were derived from the resident microglia pool. Our study demonstrates the loss of the homeostatic microglial signature in active multiple sclerosis with restoration associated with disease inactivity.
Overview
The claims and statistics of this paper haven’t been checked yet.
Run the check — free, no account needed. It reads the open-access text and checks the sources it cites.
Integrity signals
Registry
Cites
Statistics
Figures
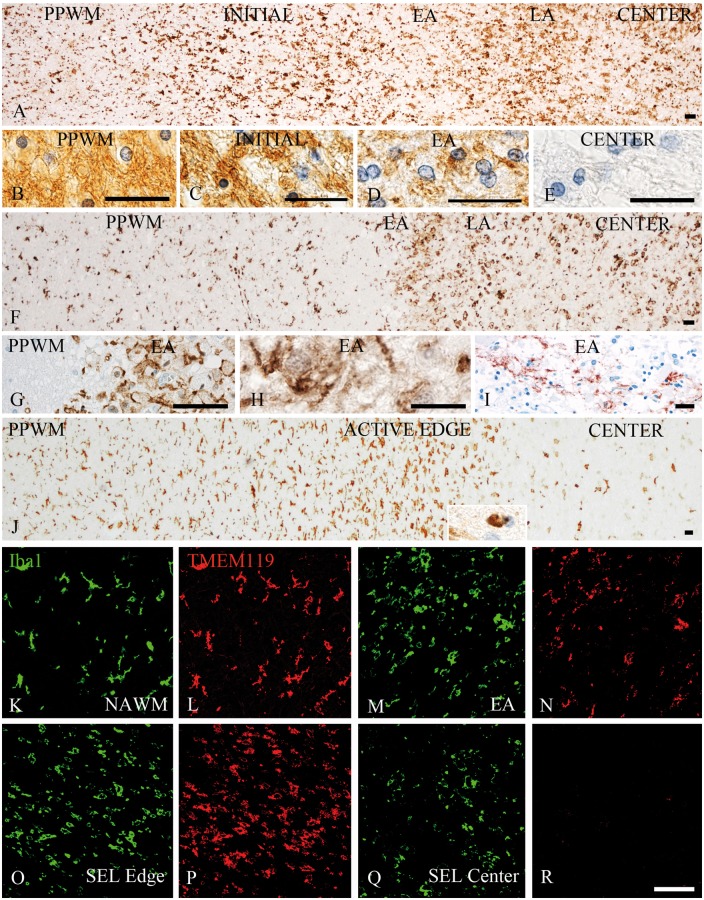
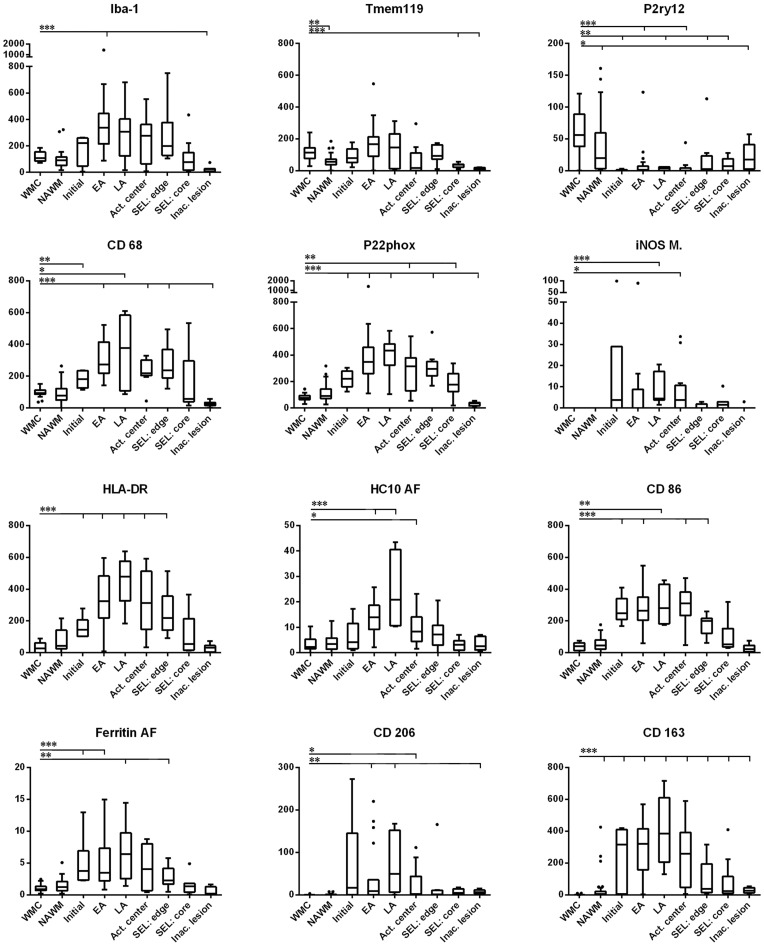
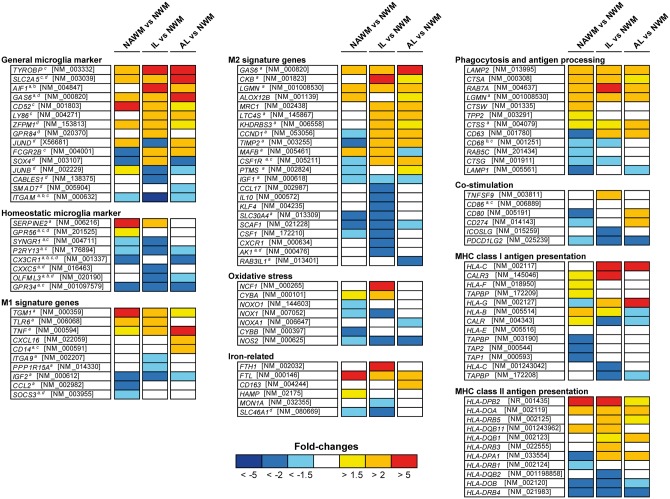
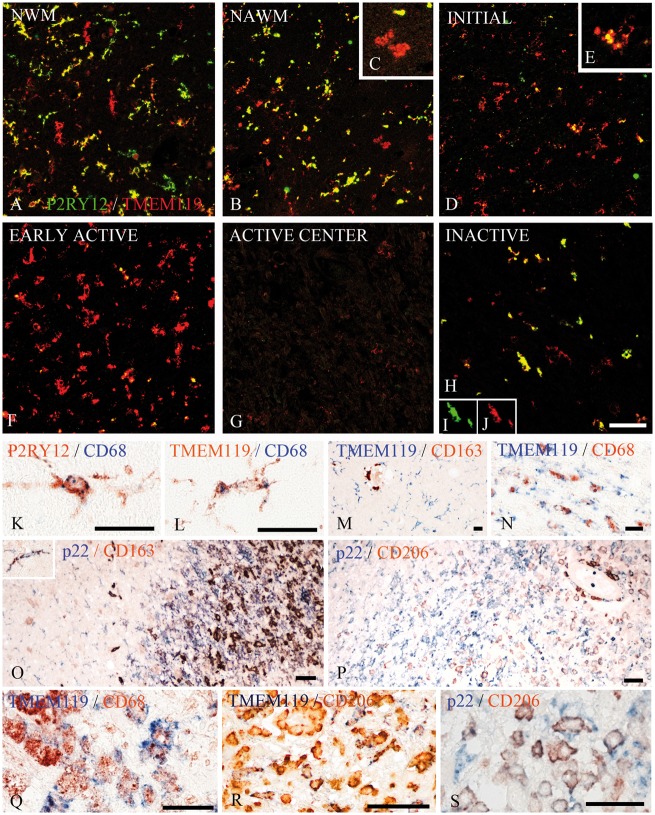
Verification
Claims the paper makes
The claims and statistics of this paper haven’t been checked yet.
Run the check — free, no account needed. It reads the open-access text and checks the sources it cites.
Claims other papers make about this one
Each is checked against this paper’s own text: does it say what the citing paper says it does?
The cited source doesn’t support the claim as written.
In the citing paper
“Similarly, microglia in active MS lesions lack Tmem119 (Satoh et al., 2016; Zrzavy et al., 2017).”
From Activated microglia drive demyelination via CSF1R signaling (2021) · cites this paper as Zrzavy et al., 2017
Checked by a reasoning model — may be wrong.
Experimental — accuracy not yet measuredThe source backs part of the claim, not all of it — or backs it for a different population, condition or comparison.
In the citing paper
“Microglial cells within active white matter lesions are characterized by the absence of homeostatic markers such as P2RY12 and an upregulation of CXCR4, indicating a shift to a disease-associated state (31, 41, 42).”
From The role of microglia in multiple sclerosis: implications for treatment with Bruton’s tyrosine kinase inhibitors (2025) · cites this paper as [41]
Experimental — accuracy not yet measuredThe source backs part of the claim, not all of it — or backs it for a different population, condition or comparison.
In the citing paper
“TMEM119 is one of the main homeostatic microglia markers that is not expressed on monocyte-derived macrophages and has been shown to be downregulated in active MS lesions and other inflammatory conditions of the brain47–49.”
From CHIT1 at diagnosis predicts faster disability progression and reflects early microglial activation in multiple sclerosis (2024) · cites this paper as [47]
Experimental — accuracy not yet measuredThe source backs part of the claim, not all of it — or backs it for a different population, condition or comparison.
In the citing paper
“Interestingly, the phenotype of microglia we observed in HDLS is similar to that found in an SOD1 ALS mouse model and in multiple sclerosis patients, in which the molecules associated with the homeostatic microglial phenotype (e.g., P2RY12, CSF-1R) are down-regulated and inflammatory markers are up-regulated [24, 57].”
From Loss of homeostatic microglial phenotype in CSF1R-related Leukoencephalopathy (2020) · cites this paper as [57]
Experimental — accuracy not yet measuredThe source backs part of the claim, not all of it — or backs it for a different population, condition or comparison.
In the citing paper
“As reported previously (Zrzavy et al., 2017), P2RY12+ cells expressing TSPO were substantially reduced in active lesions (Fig. 2E–H).”
From A quantitative neuropathological assessment of translocator protein expression in multiple sclerosis (2019) · cites this paper as Zrzavy et al., 2017
Experimental — accuracy not yet measured
The source backs part of the claim, not all of it — or backs it for a different population, condition or comparison.
In the citing paper
“Thus, in contrast to the pattern of TSPO expression in rodent models, it may not be so specifically associated with pro-inflammatory microglia in multiple sclerosis (Zrzavy et al., 2017).”
From A quantitative neuropathological assessment of translocator protein expression in multiple sclerosis (2019) · cites this paper as Zrzavy et al., 2017
Experimental — accuracy not yet measuredThe cited source says what the claim attributes to it.
In the citing paper
“Indeed, most phagocytes initially present in active MS lesions are microglia, and with lesion maturation, more macrophages will infiltrate from the blood47.”
From CHIT1 at diagnosis predicts faster disability progression and reflects early microglial activation in multiple sclerosis (2024) · cites this paper as [47]
The cited source says what the claim attributes to it.
In the citing paper
“TMEM119 is one of the main homeostatic microglia markers that is not expressed on monocyte-derived macrophages and has been shown to be downregulated in active MS lesions and other inflammatory conditions of the brain47–49.”
From CHIT1 at diagnosis predicts faster disability progression and reflects early microglial activation in multiple sclerosis (2024) · cites this paper as [47]
In the citing paper
“The loss of homeostatic microglial proteins is visible in immunofluorescence double-staining of IBA1 and TMEM119 in terminally sick mice and mock-infected healthy control brains, and shows the reciprocal regulation of both proteins in prion disease (Figure 5A) [55,73,88,89,90,91].”
From Loss of Homeostatic Microglia Signature in Prion Diseases (2022) · cites this paper as [90]
In the citing paper
“since its expression is maintained by resident human microglia in MS lesions and is not expressed by infiltrating immune cells (Zrzavy et al., 2017).”
From Complex cell-state changes revealed by single cell RNA sequencing of 76,149 microglia throughout the mouse lifespan and in the injured brain (2018) · cites this paper as Zrzavy et al., 2017
In the citing paper
“Several of these microglial genes were also observed in human microglia, including P2RY12 and TMEM119 (REFs25,33–36).”
From Microglial signatures and their role in health and disease (2018) · cites this paper as [36]
In the citing paper
“In human MS, microglia lose the expression of the P2RY12 homeostatic microglial marker and adopt a pro-inflammatory phenotype that includes the expression of phagocytic-related markers (macrosialin (also known as CD68)), antigen presentation markers (MHC class I and II molecules and T lymphocyte activation antigen CD86) and proteins involved in the production of reactive oxygen species (cytochrome”
From Microglial signatures and their role in health and disease (2018) · cites this paper as [36]
In the citing paper
“and appears to exhibit stable expression even in response to a variety of inflammatory conditions (9, 96).”
From The Transcriptional Landscape of Microglial Genes in Aging and Neurodegenerative Disease (2019) · cites this paper as [96]
In the citing paper
“Studies have shown that microglial migration, proliferation, and activation are involved in the onset and progression of disease in acute, relapsing, and progressive forms of MS in humans (Zrzavy et al. 2017).”
From MiR-124 and MiR-155 as Therapeutic Targets in Microglia-Mediated Inflammation in Multiple Sclerosis (2025) · cites this paper as Zrzavy et al. 2017
In the citing paper
“However, activation conditions are variable and microglial phenotype changes with disease progression (Zrzavy et al. 2017).”
From MiR-124 and MiR-155 as Therapeutic Targets in Microglia-Mediated Inflammation in Multiple Sclerosis (2025) · cites this paper as Zrzavy et al. 2017
Self-check
Percentages, sums and reported differences re-computed from the paper’s own numbers.
The self-check needs the paper’s full text.
Citations
Cites
Fate Mapping Analysis Reveals That Adult Microglia Derive from Primitive Macrophages
Ginhoux, F., Greter, M., Leboeuf, M., Nandi, S., See, P., Gokhan, S., Mehler, M. F., Conway, S. J., Ng, L. G., Stanley, E. R., et al. (2010) · Science · doi:10.1126/science.1194637 · Cited by 5,175
The M1 and M2 paradigm of macrophage activation: Time for reassessment
Martinez, F. O., & Gordon, S. (2014) · F1000Prime Reports · doi:10.12703/p6-13 · Cited by 4,689
Kettenmann, H., Hanisch, U.-K., Noda, M., & Verkhratsky, A. (2011) · Physiological Reviews · doi:10.1152/physrev.00011.2010 · Cited by 3,547
Identification of a unique TGF-β–dependent molecular and functional signature in microglia
Butovsky, O., Jedrychowski, M. P., Moore, C. S., Cialic, R., Lanser, A. J., Gabriely, G., Koeglsperger, T., Dake, B., Wu, P. M., Doykan, C. E., et al. (2014) · Nature Neuroscience · doi:10.1038/nn.3599 · Cited by 2,543
Self-citationthe Immunological Genome Consortium, Gautier, E. L., Shay, T., Miller, J., Greter, M., Jakubzick, C., Ivanov, S., Helft, J., Chow, A., Elpek, K. G., et al. (2012) · Nature Immunology · doi:10.1038/ni.2419 · Cited by 1,972 · cited 1×
“…to be microglia-specific in comparison to other brain cells (Chiu et al., 2013; Hickman et al., 2013) or in comparison to peripheral myeloid cells (Gautier et al., 2012; Hickman et al., 2013; Butovsky et al., 2014) or to be involved in pro- or anti-inflammatory microglia/macrophage function such…”
BackgroundNew tools for studying microglia in the mouse and human CNS
Bennett, M. L., Bennett, F. C., Liddelow, S. A., Ajami, B., Zamanian, J. L., Fernhoff, N. B., Mulinyawe, S. B., Bohlen, C. J., Adil, A., Tucker, A., et al. (2016) · Proceedings of the National Academy of Sciences · doi:10.1073/pnas.1525528113 · Cited by 1,804
M2 microglia and macrophages drive oligodendrocyte differentiation during CNS remyelination
Miron, V. E., Boyd, A., Zhao, J.-W., Yuen, T. J., Ruckh, J. M., Shadrach, J. L., van Wijngaarden, P., Wagers, A. J., Williams, A., Franklin, R. J. M., et al. (2013) · Nature Neuroscience · doi:10.1038/nn.3469 · Cited by 1,777 · cited 1×
“It has been suggested to stimulate remyelination (Butovsky et al., 2006; Miron et al., 2013) and early stages of remyelination within multiple sclerosis lesions are mainly seen in the core of active lesions (Raine et al., 1981; Prineas et al., 1993; Raine, 2017).”
A polarizing question: do M1 and M2 microglia exist?
Ransohoff, R. M. (2016) · Nature Neuroscience · doi:10.1038/nn.4338 · Cited by 1,573
Microglia in neurodegenerative disease
Perry, V. H., Nicoll, J. A. R., & Holmes, C. (2010) · Nature Reviews Neurology · doi:10.1038/nrneurol.2010.17 · Cited by 1,543
Axonal damage in acute multiple sclerosis lesions
Ferguson, B. (1997) · Brain · doi:10.1093/brain/120.3.393 · Cited by 1,532
Research works printed but not linked: 2
- Babinski, 1885, Recherches sur l’anatomie pathologique de la sclerose en plaque et étude comparative des diverses variétés de la scleroses de la moelle, Arch Physiol, 5, 186
- Marburg, 1906, Die sogenannte akute multiple Sklerose, J Psychiatric Neurol, 27, 1
Cited by
Sorted by citations
Hammond, T. R., Dufort, C., Dissing-Olesen, L., Giera, S., Young, A., Wysoker, A., Walker, A. J., Segel, M., Nemesh, J., Saunders, A., et al. (2018) · doi:10.1101/406140 · Cited by 2,225
Microglia states and nomenclature: A field at its crossroads
Paolicelli, R. C., Sierra, A., Stevens, B., Tremblay, M.-E., Aguzzi, A., Ajami, B., Amit, I., Audinat, E., Bechmann, I., Bennett, M., et al. (2022) · Neuron · doi:10.1016/j.neuron.2022.10.020 · Cited by 1,973
Self-citationMicroglia in neurodegeneration
Hickman, S., Izzy, S., Sen, P., Morsett, L., & El Khoury, J. (2018) · Nature Neuroscience · doi:10.1038/s41593-018-0242-x · Cited by 1,710
Filippi, M., Bar-Or, A., Piehl, F., Preziosa, P., Solari, A., Vukusic, S., & Rocca, M. A. (2018) · Nature Reviews Disease Primers · doi:10.1038/s41572-018-0041-4 · Cited by 1,562
Microglial signatures and their role in health and disease
Butovsky, O., & Weiner, H. L. (2018) · Nature Reviews Neuroscience · doi:10.1038/s41583-018-0057-5 · Cited by 1,046
Self-citationMrdjen, D., Pavlovic, A., Hartmann, F. J., Schreiner, B., Utz, S. G., Leung, B. P., Lelios, I., Heppner, F. L., Kipnis, J., Merkler, D., et al. (2018) · Immunity · doi:10.1016/j.immuni.2018.01.011 · Cited by 1,010
Inflammation in CNS neurodegenerative diseases
Stephenson, J., Nutma, E., van der Valk, P., & Amor, S. (2018) · Immunology · doi:10.1111/imm.12922 · Cited by 966
Multiple Sclerosis: Mechanisms and Immunotherapy
Baecher-Allan, C., Kaskow, B. J., & Weiner, H. L. (2018) · Neuron · doi:10.1016/j.neuron.2018.01.021 · Cited by 938
Self-citationThe Semantics of Microglia Activation: Neuroinflammation, Homeostasis, and Stress
Woodburn, S. C., Bollinger, J. L., & Wohleb, E. S. (2021) · Journal of Neuroinflammation · doi:10.1186/s12974-021-02309-6 · Cited by 783
Myelin in the Central Nervous System: Structure, Function, and Pathology
Stadelmann, C., Timmler, S., Barrantes‐Freer, A., & Simons, M. (2019) · Physiological Reviews · doi:10.1152/physrev.00031.2018 · Cited by 799
Pathogenic Mechanisms Associated With Different Clinical Courses of Multiple Sclerosis
Lassmann, H. (2019) · Frontiers in Immunology · doi:10.3389/fimmu.2018.03116 · Cited by 711
Self-citationNeuronal vulnerability and multilineage diversity in multiple sclerosis
Schirmer, L., Velmeshev, D., Holmqvist, S., Kaufmann, M., Werneburg, S., Jung, D., Vistnes, S., Stockley, J. H., Young, A., Steindel, M., et al. (2019) · Nature · doi:10.1038/s41586-019-1404-z · Cited by 638
Association of Chronic Active Multiple Sclerosis Lesions With Disability In Vivo
Absinta, M., Sati, P., Masuzzo, F., Nair, G., Sethi, V., Kolb, H., Ohayon, J., Wu, T., Cortese, I. C. M., & Reich, D. S. (2019) · JAMA Neurology · doi:10.1001/jamaneurol.2019.2399 · Cited by 534
Microglia in Central Nervous System Inflammation and Multiple Sclerosis Pathology
Voet, S., Prinz, M., & van Loo, G. (2019) · Trends in Molecular Medicine · doi:10.1016/j.molmed.2018.11.005 · Cited by 503
CNS inflammation and neurodegeneration
Chitnis, T., & Weiner, H. L. (2017) · Journal of Clinical Investigation · doi:10.1172/jci90609 · Cited by 470
Self-citationHow macrophages deal with death
Lemke, G. (2019) · Nature reviews. Immunology · doi:10.1038/s41577-019-0167-y · Cited by 446
Reassessing B cell contributions in multiple sclerosis
Li, R., Patterson, K. R., & Bar‐Or, A. (2018) · Nature Immunology · doi:10.1038/s41590-018-0135-x · Cited by 415
Lively, S. S., & Schlichter, L. C. (2018) · Frontiers in Cellular Neuroscience · doi:10.3389/fncel.2018.00215 · Cited by 411
The pro-remyelination properties of microglia in the central nervous system
Lloyd, A. F., & Miron, V. E. (2019) · Nature Reviews Neurology · doi:10.1038/s41582-019-0184-2 · Cited by 381
Gibson, E. M., Nagaraja, S., Ocampo, A., Tam, L. T., Wood, L. S., Pallegar, P. N., Greene, J. J., Geraghty, A. C., Goldstein, A. K., Ni, L., et al. (2019) · Cell · doi:10.1016/j.cell.2018.10.049 · Cited by 372
The Role of Monocytes and Macrophages in Autoimmune Diseases: A Comprehensive Review
Ma, W., Gao, F., Gu, K., & Chen, D. (2019) · Frontiers in Immunology · doi:10.3389/fimmu.2019.01140 · Cited by 368
Remyelination in multiple sclerosis: From basic science to clinical translation
Lubetzki, C., Zalc, B., Williams, A., Stadelmann, C., & Stankoff, B. (2020) · The Lancet Neurology · doi:10.1016/s1474-4422(20)30140-x · Cited by 350
Microglia Phenotypes in Aging and Neurodegenerative Diseases
Wendimu, M. Y., & Hooks, S. B. (2022) · Cells · doi:10.3390/cells11132091 · Cited by 336
Novel Hexb-based tools for studying microglia in the CNS
Masuda, T., Amann, L., Sankowski, R., Staszewski, O., Lenz, M., d´Errico, P., Snaidero, N., Costa Jordão, M. J., Böttcher, C., Kierdorf, K., et al. (2020) · Nature Immunology · doi:10.1038/s41590-020-0707-4 · Cited by 317
Dopamine, Immunity, and Disease
Channer, B., Matt, S. M., Nickoloff-Bybel, E. A., Pappa, V., Agarwal, Y., Wickman, J. R., & Gaskill, P. J. (2022) · Pharmacological Reviews · doi:10.1124/pharmrev.122.000618 · Cited by 328
Microglia, Lifestyle Stress, and Neurodegeneration
Madore, C., Yin, Z., Leibowitz, J. A., & Butovsky, O. (2020) · Immunity · doi:10.1016/j.immuni.2019.12.003 · Cited by 313
Self-citationvan der Poel, M., Ulas, T., Mizee, M. R., Hsiao, C.-C., Miedema, S. S. M., Adelia, Schuurman, K. G., Helder, B., Tas, S. W., Schultze, J. L., et al. (2019) · Nature Communications · doi:10.1038/s41467-019-08976-7 · Cited by 306
Neuroinflammation across neurological diseases
Shi, F., & Yong, V. W. (2025) · Science · doi:10.1126/science.adx0043 · Cited by 325
The Kaleidoscope of Microglial Phenotypes
Dubbelaar, M. L., Kracht, L., Eggen, B. J. L., & Boddeke, E. W. G. M. (2018) · Frontiers in Immunology · doi:10.3389/fimmu.2018.01753 · Cited by 260
Priming Microglia for Innate Immune Memory in the Brain
Neher, J. J., & Cunningham, C. M. (2019) · Trends in Immunology · doi:10.1016/j.it.2019.02.001 · Cited by 263
Sobue, A., Komine, O., Hara, Y., Endo, F., Mizoguchi, H., Watanabe, S., Murayama, S., Saito, T., Saido, T. C., Sahara, N., et al. (2021) · Acta Neuropathologica Communications · doi:10.1186/s40478-020-01099-x · Cited by 253
Mitochondrial complex I activity in microglia sustains neuroinflammation
Peruzzotti-Jametti, L., Willis, C. M., Krzak, G., Hamel, R., Pirvan, L., Ionescu, R.-B., Reisz, J. A., Prag, H. A., Garcia-Segura, M. E., Wu, V., et al. (2024) · Nature · doi:10.1038/s41586-024-07167-9 · Cited by 239
Cellular immunology of relapsing multiple sclerosis: interactions, checks, and balances
Bar‐Or, A., & Li, R. (2021) · The Lancet Neurology · doi:10.1016/s1474-4422(21)00063-6 · Cited by 261
He, W., Kapate, N., Shields, C. W., & Mitragotri, S. (2019) · Advanced Drug Delivery Reviews · doi:10.1016/j.addr.2019.12.001 · Cited by 241
Wimmer, I., Tietz, S., Nishihara, H., Deutsch, U., Sallusto, F., Gosselet, F., Lyck, R., Müller, W. A., Lassmann, H., & Engelhardt, B. (2019) · Frontiers in Immunology · doi:10.3389/fimmu.2019.00711 · Cited by 234
Self-citationA20 critically controls microglia activation and inhibits inflammasome-dependent neuroinflammation
Voet, S., Mc Guire, C., Hagemeyer, N., Martens, A., Schroeder, A., Wieghofer, P., Daems, C., Staszewski, O., Vande Walle, L., Jordao, M. J. C., et al. (2018) · Nature Communications · doi:10.1038/s41467-018-04376-5 · Cited by 227
Cytokines in Pain: Harnessing Endogenous Anti-Inflammatory Signaling for Improved Pain Management
Vanderwall, A. G., & Milligan, E. D. (2019) · Frontiers in Immunology · doi:10.3389/fimmu.2019.03009 · Cited by 227
Co-expression patterns of microglia markers Iba1, TMEM119 and P2RY12 in Alzheimer’s disease
Kenkhuis, B., Somarakis, A., Kleindouwel, L. R. T., van Roon-Mom, W. M. C., Höllt, T., & van der Weerd, L. (2022) · Neurobiology of Disease · doi:10.1016/j.nbd.2022.105684 · Cited by 188
Microglia in multiple sclerosis: Friend or foe
Guerrero, B. L., & Sicotte, N. L. (2020) · Frontiers in Immunology · doi:10.3389/fimmu.2020.00374 · Cited by 215
Microglia and Neuroinflammation: What Place for P2RY12?
Gómez Morillas, A., Besson, V. C., & Lerouet, D. (2021) · International Journal of Molecular Sciences · doi:10.3390/ijms22041636 · Cited by 214
Qin, J., Ma, Z., Chen, X., & Shu, S. (2023) · Frontiers in Neurology · doi:10.3389/fneur.2023.1103416 · Cited by 243
Acute and non-resolving inflammation associate with oxidative injury after human spinal cord injury
Zrzavy, T., Schwaiger, C., Wimmer, I., Berger, T., Bauer, J., Butovsky, O., Schwab, J. M., Lassmann, H., & Höftberger, R. (2020) · Brain · doi:10.1093/brain/awaa360 · Cited by 212
Self-citationReich, D. S., Arnold, D. L., Vermersch, P., Bar-Or, A., Fox, R. J., Matta, A., Turner, T., Wallström, E., Zhang, X., Mareš, M., et al. (2021) · The Lancet Neurology · doi:10.1016/s1474-4422(21)00237-4 · Cited by 204
Molecular Mechanisms Modulating the Phenotype of Macrophages and Microglia
Amici, S. A., Dong, J., & Guerau‐de‐Arellano, M. (2017) · Frontiers in Immunology · doi:10.3389/fimmu.2017.01520 · Cited by 200
Astrocytes and Microglia as Major Players of Myelin Production in Normal and Pathological Conditions
Traiffort, É., Kassoussi, A., Zahaf, A., & Laouarem, Y. (2020) · Frontiers in Cellular Neuroscience · doi:10.3389/fncel.2020.00079 · Cited by 202
Inflammation in multiple sclerosis
Haase, S., & Linker, R. A. (2021) · Therapeutic Advances in Neurological Disorders · doi:10.1177/17562864211007687 · Cited by 209
Au, N. P. B., & Ma, C. H. E. (2022) · Frontiers in Immunology · doi:10.3389/fimmu.2022.860070 · Cited by 192
Microglia in multiple sclerosis: protectors turn destroyers
Yong, V. W. (2022) · Neuron · doi:10.1016/j.neuron.2022.06.023 · Cited by 185
Iron loading is a prominent feature of activated microglia in Alzheimer’s disease patients
Kenkhuis, B., Somarakis, A., de Haan, L., Dzyubachyk, O., IJsselsteijn, M. E., de Miranda, N. F. C. C., Lelieveldt, B. P. F., Dijkstra, J., van Roon-Mom, W. M. C., Höllt, T., et al. (2021) · Acta Neuropathologica Communications · doi:10.1186/s40478-021-01126-5 · Cited by 184
Macrophage phagocytosis after spinal cord injury: when friends become foes
Van Broeckhoven, J., Sommer, D., Dooley, D., Hendrix, S., & Franssen, A. J. P. M. (2021) · Brain · doi:10.1093/brain/awab250 · Cited by 172
Csf1R inhibition attenuates experimental autoimmune encephalomyelitis and promotes recovery
Nissen, J. C., Thompson, K. K., West, B. L., & Tsirka, S. E. (2018) · Experimental Neurology · doi:10.1016/j.expneurol.2018.05.021 · Cited by 168
Epidemiology and Pathophysiology of Multiple Sclerosis
Ward, M., & Goldman, M. D. (2022) · CONTINUUM Lifelong Learning in Neurology · doi:10.1212/con.0000000000001136 · Cited by 185
Neurodegeneration in multiple sclerosis
Mey, G. M., Mahajan, K. R., & DeSilva, T. M. (2022) · WIREs Mechanisms of Disease · doi:10.1002/wsbm.1583 · Cited by 184
The role of depressive subtypes within the neuroinflammation hypothesis of major depressive disorder
Woelfer, M., Kasties, V., Kahlfuss, S., & Walter, M. (2019) · Neuroscience · doi:10.1016/j.neuroscience.2018.03.034 · Cited by 171
Mechanisms underlying progression in multiple sclerosis
Absinta, M., Lassmann, H., & Trapp, B. D. (2020) · Current Opinion in Neurology · doi:10.1097/wco.0000000000000818 · Cited by 175
Self-citationMammana, S., Fagone, P., Cavalli, E., Basile, M. S., Petralia, M. C., Nicoletti, F., Bramanti, P., & Mazzon, E. (2018) · International Journal of Molecular Sciences · doi:10.3390/ijms19030831 · Cited by 171
CSF1R signaling is a regulator of pathogenesis in progressive MS
Hagan, N., Kane, J. L. J., Grover, D., Woodworth, L. A., Madore, C., Saleh, J., Sancho, J., Liu, J., Li, Y., Proto, J. D., et al. (2020) · Cell Death and Disease · doi:10.1038/s41419-020-03084-7 · Cited by 166
Self-citationSabogal-Guáqueta, A. M., Marmolejo-Garza, A., Trombetta-Lima, M., Oun, A., Hunneman, J., Chen, T., Koıstınaho, J., Lehtonen, Š., Kortholt, A., Wolters, J. C., et al. (2023) · Nature Communications · doi:10.1038/s41467-023-42096-7 · Cited by 180
Mechanism-based criteria to improve therapeutic outcomes in progressive multiple sclerosis
Yong, H. Y. F., & Yong, V. W. (2021) · Nature Reviews Neurology · doi:10.1038/s41582-021-00581-x · Cited by 170
When encephalitogenic T cells collaborate with microglia in multiple sclerosis
Dong, Y., & Yong, V. W. (2019) · Nature Reviews Neurology · doi:10.1038/s41582-019-0253-6 · Cited by 166
Cerebral Iron Deposition in Neurodegeneration
Dušek, P., Hofer, T., Alexander, J., Roos, P. M., & Aaseth, J. (2022) · Biomolecules · doi:10.3390/biom12050714 · Cited by 170
NF‐κB activation in astrocytes drives a stage‐specific beneficial neuroimmunological response in ALS
Alami, N. O., Schurr, C., Heuvel, F. O., Tang, L., Li, Q., Tasdogan, A., Kimbara, A., Nettekoven, M. H., Ottaviani, G., Raposo, C., et al. (2018) · The EMBO Journal · doi:10.15252/embj.201798697 · Cited by 164
PET Imaging of Neuroinflammation in Alzheimer’s Disease
Zhou, R., Ji, B., Kong, Y., Qin, L., Ren, W., Guan, Y., & Ni, R. (2021) · Frontiers in Immunology · doi:10.3389/fimmu.2021.739130 · Cited by 155
Kann, O., Almouhanna, F., & Chausse, B. (2022) · Trends in Neurosciences · doi:10.1016/j.tins.2022.10.007 · Cited by 155
Microglial autophagy–associated phagocytosis is essential for recovery from neuroinflammation
Berglund, R., Guerreiro-Cacais, A. O., Adzemovic, M. Z., Zeitelhofer, M., Lund, H., Ewing, E., Ruhrmann, S., Nutma, E., Parsa, R., Thessen-Hedreul, M., et al. (2020) · Science Immunology · doi:10.1126/sciimmunol.abb5077 · Cited by 149
Analyzing microglial phenotypes across neuropathologies: a practical guide
Schwabenland, M., Brück, W., Priller, J., Stadelmann, C., Lassmann, H., & Prinz, M. (2021) · Acta Neuropathologica · doi:10.1007/s00401-021-02370-8 · Cited by 149
Self-citationTargeting Microglia and Macrophages: A Potential Treatment Strategy for Multiple Sclerosis
Wang, J., Wang, J., Wang, J., Yang, B., Weng, Q., & He, Q. (2019) · Frontiers in Pharmacology · doi:10.3389/fphar.2019.00286 · Cited by 154
Activated microglia drive demyelination via CSF1R signaling
Marzan, D. E., Brügger‐Verdon, V., West, B. L., Liddelow, S., Samanta, J., & Salzer, J. L. (2021) · Glia · doi:10.1002/glia.23980 · Cited by 147
“Downregulation of Tmem119 is shared by all models of demyelination used in this study (CUP and LPC) and is a feature of disease-associated microglia (Deczkowska et al., 2018).”
BackgroundInfluentialMicroglial inflammation and phagocytosis in Alzheimer's disease: Potential therapeutic targets
Nizami, S., Hall‐Roberts, H., Warrier, S., Cowley, S. A., & Di Daniel, E. (2019) · British Journal of Pharmacology · doi:10.1111/bph.14618 · Cited by 147
van Wageningen, T. A., Vlaar, E., Kooij, G., Jongenelen, C. A. M., Geurts, J. J. G., & van Dam, A.-M. (2019) · Acta Neuropathologica Communications · doi:10.1186/s40478-019-0850-z · Cited by 147
Laurindo, L. F., Dias, J. A., Araújo, A. C., Pomini, K. T., Galhardi, C. M., Detregiachi, C. R. P., Haber, L. S. D. A., Roque, D. D., Bechara, M. D., de Castro, M. V. M., et al. (2024) · Frontiers in Immunology · doi:10.3389/fimmu.2023.1305933 · Cited by 156
Kamma, E., Lasisi, W. O., Libner, C. D., Ng, H. S., & Plemel, J. R. (2022) · Journal of Neuroinflammation · doi:10.1186/s12974-022-02408-y · Cited by 157
Beaino, W., Janssen, B., Kooij, G., van der Pol, S. M. A., Hof, B. V. H., van Horssen, J., Windhorst, A. D., & de Vries, H. E. (2017) · Journal of Neuroinflammation · doi:10.1186/s12974-017-1034-z · Cited by 145
Abdelhak, A., Hottenrott, T., Morenas‐Rodríguez, E., Suárez‐Calvet, M., Zettl, U. K., Haass, C., Meuth, S. G., Rauer, S., Otto, M., Tumani, H., et al. (2019) · Frontiers in Neurology · doi:10.3389/fneur.2019.00280 · Cited by 149
Robust Myelination of Regenerated Axons Induced by Combined Manipulations of GPR17 and Microglia
Wang, J., He, X., Meng, H., Li, Y., Dmitriev, P., Tian, F., Page, J. C., Lu, Q. R., & He, Z. (2020) · Neuron · doi:10.1016/j.neuron.2020.09.016 · Cited by 139
A quantitative neuropathological assessment of translocator protein expression in multiple sclerosis
Nutma, E., Stephenson, J. A., Gorter, R. P., de Bruin, J., Boucherie, D. M., Donat, C. K., Breur, M., van der Valk, P., Matthews, P. M., Owen, D. R., et al. (2019) · Brain · doi:10.1093/brain/awz287 · Cited by 138
“Thus, in contrast to the pattern of TSPO expression in rodent models, it may not be so specifically associated with pro-inflammatory microglia in multiple sclerosis (Zrzavy et al., 2017).”
RIPK1 activation mediates neuroinflammation and disease progression in multiple sclerosis
Zelic, M., Pontarelli, F., Woodworth, L. A., Zhu, C., Mahan, A. L., Ren, Y., LaMorte, M. J., Gruber, R. C., Keane, A. M., Loring, P., et al. (2021) · Cell Reports · doi:10.1016/j.celrep.2021.109112 · Cited by 138
DePaula-Silva, A. B., Gorbea, C., Doty, D. J., Libbey, J. E., Sanchez, J. M. S., Hanak, T. J., Cazalla, D., & Fujinami, R. S. (2019) · Journal of Neuroinflammation · doi:10.1186/s12974-019-1545-x · Cited by 133
Chronic inflammation in multiple sclerosis - seeing what was always there
Matthews, P. M. (2019) · Nature Reviews Neurology · doi:10.1038/s41582-019-0240-y · Cited by 128
Walker, D. G., Tang, T. M., Mendsaikhan, A., Tooyama, I., Serrano, G. E., Sue, L. I., Beach, T. G., & Lue, L.-F. (2020) · International Journal of Molecular Sciences · doi:10.3390/ijms21020678 · Cited by 128
Multiple sclerosis: molecular pathogenesis and therapeutic intervention
Boutitah-Benyaich, I., Eixarch, H., Villacieros‐Álvarez, J., Hervera, A., Cobo‐Calvo, Á., Montalbán, X., & Espejo, C. (2025) · Signal Transduction and Targeted Therapy · doi:10.1038/s41392-025-02415-4 · Cited by 149
Microglial Phenotypes and Functions in Multiple SclerosisPreprint
O'Loughlin, E. K., Madore, C., Lassmann, H., & Butovsky, O. (2018) · Cold Spring Harbor Perspectives in Medicine · doi:10.1101/cshperspect.a028993 · Cited by 133
Self-citationDifferential contribution of microglia and monocytes in neurodegenerative diseases
Baufeld, C., O'Loughlin, E. K., Calcagno, N., Madore, C., & Butovsky, O. (2017) · Journal of Neural Transmission · doi:10.1007/s00702-017-1795-7 · Cited by 128
Self-citationRoles of Neuropeptide Y in Neurodegenerative and Neuroimmune Diseases
Li, C.-R., Wu, X.-J., Liu, S., Zhao, Y., Zhu, J., & Liu, K.-D. (2019) · Frontiers in Neuroscience · doi:10.3389/fnins.2019.00869 · Cited by 117
Microglia and Neonatal Brain Injury
Mallard, C. E., Tremblay, M., & Vexler, Z. S. (2018) · Neuroscience · doi:10.1016/j.neuroscience.2018.01.023 · Cited by 123
Baxter, P. S., Dando, O., Emelianova, K., He, X., McKay, S., Hardingham, G. E., & Qiu, J. (2021) · Cell Reports · doi:10.1016/j.celrep.2021.108882 · Cited by 122
Microglia-like Cells Promote Neuronal Functions in Cerebral Organoids
Fagerlund, I., Dougalis, A., Shakirzyanova, A., Gómez‐Budia, M., Pelkonen, A., Konttinen, H., Ohtonen, S., Fazaludeen, M. F., Koskuvi, M., Kuusisto, J., et al. (2021) · Cells · doi:10.3390/cells11010124 · Cited by 127
Furube, E., Kawai, S., Inagaki, H., Takagi, S., & Miyata, S. (2018) · Scientific Reports · doi:10.1038/s41598-018-20643-3 · Cited by 126
The Role of Microglia in Modulating Neuroinflammation after Spinal Cord Injury
Brockie, S. T., Hong, J., & Fehlings, M. G. (2021) · International Journal of Molecular Sciences · doi:10.3390/ijms22189706 · Cited by 122
Microglia: Brain cells on the move
Smolders, S., Kessels, S., Vangansewinkel, T., Rigo, J., Legendre, P., & Brône, B. (2019) · Progress in Neurobiology · doi:10.1016/j.pneurobio.2019.04.001 · Cited by 126
Grassivaro, F., Menon, R., Acquaviva, M., Ottoboni, L., Ruffini, F., Bergamaschi, A., Muzio, L., Farina, C., & Martino, G. (2020) · The Journal of Neuroscience · doi:10.1523/jneurosci.1523-19.2019 · Cited by 127
Bagheri, H., Ghasemi, F., Barreto, G. E., Sathyapalan, T., Jamialahmadi, T., & Sahebkar, A. (2019) · BioFactors · doi:10.1002/biof.1597 · Cited by 121
Ronzano, R., Roux, T., Thétiot, M., Aigrot, M., Richard, L., Lejeune, F., Mazuir, E., Vallat, J., Lubetzki, C., & Desmazières, A. (2021) · Nature Communications · doi:10.1038/s41467-021-25486-7 · Cited by 122
Inflammation in multiple sclerosis: consequences for remyelination and disease progression
Klotz, L., Antel, J. P., & Kuhlmann, T. (2023) · Nature Reviews Neurology · doi:10.1038/s41582-023-00801-6 · Cited by 125
Epigenetic regulation of innate immune memory in microglia
Zhang, X., Kracht, L., Lerário, A. M., Dubbelaar, M. L., Brouwer, N., Wesseling, E. M., Boddeke, E., Eggen, B. J. L., & Kooistra, S. M. (2022) · Journal of Neuroinflammation · doi:10.1186/s12974-022-02463-5 · Cited by 116
Han, J., Zhu, K., Zhang, X., & Harris, R. A. (2018) · Glia · doi:10.1002/glia.23529 · Cited by 116
Roles and regulation of microglia activity in multiple sclerosis: insights from animal models
Distéfano‐Gagné, F., Bitarafan, S., Lacroix, S., & Gosselin, D. (2023) · Nature reviews. Neuroscience · doi:10.1038/s41583-023-00709-6 · Cited by 115
Pro‐inflammatory activation of microglia in the brain of patients with sepsis
Zrzavy, T., Höftberger, R., Berger, T., Rauschka, H., Butovsky, O., Weiner, H. L., & Lassmann, H. (2018) · Neuropathology and Applied Neurobiology · doi:10.1111/nan.12502 · Cited by 115
Self-citationKuo, P., Weng, W., Scofield, B. A., Paraiso, H. C., Brown, D. A., Wang, P., Yu, I.-C. I., & Yen, J.-H. J. (2020) · Journal of Neuroinflammation · doi:10.1186/s12974-020-01768-7 · Cited by 113
Natural Products as a Potential Modulator of Microglial Polarization in Neurodegenerative Diseases
Jin, X., Liu, M.-Y., Zhang, D.-F., Zhong, X., Du, K., Qian, P., Gao, H., & Wei, M.-J. (2019) · Pharmacological Research · doi:10.1016/j.phrs.2019.104253 · Cited by 109
Metadata
- Authors
- Zrzavy, T., Hametner, S., Wimmer, I., Butovsky, O., Weiner, H. L., & Lassmann, H.
- Affiliations
- Medical University of Vienna (AT)
- Brigham and Women's Hospital (US)
- Corresponding author
- Lassmann, Hans
- Venue
- Brain
- Publisher
- Oxford University Press (OUP)
- Published
- 2017-05-24
- Volume
- 140
- Issue
- 7
- Pages
- 1900-1913
- ISSN
- 0006-8950 (ISSN-L)
- 1460-2156
- PMC
- PMC6057548
- OpenAlex
- W2620266814
- Cited by
- 684
- References
- 68
- Citations by year
- 2026: 62 · 2025: 65 · 2024: 78 · 2023: 87 · 2022: 92 · 2021: 116 · 2020: 71 · 2019: 60 · 2018: 43 · 2017: 10
- FWCI
- 39.52
- Type
- journal article
- Language
- en
- Open access
- hybrid
- doi.org
- Licence
- Locations
- Brain (publishedVersion, cc-by-nc)
- Europe PMC (PubMed Central) (publishedVersion, cc-by-nc)
- PubMed Central (publishedVersion, cc-by-nc)
- PubMed (publishedVersion)
- Funders
- NIH (R01NS088137)
- National Multiple Sclerosis Society (5092A1)
- Topics
- Health Sciences › Medicine › Clinical Neurology › Multiple Sclerosis Research Studies
- Life Sciences › Neuroscience › Neurology › Neuroinflammation and Neurodegeneration Mechanisms
- Life Sciences › Biochemistry, Genetics and Molecular Biology › Molecular Biology › Inflammasome and immune disorders
- Keywords
- multiple sclerosis, microglia, macrophages, homeostatic microglia, microglial activation, P2Y12 receptor, TMEM119, normal-appearing white matter, demyelination, neurodegeneration, lesion activity, disease duration, pro-inflammatory phenotype, anti-inflammatory phenotype, phagocytosis, oxidative damage, antigen presentation, T cell costimulation, microglial origin
- MeSH terms
- Adult, Aged, Aged, 80 and over, Aging, Demyelinating Diseases, Female, Homeostasis, Humans, Macrophage Activation, Male, Membrane Proteins, Middle Aged, Multiple Sclerosis, Nerve Degeneration, Case-Control Studies, Microglia, Receptors, Purinergic P2Y12, White Matter
About these checks
Registry, retraction, Cites and statistics results are computed, not judged, with one exception: a printed reference that no index lists is read once by a model before it counts as a citation error. Claims are extracted by a model and kept only when their quote appears verbatim in the text; each cited source is then checked, with a model’s help, for whether it says what the claim relies on. Those verdicts can be wrong — read the claim’s quote and the cited source before relying on one.
Statistics and arithmetic are recomputed, not judged.
Confidence bands are shown only for fields calibrated on our annotated test set. None is calibrated yet, so no band is shown.
What counts as a claim ›How we measure confidence ›How we check this ›
Are you an author, or do you see a problem with this page? Request a review
