

The DOI matches its Crossref record; 64 of the 64 references it cites were found in a registry or an index.
Evolutionary genomics of yeast pathogens in the Saccharomycotina
Open accessAbstract
Saccharomycotina comprises a diverse group of yeasts that includes numerous species of industrial or clinical relevance. Opportunistic pathogens within this clade are often assigned to the genus Candida but belong to phylogenetically distant lineages that also comprise non-pathogenic species. This indicates that the ability to infect humans has evolved independently several times among Saccharomycotina. Although the mechanisms of infection of the main groups of Candida pathogens are starting to be unveiled, we still lack sufficient understanding of the evolutionary paths that led to a virulent phenotype in each of the pathogenic lineages. Deciphering what genomic changes underlie the evolutionary emergence of a virulence trait will not only aid the discovery of novel virulence mechanisms but it will also provide valuable information to understand how new pathogens emerge, and what clades may pose a future danger. Here we review recent comparative genomics efforts that have revealed possible evolutionary paths to pathogenesis in different lineages, focusing on the main three agents of candidiasis worldwide: Candida albicans, C. parapsilosis and C. glabrata We will discuss what genomic traits may facilitate the emergence of virulence, and focus on two different genome evolution mechanisms able to generate drastic phenotypic changes and which have been associated to the emergence of virulence: gene family expansion and interspecies hybridization.
Overview
The claims and statistics of this paper haven’t been checked yet.
Run the check — free, no account needed. It reads the open-access text and checks the sources it cites.
Integrity signals
Registry
Cites
Statistics
Figures
Verification
Claims the paper makes
The claims and statistics of this paper haven’t been checked yet.
Run the check — free, no account needed. It reads the open-access text and checks the sources it cites.
Claims other papers make about this one
Each is checked against this paper’s own text: does it say what the citing paper says it does?
In the citing paper
“although the four most common Candida (C. albicans, C. glabrata, C. parapsilosis, and C. tropicalis) can account for more than 80% of the cases, there is a long list with over 30 Candida that have been identified as candidemia agents [9]”
From Evolutionary Emergence of Drug Resistance in Candida Opportunistic Pathogens (2018) · cites this paper as [9]
In the citing paper
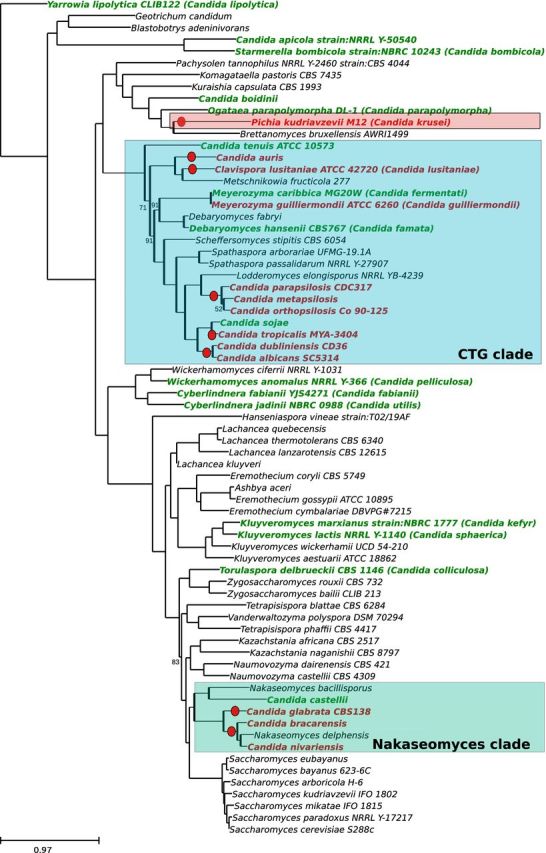
“When highlighted on a phylogenetic tree, Candida opportunistic pathogens belong to distinct lineages, which are interspersed with non-pathogenic relatives [9].”
From Evolutionary Emergence of Drug Resistance in Candida Opportunistic Pathogens (2018) · cites this paper as [9]
Self-check
Percentages, sums and reported differences re-computed from the paper’s own numbers.
The self-check needs the paper’s full text.
Citations
Cites
Epidemiology of Invasive Candidiasis: a Persistent Public Health Problem
Pfaller, M. A., & Diekema, D. J. (2007) · Clinical Microbiology Reviews · doi:10.1128/cmr.00029-06 · Cited by 4,174 · cited 5×
“Lastly, C. tropicalis infections are usually restricted to patients with neutropenia and other blood malignancies and usually respond to azole antifungals (Pfaller and Diekema 2007; Guinea et al. 2014).”
BackgroundResultInfluentialKurtzman, C. P., & Lodder, J. (1972) · Mycologia · doi:10.2307/3758036 · Cited by 3,441
Molecular evidence for an ancient duplication of the entire yeast genome
Wolfe, K. H., & Shields, D. C. (1997) · Nature · doi:10.1038/42711 · Cited by 1,785
Dujon, B., Sherman, D., Fischer, G., Durrens, P., Casaregola, S., Lafontaine, I., de Montigny, J., Marck, C., Neuvéglise, C., Talla, E., et al. (2004) · Nature · doi:10.1038/nature02579 · Cited by 1,623
Comparative Genomics of Listeria Species
Glaser, P., Frangeul, L., Buchrieser, C., Rusniok, C., Amend, A., Baquero, F., Berche, P., Blöcker, H., Brandt, P., Chakraborty, T., et al. (2001) · Science · doi:10.1126/science.1063447 · Cited by 1,505
RAxML-III: a fast program for maximum likelihood-based inference of large phylogenetic trees
Stamatakis, A., Ludwig, T. G., & Meier, H. (2004) · Bioinformatics · doi:10.1093/bioinformatics/bti191 · Cited by 1,429
Turning a hobby into a job: How duplicated genes find new functions
Conant, G. C., & Wolfe, K. H. (2008) · Nature Reviews Genetics · doi:10.1038/nrg2482 · Cited by 1,281
Growth of Candida albicans hyphae
Sudbery, P. E. (2011) · Nature Reviews Microbiology · doi:10.1038/nrmicro2636 · Cited by 1,110
Evolution of pathogenicity and sexual reproduction in eight Candida genomes
Butler, G., Rasmussen, M. D., Lin, M. F., Santos, M. A. S., Sakthikumar, S., Munro, C. A., Rheinbay, E., Grabherr, M., Forche, A., Reedy, J. L., et al. (2009) · Nature · doi:10.1038/nature08064 · Cited by 1,065
ESCMID† and ECMM‡ joint clinical guidelines for the diagnosis and management of mucormycosis 2013
Cornely, O. A., Arıkan-Akdağlı, S., Dannaoui, É., Groll, A. H., Lagrou, K., Chakrabarti, A., Lanternier, F., Pagano, L., Skiada, A., Akova, M., et al. (2014) · Clinical Microbiology and Infection · doi:10.1111/1469-0691.12371 · Cited by 864
Pfaller, M. A., Diekema, D. J., Gibbs, D. L., Newell, V. A., Ellis, D., Tullio, V., Rodloff, A., Fu, W., & Ling, T. A. (2010) · Journal of Clinical Microbiology · doi:10.1128/jcm.02117-09 · Cited by 718
Global trends in the distribution of Candida species causing candidemia
Guinea, J. (2014) · Clinical Microbiology and Infection · doi:10.1111/1469-0691.12539 · Cited by 680
Phylogenomics: Improving Functional Predictions for Uncharacterized Genes by Evolutionary AnalysisPreprint
Eisen, J. A. (1998) · Genome Research · doi:10.1101/gr.8.3.163 · Cited by 628
Tavanti, A., Davidson, A. D., Gow, N. A. R., Maiden, M. C. J., & Odds, F. C. (2005) · Journal of Clinical Microbiology · doi:10.1128/jcm.43.1.284-292.2005 · Cited by 593
Developments in Fungal Taxonomy
Guarro, J., Gené, J., & Stchigel, A. M. (1999) · Clinical Microbiology Reviews · doi:10.1128/cmr.12.3.454 · Cited by 536
Pathogenicity islands: a molecular toolbox for bacterial virulence
Gal‐Mor, O., & Finlay, B. B. (2006) · Cellular Microbiology · doi:10.1111/j.1462-5822.2006.00794.x · Cited by 383
ETE: a python Environment for Tree Exploration
Huerta‐Cepas, J., Dopazo, J., & Gabaldón, T. (2010) · BMC Bioinformatics · doi:10.1186/1471-2105-11-24 · Cited by 363
Self-citationThe Candida Pathogenic Species ComplexPreprint
Turner, S. A., & Butler, G. (2014) · Cold Spring Harbor Perspectives in Medicine · doi:10.1101/cshperspect.a019778 · Cited by 351
The evolution of drug resistance in clinical isolates of Candida albicans.
Ford, C. B., Funt, J. M., Abbey, D., Issi, L., Guiducci, C., Martinez, D. A., Delorey, T., Li, B. Y., White, T. C., Cuomo, C., et al. (2015) · eLife · doi:10.7554/elife.00662 · Cited by 348
Marcet‐Houben, M., & Gabaldón, T. (2015) · PLoS Biology · doi:10.1371/journal.pbio.1002220 · Cited by 334
Self-citationDujon, B. (2010) · Nature Reviews Genetics · doi:10.1038/nrg2811 · Cited by 330
Genetic and phenotypic intra-species variation in Candida albicans
Hirakawa, M. P., Martinez, D. A., Sakthikumar, S., Anderson, M. Z., Berlin, A., Gujja, S., Zeng, Q., Zisson, E., Wang, J. M., Greenberg, J. M., et al. (2015) · Genome Research · doi:10.1101/gr.174623.114 · Cited by 320
Adhesins in human fungal pathogens: glue with plenty of stick.
de Groot, P. W. J., Bader, O., de Boer, A. D., Weig, M., & Chauhan, N. (2013) · Eukaryotic Cell · doi:10.1128/ec.00364-12 · Cited by 319
Emerging and Emerged Pathogenic Candida Species: Beyond the Candida albicans Paradigm
Papon, N., Courdavault, V., Clastre, M., & Bennett, R. J. (2013) · PLoS Pathogens · doi:10.1371/journal.ppat.1003550 · Cited by 314
The changing epidemiology of healthcare-associated candidemia over three decades
Diekema, D., Arbefeville, S., Boyken, L., Kroeger, J., & Pfaller, M. (2012) · Diagnostic Microbiology and Infectious Disease · doi:10.1016/j.diagmicrobio.2012.02.001 · Cited by 309
Two unlike cousins: Candida albicans and C . glabrata infection strategies
Brunke, S., & Hube, B. (2013) · Cellular Microbiology · doi:10.1111/cmi.12091 · Cited by 239
Coevolution of Morphology and Virulence in Candida Species
Childers, D. S., Carlisle, P. L., & Kadosh, D. (2011) · Eukaryotic Cell · doi:10.1128/ec.05085-11 · Cited by 238
Trends in the Epidemiology of Invasive Fungal Infections
Warnock, D. W. (2007) · Nippon Ishinkin Gakkai Zasshi · doi:10.3314/jjmm.48.1 · Cited by 222
PhylomeDB v4: zooming into the plurality of evolutionary histories of a genome
Huerta-Cepas, J., Capella-Gutiérrez, S., Pryszcz, L. P., Marcet-Houben, M., & Gabaldón, T. (2014) · Nucleic Acids Research · doi:10.1093/nar/gkt1177 · Cited by 217
Self-citationComparative genomics of emerging pathogens in the Candida glabrata clade.
Gabaldón, T., Martin, T., Marcet-Houben, M., Durrens, P., Bolotin-Fukuhara, M., Lespinet, O., Arnaise, S., Boisnard, S., Aguileta, G., Atanasova, R., et al. (2013) · BMC Genomics · doi:10.1186/1471-2164-14-623 · Cited by 198
Self-citationNeafsey, D. E., Barker, B. M., Sharpton, T. J., Stajich, J., Park, D. J., Whiston, E., Hung, C.-Y., McMahan, C. A., White, J. R., Sykes, S. M., et al. (2010) · Genome Research · doi:10.1101/gr.103911.109 · Cited by 189
Roetzer, A., Gabaldón, T., & Schüller, C. (2011) · FEMS Microbiology Letters · doi:10.1111/j.1574-6968.2010.02102.x · Cited by 154
Self-citationKey Role of Splenic Myeloid DCs in the IFN-αβ Response to Adenoviruses In Vivo
Fejér, G., Drechsel, L., Liese, J., Schleicher, U., Ruzsics, Z., Imelli, N., Greber, U. F., Keck, S., Hildenbrand, B., Krug, A., et al. (2008) · PLoS Pathogens · doi:10.1371/journal.ppat.1000208 · Cited by 148
Holland, L., Schröder, M., Turner, S. A., Taff, H. T., Andes, D. R., Grózer, Z., Gácser, A., Ames, L., Haynes, K., Higgins, D. G., et al. (2014) · PLoS Pathogens · doi:10.1371/journal.ppat.1004365 · Cited by 134
Pryszcz, L. P., Németh, T., Gácser, A., & Gabaldón, T. (2014) · Genome Biology and Evolution · doi:10.1093/gbe/evu082 · Cited by 119
Self-citationThe Genomic Aftermath of Hybridization in the Opportunistic Pathogen Candida metapsilosis
Pryszcz, L. P., Németh, T., Saus, E., Księżopolska, E., Hegedűsová, E., Nosek, J., Wolfe, K. H., Gácser, A., & Gabaldón, T. (2015) · PLoS Genetics · doi:10.1371/journal.pgen.1005626 · Cited by 118
Self-citationThe genetic code of the fungal CTG clade
Santos, M. A. S., Gomes, A. C., Santos, M. C., Carreto, L. C., & Moura, G. R. (2011) · Comptes Rendus. Biologies · doi:10.1016/j.crvi.2011.05.008 · Cited by 110
Gabaldón, T., & Carreté, L. (2016) · FEMS Yeast Research · doi:10.1093/femsyr/fov110 · Cited by 99
Self-citationFungal Immune Evasion in a Model Host–Pathogen Interaction: Candida albicans Versus Macrophages
Jiménez-López, C., & Lorenz, M. C. (2013) · PLoS Pathogens · doi:10.1371/journal.ppat.1003741 · Cited by 96
Recent Taxonomic Developments with Candida and Other Opportunistic Yeasts
Brandt, M. E., & Lockhart, S. R. (2012) · Current Fungal Infection Reports · doi:10.1007/s12281-012-0094-x · Cited by 96
Interspecific hybridization impacts host range and pathogenicity of filamentous microbes
Depotter, J. R. L., Seidl, M. F., Wood, T. A., & Thomma, B. P. H. J. (2016) · Current Opinion in Microbiology · doi:10.1016/j.mib.2016.04.005 · Cited by 96
Candida albicans CUG Mistranslation Is a Mechanism To Create Cell Surface Variation
Miranda, I. M., Silva-Dias, A., Rocha, R., Teixeira‐Santos, R., Coelho, C., Gonçalves, T., Santos, M. A. S., Pina‐Vaz, C., Solis, N. V., Filler, S. G., et al. (2013) · mBio · doi:10.1128/mbio.00285-13 · Cited by 94
Seider, K., Gerwien, F., Kasper, L., Allert, S., Brunke, S., Jablonowski, N., Schwarzmüller, T., Barz, D., Rupp, S., Kuchler, K., et al. (2014) · Eukaryotic Cell · doi:10.1128/ec.00262-13 · Cited by 91
Pryszcz, L. P., Németh, T., Gácser, A., & Gabaldón, T. (2013) · Genome Biology and Evolution · doi:10.1093/gbe/evt185 · Cited by 87
Self-citationSequence and Analysis of the Genome of the Pathogenic Yeast Candida orthopsilosis
Riccombeni, A., Vidanes, G. M., Proux‐Wéra, E., Wolfe, K. H., & Butler, G. (2012) · PLoS ONE · doi:10.1371/journal.pone.0035750 · Cited by 86
Managing and coping with names of pleomorphic fungi in a period of transition
Hawksworth, D. L. (2012) · IMA Fungus · doi:10.5598/imafungus.2012.03.01.03 · Cited by 81
Muller, H., Thierry, A., Coppée, J.-Y., Gouyette, C., Hennequin, C., Sismeiro, O., Talla, E., Dujon, B., & Fairhead, C. (2009) · Fungal Genetics and Biology · doi:10.1016/j.fgb.2008.11.006 · Cited by 78
Evolution of Mating within the Candida parapsilosis Species Group
Sai, S., Holland, L., McGee, C. F., Lynch, D. B., & Butler, G. (2011) · Eukaryotic Cell · doi:10.1128/ec.00276-10 · Cited by 71
Genetic Diversity and Genomic Plasticity ofCryptococcus neoformansAD Hybrid Strains
Li, W., Averette, A. F., Desnos‐Ollivier, M., Ni, M., Dromer, F., & Heitman, J. (2012) · G3 Genes Genomes Genetics · doi:10.1534/g3.111.001255 · Cited by 71
Tavanti, A., Hensgens, L. A. M., Mogavero, S., Majoros, L., Senesi, S., & Campa, M. (2010) · BMC Microbiology · doi:10.1186/1471-2180-10-203 · Cited by 58
Genome structure and dynamics of the yeast pathogen Candida glabrata
Ahmad, K. M., Kokošar, J., Guo, X., Gu, Z., Ishchuk, O. P., & Piškur, J. (2014) · FEMS Yeast Research · doi:10.1111/1567-1364.12145 · Cited by 57
Generating cell surface diversity inCandida albicansand other fungal pathogens
Nather, K., & Munro, C. A. (2008) · FEMS Microbiology Letters · doi:10.1111/j.1574-6968.2008.01263.x · Cited by 53
Characterization of Virulence-Related Phenotypes in Candida Species of the CUG Clade
Priest, S. J., & Lorenz, M. C. (2015) · Eukaryotic Cell · doi:10.1128/ec.00062-15 · Cited by 53
Candida glabrata – unique features and challenges in the clinical management of invasive infections
Glöckner, A., & Cornely, O. A. (2015) · Mycoses · doi:10.1111/myc.12348 · Cited by 49
Candida glabrata : a deadly companion?
Bolotin‐Fukuhara, M., & Fairhead, C. (2014) · Yeast · doi:10.1002/yea.3019 · Cited by 42
Fukuda, Y., Tsai, H.-F., Myers, T. G., & Bennett, J. E. (2013) · Infection and Immunity · doi:10.1128/iai.00851-12 · Cited by 41
Mühlhausen, S., & Kollmar, M. (2014) · Genome Biology and Evolution · doi:10.1093/gbe/evu152 · Cited by 41
Bader, O., Schwarz, A., Kraneveld, E. A., Tangwattanchuleeporn, M., Schmidt, P., Jacobsen, M. D., Gross, U., De Groot, P. W. J., & Weig, M. (2012) · PLoS ONE · doi:10.1371/journal.pone.0052218 · Cited by 39
Short, D. P. G., O'Donnell, K. L., & Geiser, D. M. (2014) · BMC Evolutionary Biology · doi:10.1186/1471-2148-14-91 · Cited by 37
Anoop, V., Rotaru, S., Shwed, P. S., Tayabali, A. F., & Arvanitakis, G. (2015) · FEMS Yeast Research · doi:10.1093/femsyr/fov057 · Cited by 35
Large-Scale Chromosomal Changes and Associated Fitness Consequences in Pathogenic Fungi
Forche, A. (2014) · Current Fungal Infection Reports · doi:10.1007/s12281-014-0181-2 · Cited by 33
Comparative Genomics-Based Prediction of Protein Function
Gabaldón, T. (2008) · Methods in molecular biology · doi:10.1007/978-1-59745-188-8_26 · Cited by 24
Self-citationSelected pathogenic characteristics of fungi from the genus Candida.
Modrzewska, B., & Kurnatowski, P. (2013) · PubMed · Cited by 23
3 Phylogenomics for the Study of Fungal Biology
Gabaldón, T., & Marcet‐Houben, M. (2014) · Springer eBooks · doi:10.1007/978-3-642-45218-5_3 · Cited by 4
Self-citation
Cited by
Sorted by citations
Muñoz, J. F., Gade, L., Chow, N. A., Loparev, V. N., Juieng, P., Berkow, E. L., Farrer, R. A., Litvintseva, A. P., & Cuomo, C. A. (2018) · Nature Communications · doi:10.1038/s41467-018-07779-6 · Cited by 458
Fungal evolution: major ecological adaptations and evolutionary transitions
Naranjo-Ortíz, M. A., & Gabaldón, T. (2019) · Biological reviews/Biological reviews of the Cambridge Philosophical Society · doi:10.1111/brv.12510 · Cited by 412
Self-citationEvolutionary Emergence of Drug Resistance in Candida Opportunistic Pathogens
Ksiezopolska, E., & Gabaldón, T. (2018) · Genes · doi:10.3390/genes9090461 · Cited by 230
Self-citationEvolution of the human pathogenic lifestyle in fungi
Rokas, A. (2022) · Nature Microbiology · doi:10.1038/s41564-022-01112-0 · Cited by 240
Molecular Mechanisms Associated with Antifungal Resistance in Pathogenic Candida Species
Czajka, K. M., Venkataraman, K., Brabant-Kirwan, D., Santi, S. A., Verschoor, C. P., Appanna, V. D., Singh, R. I., Saunders, D., & Tharmalingam, S. (2023) · Cells · doi:10.3390/cells12222655 · Cited by 207
Metadata
- Authors
- Gabaldón, T., Naranjo-Ortíz, M. A., & Marcet-Houben, M.
- Affiliations
- Institució Catalana de Recerca i Estudis Avançats (ES)
- Universitat Pompeu Fabra (ES)
- Corresponding author
- Gabaldón, Toni
- Venue
- FEMS Yeast Research
- Publisher
- Oxford University Press (OUP)
- Published
- 2016-08-03
- Volume
- 16
- Issue
- 6
- Pages
- fow064
- ISSN
- 1567-1356 (ISSN-L)
- 1567-1364
- PMC
- PMC5815160
- OpenAlex
- W2488745281
- Cited by
- 105
- References
- 64
- Citations by year
- 2026: 6 · 2025: 10 · 2024: 11 · 2023: 16 · 2022: 4 · 2021: 17 · 2020: 10 · 2019: 13 · 2018: 11 · 2017: 7
- FWCI
- 0.93
- Type
- journal article
- Language
- en
- Open access
- hybrid
- doi.org
- Licence
- cc-by-nc
- Locations
- FEMS Yeast Research (publishedVersion, cc-by-nc)
- PubMed Central (publishedVersion, cc-by-nc)
- PubMed (publishedVersion)
- RECERCAT (Consorci de Serveis Universitaris de Catalunya) (publishedVersion, other-oa)
- Repositori digital de la UPF (Universitat Pompeu Fabra) (publishedVersion, cc-by-nc)
- HighWire Press Open Archive (submittedVersion)
- Funders
- European Commission (H2020-MSCA-ITN, H2020-MSCA-ITN-2014, 2007–2013, FP7 2007-2013, 642095, FP7-PEOPLE-2013, FP7/2007, FP7‐PEOPLE‐ 2013‐ITN, 606786, H2020-MSCA)
- Ministerio de Economía y Competitividad (642095, SEV‐2012‐0208, BIO2012-37161)
- Horizon 2020 Framework Programme (MSCA-ITN-2014, FP7/2007-2013, H2020MSCA‐ITN‐2014, H2020-MSCA, H2020-MSCA-ITN-2014-642095, 642095, H2020-MSCA-ITN)
- Agència de Gestió d'Ajuts Universitaris i de Recerca (SGR857)
- European Regional Development Fund (H2020-MSCA-ITN-2014, FP7/2007‐2013, 2007 – 2013)
- FP7 People: Marie-Curie Actions (FP7-PEOPLE-2013-ITN-606786, 2007-2013, 2013‐ITN‐606786, FP7-PEOPLE-2013-ITN, FP7/2007‐2013/, FP7-PEOPLE-2013)
- Topics
- Life Sciences › Biochemistry, Genetics and Molecular Biology › Molecular Biology › Fungal and yeast genetics research
- Life Sciences › Immunology and Microbiology › Microbiology › Yeasts and Rust Fungi Studies
- Health Sciences › Medicine › Infectious Diseases › Antifungal resistance and susceptibility
- Keywords
- Saccharomycotina, pathogenic yeasts, Candida, candidiasis, virulence evolution, Candida albicans, Candida parapsilosis, Candida glabrata, comparative genomics, gene family expansion, interspecific hybridization, genome evolution, opportunistic pathogens
- MeSH terms
- Ascomycota, Evolution, Molecular, Genomics, Virulence Factors
About these checks
Registry, retraction, Cites and statistics results are computed, not judged, with one exception: a printed reference that no index lists is read once by a model before it counts as a citation error. Claims are extracted by a model and kept only when their quote appears verbatim in the text; each cited source is then checked, with a model’s help, for whether it says what the claim relies on. Those verdicts can be wrong — read the claim’s quote and the cited source before relying on one.
Statistics and arithmetic are recomputed, not judged.
Confidence bands are shown only for fields calibrated on our annotated test set. None is calibrated yet, so no band is shown.
What counts as a claim ›How we measure confidence ›How we check this ›
Are you an author, or do you see a problem with this page? Request a review
