

The DOI matches its Crossref record; 278 of the 278 references it cites were found in a registry or an index; 25 of the 130 sources its claims cite were checked for support.
How many mammal species are there now? Updates and trends in taxonomic, nomenclatural, and geographic knowledge
Open accessAbstract
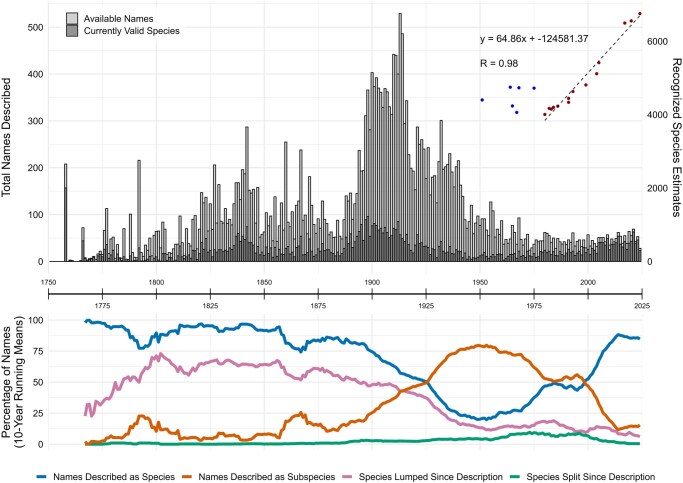
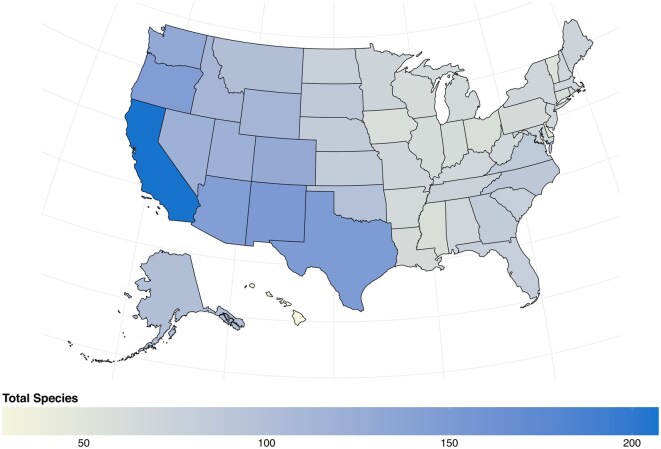
The Mammal Diversity Database (MDD) is an open-access resource providing up-to-date taxonomic, nomenclatural, and geographic data for global mammal species. Since its launch in 2018, the MDD has transformed the traditionally static process of updating mammalian taxonomy into regular online releases reflecting the latest published research. To build on this foundation, we here present version 2.0 of the MDD (MDD2), which catalogs 6,759 living and recently extinct mammal species, representing net increases of 4.1% and 24.8% over MDD version 1.0 and Mammal Species of the World, 3rd edition (MSW3), respectively. Additionally, we identify a net increase of 68.8% (+2,754; 3,149 splits + de novo, 395 lumps) species since 1980 at a rate of ∼65 species/yr based on past totals from 14 mammalian compendia, leading to projections of ∼7,079 species by 2030 and ∼8,376 by 2050 if these trends continue. Key updates in MDD2 include: (i) codings of US state, country, continent, and biogeographic realm geographic categories for each species; (ii) a comprehensive nomenclatural dataset for 50,230 valid and synonymous species-rank names, curated with type locality and specimen information for the first time; and (iii) integration between the MDD and the databases Hesperomys and Batnames for greater data accuracy and completeness. These updates bridge critical gaps in the taxonomic and nomenclatural information needed for ongoing revisions and assessments of mammalian species diversity. Using these data, we evaluate temporal and geographic trends over the past 267 yr, identifying 4 major time periods of change in mammalian taxonomy and nomenclature: (i) the initial monographic description of traditionally charismatic species (1758 to 1880); (ii) the peak of descriptive taxonomy, describing subspecies, and publishing in journals (1881 to 1939); (iii) the shift toward revisionary taxonomy and recognizing polytypic species (1940 to 1999); and (iv) the current technology-driven period of integrative revisionary taxonomy (2000 to present). Geographically, new species recognition since MSW3 has been concentrated in equatorial, mountainous, and island regions—highlighting areas of high mammal endemism (e.g., Madagascar, Philippines, Andes, East Africa, Himalayas, Atlantic Forest). However, gaps in 21st-century taxonomic activity are identified in West and Central Africa, India, and some parts of Indonesia. Additionally, lagging conservation assessments are alarming, with 25% of the MDD2-recognized mammal species allocated to the “understudied” conservation threat categories of Data Deficient (11%) or Not Evaluated (14%), underscoring the need for greater taxonomic integration with conservation organizations. Governance advancements in MDD2 include the establishment of external taxonomic subcommittees to guide data collection and curation, a rewritten website that improves access and scalability, a cross-platform mobile application that provides offline access, and new partnerships to continue linking MDD data to global biodiversity infrastructure. By providing up-to-date mammalian taxonomic and nomenclatural data—including links to the text of original name descriptions, type localities, and type specimen collections—the MDD provides an integrative resource for mammalogists and conservationists to more easily track the status of their study organisms.
Overview
AI snapshot
Written from the paper’s full text.
TL;DR
MDD2 catalogs 6,759 living and recently extinct mammal species, a net increase of 4.1% over MDD1 and 24.8% over MSW3, alongside 50,230 species-rank names and new geographic/nomenclatural metadata. It documents 267 years of taxonomic change and projects ~7,079 mammal species by 2030 and ~8,376 by 2050 if recent trends continue.
Key findings
- MDD2 recognizes 6,759 valid mammal species (6,629 wild extant; 113 recently extinct; 17 domestic), which is 267 more (+4.1%) than MDD1 and 1,343 more (+24.8%) than MSW3; the 2024-1 IUCN Red List lists 5,983 species, 776 fewer (−11.5%) than MDD2.
- Since 1980, MDD2 identifies a net increase of 2,754 species (+68.8%; 3,149 splits + de novo, 395 lumps) at ~65 species/yr; linear regression across 14 compendia gave y = 64.86x − 124587.19, R² = 0.98, projecting ~7,079 species by 2030, ~7,727 by 2040, ~8,376 by 2050, and ~11,619 by 2100.
- MDD2 includes 50,230 species-rank names: 28,382 available names, 2,127 unavailable names, 3,445 spelling variants, 16,182 name combinations, and 435 other subsequent uses; type localities are recorded for 99.6% of originally available names and all valid species, and type specimen locations for 73.3% of originally available names (87.9% of valid species).
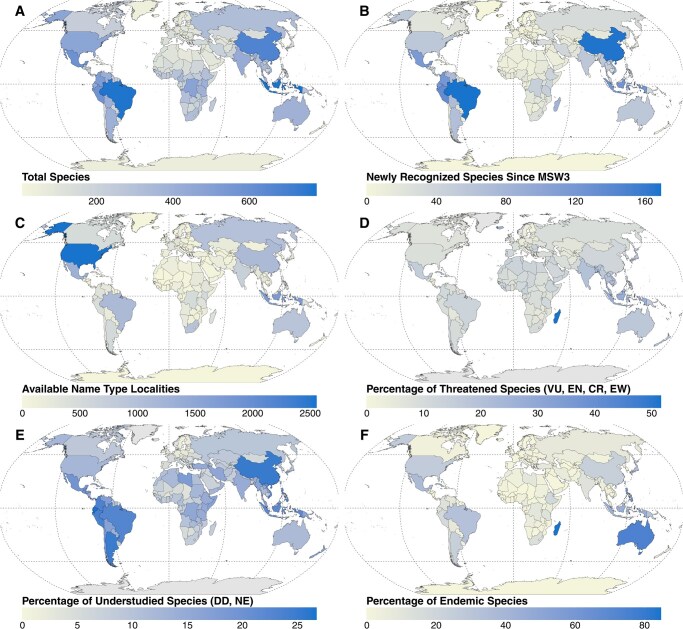
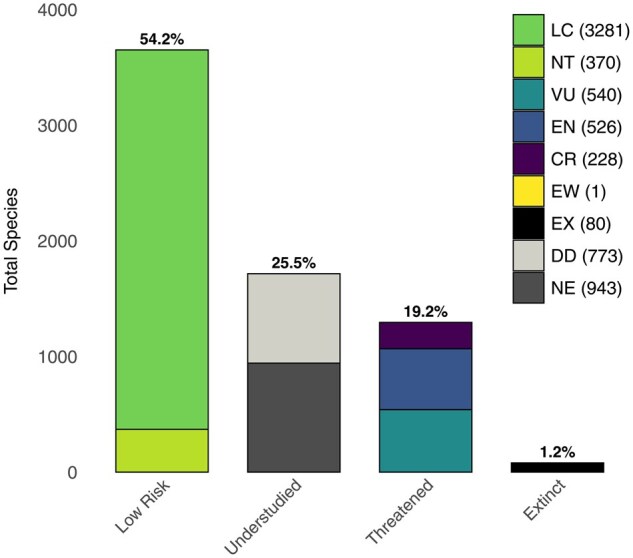
- Of 6,742 wild mammal species, 25.5% (1,716) are “understudied” on the IUCN Red List—11.5% (773) Data Deficient and 14.0% (943) Not Evaluated—while 19.2% (1,295) are threatened (VU, EN, CR, EW); new species recognition since MSW3 is concentrated in equatorial, mountainous, and island regions, with gaps in West and Central Africa, India, and parts of Indonesia.
Methods
- MDD2 used a taxonomic, nomenclatural, and geographic cutoff of 15 August 2024; it compared MDD2 taxonomy to 14 major compendia since 1980 and all 18 MDD versions, then used linear regression of species totals to project future recognized richness.
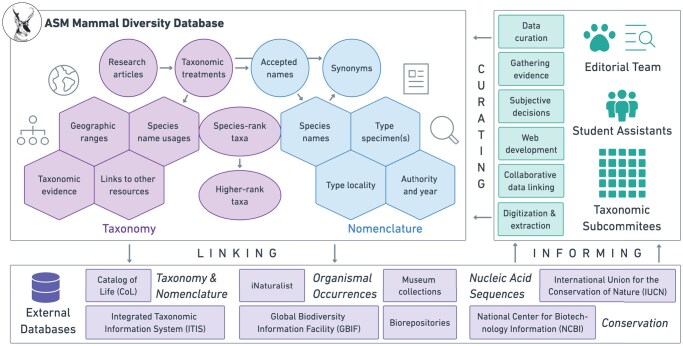
- Curation tracked peer-reviewed mammal taxonomy, mostly following the most recent published evidence, with documented subjective decisions; nomenclatural data were integrated with Hesperomys and Batnames, and geographic distributions were coded for countries/offshore territories, country subregions (US states only), continents, and 8 terrestrial biogeographic realms.
- Analyses summarized name descriptions since 1758, type localities, species richness, endemism, conservation status, and website/database usage; R code and supplementary data are available via GitHub and Zenodo.
Limitations
- The paper states that future richness projections are based on compendia totals rather than year-by-year split, lump, and de novo data; it notes the 2100 estimate “seems more far-fetched” because trends likely level off, and that MDD has refrained from tracking subspecies due to inconsistent use.
- The paper states that type specimen coverage is nearly complete for North America but incomplete for many names likely housed in European collections, and that some taxonomic decisions are subjective or can be “ricochetal” amid conflicting literature.
- Evident from the text: country subregions are implemented only for the United States; type-locality coordinates are available for just 9.8% of available names and 27.4% of valid species; and MDD recognizes 17 domestic forms as species despite acknowledging this contradicts much evolutionary and taxonomic research.
Model-written summary. Check it against the paper before relying on it.
Integrity signals
Registry
Cites
Statistics
Figures
Verification
Claims the paper makes
76 Own result · 60 No basis given · 37 Own interpretation · 32 No full text of the sources · 18 Sources not found · 17 Partly supported · 12 Own method · 10 Not checked yet · 4 Supported · 1 Supported so far · 1 Couldn’t confirm · accuracy not yet measured
The cited sources support only part of this claim — read each source’s verdict below.
In the paper
“The IUCN Red List subsequently provided the sole source of digital range maps for mammals until Marsh et al. (2022) digitized range maps aligned to 3 alternative taxonomies: HMW (6,253 species); CMW (6,431 species); and MDD version 1.2 (6,362 species; note that each taxonomy also contains unmapped species that are extinct or data deficient—see tables later in the text Tables 1 and 2).”
§ How many mammal species are there now? Updates and trends in taxonomic, nomenclatural, and geographic knowledge > Abstract
What the sources say
- Partly supportedcites Marsh et al. 2022 sourceExperimental — accuracy not yet measured
Split into 2 atoms — 1 confirmed, 1 partially supported, 0 disputed, 0 misattributed, 0 unverifiable. Expand the claim to see per-atom verdicts.
plain- Asserted: passes — The authors put it forward as true.
- Checkable: passes — It can be checked against evidence.
- Load-bearing: passes — The paper’s conclusions depend on it.
- Based: passes — The paper gives a reason why it holds.
- Partly supported
Every source the paper cites for this claim was checked and supports it.
In the paper
“Comparison among these datasets documents how the geographic concepts of species-rank mammal taxa have changed over relatively short time periods, mostly from taxonomic changes, in contrast to actual range shifts over longer periods (but see Pacifici et al. 2020).”
§ How many mammal species are there now? Updates and trends in taxonomic, nomenclatural, and geographic knowledge > Abstract
What the sources say
- Supportedcites Pacifici et al. 2020 source
The citation is introduced by “but see,” offering Pacifici et al. as a counterexample to the contrast in the citing sentence, not as support for its claim about taxonomic changes. The Introduction compares mammal distributions in the 1970s and 2017, and the Results report substantial range contractions and expansions over that interval. The Methods say the authors checked that observed differences reflected real changes rather than improved knowledge. (LLM, conf=0.90)
plaindirect- Asserted: passes — The authors put it forward as true.
- Checkable: passes — It can be checked against evidence.
- Load-bearing: passes — The paper’s conclusions depend on it.
- Based: passes — The paper gives a reason why it holds.
- Supported
Every source the paper cites for this claim was checked and supports it.
In the paper
“In particular, integration of nomenclatural data from Hesperomys (Zijlstra 2024)—an online database cataloging the nomenclature of living and extinct animals, with a focus on mammals—has greatly strengthened the MDD.”
§ How many mammal species are there now? Updates and trends in taxonomic, nomenclatural, and geographic knowledge > Methods
What the sources say
- Supportedcites Zijlstra 2024 source
The Zenodo record’s Description (no page given) identifies Hesperomys as an online database of taxonomy and nomenclature, focused on mammals, and describes its export of name data. The citation identifies the source of those data; the statement that their integration greatly strengthened the MDD is the citing authors’ assessment, not a finding attributed to this record. (LLM, conf=0.88)
boosteddirect- Asserted: passes — The authors put it forward as true.
- Checkable: passes — It can be checked against evidence.
- Load-bearing: unclear — It is unclear whether the paper’s conclusions depend on it.
- Based: passes — The paper gives a reason why it holds.
- Supported
The cited sources support only part of this claim — read each source’s verdict below.
In the paper
“MDD2 includes a newly curated list of species-rank synonyms—created in collaboration with Hesperomys (Zijlstra 2024)—for every mammal species in the MDD, totaling 50,230 synonyms.”
§ How many mammal species are there now? Updates and trends in taxonomic, nomenclatural, and geographic knowledge > Methods > Nomenclatural metadata.
What the sources say
- Partly supportedcites Zijlstra 2024 sourceExperimental — accuracy not yet measured
The dataset Description (no page number) identifies Hesperomys as a mammal-focused taxonomy and nomenclature database with data on names, supporting its identification in the citation. It does not state that Hesperomys collaborated on MDD2’s newly curated synonym list or verify the figure of 50,230 synonyms. (LLM, conf=0.82)
plain- Asserted: passes — The authors put it forward as true.
- Checkable: passes — It can be checked against evidence.
- Load-bearing: unclear — It is unclear whether the paper’s conclusions depend on it.
- Based: passes — The paper gives a reason why it holds.
- Partly supported
The cited sources support only part of this claim — read each source’s verdict below.
In the paper
“Some mammal species appear capable of retaining phenotypic and ecological distinctiveness from related species even in the face of substantial introgressive hybridization (e.g., mustelids, felids, bats; Li et al. 2019; Colella et al. 2021; Foley et al. 2024).”
§ How many mammal species are there now? Updates and trends in taxonomic, nomenclatural, and geographic knowledge > Discussion > Mammalian systematics in the modern era.
What the sources say
- Not matchedcites Li et al. 2019
Couldn’t be matched to a paper in Crossref, so it can’t be checked.
- Not checked — no full text of the sourcecites Colella et al. 2021 source
- Partly supportedcites Foley et al. 2024 sourceExperimental — accuracy not yet measured
The Results section (‘A link between introgression and swarming behavior?’; page unavailable) reports exceptionally pervasive introgression among distinct Myotis bat species, including species from divergent clades. It does not establish that those species retain phenotypic and ecological distinctiveness despite that introgression. The other mammal examples have separate citations and are not attributed to Foley et al. alone. (LLM, conf=0.84)
hedged- Asserted: passes — The authors put it forward as true.
- Checkable: passes — It can be checked against evidence.
- Load-bearing: unclear — It is unclear whether the paper’s conclusions depend on it.
- Based: passes — The paper gives a reason why it holds.
- Not matched
The cited sources support only part of this claim — read each source’s verdict below.
In the paper
“For example, comparative genomic evidence in cats (Bredemeyer et al. 2021) and house mice (Forejt et al. 2021) suggests that some regions on the X chromosome are “protected” from recombination, causing hybrid male offspring to be sterile if altered, thereby reinforcing the distinction among lineages.”
§ How many mammal species are there now? Updates and trends in taxonomic, nomenclatural, and geographic knowledge > Discussion > Mammalian systematics in the modern era.
What the sources say
- Partly supportedcites Bredemeyer et al. 2021 sourceExperimental — accuracy not yet measured
Split into 2 atoms — 0 confirmed, 2 partially supported, 0 disputed, 0 misattributed, 0 unverifiable. Expand the claim to see per-atom verdicts.
- Not checked — no full text of the sourcecites Forejt et al. 2021 source
hedgeddirect- Asserted: passes — The authors put it forward as true.
- Checkable: passes — It can be checked against evidence.
- Load-bearing: unclear — It is unclear whether the paper’s conclusions depend on it.
- Based: passes — The paper gives a reason why it holds.
- Partly supported
The cited sources that could be checked couldn’t confirm or dispute this claim.
In the paper
“Most specimens from tropical regions are housed in European and North American institutions (see figure 2 in Heberling et al. 2021).”
§ How many mammal species are there now? Updates and trends in taxonomic, nomenclatural, and geographic knowledge > Discussion > Patterns and shortfalls in global mammal biodiversity.
What the sources say
- Could not verifycites Heberling et al. 2021 sourceExperimental — accuracy not yet measured
The Results section and Fig. 2 caption (page unavailable) compare where biodiversity is studied with where researchers are affiliated; they do not show where specimens are housed. The Discussion says specimens have historically been held in museums, but gives no geographic breakdown of tropical specimens. Searches for tropical specimen holdings and institutional locations found no passage establishing the claimed majority. (LLM, conf=0.78)
plain- Asserted: passes — The authors put it forward as true.
- Checkable: passes — It can be checked against evidence.
- Load-bearing: unclear — It is unclear whether the paper’s conclusions depend on it.
- Based: passes — The paper gives a reason why it holds.
- Could not verify
The cited sources support only part of this claim — read each source’s verdict below.
In the paper
“This is most evident in parts of Africa, Asia, and South America, such as West and Central Africa, the Amazon Basin, Central Asia, most of India, and some Indonesian islands (e.g., Java, Sumatra, Borneo), supporting calls for regional taxonomic work (e.g., Klopper et al. 2002; Chatterjee et al. 2020; Monadjem et al. 2024).”
§ How many mammal species are there now? Updates and trends in taxonomic, nomenclatural, and geographic knowledge > Discussion > Patterns and shortfalls in global mammal biodiversity.
What the sources say
- Not checked — no full text of the sourcecites Klopper et al. 2002 source
- Not checked — no full text of the sourcecites Chatterjee et al. 2020 source
- Partly supportedcites Monadjem et al. 2024 sourceExperimental — accuracy not yet measured
The Limitations section identifies under-sampled bat regions in Central and parts of West Africa, supporting the African portion of the sentence. The paper does not address the claimed shortfalls in the Amazon Basin, Central Asia, India, or Indonesian islands; its stated need is for more sampling across Africa. (LLM, conf=0.86)
plaincorrelational- Asserted: passes — The authors put it forward as true.
- Checkable: passes — It can be checked against evidence.
- Load-bearing: passes — The paper’s conclusions depend on it.
- Based: passes — The paper gives a reason why it holds.
Every source the paper cites for this claim was checked and supports it.
In the paper
“Parsons et al. (2022) used mitochondrial genetic data from a subset of 4,310 mammal species to find which covariates best predict unrecognized cryptic species, with body mass and range size ranking as the top predictors.”
§ How many mammal species are there now? Updates and trends in taxonomic, nomenclatural, and geographic knowledge > Discussion > Patterns and shortfalls in global mammal biodiversity.
What the sources say
- Supportedcites Parsons et al. 2022 source
The Results (Dataset; page unavailable) report mitochondrial COI and cytb sequences from 4,310 recognized mammal species. The Discussion (Predictors of Hidden Species in Mammals; page unavailable) identifies body mass as predictive of hidden species and says range area is nearly as predictive. (LLM, conf=0.92)
plaincorrelational- Asserted: passes — The authors put it forward as true.
- Checkable: passes — It can be checked against evidence.
- Load-bearing: passes — The paper’s conclusions depend on it.
- Based: passes — The paper gives a reason why it holds.
- Supported
Every source the paper cites for this claim was checked and supports it.
In the paper
“Rodents, bats, and eulipotyphlans are predicted to be the largest sources of unrecognized mammal species despite the high rate of new species recognition in these clades.”
§ How many mammal species are there now? Updates and trends in taxonomic, nomenclatural, and geographic knowledge > Discussion > Patterns and shortfalls in global mammal biodiversity.
What the sources say
- Supportedcites Parsons et al. 2022 source
The Results (Species Delimitation; page not provided) say that most hidden species are likely to occur in Chiroptera, Rodentia, and Eulipotyphla, and that this finding is consistent with recent mammal species descriptions. The Discussion (Predictors of Hidden Species in Mammals; page not provided) also says recent descriptions have concentrated in systems matching the model’s predictions. (LLM, conf=0.91)
plaincorrelational- Asserted: passes — The authors put it forward as true.
- Checkable: passes — It can be checked against evidence.
- Load-bearing: passes — The paper’s conclusions depend on it.
- Based: passes — The paper gives a reason why it holds.
- Supported
- Probably not a substantial claim. 70
- It may state two separate claims as one. 93
- The quote only partly states this claim. 2
The cited sources support only part of this claim — read each source’s verdict below.
In the paper
“A further collaboration with Yale University researchers enabled the digitization of geographic range maps as polygon shapefiles for all mammal species, as matched to the taxonomies of MDD v1.2, HMW series, and CMW (see Marsh et al. 2022 and map downloads updated to MDD v1.4 via the “mddmaps” R package; Robles-Fernández 2024).”
§ How many mammal species are there now? Updates and trends in taxonomic, nomenclatural, and geographic knowledge > Methods
What the sources say
- Partly supportedcites Marsh et al. 2022 sourceExperimental — accuracy not yet measured
The Introduction and Materials and Methods describe digitized range maps harmonized to MDD v1.2, HMW, and CMW and provided as shapefiles; the Biosketch identifies the lead author as based at Yale University. However, Table 1 and the Harmonisation between data sources section state that a few species in each taxonomy lack georeferenced range maps, so the claim that shapefiles were produced for all species is too absolute. (LLM, conf=0.87)
- Not matchedcites Robles-Fernández 2024
Couldn’t be matched to a paper in Crossref, so it can’t be checked.
plaindirect- Asserted: passes — The authors put it forward as true.
- Checkable: passes — It can be checked against evidence.
- Load-bearing: fails — The paper’s conclusions may not depend on it.
- Based: passes — The paper gives a reason why it holds.
Probably not a substantial claim. The paper’s conclusions may not depend on it.
- Partly supported
The cited sources support only part of this claim — read each source’s verdict below.
In the paper
“These changes have been controversial within the mammalogical community, and many specialists have subsequently reverted to the taxonomy presented in MSW3 (e.g., Holbrook 2013; Gutiérrez and Garbino 2018).”
§ How many mammal species are there now? Updates and trends in taxonomic, nomenclatural, and geographic knowledge > Methods > Taxonomic decision making.
What the sources say
- Not checked — no full text of the sourcecites Holbrook 2013 source
- Partly supportedcites Gutiérrez and Garbino 2018 sourceExperimental — accuracy not yet measured
The Introduction and the section on objective criteria describe recent criticism of Groves and Grubb’s ungulate taxonomy and identify several controversial aspects of it. They do not report that many specialists subsequently reverted to the taxonomy in MSW3 (searched: MSW3 and reversion to earlier taxonomy). Our copy provides no page numbers for these passages. (LLM, conf=0.87)
plain- Asserted: passes — The authors put it forward as true.
- Checkable: passes — It can be checked against evidence.
- Load-bearing: unclear — It is unclear whether the paper’s conclusions depend on it.
- Based: passes — The paper gives a reason why it holds.
It may state two separate claims as one.
The cited sources support only part of this claim — read each source’s verdict below.
In the paper
“Recognition of these domestic forms as distinct species by the MDD contradicts much of the evolutionary and taxonomic research on these taxa, which has shown that the wild and domestic forms should be considered a single species in most cases (e.g., Driscoll et al. 2007; Groenen 2016; Jackson et al. 2019, 2021).”
§ How many mammal species are there now? Updates and trends in taxonomic, nomenclatural, and geographic knowledge > Methods > Conservation status.
What the sources say
- Not checked — no full text of the sourcecites Driscoll et al. 2007 source
- Partly supportedcites Groenen 2016 sourceExperimental — accuracy not yet measured
Split into 2 atoms — 1 confirmed, 1 partially supported, 0 disputed, 0 misattributed, 0 unverifiable. Expand the claim to see per-atom verdicts.
- Not matchedcites Jackson et al. 2019, 2021
Couldn’t be matched to a paper in Crossref, so it can’t be checked.
plaindirect- Asserted: passes — The authors put it forward as true.
- Checkable: passes — It can be checked against evidence.
- Load-bearing: unclear — It is unclear whether the paper’s conclusions depend on it.
- Based: passes — The paper gives a reason why it holds.
It may state two separate claims as one.
The cited sources support only part of this claim — read each source’s verdict below.
In the paper
“The recent and rapid net increase in recognized mammal species is comparable to activity in other major clades of life, for example, reptiles: +49% from 1995 to 2024 (Uetz 2016; Uetz et al. 2024); amphibians: +60% from 1985 to 2024 (AmphibiaWeb 2024); foraminifera: +21% from 1987 to 2020 (Hayward et al. 2020).”
§ How many mammal species are there now? Updates and trends in taxonomic, nomenclatural, and geographic knowledge > Discussion > Mammalian systematics in the modern era.
What the sources say
- Not matchedcites Uetz 2016
Couldn’t be matched to a paper in Crossref, so it can’t be checked.
- Partly supportedcites Uetz et al. 2024 sourceExperimental — accuracy not yet measured
Split into 2 atoms — 0 confirmed, 1 partially supported, 0 disputed, 0 misattributed, 1 unverifiable. Expand the claim to see per-atom verdicts.
- Not matchedcites AmphibiaWeb 2024
Couldn’t be matched to a paper in Crossref, so it can’t be checked.
plaincorrelational- Asserted: passes — The authors put it forward as true.
- Checkable: passes — It can be checked against evidence.
- Load-bearing: unclear — It is unclear whether the paper’s conclusions depend on it.
- Based: passes — The paper gives a reason why it holds.
It may state two separate claims as one.
- Not matched
The cited sources support only part of this claim — read each source’s verdict below.
In the paper
“Historically, much of the mammalogical research done in Global South countries was done by researchers from Europe and North America, leading to limited taxonomic research funding and access to museum specimens for Global South researchers (Salvador et al. 2022).”
§ How many mammal species are there now? Updates and trends in taxonomic, nomenclatural, and geographic knowledge > Discussion > Patterns and shortfalls in global mammal biodiversity.
What the sources say
- Partly supportedcites Salvador et al. 2022 sourceExperimental — accuracy not yet measured
The Discussion’s Geography section says developing countries lack taxonomists, infrastructure, and funding, and the Abstract identifies lack of research funding especially in the Global South. Neither passage establishes that European and North American researchers historically conducted much of the mammalogical research in Global South countries, that this caused the funding gap, or that Global South researchers lack access to museum specimens. Page numbers were not supplied in our copy. (LLM, conf=0.86)
plaindirect- Asserted: passes — The authors put it forward as true.
- Checkable: passes — It can be checked against evidence.
- Load-bearing: unclear — It is unclear whether the paper’s conclusions depend on it.
- Based: passes — The paper gives a reason why it holds.
It may state two separate claims as one.
- Partly supported
The cited sources support only part of this claim — read each source’s verdict below.
In the paper
“These shortfalls pose hurdles to zoonotic disease studies and other biomedical research (Upham et al. 2021) as well as to the implementation of species conservation and management plans (Senior et al. 2024).”
§ How many mammal species are there now? Updates and trends in taxonomic, nomenclatural, and geographic knowledge > Discussion > Patterns and shortfalls in global mammal biodiversity.
What the sources say
- Supportedcites Upham et al. 2021 source
The Introduction says digitally disconnected biodiversity data prevent scientists from discovering and using knowledge needed in infectious diseases, epidemiology, and virology. “Illuminating biodiversity dark data” adds that synthesising mammal host–virus information can take years rather than the weeks needed during an outbreak. The conservation-planning clause is attributed to a different source and is not part of this verdict. (LLM, conf=0.92)
- Partly supportedcites Senior et al. 2024 sourceExperimental — accuracy not yet measured
The Abstract (page unavailable) reports that conservation interventions are insufficient or absent for many threatened species, and the Main section calls better documentation a critical first step toward improving conservation practices. This supports a broad link between the shortfalls and conservation action, but the paper does not specifically assess whether they hinder implementation of species conservation or management plans. The biomedical-research portion is attributed to a different citation and is not judged here. (LLM, conf=0.78)
plaindirect- Asserted: passes — The authors put it forward as true.
- Checkable: passes — It can be checked against evidence.
- Load-bearing: passes — The paper’s conclusions depend on it.
- Based: passes — The paper gives a reason why it holds.
It may state two separate claims as one.
- Supported
The cited sources support only part of this claim — read each source’s verdict below.
In the paper
“Consistent with this finding is the observation that 17% to 93% of the genomes of European Myotis bats apparently have introgressive origins (Foley et al. 2024), suggesting that many genomic regions can be freely exchanged as long as certain other regions are conserved, protecting the distinctiveness of a given species.”
§ How many mammal species are there now? Updates and trends in taxonomic, nomenclatural, and geographic knowledge > Discussion > Mammalian systematics in the modern era.
What the sources say
- Partly supportedcites Foley et al. 2024 sourceExperimental — accuracy not yet measured
Split into 2 atoms — 0 confirmed, 2 partially supported, 0 disputed, 0 misattributed, 0 unverifiable. Expand the claim to see per-atom verdicts.
hedgedconditional- Asserted: passes — The authors put it forward as true.
- Checkable: passes — It can be checked against evidence.
- Load-bearing: passes — The paper’s conclusions depend on it.
- Based: passes — The paper gives a reason why it holds.
It may state two separate claims as one.
- Partly supported
The sources with a verdict support this claim; the rest weren’t checked yet, have no full text we could read, or their verdicts aren’t rated yet.
In the paper
“This is particularly true for mammals given that they can serve as sentinels of change in threatened ecosystems (Moore 2008; Marneweck et al. 2022) or key nodes in pathogen-sharing networks (Plowright et al. 2021; Venkatesan 2023; Weber et al. 2023).”
§ How many mammal species are there now? Updates and trends in taxonomic, nomenclatural, and geographic knowledge > Discussion > Patterns and shortfalls in global mammal biodiversity.
What the sources say
- Not checked — no full text of the sourcecites Moore 2008 source
- Not checked — no full text of the sourcecites Marneweck et al. 2022 source
- Supportedcites Plowright et al. 2021 source
The citation to Plowright et al. is attached to the pathogen-sharing part of the sentence, not the sentinel claim. The Introduction describes wildlife hosts sustaining pathogens and land-use change creating opportunities for spread between species; the Land use-induced spillover section identifies bats as starting points in spillover cascades and names other mammalian groups as potential reservoirs. This supports the claim in substance, although the paper does not use network terminology. (LLM, conf=0.84)
plaincorrelational- Asserted: passes — The authors put it forward as true.
- Checkable: passes — It can be checked against evidence.
- Load-bearing: fails — The paper’s conclusions may not depend on it.
- Based: passes — The paper gives a reason why it holds.
Probably not a substantial claim. The paper’s conclusions may not depend on it. It may state two separate claims as one.
The cited sources support only part of this claim — read each source’s verdict below.
In the paper
“However, as discussed throughout this article, taxonomy and nomenclature are by no means static—the creation of species lists is plagued by gaps in biodiversity knowledge (i.e., the Linnean and Wallacean shortfalls), differing taxonomic opinions, failure to track and digitally integrate those changing taxonomies, and inconsistencies in how the ICZN Code is implemented (Garnett and Christidis 2017;”
§ How many mammal species are there now? Updates and trends in taxonomic, nomenclatural, and geographic knowledge > Discussion > Mammal taxonomy in conservation and biodiversity infrastructure.
What the sources say
- Not checked — no full text of the sourcecites Garnett and Christidis 2017 source
- Not matchedcites Raposo et al. 2017, 2021
Couldn’t be matched to a paper in Crossref, so it can’t be checked.
- Partly supportedcites Franz and Sterner 2018 sourceExperimental — accuracy not yet measured
Split into 2 atoms — 1 confirmed, 1 partially supported, 0 disputed, 0 misattributed, 0 unverifiable. Expand the claim to see per-atom verdicts.
plaindirect- Asserted: passes — The authors put it forward as true.
- Checkable: passes — It can be checked against evidence.
- Load-bearing: passes — The paper’s conclusions depend on it.
- Based: passes — The paper gives a reason why it holds.
It may state two separate claims as one.
The cited sources support only part of this claim — read each source’s verdict below.
In the paper
“For example, recognized Giraffa diversity has ranged from 1 to 11 species, but most workers now recognize 4 species based on integrative taxonomic approaches (Winter et al. 2018; Petzold and Hassanin 2020; Coimbra et al. 2021; Kargopoulos et al. 2024).”
§ How many mammal species are there now? Updates and trends in taxonomic, nomenclatural, and geographic knowledge > Discussion > Mammal taxonomy in conservation and biodiversity infrastructure.
What the sources say
- Partly supportedcites Winter et al. 2018 sourceExperimental — accuracy not yet measured
The Introduction and Discussion support a historical one-species classification and this paper’s evidence for four species. But the Introduction says up to eleven *subspecies*, not eleven species; the Discussion mentions proposals of up to eight species. The paper also says the four-species conclusion may not be fully accepted and calls for revision of the IUCN’s one-species classification, so it does not support the claim that most workers now recognize four. (LLM, conf=0.88)
- Partly supportedcites Petzold and Hassanin 2020 sourceExperimental — accuracy not yet measured
The Introduction (page unavailable) documents a historical one-species classification and reports that two studies proposed four species. It does not document a range extending to 11 species or say that most workers now recognize four; instead, it describes the four-species proposal as controversial. The Abstract and conservation-management conclusion (pages unavailable) favor three species based on this paper’s analyses. (LLM, conf=0.87)
- Not checked — no full text of the sourcecites Coimbra et al. 2021 source
plaindirect- Asserted: passes — The authors put it forward as true.
- Checkable: passes — It can be checked against evidence.
- Load-bearing: unclear — It is unclear whether the paper’s conclusions depend on it.
- Based: passes — The paper gives a reason why it holds.
It may state two separate claims as one.
- Partly supported
The cited sources support only part of this claim — read each source’s verdict below.
In the paper
“However, this practice can overlook finer-scale intraspecific diversity (Des Roches et al. 2021) and taxonomically unrecognized species in understudied taxa (i.e., “dark extinctions”; Boehm and Cronk 2021), resulting in the loss of cryptic biodiversity (see review by Hending 2025).”
§ How many mammal species are there now? Updates and trends in taxonomic, nomenclatural, and geographic knowledge > Discussion > Mammal taxonomy in conservation and biodiversity infrastructure.
What the sources say
- Not checked — no full text of the sourcecites Des Roches et al. 2021 source
- Not checked — no full text of the sourcecites Boehm and Cronk 2021 source
- Partly supportedcites Hending 2025 sourceExperimental — accuracy not yet measured
The Introduction (‘Why do many cryptic species remain undetected?’; page unavailable) says morphologically indistinguishable species have historically been overlooked. ‘Cryptic species recognition’ says visually based assessments underestimate biodiversity and can misinform conservation, while ‘Recent taxonomic description’ identifies greater extinction risk for newly recognized species. These passages support the concern behind the citation, but do not establish that overlooking them has resulted in an actual loss of cryptic biodiversity. (LLM, conf=0.83)
plaindirect- Asserted: passes — The authors put it forward as true.
- Checkable: passes — It can be checked against evidence.
- Load-bearing: passes — The paper’s conclusions depend on it.
- Based: passes — The paper gives a reason why it holds.
It may state two separate claims as one.
The paper states this without a source or data behind it here, so there is nothing to check it against. The quote shows it is in the paper.
In the paper
“a rewritten website that improves access and scalability”
§ How many mammal species are there now? Updates and trends in taxonomic, nomenclatural, and geographic knowledge > Abstract
plaindirect- Asserted: passes — The authors put it forward as true.
- Checkable: passes — It can be checked against evidence.
- Load-bearing: fails — The paper’s conclusions may not depend on it.
- Based: passes — The paper gives a reason why it holds.
Probably not a substantial claim. The paper’s conclusions may not depend on it.
None of the sources cited for this claim have been checked yet.
In the paper
“the American Society of Mammalogists launched the Mammal Diversity Database (MDD) in 2018, which then recognized ∼20% more mammal species (+1,251 and –172 species) compared to the previous authoritative compendium, the Mammal Species of the World, third edition (MSW3; Wilson and Reeder 2005; Burgin et al. 2018).”
§ How many mammal species are there now? Updates and trends in taxonomic, nomenclatural, and geographic knowledge > Abstract
What the sources say
- Not matchedcites Wilson and Reeder 2005
Couldn’t be matched to a paper in Crossref, so it can’t be checked.
- Not checked — no full text of the sourcecites Burgin et al. 2018 source
plain- Asserted: passes — The authors put it forward as true.
- Checkable: passes — It can be checked against evidence.
- Load-bearing: passes — The paper’s conclusions depend on it.
- Based: passes — The paper gives a reason why it holds.
It may state two separate claims as one.
- Not matched
A result the paper reports from its own data — it cites no other source for it, so there is none to check. The quote shows it is in the paper.
In the paper
“highlighting areas of high mammal endemism (e.g., Madagascar, Philippines, Andes, East Africa, Himalayas, Atlantic Forest)”
§ How many mammal species are there now? Updates and trends in taxonomic, nomenclatural, and geographic knowledge > Abstract
plain- Asserted: passes — The authors put it forward as true.
- Checkable: passes — It can be checked against evidence.
- Load-bearing: unclear — It is unclear whether the paper’s conclusions depend on it.
- Based: passes — The paper gives a reason why it holds.
It may state two separate claims as one.
The paper states this without a source or data behind it here, so there is nothing to check it against. The quote shows it is in the paper.
In the paper
“Governance advancements in MDD2 include the establishment of external taxonomic subcommittees to guide data collection and curation”
§ How many mammal species are there now? Updates and trends in taxonomic, nomenclatural, and geographic knowledge > Abstract
plaindirect- Asserted: passes — The authors put it forward as true.
- Checkable: passes — It can be checked against evidence.
- Load-bearing: fails — The paper’s conclusions may not depend on it.
- Based: passes — The paper gives a reason why it holds.
Probably not a substantial claim. The paper’s conclusions may not depend on it.
The paper states this without a source or data behind it here, so there is nothing to check it against. The quote shows it is in the paper.
In the paper
“a cross-platform mobile application that provides offline access”
§ How many mammal species are there now? Updates and trends in taxonomic, nomenclatural, and geographic knowledge > Abstract
plain- Asserted: passes — The authors put it forward as true.
- Checkable: passes — It can be checked against evidence.
- Load-bearing: fails — The paper’s conclusions may not depend on it.
- Based: passes — The paper gives a reason why it holds.
Probably not a substantial claim. The paper’s conclusions may not depend on it.
The paper states this without a source or data behind it here, so there is nothing to check it against. The quote shows it is in the paper.
In the paper
“and new partnerships to continue linking MDD data to global biodiversity infrastructure”
§ How many mammal species are there now? Updates and trends in taxonomic, nomenclatural, and geographic knowledge > Abstract
plaincorrelational- Asserted: passes — The authors put it forward as true.
- Checkable: passes — It can be checked against evidence.
- Load-bearing: fails — The paper’s conclusions may not depend on it.
- Based: passes — The paper gives a reason why it holds.
Probably not a substantial claim. The paper’s conclusions may not depend on it.
A result the paper reports from its own data — it cites no other source for it, so there is none to check. The quote shows it is in the paper.
In the paper
“identifying 4 major time periods of change in mammalian taxonomy and nomenclature: (i) the initial monographic description of traditionally charismatic species (1758 to 1880); (ii) the peak of descriptive taxonomy, describing subspecies, and publishing in journals (1881 to 1939); (iii) the shift toward revisionary taxonomy and recognizing polytypic species (1940 to 1999); and (iv) the current”
§ How many mammal species are there now? Updates and trends in taxonomic, nomenclatural, and geographic knowledge > Abstract
plain- Asserted: passes — The authors put it forward as true.
- Checkable: passes — It can be checked against evidence.
- Load-bearing: passes — The paper’s conclusions depend on it.
- Based: passes — The paper gives a reason why it holds.
It may state two separate claims as one.
A result the paper reports from its own data — it cites no other source for it, so there is none to check. The quote shows it is in the paper.
In the paper
“the MDD2 taxonomy documents a net increase of 339 (27.6%) genera, 38 (29.5%) families, and 6 (28.6%) orders since C&H1”
§ How many mammal species are there now? Updates and trends in taxonomic, nomenclatural, and geographic knowledge > Results > Taxonomic change and global biodiversity.
plaindirect- Asserted: passes — The authors put it forward as true.
- Checkable: passes — It can be checked against evidence.
- Load-bearing: passes — The paper’s conclusions depend on it.
- Based: passes — The paper gives a reason why it holds.
It may state two separate claims as one.
A result the paper reports from its own data — it cites no other source for it, so there is none to check. The quote shows it is in the paper.
In the paper
“Version 1.11 is also notable because it marked the beginning of collaborations between the MDD and Hesperomys and Batnames, which involved considerable efforts to reconcile information across the 3 databases, leading to many changes in taxonomy (15 de novo; 49 splits; 29 lumps) and nomenclature (e.g., spelling changes to 52 species-rank specific epithets) despite a gap of only 5 mo between MDD v1.”
§ How many mammal species are there now? Updates and trends in taxonomic, nomenclatural, and geographic knowledge > Results > Taxonomic change and global biodiversity.
plaindirect- Asserted: passes — The authors put it forward as true.
- Checkable: passes — It can be checked against evidence.
- Load-bearing: unclear — It is unclear whether the paper’s conclusions depend on it.
- Based: passes — The paper gives a reason why it holds.
It may state two separate claims as one.
A result the paper reports from its own data — it cites no other source for it, so there is none to check. The quote shows it is in the paper.
In the paper
“a net increase of 123 (10.0%) genera and 14 (8.4%) families since MSW3”
§ How many mammal species are there now? Updates and trends in taxonomic, nomenclatural, and geographic knowledge > Results > Taxonomic change and global biodiversity.
plaindirect- Asserted: passes — The authors put it forward as true.
- Checkable: passes — It can be checked against evidence.
- Load-bearing: passes — The paper’s conclusions depend on it.
- Based: passes — The paper gives a reason why it holds.
It may state two separate claims as one.
The paper states this without a source or data behind it here, so there is nothing to check it against. The quote shows it is in the paper.
In the paper
“(however, subspecies of bats are currently only listed in Batnames)”
§ How many mammal species are there now? Updates and trends in taxonomic, nomenclatural, and geographic knowledge > Methods
plain- Asserted: passes — The authors put it forward as true.
- Checkable: passes — It can be checked against evidence.
- Load-bearing: fails — The paper’s conclusions may not depend on it.
- Based: passes — The paper gives a reason why it holds.
Probably not a substantial claim. The paper’s conclusions may not depend on it.
The paper states this without a source or data behind it here, so there is nothing to check it against. The quote shows it is in the paper.
In the paper
“The representatives of 17 mammal species that were domesticated by humans during prehistoric times are considered separate species from their ancestors in the MDD, all but 2 of which (Bos primigenius and the unknown ancestor of Camelus dromedarius) are extant.”
§ How many mammal species are there now? Updates and trends in taxonomic, nomenclatural, and geographic knowledge > Methods > Conservation status.
plain- Asserted: passes — The authors put it forward as true.
- Checkable: passes — It can be checked against evidence.
- Load-bearing: fails — The paper’s conclusions may not depend on it.
- Based: fails — The paper may give no reason why it holds.
Probably not a substantial claim. The paper’s conclusions may not depend on it. The paper may give no reason why it holds. It may state two separate claims as one.
The paper states this without a source or data behind it here, so there is nothing to check it against. The quote shows it is in the paper.
In the paper
“These data were primarily integrated into MDD2 species-rank synonym data, resulting in expanded coverage of type localities, type specimens, and other nomenclatural data detailed below.”
§ How many mammal species are there now? Updates and trends in taxonomic, nomenclatural, and geographic knowledge > Methods
plaindirect- Asserted: passes — The authors put it forward as true.
- Checkable: passes — It can be checked against evidence.
- Load-bearing: fails — The paper’s conclusions may not depend on it.
- Based: passes — The paper gives a reason why it holds.
Probably not a substantial claim. The paper’s conclusions may not depend on it.
The paper states this without a source or data behind it here, so there is nothing to check it against. The quote shows it is in the paper.
In the paper
“The families Callitrichidae and Aotidae were recognized as distinct, while Eschrichtiidae was lumped into Balaenopteridae since MDD1.”
§ How many mammal species are there now? Updates and trends in taxonomic, nomenclatural, and geographic knowledge > Results > Taxonomic change and global biodiversity.
plain- Asserted: passes — The authors put it forward as true.
- Checkable: passes — It can be checked against evidence.
- Load-bearing: unclear — It is unclear whether the paper’s conclusions depend on it.
- Based: passes — The paper gives a reason why it holds.
It may state two separate claims as one.
A result the paper reports from its own data — it cites no other source for it, so there is none to check. The quote shows it is in the paper.
In the paper
“Between MDD1 and MDD2, there were net differences of 37 more genera (1,316 to 1,353) and 1 more family (166 to 167) recognized, with no changes to the 27 orders.”
§ How many mammal species are there now? Updates and trends in taxonomic, nomenclatural, and geographic knowledge > Results > Taxonomic change and global biodiversity.
plain- Asserted: passes — The authors put it forward as true.
- Checkable: passes — It can be checked against evidence.
- Load-bearing: passes — The paper’s conclusions depend on it.
- Based: passes — The paper gives a reason why it holds.
It may state two separate claims as one.
A result the paper reports from its own data — it cites no other source for it, so there is none to check. The quote shows it is in the paper.
In the paper
“The highest number of taxonomic changes between 2 MDD versions occurred between versions 1.1 (March 2019) and 1.2 (September 2020), versions 1.9.1 (June 2022) and 1.10 (December 2022), and versions 1.10 and 1.11 (April 2023)”
§ How many mammal species are there now? Updates and trends in taxonomic, nomenclatural, and geographic knowledge > Results > Taxonomic change and global biodiversity.
plain- Asserted: passes — The authors put it forward as true.
- Checkable: passes — It can be checked against evidence.
- Load-bearing: unclear — It is unclear whether the paper’s conclusions depend on it.
- Based: passes — The paper gives a reason why it holds.
It may state two separate claims as one.
The paper states this without a source or data behind it here, so there is nothing to check it against. The quote shows it is in the paper.
In the paper
“Finally, efforts to coordinate with the ASM Mammal Images Library have aligned taxonomic names and concepts used in the expert-identified images to each new release of the MDD (available for download at https://www.mammalogy.org/image-library).”
§ How many mammal species are there now? Updates and trends in taxonomic, nomenclatural, and geographic knowledge > Methods
plaindirect- Asserted: passes — The authors put it forward as true.
- Checkable: passes — It can be checked against evidence.
- Load-bearing: fails — The paper’s conclusions may not depend on it.
- Based: passes — The paper gives a reason why it holds.
Probably not a substantial claim. The paper’s conclusions may not depend on it.
A result the paper reports from its own data — it cites no other source for it, so there is none to check. The quote shows it is in the paper.
In the paper
“the 2024-1 IUCN Red List includes 5,983 species, which is 776 fewer (–11.5%) than MDD2 despite being released the same year.”
§ How many mammal species are there now? Updates and trends in taxonomic, nomenclatural, and geographic knowledge > Results > Taxonomic change and global biodiversity.
plain- Asserted: passes — The authors put it forward as true.
- Checkable: passes — It can be checked against evidence.
- Load-bearing: passes — The paper’s conclusions depend on it.
- Based: passes — The paper gives a reason why it holds.
It may state two separate claims as one.
The paper states this without a source or data behind it here, so there is nothing to check it against. The quote shows it is in the paper.
In the paper
“The synonym list includes available and unavailable names; spelling variants and name combinations; and names that are associated with currently valid species, subspecies, synonyms, nomina dubia, or species inquirendae.”
§ How many mammal species are there now? Updates and trends in taxonomic, nomenclatural, and geographic knowledge > Methods > Nomenclatural metadata.
plaincorrelational- Asserted: passes — The authors put it forward as true.
- Checkable: passes — It can be checked against evidence.
- Load-bearing: fails — The paper’s conclusions may not depend on it.
- Based: passes — The paper gives a reason why it holds.
Probably not a substantial claim. The paper’s conclusions may not depend on it. It may state two separate claims as one.
A result the paper reports from its own data — it cites no other source for it, so there is none to check. The quote shows it is in the paper.
In the paper
“there were 296 de novo species, 321 split species, 357 lumped species, 11 missing species that were subsequently added (mostly recently extinct and domestic species), 6 removed species (all either extinct species that did not survive recently enough for inclusion, or names now considered unavailable or nomina dubia), 227 generic changes, 17 specific epithet name changes, and 148 spelling changes”
§ How many mammal species are there now? Updates and trends in taxonomic, nomenclatural, and geographic knowledge > Results > Taxonomic change and global biodiversity.
plain- Asserted: passes — The authors put it forward as true.
- Checkable: passes — It can be checked against evidence.
- Load-bearing: unclear — It is unclear whether the paper’s conclusions depend on it.
- Based: passes — The paper gives a reason why it holds.
It may state two separate claims as one.
A result the paper reports from its own data — it cites no other source for it, so there is none to check. The quote shows it is in the paper.
In the paper
“The 18 total releases of the MDD from MDD1 to MDD2 included 15 primary releases (i.e., 1.X and 1.XX releases) and 3 patch releases (i.e., 1.X.X releases) from August 2017 to August 2024”
§ How many mammal species are there now? Updates and trends in taxonomic, nomenclatural, and geographic knowledge > Results > Taxonomic change and global biodiversity.
plain- Asserted: passes — The authors put it forward as true.
- Checkable: passes — It can be checked against evidence.
- Load-bearing: fails — The paper’s conclusions may not depend on it.
- Based: passes — The paper gives a reason why it holds.
Probably not a substantial claim. The paper’s conclusions may not depend on it.
A result the paper reports from its own data — it cites no other source for it, so there is none to check. The quote shows it is in the paper.
In the paper
“6,759 valid mammal species (6,629 wild extant; 113 extinct; 17 domestic)”
§ How many mammal species are there now? Updates and trends in taxonomic, nomenclatural, and geographic knowledge > Results > Taxonomic change and global biodiversity.
plain- Asserted: passes — The authors put it forward as true.
- Checkable: passes — It can be checked against evidence.
- Load-bearing: passes — The paper’s conclusions depend on it.
- Based: passes — The paper gives a reason why it holds.
It may state two separate claims as one.
The paper states this without a source or data behind it here, so there is nothing to check it against. The quote shows it is in the paper.
In the paper
“The 3 most speciose mammal orders are still Rodentia (2,747 species; 536 genera; 35 families), Chiroptera (1,485 species; 236 genera; 21 families), and Eulipotyphla (599 species; 61 genera; 5 families)”
§ How many mammal species are there now? Updates and trends in taxonomic, nomenclatural, and geographic knowledge > Results > Taxonomic change and global biodiversity.
plain- Asserted: passes — The authors put it forward as true.
- Checkable: passes — It can be checked against evidence.
- Load-bearing: unclear — It is unclear whether the paper’s conclusions depend on it.
- Based: passes — The paper gives a reason why it holds.
It may state two separate claims as one.
A result the paper reports from its own data — it cites no other source for it, so there is none to check. The quote shows it is in the paper.
In the paper
“The countries with the highest overall usage during this period were the United States (34.3% of users), Brazil (6.7%), Mexico (6.2%), and China (5.4%), which topped the 12 countries with over 500 users and the 50 countries with over 50 users (see Supplementary Data SD11 for complete usage data).”
§ How many mammal species are there now? Updates and trends in taxonomic, nomenclatural, and geographic knowledge > Results > Website and database usage.
plain- Asserted: passes — The authors put it forward as true.
- Checkable: passes — It can be checked against evidence.
- Load-bearing: fails — The paper’s conclusions may not depend on it.
- Based: passes — The paper gives a reason why it holds.
Probably not a substantial claim. The paper’s conclusions may not depend on it.
- Rests on an assumption: The Google Analytics data accurately reflects the number of unique users and their locations.
A result the paper reports from its own data — it cites no other source for it, so there is none to check. The quote shows it is in the paper.
In the paper
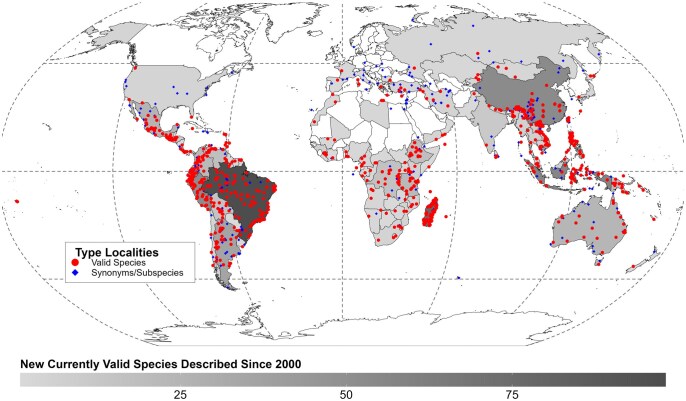
“The countries with the most type localities of valid species described during the 21st century are Brazil (98 names), Madagascar (78), Indonesia (57), China (53), and Peru (52).”
§ How many mammal species are there now? Updates and trends in taxonomic, nomenclatural, and geographic knowledge > Results > Historical taxonomy and nomenclature.
plain- Asserted: passes — The authors put it forward as true.
- Checkable: passes — It can be checked against evidence.
- Load-bearing: unclear — It is unclear whether the paper’s conclusions depend on it.
- Based: passes — The paper gives a reason why it holds.
It may state two separate claims as one.
A result the paper reports from its own data — it cites no other source for it, so there is none to check. The quote shows it is in the paper.
In the paper
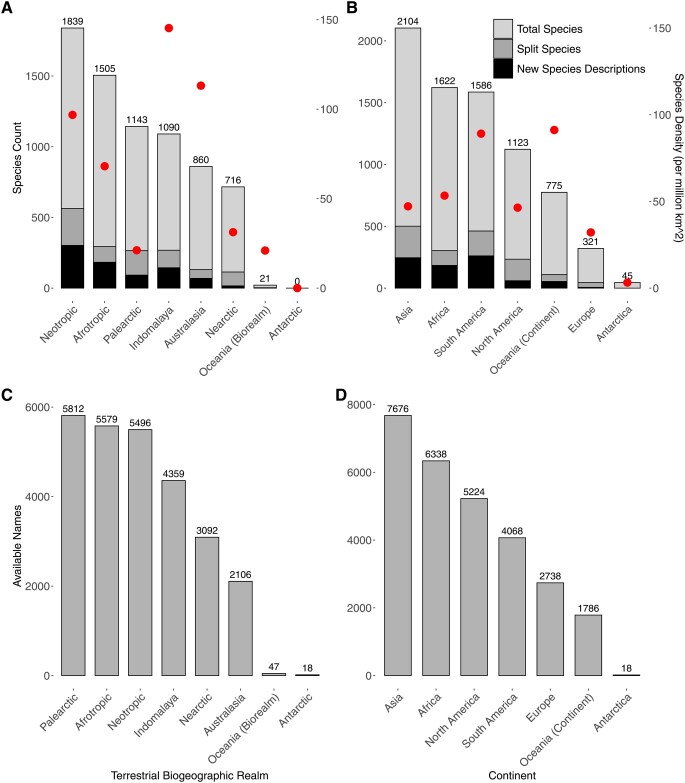
“the Palearctic has the most available names with type localities in that region (20.5% of total available names), followed by the Afrotropical (19.7%), Neotropical (19.4%), Indomalayan (15.4%), Nearctic (10.9%), Australasian (7.4%), Oceanian (0.2%), and Antarctic (<0.1%)”
§ How many mammal species are there now? Updates and trends in taxonomic, nomenclatural, and geographic knowledge > Results > Historical taxonomy and nomenclature.
plain- Asserted: passes — The authors put it forward as true.
- Checkable: passes — It can be checked against evidence.
- Load-bearing: unclear — It is unclear whether the paper’s conclusions depend on it.
- Based: passes — The paper gives a reason why it holds.
It may state two separate claims as one.
A result the paper reports from its own data — it cites no other source for it, so there is none to check. The quote shows it is in the paper.
In the paper
“Asia contains the most recognized mammal species, followed by Africa, South America, North America, Oceania, Europe, and Antarctica.”
§ How many mammal species are there now? Updates and trends in taxonomic, nomenclatural, and geographic knowledge > Results > Regional biodiversity.
plain- Asserted: passes — The authors put it forward as true.
- Checkable: passes — It can be checked against evidence.
- Load-bearing: unclear — It is unclear whether the paper’s conclusions depend on it.
- Based: passes — The paper gives a reason why it holds.
It may state two separate claims as one.
A result the paper reports from its own data — it cites no other source for it, so there is none to check. The quote shows it is in the paper.
In the paper
“Since MSW3, there have been 1,579 more species recognized as distinct (23.4% of all currently valid species), including 805 de novo and 774 split species listed in MDD2, while 226 species have been lumped or removed”
§ How many mammal species are there now? Updates and trends in taxonomic, nomenclatural, and geographic knowledge > Results > Taxonomic change and global biodiversity.
plaindirect- Asserted: passes — The authors put it forward as true.
- Checkable: passes — It can be checked against evidence.
- Load-bearing: passes — The paper’s conclusions depend on it.
- Based: passes — The paper gives a reason why it holds.
It may state two separate claims as one.
The paper states this without a source or data behind it here, so there is nothing to check it against. The quote shows it is in the paper.
In the paper
“MDD2 provides an online overview of research studies authored by mammalogists worldwide over the past 267 yrs (1758 to 2024), jointly illuminating the latest advances in taxonomic understanding of this charismatic vertebrate clade.”
§ How many mammal species are there now? Updates and trends in taxonomic, nomenclatural, and geographic knowledge > Discussion
plain- Asserted: passes — The authors put it forward as true.
- Checkable: passes — It can be checked against evidence.
- Load-bearing: fails — The paper’s conclusions may not depend on it.
- Based: passes — The paper gives a reason why it holds.
Probably not a substantial claim. The paper’s conclusions may not depend on it.
A result the paper reports from its own data — it cites no other source for it, so there is none to check. The quote shows it is in the paper.
In the paper
“All other mammal families have fewer than 200 species, with 24 families having only 1 extant species”
§ How many mammal species are there now? Updates and trends in taxonomic, nomenclatural, and geographic knowledge > Results > Taxonomic change and global biodiversity.
plainn = 24- Asserted: passes — The authors put it forward as true.
- Checkable: passes — It can be checked against evidence.
- Load-bearing: unclear — It is unclear whether the paper’s conclusions depend on it.
- Based: passes — The paper gives a reason why it holds.
It may state two separate claims as one.
A result the paper reports from its own data — it cites no other source for it, so there is none to check. The quote shows it is in the paper.
In the paper
“The 3 most speciose genera are Crocidura (220 species), Myotis (139 species), and Rhinolophus (114 species), which are also the only mammal genera exceeding 100 extant or recently extinct species”
§ How many mammal species are there now? Updates and trends in taxonomic, nomenclatural, and geographic knowledge > Results > Taxonomic change and global biodiversity.
plain- Asserted: passes — The authors put it forward as true.
- Checkable: passes — It can be checked against evidence.
- Load-bearing: passes — The paper’s conclusions depend on it.
- Based: passes — The paper gives a reason why it holds.
It may state two separate claims as one.
A result the paper reports from its own data — it cites no other source for it, so there is none to check. The quote shows it is in the paper.
In the paper
“Indomalaya has the highest density of mammal species, followed by the realms of Australasia, Neotropical, Afrotropical, Nearctic, Palearctic, and Oceania”
§ How many mammal species are there now? Updates and trends in taxonomic, nomenclatural, and geographic knowledge > Results > Regional biodiversity.
plaincorrelational- Asserted: passes — The authors put it forward as true.
- Checkable: passes — It can be checked against evidence.
- Load-bearing: unclear — It is unclear whether the paper’s conclusions depend on it.
- Based: passes — The paper gives a reason why it holds.
It may state two separate claims as one.
A result the paper reports from its own data — it cites no other source for it, so there is none to check. The quote shows it is in the paper.
In the paper
“Few newly described names from the 21st century have type localities in northern North America, Europe, and northern Asia, and most that do are either subspecific names or names now regarded as synonyms.”
§ How many mammal species are there now? Updates and trends in taxonomic, nomenclatural, and geographic knowledge > Results > Historical taxonomy and nomenclature.
plain- Asserted: passes — The authors put it forward as true.
- Checkable: passes — It can be checked against evidence.
- Load-bearing: unclear — It is unclear whether the paper’s conclusions depend on it.
- Based: passes — The paper gives a reason why it holds.
It may state two separate claims as one.
A result the paper reports from its own data — it cites no other source for it, so there is none to check. The quote shows it is in the paper.
In the paper
“Global usage rates rose from an average of ∼450 weekly users to ∼700 between months 1 to 10 and 11 to 17 of tracking.”
§ How many mammal species are there now? Updates and trends in taxonomic, nomenclatural, and geographic knowledge > Results > Website and database usage.
plaincorrelational- Asserted: passes — The authors put it forward as true.
- Checkable: passes — It can be checked against evidence.
- Load-bearing: fails — The paper’s conclusions may not depend on it.
- Based: passes — The paper gives a reason why it holds.
Probably not a substantial claim. The paper’s conclusions may not depend on it.
- Rests on an assumption: The Google Analytics data accurately reflects the number of unique users and their locations.
The paper states this without a source or data behind it here, so there is nothing to check it against. The quote shows it is in the paper.
In the paper
“MDD2 considers 113 species to be recently extinct and documents the extinction of 25 entire genera and 7 entire families since the year 1500.”
§ How many mammal species are there now? Updates and trends in taxonomic, nomenclatural, and geographic knowledge > Results > Conservation status.
plain- Asserted: passes — The authors put it forward as true.
- Checkable: passes — It can be checked against evidence.
- Load-bearing: unclear — It is unclear whether the paper’s conclusions depend on it.
- Based: passes — The paper gives a reason why it holds.
It may state two separate claims as one.
The paper states this without a source or data behind it here, so there is nothing to check it against. The quote shows it is in the paper.
In the paper
“The orders with the largest number of threatened extant species are Primates (335 species; 64.2% of total MDD2 species), Rodentia (313; 11.4%), Chiroptera (217; 14.6%), and Artiodactyla (122; 32.9%).”
§ How many mammal species are there now? Updates and trends in taxonomic, nomenclatural, and geographic knowledge > Results > Conservation status.
plain- Asserted: passes — The authors put it forward as true.
- Checkable: passes — It can be checked against evidence.
- Load-bearing: unclear — It is unclear whether the paper’s conclusions depend on it.
- Based: passes — The paper gives a reason why it holds.
It may state two separate claims as one.
The paper states this without a source or data behind it here, so there is nothing to check it against. The quote shows it is in the paper.
In the paper
“The most speciose mammalian families are Muridae (876 species; 156 genera), Cricetidae (869 species; 162 genera), Vespertilionidae (535 species; 60 genera), Soricidae (488 species; 28 genera), Sciuridae (321 species; 64 genera), Phyllostomidae (231 species; 61 genera), and Pteropodidae (202 species; 46 genera).”
§ How many mammal species are there now? Updates and trends in taxonomic, nomenclatural, and geographic knowledge > Results > Taxonomic change and global biodiversity.
plain- Asserted: passes — The authors put it forward as true.
- Checkable: passes — It can be checked against evidence.
- Load-bearing: passes — The paper’s conclusions depend on it.
- Based: passes — The paper gives a reason why it holds.
It may state two separate claims as one.
A result the paper reports from its own data — it cites no other source for it, so there is none to check. The quote shows it is in the paper.
In the paper
“These orders are followed by Primates (522 species; 84 genera; 19 families), Artiodactyla (371 species; 138 genera; 23 families), and Carnivora (319 species; 129 genera; 16 families); all other mammal orders have fewer than 200 recognized species.”
§ How many mammal species are there now? Updates and trends in taxonomic, nomenclatural, and geographic knowledge > Results > Taxonomic change and global biodiversity.
plain- Asserted: passes — The authors put it forward as true.
- Checkable: passes — It can be checked against evidence.
- Load-bearing: passes — The paper’s conclusions depend on it.
- Based: passes — The paper gives a reason why it holds.
It may state two separate claims as one.
The paper states this without a source or data behind it here, so there is nothing to check it against. The quote shows it is in the paper.
In the paper
“The MDD2 dataset allows for novel explorations of how the recognized taxonomy of mammal species and higher taxa has changed through time, which is briefly contextualized here.”
§ How many mammal species are there now? Updates and trends in taxonomic, nomenclatural, and geographic knowledge > Discussion > Documenting 267 yrs of change: historical perspectives on mammalian taxonomy.
plain- Asserted: passes — The authors put it forward as true.
- Checkable: passes — It can be checked against evidence.
- Load-bearing: passes — The paper’s conclusions depend on it.
- Based: passes — The paper gives a reason why it holds.
Probably not a substantial claim.
A result the paper reports from its own data — it cites no other source for it, so there is none to check. The quote shows it is in the paper.
In the paper
“Over a recent 17-mo period, it was visited by 1,200 to 2,900 users/mo for a total of 25,991 unique users that were located in 170 different countries (Google Analytics: 19 May 2023 to 19 October 2024).”
§ How many mammal species are there now? Updates and trends in taxonomic, nomenclatural, and geographic knowledge > Results > Website and database usage.
plain- Asserted: passes — The authors put it forward as true.
- Checkable: passes — It can be checked against evidence.
- Load-bearing: fails — The paper’s conclusions may not depend on it.
- Based: passes — The paper gives a reason why it holds.
Probably not a substantial claim. The paper’s conclusions may not depend on it. It may state two separate claims as one.
- Rests on an assumption: The Google Analytics data accurately reflects the number of unique users and their locations.
A result the paper reports from its own data — it cites no other source for it, so there is none to check. The quote shows it is in the paper.
In the paper
“Of the total species recognized in MDD2, 19.2% (1,295 species) are threatened with extinction (VU, EN, CR, and EW IUCN statuses) and 11.5% (773 species) are classified as Data Deficient (DD).”
§ How many mammal species are there now? Updates and trends in taxonomic, nomenclatural, and geographic knowledge > Results > Conservation status.
plain- Asserted: passes — The authors put it forward as true.
- Checkable: passes — It can be checked against evidence.
- Load-bearing: unclear — It is unclear whether the paper’s conclusions depend on it.
- Based: passes — The paper gives a reason why it holds.
It may state two separate claims as one.
The paper states this without a source or data behind it here, so there is nothing to check it against. The quote shows it is in the paper.
In the paper
“Tubulidentata is currently the only mammal order with a single living species, since Microbiotheria now includes 2 species”
§ How many mammal species are there now? Updates and trends in taxonomic, nomenclatural, and geographic knowledge > Results > Taxonomic change and global biodiversity.
plain- Asserted: passes — The authors put it forward as true.
- Checkable: passes — It can be checked against evidence.
- Load-bearing: unclear — It is unclear whether the paper’s conclusions depend on it.
- Based: passes — The paper gives a reason why it holds.
It may state two separate claims as one.
The paper states this without a source or data behind it here, so there is nothing to check it against. The quote shows it is in the paper.
In the paper
“Linnaeus (1758) with 208 names (152 currently valid species) and R. Kerr in Britain (Kerr 1792) with 202 names (27 currently valid species).”
§ How many mammal species are there now? Updates and trends in taxonomic, nomenclatural, and geographic knowledge > Discussion > Documenting 267 yrs of change: historical perspectives on mammalian taxonomy.
plaincorrelational- Asserted: passes — The authors put it forward as true.
- Checkable: passes — It can be checked against evidence.
- Load-bearing: unclear — It is unclear whether the paper’s conclusions depend on it.
- Based: passes — The paper gives a reason why it holds.
It may state two separate claims as one.
A result the paper reports from its own data — it cites no other source for it, so there is none to check. The quote shows it is in the paper.
In the paper
“The orders with the most species newly recognized since MSW3 are Rodentia (595 species; 21.7% relative to the order total in MDD2), Chiroptera (410; 27.6%), Eulipotyphla (166; 27.7%), and Primates (161; 30.8%).”
§ How many mammal species are there now? Updates and trends in taxonomic, nomenclatural, and geographic knowledge > Results > Taxonomic change and global biodiversity.
plain- Asserted: passes — The authors put it forward as true.
- Checkable: passes — It can be checked against evidence.
- Load-bearing: passes — The paper’s conclusions depend on it.
- Based: passes — The paper gives a reason why it holds.
It may state two separate claims as one.
The paper states this without a source or data behind it here, so there is nothing to check it against. The quote shows it is in the paper.
In the paper
“MDD2 recognizes 2 fewer orders than MSW3 because Soricomorpha and Erinaceomorpha are now lumped into a single order (Eulipotyphla), and Cetacea is now lumped into Artiodactyla.”
§ How many mammal species are there now? Updates and trends in taxonomic, nomenclatural, and geographic knowledge > Results > Taxonomic change and global biodiversity.
plaindirect- Asserted: passes — The authors put it forward as true.
- Checkable: passes — It can be checked against evidence.
- Load-bearing: unclear — It is unclear whether the paper’s conclusions depend on it.
- Based: passes — The paper gives a reason why it holds.
It may state two separate claims as one.
The paper states this without a source or data behind it here, so there is nothing to check it against. The quote shows it is in the paper.
In the paper
“Binomial nomenclature and taxonomy for mammals and other animals starts with C. Linnaeus in Sweden (1758), whose Systema Naturae (10th edition) still holds the title of proposing the largest number of currently valid mammal species in a single publication.”
§ How many mammal species are there now? Updates and trends in taxonomic, nomenclatural, and geographic knowledge > Discussion > Documenting 267 yrs of change: historical perspectives on mammalian taxonomy.
plain- Asserted: passes — The authors put it forward as true.
- Checkable: passes — It can be checked against evidence.
- Load-bearing: fails — The paper’s conclusions may not depend on it.
- Based: fails — The paper may give no reason why it holds.
Probably not a substantial claim. The paper’s conclusions may not depend on it. The paper may give no reason why it holds.
The paper states this without a source or data behind it here, so there is nothing to check it against. The quote shows it is in the paper.
In the paper
“Crocidura exceeded 200 species and Rhinolophus exceeded 100 species as a result of new species recognized since MSW3.”
§ How many mammal species are there now? Updates and trends in taxonomic, nomenclatural, and geographic knowledge > Results > Taxonomic change and global biodiversity.
plaindirect- Asserted: passes — The authors put it forward as true.
- Checkable: passes — It can be checked against evidence.
- Load-bearing: unclear — It is unclear whether the paper’s conclusions depend on it.
- Based: passes — The paper gives a reason why it holds.
It may state two separate claims as one.
A result the paper reports from its own data — it cites no other source for it, so there is none to check. The quote shows it is in the paper.
In the paper
“A large spike in MDD website traffic on 15 to 17 July 2024 involved 1,326 weekly users, likely stemming from the MDD v1.13 taxonomy release on 13 July 2024.”
§ How many mammal species are there now? Updates and trends in taxonomic, nomenclatural, and geographic knowledge > Results > Website and database usage.
hedgedconditional- Asserted: passes — The authors put it forward as true.
- Checkable: passes — It can be checked against evidence.
- Load-bearing: fails — The paper’s conclusions may not depend on it.
- Based: passes — The paper gives a reason why it holds.
Probably not a substantial claim. The paper’s conclusions may not depend on it.
- Rests on an assumption: The Google Analytics data accurately reflects the number of unique users and their locations.
A result the paper reports from its own data — it cites no other source for it, so there is none to check. The quote shows it is in the paper.
In the paper
“the Neotropics also contain the most newly recognized species since MSW3 (563 total species), followed by the realms of Afrotropical (294), Indomalaya (268), Palearctic (265), Australasia (131), Nearctic (114), and Oceania (3).”
§ How many mammal species are there now? Updates and trends in taxonomic, nomenclatural, and geographic knowledge > Results > Regional biodiversity.
plain- Asserted: passes — The authors put it forward as true.
- Checkable: passes — It can be checked against evidence.
- Load-bearing: passes — The paper’s conclusions depend on it.
- Based: passes — The paper gives a reason why it holds.
It may state two separate claims as one.
The paper states this without a source or data behind it here, so there is nothing to check it against. The quote shows it is in the paper.
In the paper
“The curatorial efforts of MDD2, Hesperomys, and Batnames have uncovered extensive information relevant to the history of studying mammal taxa—especially type localities, type specimens, original description citations, and hyperlinks to those sources.”
§ How many mammal species are there now? Updates and trends in taxonomic, nomenclatural, and geographic knowledge > Discussion > Documenting 267 yrs of change: historical perspectives on mammalian taxonomy.
plaindirect- Asserted: passes — The authors put it forward as true.
- Checkable: passes — It can be checked against evidence.
- Load-bearing: fails — The paper’s conclusions may not depend on it.
- Based: passes — The paper gives a reason why it holds.
Probably not a substantial claim. The paper’s conclusions may not depend on it.
A result the paper reports from its own data — it cites no other source for it, so there is none to check. The quote shows it is in the paper.
In the paper
“Archived versions of the MDD taxonomy on Zenodo (https://doi.org/10.5281/zenodo.4139722) have garnered 33,208 page views and 17,159 downloads over a 4-yr period (September 2020 to -October 2024).”
§ How many mammal species are there now? Updates and trends in taxonomic, nomenclatural, and geographic knowledge > Results > Website and database usage.
plain- Asserted: passes — The authors put it forward as true.
- Checkable: passes — It can be checked against evidence.
- Load-bearing: fails — The paper’s conclusions may not depend on it.
- Based: passes — The paper gives a reason why it holds.
Probably not a substantial claim. The paper’s conclusions may not depend on it.
A result the paper reports from its own data — it cites no other source for it, so there is none to check. The quote shows it is in the paper.
In the paper
“Over this same 20-yr period, at least 1 new species has been recognized in 20 out of 27 orders and 98 out of 167 families of mammals”
§ How many mammal species are there now? Updates and trends in taxonomic, nomenclatural, and geographic knowledge > Results > Taxonomic change and global biodiversity.
plainn = 167- Asserted: passes — The authors put it forward as true.
- Checkable: passes — It can be checked against evidence.
- Load-bearing: passes — The paper’s conclusions depend on it.
- Based: passes — The paper gives a reason why it holds.
It may state two separate claims as one.
A result the paper reports from its own data — it cites no other source for it, so there is none to check. The quote shows it is in the paper.
In the paper
“The IUCN version 2024-1 recognizes 1,308 genera and 164 families, which is a net difference of 45 (3.3%) fewer genera and 3 (1.8%) fewer families than MDD2, but recognizes the same 27 orders.”
§ How many mammal species are there now? Updates and trends in taxonomic, nomenclatural, and geographic knowledge > Results > Taxonomic change and global biodiversity.
plain- Asserted: passes — The authors put it forward as true.
- Checkable: passes — It can be checked against evidence.
- Load-bearing: passes — The paper’s conclusions depend on it.
- Based: passes — The paper gives a reason why it holds.
It may state two separate claims as one.
The paper states this without a source or data behind it here, so there is nothing to check it against. The quote shows it is in the paper.
In the paper
“Species-rank names described during this period were often based on illustrations or firsthand accounts of living or recently deceased animals without reference to voucher specimens, but museum specimens would become the preferred reference material for biological descriptions later in the 19th and early 20th century (i.e., museum-based type material).”
§ How many mammal species are there now? Updates and trends in taxonomic, nomenclatural, and geographic knowledge > Discussion > Documenting 267 yrs of change: historical perspectives on mammalian taxonomy.
plain- Asserted: passes — The authors put it forward as true.
- Checkable: passes — It can be checked against evidence.
- Load-bearing: fails — The paper’s conclusions may not depend on it.
- Based: passes — The paper gives a reason why it holds.
Probably not a substantial claim. The paper’s conclusions may not depend on it.
A result the paper reports from its own data — it cites no other source for it, so there is none to check. The quote shows it is in the paper.
In the paper
“Only 8 of 27 orders and 72 of 167 families of mammals are currently “completely evaluated” by the IUCN”
§ How many mammal species are there now? Updates and trends in taxonomic, nomenclatural, and geographic knowledge > Results > Conservation status.
plainn = 167- Asserted: passes — The authors put it forward as true.
- Checkable: passes — It can be checked against evidence.
- Load-bearing: passes — The paper’s conclusions depend on it.
- Based: passes — The paper gives a reason why it holds.
It may state two separate claims as one.
A result the paper reports from its own data — it cites no other source for it, so there is none to check. The quote shows it is in the paper.
In the paper
“Mammal research typifies activities of this renaissance in 2 ways: (i) increased splitting of existing species through taxonomic revisions (774 species split since MSW3); and (ii) proportionately more names described as new species rather than subspecies (83.4% of available names since 2000 are described as new species rather than subspecies, versus 36.1% from 1950 to 1999).”
§ How many mammal species are there now? Updates and trends in taxonomic, nomenclatural, and geographic knowledge > Discussion > Mammalian systematics in the modern era.
plaincorrelational- Asserted: passes — The authors put it forward as true.
- Checkable: passes — It can be checked against evidence.
- Load-bearing: unclear — It is unclear whether the paper’s conclusions depend on it.
- Based: passes — The paper gives a reason why it holds.
It may state two separate claims as one.
The paper states this without a source or data behind it here, so there is nothing to check it against. The quote shows it is in the paper.
In the paper
“This standardization contributed to the rapid increase in mammalian taxonomic activity during the late 19th and early 20th century, which was also characterized by an increasing prevalence in the use of the subspecies rank (replacing forms and varieties).”
§ How many mammal species are there now? Updates and trends in taxonomic, nomenclatural, and geographic knowledge > Discussion > Documenting 267 yrs of change: historical perspectives on mammalian taxonomy.
plaincorrelational- Asserted: passes — The authors put it forward as true.
- Checkable: passes — It can be checked against evidence.
- Load-bearing: fails — The paper’s conclusions may not depend on it.
- Based: passes — The paper gives a reason why it holds.
Probably not a substantial claim. The paper’s conclusions may not depend on it. The quote only partly states this claim.
The paper states this without a source or data behind it here, so there is nothing to check it against. The quote shows it is in the paper.
In the paper
“Additionally, species were often described based on subtle morphological distinctions, and some of the traits used for species diagnoses at this time are now known to vary substantially within species relative to environmental factors (e.g., pelage coloration).”
§ How many mammal species are there now? Updates and trends in taxonomic, nomenclatural, and geographic knowledge > Discussion > Documenting 267 yrs of change: historical perspectives on mammalian taxonomy.
plaincorrelational- Asserted: passes — The authors put it forward as true.
- Checkable: passes — It can be checked against evidence.
- Load-bearing: passes — The paper’s conclusions depend on it.
- Based: passes — The paper gives a reason why it holds.
It may state two separate claims as one.
None of the sources cited for this claim have been checked yet.
In the paper
“Even the recognized species richness of groups such as Microcebus mouse lemurs, which rose from 2 to 25 species over 4 decades (Franz et al. 2020), was recently reduced to 19 species after an integrative taxonomic revision (van Elst et al. 2025—published after the MDD2 cutoff date).”
§ How many mammal species are there now? Updates and trends in taxonomic, nomenclatural, and geographic knowledge > Discussion > Mammalian systematics in the modern era.
What the sources say
- Not checked — no full text of the sourcecites Franz et al. 2020 source
- Not matchedcites van Elst et al. 2025
Couldn’t be matched to a paper in Crossref, so it can’t be checked.
plaindirect- Asserted: passes — The authors put it forward as true.
- Checkable: passes — It can be checked against evidence.
- Load-bearing: unclear — It is unclear whether the paper’s conclusions depend on it.
- Based: passes — The paper gives a reason why it holds.
It may state two separate claims as one.
In the paper
“A prime example of the frequency with which now-synonymous names were proposed during this period is Merriam’s (1918) treatment of the Brown Bear (Ursus arctos) as ∼74 distinct species in North America alone, as opposed to the currently defined single Holarctic species.”
§ How many mammal species are there now? Updates and trends in taxonomic, nomenclatural, and geographic knowledge > Discussion > Documenting 267 yrs of change: historical perspectives on mammalian taxonomy.
What the sources say
- Not checked — no full text of the sourcecites Merriam’s (1918) source
plainSingle case- Asserted: passes — The authors put it forward as true.
- Checkable: passes — It can be checked against evidence.
- Load-bearing: unclear — It is unclear whether the paper’s conclusions depend on it.
- Based: passes — The paper gives a reason why it holds.
It may state two separate claims as one.
In the paper
“Mammal-focused expeditions also occurred more frequently, generally associated with colonial exploration, resulting in specimens being sent to museums in Europe and North America (rarely in the country of collection; e.g., see Mohammed et al. 2022).”
§ How many mammal species are there now? Updates and trends in taxonomic, nomenclatural, and geographic knowledge > Discussion > Documenting 267 yrs of change: historical perspectives on mammalian taxonomy.
What the sources say
- Not checked — no full text of the sourcecites Mohammed et al. 2022 source
plaincorrelational- Asserted: passes — The authors put it forward as true.
- Checkable: passes — It can be checked against evidence.
- Load-bearing: unclear — It is unclear whether the paper’s conclusions depend on it.
- Based: passes — The paper gives a reason why it holds.
It may state two separate claims as one.
The paper states this without a source or data behind it here, so there is nothing to check it against. The quote shows it is in the paper.
In the paper
“Researchers primarily described mammal species based on relatively few specimens sent to museums from widely separated localities.”
§ How many mammal species are there now? Updates and trends in taxonomic, nomenclatural, and geographic knowledge > Discussion > Documenting 267 yrs of change: historical perspectives on mammalian taxonomy.
plain- Asserted: passes — The authors put it forward as true.
- Checkable: passes — It can be checked against evidence.
- Load-bearing: unclear — It is unclear whether the paper’s conclusions depend on it.
- Based: passes — The paper gives a reason why it holds.
The quote only partly states this claim.
A result the paper reports from its own data — it cites no other source for it, so there is none to check. The quote shows it is in the paper.
In the paper
“C&H1 marks the shift from predominantly lumping species back to predominantly splitting species, as total estimates of extant mammal species richness began increasing thereafter (Table 1, Fig. 1).”
§ How many mammal species are there now? Updates and trends in taxonomic, nomenclatural, and geographic knowledge > Discussion > Documenting 267 yrs of change: historical perspectives on mammalian taxonomy.
plaindirect- Asserted: passes — The authors put it forward as true.
- Checkable: passes — It can be checked against evidence.
- Load-bearing: passes — The paper’s conclusions depend on it.
- Based: passes — The paper gives a reason why it holds.
It may state two separate claims as one.
The paper states this without a source or data behind it here, so there is nothing to check it against. The quote shows it is in the paper.
In the paper
“For example, 226 species-rank names that were recognized as species in MSW3 have since been synonymized, or about 1 lump for every 6 newly recognized species from 2004 to 2024 (considering both de novo and split names).”
§ How many mammal species are there now? Updates and trends in taxonomic, nomenclatural, and geographic knowledge > Discussion > Mammalian systematics in the modern era.
plaincorrelational- Asserted: passes — The authors put it forward as true.
- Checkable: passes — It can be checked against evidence.
- Load-bearing: unclear — It is unclear whether the paper’s conclusions depend on it.
- Based: passes — The paper gives a reason why it holds.
It may state two separate claims as one.
A result the paper reports from its own data — it cites no other source for it, so there is none to check. The quote shows it is in the paper.
In the paper
“During this period, fewer names were being described, and even fewer are now considered valid species (e.g., only 3 currently valid species were described in 1961).”
§ How many mammal species are there now? Updates and trends in taxonomic, nomenclatural, and geographic knowledge > Discussion > Documenting 267 yrs of change: historical perspectives on mammalian taxonomy.
plaincorrelational- Asserted: passes — The authors put it forward as true.
- Checkable: passes — It can be checked against evidence.
- Load-bearing: unclear — It is unclear whether the paper’s conclusions depend on it.
- Based: passes — The paper gives a reason why it holds.
It may state two separate claims as one.
A result the paper reports from its own data — it cites no other source for it, so there is none to check. The quote shows it is in the paper.
In the paper
“Similarly, there has been a net increase of 123 recognized genera since MSW3, typically to establish generic monophyly, which has also been bidirectional (+178 and –55 genera).”
§ How many mammal species are there now? Updates and trends in taxonomic, nomenclatural, and geographic knowledge > Discussion > Mammalian systematics in the modern era.
plaindirect- Asserted: passes — The authors put it forward as true.
- Checkable: passes — It can be checked against evidence.
- Load-bearing: unclear — It is unclear whether the paper’s conclusions depend on it.
- Based: passes — The paper gives a reason why it holds.
It may state two separate claims as one.
The paper states this without a source or data behind it here, so there is nothing to check it against. The quote shows it is in the paper.
In the paper
“Prototheria, Metatheria, and Eutheria are retained in the MDD to match the most common use of the names of extant mammals for the time being.”
§ How many mammal species are there now? Updates and trends in taxonomic, nomenclatural, and geographic knowledge > Discussion > Documenting 267 yrs of change: historical perspectives on mammalian taxonomy.
plain- Asserted: passes — The authors put it forward as true.
- Checkable: passes — It can be checked against evidence.
- Load-bearing: fails — The paper’s conclusions may not depend on it.
- Based: passes — The paper gives a reason why it holds.
Probably not a substantial claim. The paper’s conclusions may not depend on it.
The paper states this without a source or data behind it here, so there is nothing to check it against. The quote shows it is in the paper.
In the paper
“In contrast to the previous period, proportionately more new names described during the mid- to late 20th century were described as subspecies, and many names described earlier as species were joined together into polytypic species with many subspecies.”
§ How many mammal species are there now? Updates and trends in taxonomic, nomenclatural, and geographic knowledge > Discussion > Documenting 267 yrs of change: historical perspectives on mammalian taxonomy.
plaincorrelational- Asserted: passes — The authors put it forward as true.
- Checkable: passes — It can be checked against evidence.
- Load-bearing: unclear — It is unclear whether the paper’s conclusions depend on it.
- Based: passes — The paper gives a reason why it holds.
It may state two separate claims as one.
The paper states this without a source or data behind it here, so there is nothing to check it against. The quote shows it is in the paper.
In the paper
“Thus, this period is further characterized by the appearance of more seriously cataloged museum type specimens and more precisely defined type localities (rather than broadly defined type localities at the country or continent level).”
§ How many mammal species are there now? Updates and trends in taxonomic, nomenclatural, and geographic knowledge > Discussion > Documenting 267 yrs of change: historical perspectives on mammalian taxonomy.
plaincorrelational- Asserted: passes — The authors put it forward as true.
- Checkable: passes — It can be checked against evidence.
- Load-bearing: unclear — It is unclear whether the paper’s conclusions depend on it.
- Based: passes — The paper gives a reason why it holds.
It may state two separate claims as one.
The paper states this without a source or data behind it here, so there is nothing to check it against. The quote shows it is in the paper.
In the paper
“A single journal, the Annals and Magazine of Natural History, published the descriptions of 3,434 available species-rank mammal names from 1841 to 1959, 12.1% of available names in MDD2 (including 990 currently valid species).”
§ How many mammal species are there now? Updates and trends in taxonomic, nomenclatural, and geographic knowledge > Discussion > Documenting 267 yrs of change: historical perspectives on mammalian taxonomy.
plain- Asserted: passes — The authors put it forward as true.
- Checkable: passes — It can be checked against evidence.
- Load-bearing: unclear — It is unclear whether the paper’s conclusions depend on it.
- Based: passes — The paper gives a reason why it holds.
It may state two separate claims as one.
The paper states this without a source or data behind it here, so there is nothing to check it against. The quote shows it is in the paper.
In the paper
“Didelphimorphia stands out as having both a high degree of potential for cryptic species and extensive recent taxonomic research, with over 50 new species recognized since MSW3 (39.7% of valid Didelphimorphia species in MDD2).”
§ How many mammal species are there now? Updates and trends in taxonomic, nomenclatural, and geographic knowledge > Discussion > Patterns and shortfalls in global mammal biodiversity.
plaincorrelational- Asserted: passes — The authors put it forward as true.
- Checkable: passes — It can be checked against evidence.
- Load-bearing: passes — The paper’s conclusions depend on it.
- Based: passes — The paper gives a reason why it holds.
It may state two separate claims as one.
The paper states this without a source or data behind it here, so there is nothing to check it against. The quote shows it is in the paper.
In the paper
“Only around half of these newly recognized tropical species are splits, as opposed to the Nearctic/North America and Palearctic/Europe where splits form a higher proportion of new species recognitions since MSW3.”
§ How many mammal species are there now? Updates and trends in taxonomic, nomenclatural, and geographic knowledge > Discussion > Patterns and shortfalls in global mammal biodiversity.
plaincorrelational- Asserted: passes — The authors put it forward as true.
- Checkable: passes — It can be checked against evidence.
- Load-bearing: unclear — It is unclear whether the paper’s conclusions depend on it.
- Based: passes — The paper gives a reason why it holds.
It may state two separate claims as one.
A result the paper reports from its own data — it cites no other source for it, so there is none to check. The quote shows it is in the paper.
In the paper
“The Neotropics and Indomalaya have particularly high proportions of newly recognized species since MSW3, including 9 of the top 10 countries (Figs 2A and 4B) and top 2 continents for new species (South America and Asia; Fig. 2B).”
§ How many mammal species are there now? Updates and trends in taxonomic, nomenclatural, and geographic knowledge > Discussion > Patterns and shortfalls in global mammal biodiversity.
plaincorrelational- Asserted: passes — The authors put it forward as true.
- Checkable: passes — It can be checked against evidence.
- Load-bearing: unclear — It is unclear whether the paper’s conclusions depend on it.
- Based: passes — The paper gives a reason why it holds.
It may state two separate claims as one.
In the paper
“That decadal total compares to 315 during 2000 to 2009 (originally 341 species in Burgin et al. 2018, but reduced by synonymizations in MDD2).”
§ How many mammal species are there now? Updates and trends in taxonomic, nomenclatural, and geographic knowledge > Discussion > Patterns and shortfalls in global mammal biodiversity.
What the sources say
- Not checked — no full text of the sourcecites Burgin et al. 2018 source
plaindirect- Asserted: passes — The authors put it forward as true.
- Checkable: passes — It can be checked against evidence.
- Load-bearing: unclear — It is unclear whether the paper’s conclusions depend on it.
- Based: passes — The paper gives a reason why it holds.
It may state two separate claims as one.
The paper states this without a source or data behind it here, so there is nothing to check it against. The quote shows it is in the paper.
In the paper
“the expectation for 418 valid de novo species descriptions from 2010 to 2019 compares to only 369 currently valid species that were actually described de novo (i.e., with an authority year during this interval).”
§ How many mammal species are there now? Updates and trends in taxonomic, nomenclatural, and geographic knowledge > Discussion > Patterns and shortfalls in global mammal biodiversity.
plain- Asserted: passes — The authors put it forward as true.
- Checkable: passes — It can be checked against evidence.
- Load-bearing: passes — The paper’s conclusions depend on it.
- Based: passes — The paper gives a reason why it holds.
It may state two separate claims as one.
None of the sources cited for this claim have been checked yet.
In the paper
“Primates species began being split with the publication of Primate Taxonomy (Groves 2001), which was controversial at the time but initiated a wave of taxonomic revisions that massively increased their recognized species richness—176 species (Napier and Napier 1967) versus 376 in MSW3, growing to 522 in MDD2 (Groves 2014).”
§ How many mammal species are there now? Updates and trends in taxonomic, nomenclatural, and geographic knowledge > Discussion > Mammal taxonomy in conservation and biodiversity infrastructure.
What the sources say
- Not matchedcites Groves 2001
Couldn’t be matched to a paper in Crossref, so it can’t be checked.
- Not matchedcites Napier and Napier 1967
Couldn’t be matched to a paper in Crossref, so it can’t be checked.
- Not checked — no full text of the sourcecites Groves 2014 source
plaindirect- Asserted: passes — The authors put it forward as true.
- Checkable: passes — It can be checked against evidence.
- Load-bearing: unclear — It is unclear whether the paper’s conclusions depend on it.
- Based: passes — The paper gives a reason why it holds.
It may state two separate claims as one.
- Not matched
A claim is checked only against the cited paper’s full text, never its abstract, and none is available for its sources.
In the paper
“Both groups have been at the center of splitting versus lumping debates (e.g., Rylands and Mittermeier 2014; Gippoliti et al. 2018) due to their inclusion of many traditionally charismatic species threatened with extinction (∼64% of primates and ∼40% of wild ungulates in MDD2 are threatened in the IUCN Red List).”
§ How many mammal species are there now? Updates and trends in taxonomic, nomenclatural, and geographic knowledge > Discussion > Mammal taxonomy in conservation and biodiversity infrastructure.
What the sources say
plaindirect- Asserted: passes — The authors put it forward as true.
- Checkable: passes — It can be checked against evidence.
- Load-bearing: unclear — It is unclear whether the paper’s conclusions depend on it.
- Based: passes — The paper gives a reason why it holds.
It may state two separate claims as one.
In the paper
“The IUCN Red List has assessed the conservation status of 5,983 mammal species as of version 2024-1, which is only 494 species more than were assessed in the 2008 IUCN Red List version (5,489 species; summarized in Schipper et al. 2008).”
§ How many mammal species are there now? Updates and trends in taxonomic, nomenclatural, and geographic knowledge > Discussion > Mammal taxonomy in conservation and biodiversity infrastructure.
What the sources say
- Not checked — no full text of the sourcecites Schipper et al. 2008 source
plain- Asserted: passes — The authors put it forward as true.
- Checkable: passes — It can be checked against evidence.
- Load-bearing: unclear — It is unclear whether the paper’s conclusions depend on it.
- Based: passes — The paper gives a reason why it holds.
It may state two separate claims as one.
The paper states this without a source or data behind it here, so there is nothing to check it against. The quote shows it is in the paper.
In the paper
“Both groups have received more frequent taxonomic updates in the IUCN than other mammals, with only ∼3% of primates and ∼8% of wild ungulates in MDD2 Not Evaluated by the IUCN.”
§ How many mammal species are there now? Updates and trends in taxonomic, nomenclatural, and geographic knowledge > Discussion > Mammal taxonomy in conservation and biodiversity infrastructure.
plaincorrelational- Asserted: passes — The authors put it forward as true.
- Checkable: passes — It can be checked against evidence.
- Load-bearing: unclear — It is unclear whether the paper’s conclusions depend on it.
- Based: passes — The paper gives a reason why it holds.
It may state two separate claims as one.
What the paper did — it cites no source for this, so there is none to check. The quote shows it is in the paper.
In the paper
“Most taxonomic changes incorporated into the MDD have, thus far, closely followed the most recent empirical evidence given in peer-reviewed articles, which each represent the current best hypothesis of species boundaries.”
§ How many mammal species are there now? Updates and trends in taxonomic, nomenclatural, and geographic knowledge > Methods > Taxonomic decision making.
plaincorrelational- Asserted: passes — The authors put it forward as true.
- Checkable: passes — It can be checked against evidence.
- Load-bearing: passes — The paper’s conclusions depend on it.
- Based: fails — The paper may give no reason why it holds.
Probably not a substantial claim. The paper may give no reason why it holds.
In the paper
“In 2008, the IUCN completed the landmark Global Mammal Assessment (GMA), which made range maps available for ∼95% of the species recognized in MSW3 (5,489 species; Schipper et al. 2008).”
§ How many mammal species are there now? Updates and trends in taxonomic, nomenclatural, and geographic knowledge > Abstract
What the sources say
- Not checked — no full text of the sourcecites Schipper et al. 2008 source
plaindirect- Asserted: passes — The authors put it forward as true.
- Checkable: passes — It can be checked against evidence.
- Load-bearing: unclear — It is unclear whether the paper’s conclusions depend on it.
- Based: passes — The paper gives a reason why it holds.
It may state two separate claims as one.
What the paper did — it cites no source for this, so there is none to check. The quote shows it is in the paper.
In the paper
“By consistently following the most recent evidence from peer-reviewed literature, taxonomy in the MDD is designed to collectively reflect the most up-to-date taxonomic perspective of the global mammalogical community and thereby minimize subjective biases coming from the MDD team.”
§ How many mammal species are there now? Updates and trends in taxonomic, nomenclatural, and geographic knowledge > Methods > Taxonomic decision making.
plaindirect- Asserted: passes — The authors put it forward as true.
- Checkable: passes — It can be checked against evidence.
- Load-bearing: fails — The paper’s conclusions may not depend on it.
- Based: passes — The paper gives a reason why it holds.
Probably not a substantial claim. The paper’s conclusions may not depend on it. It may state two separate claims as one.
What the paper did — it cites no source for this, so there is none to check. The quote shows it is in the paper.
In the paper
“All currently recognized species on the MDD have been included within at least an order, family, and genus, with intermediary higher and lower ranks assigned when suggested in the literature.”
§ How many mammal species are there now? Updates and trends in taxonomic, nomenclatural, and geographic knowledge > Methods > Higher-rank taxa.
plain- Asserted: passes — The authors put it forward as true.
- Checkable: passes — It can be checked against evidence.
- Load-bearing: fails — The paper’s conclusions may not depend on it.
- Based: passes — The paper gives a reason why it holds.
Probably not a substantial claim. The paper’s conclusions may not depend on it.
What the paper did — it cites no source for this, so there is none to check. The quote shows it is in the paper.
In the paper
“All distributional listings are generally supported by a confirmed record of the species living there (i.e., a museum specimen or photographic evidence), although if a species is suspected to occur in a region but there is no evidence to confirm its presence a question mark is listed after the region name.”
§ How many mammal species are there now? Updates and trends in taxonomic, nomenclatural, and geographic knowledge > Methods > Geographic distributions.
hedged- Asserted: passes — The authors put it forward as true.
- Checkable: passes — It can be checked against evidence.
- Load-bearing: fails — The paper’s conclusions may not depend on it.
- Based: passes — The paper gives a reason why it holds.
Probably not a substantial claim. The paper’s conclusions may not depend on it. It may state two separate claims as one.
What the paper did — it cites no source for this, so there is none to check. The quote shows it is in the paper.
In the paper
“The MDD follows the ICZN Code to inform issues of the nomenclatural availability and spelling of scientific names”
§ How many mammal species are there now? Updates and trends in taxonomic, nomenclatural, and geographic knowledge > Methods > Nomenclatural metadata.
plaindirect- Asserted: passes — The authors put it forward as true.
- Checkable: passes — It can be checked against evidence.
- Load-bearing: fails — The paper’s conclusions may not depend on it.
- Based: passes — The paper gives a reason why it holds.
Probably not a substantial claim. The paper’s conclusions may not depend on it.
A conclusion the paper draws from its own results — it cites no other source for it, so there is none to check. The quote shows it is in the paper.
In the paper
“Recognizing domestic species also emphasizes the wild forms as an entity to be separately considered and protected.”
§ How many mammal species are there now? Updates and trends in taxonomic, nomenclatural, and geographic knowledge > Methods > Conservation status.
plaindirect- Asserted: passes — The authors put it forward as true.
- Checkable: passes — It can be checked against evidence.
- Load-bearing: passes — The paper’s conclusions depend on it.
- Based: passes — The paper gives a reason why it holds.
Probably not a substantial claim.
What the paper did — it cites no source for this, so there is none to check. The quote shows it is in the paper.
In the paper
“To verify citation and associated nomenclatural data for each name, the MDD team has examined the original descriptions of each name, including the page number where the name or description first occurs and the exact month or day of publication when available.”
§ How many mammal species are there now? Updates and trends in taxonomic, nomenclatural, and geographic knowledge > Methods > Nomenclatural metadata.
plain- Asserted: passes — The authors put it forward as true.
- Checkable: passes — It can be checked against evidence.
- Load-bearing: passes — The paper’s conclusions depend on it.
- Based: passes — The paper gives a reason why it holds.
Probably not a substantial claim.
In the paper
“Nomenclatural availability of each name was determined based on application of the ICZN Code (ICZN 1999) as well as executive decisions made by the ICZN on the protection or rejection of specific names when applicable.”
§ How many mammal species are there now? Updates and trends in taxonomic, nomenclatural, and geographic knowledge > Methods > Nomenclatural metadata.
What the sources say
- Not matchedcites ICZN 1999
Couldn’t be matched to a paper in Crossref, so it can’t be checked.
plaindirect- Asserted: passes — The authors put it forward as true.
- Checkable: passes — It can be checked against evidence.
- Load-bearing: passes — The paper’s conclusions depend on it.
- Based: passes — The paper gives a reason why it holds.
Probably not a substantial claim.
- Not matched
In the paper
“The MDD considers 8 terrestrial biogeographic realms, as defined by Olson et al. (2001): Nearctic, Neotropical, Palearctic, Afrotropical, Indomalayan, Australasian, Oceanian, and Antarctic”
§ How many mammal species are there now? Updates and trends in taxonomic, nomenclatural, and geographic knowledge > Methods > Geographic distributions.
What the sources say
- Not checked — no full text of the sourcecites Olson et al. (2001) source
plain- Asserted: passes — The authors put it forward as true.
- Checkable: passes — It can be checked against evidence.
- Load-bearing: fails — The paper’s conclusions may not depend on it.
- Based: passes — The paper gives a reason why it holds.
Probably not a substantial claim. The paper’s conclusions may not depend on it.
What the paper did — it cites no source for this, so there is none to check. The quote shows it is in the paper.
In the paper
“On the current synonym sheet, the MDD has now verified and copied the verbatim type locality from the original description text for names with verified citations.”
§ How many mammal species are there now? Updates and trends in taxonomic, nomenclatural, and geographic knowledge > Methods > Nomenclatural metadata.
plain- Asserted: passes — The authors put it forward as true.
- Checkable: passes — It can be checked against evidence.
- Load-bearing: fails — The paper’s conclusions may not depend on it.
- Based: passes — The paper gives a reason why it holds.
Probably not a substantial claim. The paper’s conclusions may not depend on it.
A conclusion the paper draws from its own results — it cites no other source for it, so there is none to check. The quote shows it is in the paper.
In the paper
“However, the MDD chooses to recognize these specific domestic forms as distinct species to avoid confusion regarding which forms are being discussed in various political and conservation situations.”
§ How many mammal species are there now? Updates and trends in taxonomic, nomenclatural, and geographic knowledge > Methods > Conservation status.
plaindirect- Asserted: passes — The authors put it forward as true.
- Checkable: passes — It can be checked against evidence.
- Load-bearing: passes — The paper’s conclusions depend on it.
- Based: passes — The paper gives a reason why it holds.
Probably not a substantial claim.
What the paper did — it cites no source for this, so there is none to check. The quote shows it is in the paper.
In the paper
“Citations are considered verified when either a PDF of the cited source is obtained or when a member of the MDD team has physically examined the cited source.”
§ How many mammal species are there now? Updates and trends in taxonomic, nomenclatural, and geographic knowledge > Methods > Nomenclatural metadata.
plain- Asserted: passes — The authors put it forward as true.
- Checkable: passes — It can be checked against evidence.
- Load-bearing: fails — The paper’s conclusions may not depend on it.
- Based: passes — The paper gives a reason why it holds.
Probably not a substantial claim. The paper’s conclusions may not depend on it. It may state two separate claims as one.
What the paper did — it cites no source for this, so there is none to check. The quote shows it is in the paper.
In the paper
“All species that are believed to have been extant after the year 1500 CE, according to evidence published in the peer-reviewed literature, are included in the MDD.”
§ How many mammal species are there now? Updates and trends in taxonomic, nomenclatural, and geographic knowledge > Methods > Conservation status.
plain- Asserted: passes — The authors put it forward as true.
- Checkable: passes — It can be checked against evidence.
- Load-bearing: passes — The paper’s conclusions depend on it.
- Based: passes — The paper gives a reason why it holds.
Probably not a substantial claim.
What the paper did — it cites no source for this, so there is none to check. The quote shows it is in the paper.
In the paper
“However, beginning with v1.10 (December 2022), the MDD piloted a protocol for publishing taxonomic opinion “white papers” on Zenodo in collaboration with members of the Global Bat Taxonomy Working Group, which is part of the IUCN SSC Bat Specialist Group and aligned with Batnames.”
§ How many mammal species are there now? Updates and trends in taxonomic, nomenclatural, and geographic knowledge > Methods > Taxonomic decision making.
plain- Asserted: passes — The authors put it forward as true.
- Checkable: passes — It can be checked against evidence.
- Load-bearing: fails — The paper’s conclusions may not depend on it.
- Based: passes — The paper gives a reason why it holds.
Probably not a substantial claim. The paper’s conclusions may not depend on it.
What the paper did — it cites no source for this, so there is none to check. The quote shows it is in the paper.
In the paper
“In cases where there is insufficient evidence to support a taxonomic change or if multiple conflicting taxonomic arrangements are published in rapid succession, the MDD team provides justifications and citations on the relevant per-species pages, with summaries given on the About page at https://mammaldiversity.org.”
§ How many mammal species are there now? Updates and trends in taxonomic, nomenclatural, and geographic knowledge > Methods > Taxonomic decision making.
plaindirect- Asserted: passes — The authors put it forward as true.
- Checkable: passes — It can be checked against evidence.
- Load-bearing: fails — The paper’s conclusions may not depend on it.
- Based: passes — The paper gives a reason why it holds.
Probably not a substantial claim. The paper’s conclusions may not depend on it. It may state two separate claims as one.
In the paper
“Thus, the MDD acknowledges that recognizing these 17 domestic forms as species is a deviation from the species recognition standards outlined in the Taxonomic decision making section above and follows the naming conventions for domestic species and their wild ancestors outlined by Gentry et al. (2004).”
§ How many mammal species are there now? Updates and trends in taxonomic, nomenclatural, and geographic knowledge > Methods > Conservation status.
What the sources say
- Not checked — no full text of the sourcecites Gentry et al. (2004) source
plain- Asserted: passes — The authors put it forward as true.
- Checkable: passes — It can be checked against evidence.
- Load-bearing: fails — The paper’s conclusions may not depend on it.
- Based: passes — The paper gives a reason why it holds.
Probably not a substantial claim. The paper’s conclusions may not depend on it. It may state two separate claims as one.
A conclusion the paper draws from its own results — it cites no other source for it, so there is none to check. The quote shows it is in the paper.
In the paper
“The Mammal Diversity Database version 2.0 (MDD2) is a digital compendium of global mammal taxonomic, nomenclatural, and geographic information that is more complete and accessible than prior efforts, providing a steppingstone to greater knowledge about mammalian biology.”
§ How many mammal species are there now? Updates and trends in taxonomic, nomenclatural, and geographic knowledge > Discussion
plain- Asserted: passes — The authors put it forward as true.
- Checkable: passes — It can be checked against evidence.
- Load-bearing: passes — The paper’s conclusions depend on it.
- Based: passes — The paper gives a reason why it holds.
Probably not a substantial claim.
The paper states this without a source or data behind it here, so there is nothing to check it against. The quote shows it is in the paper.
In the paper
“The 19th century also saw significant philosophical advances in evolutionary theory, which drove further advances in the understanding of mammal biodiversity.”
§ How many mammal species are there now? Updates and trends in taxonomic, nomenclatural, and geographic knowledge > Discussion > Documenting 267 yrs of change: historical perspectives on mammalian taxonomy.
plaindirect- Asserted: passes — The authors put it forward as true.
- Checkable: passes — It can be checked against evidence.
- Load-bearing: fails — The paper’s conclusions may not depend on it.
- Based: passes — The paper gives a reason why it holds.
Probably not a substantial claim. The paper’s conclusions may not depend on it.
None of the sources cited for this claim could be matched to a paper in Crossref, so there is nothing to check it against.
In the paper
“The modern terms for these 3 extant mammal clades were established by T.N. Gill (1872), who initially proposed Prototheria for monotremes and Eutheria for marsupials and placentals; and T.H. Huxley (1881), who then termed Metatheria for the marsupials (albeit not initially intended as a scientific name), leaving placental mammals in Eutheria.”
§ How many mammal species are there now? Updates and trends in taxonomic, nomenclatural, and geographic knowledge > Discussion > Documenting 267 yrs of change: historical perspectives on mammalian taxonomy.
What the sources say
- Not matchedcites T.N. Gill (1872)
Couldn’t be matched to a paper in Crossref, so it can’t be checked.
- Not matchedcites T.H. Huxley (1881)
Couldn’t be matched to a paper in Crossref, so it can’t be checked.
plaindirect- Asserted: passes — The authors put it forward as true.
- Checkable: passes — It can be checked against evidence.
- Load-bearing: fails — The paper’s conclusions may not depend on it.
- Based: passes — The paper gives a reason why it holds.
Probably not a substantial claim. The paper’s conclusions may not depend on it.
- Not matched
In the paper
“The release of MDD1 7 yrs ago marked a shift from decadal printed volumes to semi-annual online versions (Burgin et al. 2018).”
§ How many mammal species are there now? Updates and trends in taxonomic, nomenclatural, and geographic knowledge > Discussion
What the sources say
- Not checked — no full text of the sourcecites Burgin et al. 2018 source
plaindirect- Asserted: passes — The authors put it forward as true.
- Checkable: passes — It can be checked against evidence.
- Load-bearing: fails — The paper’s conclusions may not depend on it.
- Based: passes — The paper gives a reason why it holds.
Probably not a substantial claim. The paper’s conclusions may not depend on it.
A conclusion the paper draws from its own results — it cites no other source for it, so there is none to check. The quote shows it is in the paper.
In the paper
“A large spike in MDD website traffic on 15 to 17 July 2024 involved 1,326 weekly users, likely stemming from the MDD v1.13 taxonomy release on 13 July 2024.”
§ How many mammal species are there now? Updates and trends in taxonomic, nomenclatural, and geographic knowledge > Results > Website and database usage.
hedgedconditional- Asserted: passes — The authors put it forward as true.
- Checkable: passes — It can be checked against evidence.
- Load-bearing: fails — The paper’s conclusions may not depend on it.
- Based: passes — The paper gives a reason why it holds.
Probably not a substantial claim. The paper’s conclusions may not depend on it.
In the paper
“The higher classification of mammals began to take shape with H.M.D. de Blainville, who used reproductive biology and skull and skeletal features to group mammals into distinct subclasses: monotremes (Ornithodelphes), marsupials (Didelphes), and placentals (Monodelphes; de Blainville 1816, 1864).”
§ How many mammal species are there now? Updates and trends in taxonomic, nomenclatural, and geographic knowledge > Discussion > Documenting 267 yrs of change: historical perspectives on mammalian taxonomy.
What the sources say
- Not matchedcites de Blainville 1816, 1864
Couldn’t be matched to a paper in Crossref, so it can’t be checked.
plaindirect- Asserted: passes — The authors put it forward as true.
- Checkable: passes — It can be checked against evidence.
- Load-bearing: fails — The paper’s conclusions may not depend on it.
- Based: passes — The paper gives a reason why it holds.
Probably not a substantial claim. The paper’s conclusions may not depend on it.
- Not matched
None of the sources cited for this claim could be matched to a paper in Crossref, so there is nothing to check it against.
In the paper
“The lack of structure spurred the need for standardized nomenclatural and taxonomic rules for zoological taxonomy, which culminated in the publication of the International Rules of Zoological Nomenclature in 1905 (Blanchard et al. 1905) that would eventually develop into the first edition of the ICZN Code (ICZN 1961).”
§ How many mammal species are there now? Updates and trends in taxonomic, nomenclatural, and geographic knowledge > Discussion > Documenting 267 yrs of change: historical perspectives on mammalian taxonomy.
What the sources say
- Not matchedcites Blanchard et al. 1905
Couldn’t be matched to a paper in Crossref, so it can’t be checked.
- Not matchedcites ICZN 1961
Couldn’t be matched to a paper in Crossref, so it can’t be checked.
plaindirect- Asserted: passes — The authors put it forward as true.
- Checkable: passes — It can be checked against evidence.
- Load-bearing: unclear — It is unclear whether the paper’s conclusions depend on it.
- Based: passes — The paper gives a reason why it holds.
It may state two separate claims as one.
- Not matched
The paper states this without a source or data behind it here, so there is nothing to check it against. The quote shows it is in the paper.
In the paper
“Prior to the 1890s, taxonomic and nomenclatural practices were unstandardized, leading to differential naming systems and confusion regarding a given species proper name, especially as many authors knowingly renamed already-named species.”
§ How many mammal species are there now? Updates and trends in taxonomic, nomenclatural, and geographic knowledge > Discussion > Documenting 267 yrs of change: historical perspectives on mammalian taxonomy.
plaindirect- Asserted: passes — The authors put it forward as true.
- Checkable: passes — It can be checked against evidence.
- Load-bearing: unclear — It is unclear whether the paper’s conclusions depend on it.
- Based: passes — The paper gives a reason why it holds.
It may state two separate claims as one.
The paper states this without a source or data behind it here, so there is nothing to check it against. The quote shows it is in the paper.
In the paper
“These documents established fundamental nomenclatural rules that are still used today including the principle of priority for scientific names, the use of physical type material and type localities to define species-rank names, and the rule that names must be published according to the ICZN Code to be considered available.”
§ How many mammal species are there now? Updates and trends in taxonomic, nomenclatural, and geographic knowledge > Discussion > Documenting 267 yrs of change: historical perspectives on mammalian taxonomy.
plain- Asserted: passes — The authors put it forward as true.
- Checkable: passes — It can be checked against evidence.
- Load-bearing: fails — The paper’s conclusions may not depend on it.
- Based: passes — The paper gives a reason why it holds.
Probably not a substantial claim. The paper’s conclusions may not depend on it. It may state two separate claims as one.
In the paper
“The publication of The Principles of Classification and a Classification of Mammals (Simpson 1945), which is the foundation of modern mammalian ordinal and familial arrangements, is based on a more complete consideration of the deep-time evolutionary history of both living and extinct mammals.”
§ How many mammal species are there now? Updates and trends in taxonomic, nomenclatural, and geographic knowledge > Discussion > Documenting 267 yrs of change: historical perspectives on mammalian taxonomy.
What the sources say
- Not matchedcites Simpson 1945
Couldn’t be matched to a paper in Crossref, so it can’t be checked.
plaindirect- Asserted: passes — The authors put it forward as true.
- Checkable: passes — It can be checked against evidence.
- Load-bearing: fails — The paper’s conclusions may not depend on it.
- Based: passes — The paper gives a reason why it holds.
Probably not a substantial claim. The paper’s conclusions may not depend on it.
- Not matched
A conclusion the paper draws from its own results — it cites no other source for it, so there is none to check. The quote shows it is in the paper.
In the paper
“Thus, like the preceding time period discussed above, revisionary taxonomy is perhaps the most appropriate characterization of mammal taxonomic change in this modern era (albeit with more frequent splitting than lumping).”
§ How many mammal species are there now? Updates and trends in taxonomic, nomenclatural, and geographic knowledge > Discussion > Mammalian systematics in the modern era.
hedged- Asserted: passes — The authors put it forward as true.
- Checkable: passes — It can be checked against evidence.
- Load-bearing: passes — The paper’s conclusions depend on it.
- Based: passes — The paper gives a reason why it holds.
It may state two separate claims as one.
A conclusion the paper draws from its own results — it cites no other source for it, so there is none to check. The quote shows it is in the paper.
In the paper
“The estimate of ∼11,625 species by 2100 seems more far-fetched given that this trend is likely to level off at some point, but the ∼70% increase over the current MDD2 total would be equivalent to the 1980 to 2024 increase since C&H1 was published.”
§ How many mammal species are there now? Updates and trends in taxonomic, nomenclatural, and geographic knowledge > Discussion > Patterns and shortfalls in global mammal biodiversity.
hedgedcorrelational- Asserted: passes — The authors put it forward as true.
- Checkable: passes — It can be checked against evidence.
- Load-bearing: unclear — It is unclear whether the paper’s conclusions depend on it.
- Based: passes — The paper gives a reason why it holds.
It may state two separate claims as one.
A conclusion the paper draws from its own results — it cites no other source for it, so there is none to check. The quote shows it is in the paper.
In the paper
“Currently, broadening such conclusions into generalities is likely premature.”
§ How many mammal species are there now? Updates and trends in taxonomic, nomenclatural, and geographic knowledge > Discussion > Mammalian systematics in the modern era.
hedged- Asserted: passes — The authors put it forward as true.
- Checkable: fails — It may be too vague to check against evidence.
- Load-bearing: fails — The paper’s conclusions may not depend on it.
- Based: passes — The paper gives a reason why it holds.
Probably not a substantial claim. It may be too vague to check against evidence. The paper’s conclusions may not depend on it.
A conclusion the paper draws from its own results — it cites no other source for it, so there is none to check. The quote shows it is in the paper.
In the paper
“If this trend continues, we estimate that the total recognized mammal species richness will increase to ∼7,084 species by 2030 and ∼8,382 species by 2050.”
§ How many mammal species are there now? Updates and trends in taxonomic, nomenclatural, and geographic knowledge > Discussion > Patterns and shortfalls in global mammal biodiversity.
hedgedconditional- Asserted: passes — The authors put it forward as true.
- Checkable: passes — It can be checked against evidence.
- Load-bearing: passes — The paper’s conclusions depend on it.
- Based: passes — The paper gives a reason why it holds.
It may state two separate claims as one.
- The authors state this as an assumption: Observed trends in historical species descriptions or species recognition will continue into the future.
In the paper
“Overall, trends in modern taxonomic research appear to reflect a paradigm shift in how systematists define the species unit (reviewed in Padial and De la Riva 2021).”
§ How many mammal species are there now? Updates and trends in taxonomic, nomenclatural, and geographic knowledge > Discussion > Mammalian systematics in the modern era.
What the sources say
- Not checked — no full text of the sourcecites Padial and De la Riva 2021 source
hedgedcorrelational- Asserted: passes — The authors put it forward as true.
- Checkable: passes — It can be checked against evidence.
- Load-bearing: fails — The paper’s conclusions may not depend on it.
- Based: passes — The paper gives a reason why it holds.
Probably not a substantial claim. The paper’s conclusions may not depend on it.
In the paper
“Lessa et al. (2024) reviewed this problem in detail, concluding that “relevant estimates of the number of known and unknown species will only be achieved by accounting for the dynamic nature of the taxonomic process itself” (p. 1365).”
§ How many mammal species are there now? Updates and trends in taxonomic, nomenclatural, and geographic knowledge > Discussion > Patterns and shortfalls in global mammal biodiversity.
What the sources say
- Not checked — no full text of the sourcecites Lessa et al. 2024 source
plaindirect- Asserted: passes — The authors put it forward as true.
- Checkable: passes — It can be checked against evidence.
- Load-bearing: passes — The paper’s conclusions depend on it.
- Based: passes — The paper gives a reason why it holds.
Probably not a substantial claim.
In the paper
“Thus, these data reinforce the perspective that rates of de novo species description are only part of the “discovery rates” story (Alroy 2002), with the other major component being rates of species splitting and lumping that result from revisionary taxonomic efforts.”
§ How many mammal species are there now? Updates and trends in taxonomic, nomenclatural, and geographic knowledge > Discussion > Patterns and shortfalls in global mammal biodiversity.
What the sources say
- Not checked — no full text of the sourcecites Alroy 2002 source
boosted- Asserted: passes — The authors put it forward as true.
- Checkable: passes — It can be checked against evidence.
- Load-bearing: unclear — It is unclear whether the paper’s conclusions depend on it.
- Based: passes — The paper gives a reason why it holds.
It may state two separate claims as one.
A claim is checked only against the cited paper’s full text, never its abstract, and none is available for its sources.
In the paper
“Both of these estimates are considerably higher than those given by Burgin et al. (2018) and Reeder et al. (2007), but are nonetheless realistic owing to the combined consideration of species splits, lumps, and de novo descriptions.”
§ How many mammal species are there now? Updates and trends in taxonomic, nomenclatural, and geographic knowledge > Discussion > Patterns and shortfalls in global mammal biodiversity.
What the sources say
plaindirect- Asserted: passes — The authors put it forward as true.
- Checkable: passes — It can be checked against evidence.
- Load-bearing: passes — The paper’s conclusions depend on it.
- Based: passes — The paper gives a reason why it holds.
It may state two separate claims as one.
In the paper
“Using this approach in 2018, the MDD team estimated that recognized extant and recently extinct mammal richness will increase to 7,409 species by 2050 and to 9,009 by 2100 if observed trends in historical species descriptions were to continue (Burgin et al. 2018).”
§ How many mammal species are there now? Updates and trends in taxonomic, nomenclatural, and geographic knowledge > Discussion > Patterns and shortfalls in global mammal biodiversity.
What the sources say
- Not checked — no full text of the sourcecites Burgin et al. 2018 source
hedgedconditional- Asserted: passes — The authors put it forward as true.
- Checkable: passes — It can be checked against evidence.
- Load-bearing: fails — The paper’s conclusions may not depend on it.
- Based: passes — The paper gives a reason why it holds.
Probably not a substantial claim. The paper’s conclusions may not depend on it.
- The authors state this as an assumption: Observed trends in historical species descriptions or species recognition will continue into the future.
A conclusion the paper draws from its own results — it cites no other source for it, so there is none to check. The quote shows it is in the paper.
In the paper
“In either case, the digital availability of extracted evidence from taxonomic publications is a key resource needed to make consistent decisions across disparate taxa.”
§ How many mammal species are there now? Updates and trends in taxonomic, nomenclatural, and geographic knowledge > Discussion > Governance
plaindirect- Asserted: passes — The authors put it forward as true.
- Checkable: fails — It may be too vague to check against evidence.
- Load-bearing: passes — The paper’s conclusions depend on it.
- Based: passes — The paper gives a reason why it holds.
Probably not a substantial claim. It may be too vague to check against evidence.
The paper states this without a source or data behind it here, so there is nothing to check it against. The quote shows it is in the paper.
In the paper
“Efficient communication and application of biodiversity knowledge between conservation and biodiversity resources requires agreed-upon organismal units that can serve as foundational designations for downstream decisions made on those units.”
§ How many mammal species are there now? Updates and trends in taxonomic, nomenclatural, and geographic knowledge > Discussion > Mammal taxonomy in conservation and biodiversity infrastructure.
plaindirect- Asserted: passes — The authors put it forward as true.
- Checkable: fails — It may be too vague to check against evidence.
- Load-bearing: passes — The paper’s conclusions depend on it.
- Based: passes — The paper gives a reason why it holds.
Probably not a substantial claim. It may be too vague to check against evidence.
In the paper
“Untracked taxonomic rearrangements also risk the misallocation of resources (e.g., Sylvilagus mansuetus is listed by the IUCN as Critically Endangered, but is not recognized in MDD2 due to synonymization with S. bachmani; Álvarez-Castañeda and Lorenzo 2016).”
§ How many mammal species are there now? Updates and trends in taxonomic, nomenclatural, and geographic knowledge > Discussion > Mammal taxonomy in conservation and biodiversity infrastructure.
What the sources say
- Not checked — no full text of the sourcecites Álvarez-Castañeda and Lorenzo 2016 source
plainconditionalSingle case- Asserted: passes — The authors put it forward as true.
- Checkable: passes — It can be checked against evidence.
- Load-bearing: passes — The paper’s conclusions depend on it.
- Based: passes — The paper gives a reason why it holds.
It may state two separate claims as one.
None of the sources cited for this claim could be matched to a paper in Crossref, so there is nothing to check it against.
In the paper
“Databases such as the Integrated Taxonomic Information System (ITIS 2025) and Catalog of Life (CoL 2025) are increasingly critical for national and international processes of biodiversity decision-making, but they still primarily rely on MSW3-based taxonomies and synonymies for mammals.”
§ How many mammal species are there now? Updates and trends in taxonomic, nomenclatural, and geographic knowledge > Discussion > Future directions and conclusion.
What the sources say
- Not matchedcites ITIS 2025
Couldn’t be matched to a paper in Crossref, so it can’t be checked.
- Not matchedcites CoL 2025
Couldn’t be matched to a paper in Crossref, so it can’t be checked.
plaincorrelational- Asserted: passes — The authors put it forward as true.
- Checkable: passes — It can be checked against evidence.
- Load-bearing: unclear — It is unclear whether the paper’s conclusions depend on it.
- Based: passes — The paper gives a reason why it holds.
It may state two separate claims as one.
- Not matched
The paper states this without a source or data behind it here, so there is nothing to check it against. The quote shows it is in the paper.
In the paper
“The MDD taxonomy increasingly serves as an arbiter of species recognition for conservation organizations at global (e.g., IUCN), national (e.g., NatureServe), and regional (e.g., state agencies) levels.”
§ How many mammal species are there now? Updates and trends in taxonomic, nomenclatural, and geographic knowledge > Discussion > Mammal taxonomy in conservation and biodiversity infrastructure.
plaindirect- Asserted: passes — The authors put it forward as true.
- Checkable: passes — It can be checked against evidence.
- Load-bearing: fails — The paper’s conclusions may not depend on it.
- Based: fails — The paper may give no reason why it holds.
Probably not a substantial claim. The paper’s conclusions may not depend on it. The paper may give no reason why it holds.
None of the sources cited for this claim have been checked yet.
In the paper
“The value of accurately communicating “species” categories highlights the basal importance of taxonomy and nomenclature in biodiversity infrastructure (Grieneisen et al. 2014; Sterner et al. 2020a).”
§ How many mammal species are there now? Updates and trends in taxonomic, nomenclatural, and geographic knowledge > Discussion > Mammal taxonomy in conservation and biodiversity infrastructure.
What the sources say
- Not checked — no full text of the sourcecites Grieneisen et al. 2014 source
- Not matchedcites Sterner et al. 2020a
Couldn’t be matched to a paper in Crossref, so it can’t be checked.
plaindirect- Asserted: passes — The authors put it forward as true.
- Checkable: fails — It may be too vague to check against evidence.
- Load-bearing: fails — The paper’s conclusions may not depend on it.
- Based: passes — The paper gives a reason why it holds.
Probably not a substantial claim. It may be too vague to check against evidence. The paper’s conclusions may not depend on it.
In the paper
“Neotropical countries like Brazil and Argentina stand out for their substantial zoological research capacity and international collaborations, helping establish the Neotropics as the top region for newly recognized mammal species (see Fig. 2 and Table 3; see also Dalapicolla and Percequillo 2020).”
§ How many mammal species are there now? Updates and trends in taxonomic, nomenclatural, and geographic knowledge > Discussion > Patterns and shortfalls in global mammal biodiversity.
What the sources say
- Not matchedcites Dalapicolla and Percequillo 2020
Couldn’t be matched to a paper in Crossref, so it can’t be checked.
plaindirect- Asserted: passes — The authors put it forward as true.
- Checkable: passes — It can be checked against evidence.
- Load-bearing: unclear — It is unclear whether the paper’s conclusions depend on it.
- Based: passes — The paper gives a reason why it holds.
It may state two separate claims as one.
- Not matched
A conclusion the paper draws from its own results — it cites no other source for it, so there is none to check. The quote shows it is in the paper.
In the paper
“Nevertheless, the value of updated species lists to biodiversity science outweighs the pitfalls of maintaining them.”
§ How many mammal species are there now? Updates and trends in taxonomic, nomenclatural, and geographic knowledge > Discussion > Mammal taxonomy in conservation and biodiversity infrastructure.
plain- Asserted: passes — The authors put it forward as true.
- Checkable: fails — It may be too vague to check against evidence.
- Load-bearing: passes — The paper’s conclusions depend on it.
- Based: passes — The paper gives a reason why it holds.
Probably not a substantial claim. It may be too vague to check against evidence.
In the paper
“Unfortunately, delayed IUCN assessments are not unique to mammals and are viewed as a top priority for improving conservation outcomes globally (reviewed in Bachman et al. 2019).”
§ How many mammal species are there now? Updates and trends in taxonomic, nomenclatural, and geographic knowledge > Discussion > Mammal taxonomy in conservation and biodiversity infrastructure.
What the sources say
- Not checked — no full text of the sourcecites Bachman et al. 2019 source
plain- Asserted: passes — The authors put it forward as true.
- Checkable: passes — It can be checked against evidence.
- Load-bearing: fails — The paper’s conclusions may not depend on it.
- Based: passes — The paper gives a reason why it holds.
Probably not a substantial claim. The paper’s conclusions may not depend on it. It may state two separate claims as one.
A conclusion the paper draws from its own results — it cites no other source for it, so there is none to check. The quote shows it is in the paper.
In the paper
“As a result, conservation priorities sometimes guide taxonomic practices rather than vice versa, leading either to the splitting of species into multiple smaller units or the lumping of species to conserve those same units as subspecies or ESUs.”
§ How many mammal species are there now? Updates and trends in taxonomic, nomenclatural, and geographic knowledge > Discussion > Mammal taxonomy in conservation and biodiversity infrastructure.
plaindirect- Asserted: passes — The authors put it forward as true.
- Checkable: passes — It can be checked against evidence.
- Load-bearing: unclear — It is unclear whether the paper’s conclusions depend on it.
- Based: passes — The paper gives a reason why it holds.
It may state two separate claims as one.
The paper states this without a source or data behind it here, so there is nothing to check it against. The quote shows it is in the paper.
In the paper
“Most often these units are species (but specimens or individuals are also commonly used).”
§ How many mammal species are there now? Updates and trends in taxonomic, nomenclatural, and geographic knowledge > Discussion > Mammal taxonomy in conservation and biodiversity infrastructure.
plain- Asserted: passes — The authors put it forward as true.
- Checkable: passes — It can be checked against evidence.
- Load-bearing: fails — The paper’s conclusions may not depend on it.
- Based: fails — The paper may give no reason why it holds.
Probably not a substantial claim. The paper’s conclusions may not depend on it. The paper may give no reason why it holds. It may state two separate claims as one.
A conclusion the paper draws from its own results — it cites no other source for it, so there is none to check. The quote shows it is in the paper.
In the paper
“Doing so improves the rigor of a wide range of studies in conservation, biodiversity, and biomedical sciences that rely on accurate taxonomy, facilitating work that might otherwise go undone.”
§ How many mammal species are there now? Updates and trends in taxonomic, nomenclatural, and geographic knowledge > Discussion > Mammal taxonomy in conservation and biodiversity infrastructure.
plaindirect- Asserted: passes — The authors put it forward as true.
- Checkable: fails — It may be too vague to check against evidence.
- Load-bearing: passes — The paper’s conclusions depend on it.
- Based: fails — The paper may give no reason why it holds.
Probably not a substantial claim. It may be too vague to check against evidence. The paper may give no reason why it holds. It may state two separate claims as one.
A conclusion the paper draws from its own results — it cites no other source for it, so there is none to check. The quote shows it is in the paper.
In the paper
“The value of species-centric taxonomic databases like the MDD grows in proportion to the number of disparate sources of biodiversity knowledge that they can effectively integrate while maintaining coherency.”
§ How many mammal species are there now? Updates and trends in taxonomic, nomenclatural, and geographic knowledge > Discussion > Mammal taxonomy in conservation and biodiversity infrastructure.
plaincorrelational- Asserted: passes — The authors put it forward as true.
- Checkable: fails — It may be too vague to check against evidence.
- Load-bearing: fails — The paper’s conclusions may not depend on it.
- Based: fails — The paper may give no reason why it holds.
Probably not a substantial claim. It may be too vague to check against evidence. The paper’s conclusions may not depend on it. The paper may give no reason why it holds.
A claim is checked only against the cited paper’s full text, never its abstract, and none is available for its sources.
In the paper
“However, others have pointed out that although some conservation organizations recognize subspecies and other infraspecific conservation units (e.g., the IUCN, NatureServe), the species rank has remained the primary “currency of conservation” in various mammal clades (Rylands and Mittermeier 2014; Gippoliti et al. 2018).”
§ How many mammal species are there now? Updates and trends in taxonomic, nomenclatural, and geographic knowledge > Discussion > Mammal taxonomy in conservation and biodiversity infrastructure.
What the sources say
plain- Asserted: passes — The authors put it forward as true.
- Checkable: passes — It can be checked against evidence.
- Load-bearing: fails — The paper’s conclusions may not depend on it.
- Based: passes — The paper gives a reason why it holds.
Probably not a substantial claim. The paper’s conclusions may not depend on it.
A conclusion the paper draws from its own results — it cites no other source for it, so there is none to check. The quote shows it is in the paper.
In the paper
“Thus, greater MDD-to-IUCN integration carries potential for speeding up assessment processes and improving outcomes in mammal conservation.”
§ How many mammal species are there now? Updates and trends in taxonomic, nomenclatural, and geographic knowledge > Discussion > Mammal taxonomy in conservation and biodiversity infrastructure.
hedgedconditional- Asserted: passes — The authors put it forward as true.
- Checkable: fails — It may be too vague to check against evidence.
- Load-bearing: passes — The paper’s conclusions depend on it.
- Based: passes — The paper gives a reason why it holds.
Probably not a substantial claim. It may be too vague to check against evidence. It may state two separate claims as one.
A conclusion the paper draws from its own results — it cites no other source for it, so there is none to check. The quote shows it is in the paper.
In the paper
“Continuously curated data on the MDD now presents an excellent opportunity for greater cross-linking among various databases that contain mammal biodiversity information.”
§ How many mammal species are there now? Updates and trends in taxonomic, nomenclatural, and geographic knowledge > Discussion > Future directions and conclusion.
plaincorrelational- Asserted: passes — The authors put it forward as true.
- Checkable: fails — It may be too vague to check against evidence.
- Load-bearing: fails — The paper’s conclusions may not depend on it.
- Based: passes — The paper gives a reason why it holds.
Probably not a substantial claim. It may be too vague to check against evidence. The paper’s conclusions may not depend on it.
A claim is checked only against the cited paper’s full text, never its abstract, and none is available for its sources.
In the paper
“Ideally, all units along the population-to-species continuum would receive some conservation protections regardless of rank, but the finite resources available for conservation and incompleteness of global biodiversity assessments have provided obstacles (Gippoliti and Amori 2007; Coates et al. 2018).”
§ How many mammal species are there now? Updates and trends in taxonomic, nomenclatural, and geographic knowledge > Discussion > Mammal taxonomy in conservation and biodiversity infrastructure.
What the sources say
- Not checked — no full text of the sourcecites Gippoliti and Amori 2007
- Not checked — no full text of the sourcecites Coates et al. 2018 source
plaindirect- Asserted: passes — The authors put it forward as true.
- Checkable: passes — It can be checked against evidence.
- Load-bearing: fails — The paper’s conclusions may not depend on it.
- Based: passes — The paper gives a reason why it holds.
Probably not a substantial claim. The paper’s conclusions may not depend on it.
A claim is checked only against the cited paper’s full text, never its abstract, and none is available for its sources.
In the paper
“Global South countries are developing in-country biodiversity research capacity and infrastructure, addressing explicit goals for bridging the Linnaean and Wallacean shortfalls (Klopper et al. 2002; Prathapan and Rajan 2020).”
§ How many mammal species are there now? Updates and trends in taxonomic, nomenclatural, and geographic knowledge > Discussion > Patterns and shortfalls in global mammal biodiversity.
What the sources say
plaindirect- Asserted: passes — The authors put it forward as true.
- Checkable: passes — It can be checked against evidence.
- Load-bearing: unclear — It is unclear whether the paper’s conclusions depend on it.
- Based: passes — The paper gives a reason why it holds.
It may state two separate claims as one.
In the paper
“However, in mammals at least, eponymous common names would be much easier to begin changing given that they are unregulated by any governing body (in contrast to birds; Winker 2024).”
§ How many mammal species are there now? Updates and trends in taxonomic, nomenclatural, and geographic knowledge > Discussion > Future directions and conclusion.
What the sources say
- Not checked — no full text of the sourcecites Winker 2024 source
plain- Asserted: passes — The authors put it forward as true.
- Checkable: passes — It can be checked against evidence.
- Load-bearing: passes — The paper’s conclusions depend on it.
- Based: passes — The paper gives a reason why it holds.
It may state two separate claims as one.
A conclusion the paper draws from its own results — it cites no other source for it, so there is none to check. The quote shows it is in the paper.
In the paper
“However, there is potential for much closer integration of MDD efforts with downstream biodiversity resources like the IUCN Red List.”
§ How many mammal species are there now? Updates and trends in taxonomic, nomenclatural, and geographic knowledge > Discussion > Mammal taxonomy in conservation and biodiversity infrastructure.
hedgedconditional- Asserted: passes — The authors put it forward as true.
- Checkable: fails — It may be too vague to check against evidence.
- Load-bearing: fails — The paper’s conclusions may not depend on it.
- Based: passes — The paper gives a reason why it holds.
Probably not a substantial claim. It may be too vague to check against evidence. The paper’s conclusions may not depend on it.
A conclusion the paper draws from its own results — it cites no other source for it, so there is none to check. The quote shows it is in the paper.
In the paper
“By ensuring that these metadata are linked to broader biodiversity infrastructure, the MDD supports more robust and integrative approaches to mammalian taxonomy and conservation planning than would otherwise be possible.”
§ How many mammal species are there now? Updates and trends in taxonomic, nomenclatural, and geographic knowledge > Discussion > Future directions and conclusion.
plaindirect- Asserted: passes — The authors put it forward as true.
- Checkable: fails — It may be too vague to check against evidence.
- Load-bearing: passes — The paper’s conclusions depend on it.
- Based: passes — The paper gives a reason why it holds.
Probably not a substantial claim. It may be too vague to check against evidence.
A conclusion the paper draws from its own results — it cites no other source for it, so there is none to check. The quote shows it is in the paper.
In the paper
“MDD2 provides a comprehensive resource that not only lessens aspects of the Linnean and Wallacean shortfalls but also highlights critical remaining knowledge gaps.”
§ How many mammal species are there now? Updates and trends in taxonomic, nomenclatural, and geographic knowledge > Discussion > Future directions and conclusion.
plaindirect- Asserted: passes — The authors put it forward as true.
- Checkable: passes — It can be checked against evidence.
- Load-bearing: passes — The paper’s conclusions depend on it.
- Based: passes — The paper gives a reason why it holds.
Probably not a substantial claim.
A conclusion the paper draws from its own results — it cites no other source for it, so there is none to check. The quote shows it is in the paper.
In the paper
“In conclusion, MDD2 and future versions offer a platform for the community curation of often hard-to-access but fundamentally important data that underpins biodiversity knowledge of living and recently extinct mammals.”
§ How many mammal species are there now? Updates and trends in taxonomic, nomenclatural, and geographic knowledge > Discussion > Future directions and conclusion.
plaindirect- Asserted: passes — The authors put it forward as true.
- Checkable: passes — It can be checked against evidence.
- Load-bearing: passes — The paper’s conclusions depend on it.
- Based: passes — The paper gives a reason why it holds.
Probably not a substantial claim.
A conclusion the paper draws from its own results — it cites no other source for it, so there is none to check. The quote shows it is in the paper.
In the paper
“The hard-won nomenclatural metadata included in MDD2 provide researchers with the foundational tools needed to conduct taxonomic revisions, resolve nomenclatural conflicts, and refine species boundaries.”
§ How many mammal species are there now? Updates and trends in taxonomic, nomenclatural, and geographic knowledge > Discussion > Future directions and conclusion.
plaindirect- Asserted: passes — The authors put it forward as true.
- Checkable: passes — It can be checked against evidence.
- Load-bearing: passes — The paper’s conclusions depend on it.
- Based: passes — The paper gives a reason why it holds.
Probably not a substantial claim.
The authors state this as an assumption.
The past rate of mammal species recognition/description since 1980 will continue into the future.
“leading to projections of ∼7,079 species by 2030 and ∼8,376 by 2050 if these trends continue”
The paper relies on this without support.
The species totals from the 14 mammalian compendia are comparable and accurate enough to estimate a global rate of species recognition.
“at a rate of ∼65 species/yr based on past totals from 14 mammalian compendia”
The paper relies on this without support.
The total species counts from the compared compendia (other than IUCN) are representative of the number of recognized mammal species at their time.
“total species counts were extracted from each source (other than IUCN version totals, which are not representative of all recognized mammals at their time of versioning) and used to estimate the rate of new mammal species recognition from 1980 to 2024 using linear regression.”
The authors state this as an assumption.
The observed trend in mammal species recognition from 1980 to 2024 will continue into the future.
“The equation generated for the linear regression line was then used to estimate total recognized mammal species by 2030, 2040, 2050, and 2100 if the observed trends were to continue.”
The paper relies on this without support.
Much of the information used to update the MDD is in rare archives, offline sources, or behind paywalls.
“Because much of the information used to update the MDD is in rare archives, offline sources, or behind paywalls, manual data curation by a dedicated team of students and volunteers has been crucial in collating these data and linking their contained biodiversity knowledge.”
The paper relies on this without support.
The Google Analytics data accurately reflects the number of unique users and their locations.
“Over a recent 17-mo period, it was visited by 1,200 to 2,900 users/mo for a total of 25,991 unique users that were located in 170 different countries (Google Analytics: 19 May 2023 to 19 October 2024).”
The paper relies on this without support.
The historical estimates of mammal species richness from different sources are comparable enough to track trends.
“Estimates of total mammal species richness continued to decrease before reaching a low in 1980 when Corbet and Hill listed 4,005 recent mammal species (C&H1), being the first known publication since the peak of mammalian descriptive taxonomy to include a complete list of every then-recognized valid mammal species.”
The authors state this as an assumption.
Observed trends in historical species descriptions or species recognition will continue into the future.
“if observed trends in historical species descriptions were to continue”
“If this trend continues”
Self-check
Percentages, sums and reported differences re-computed from the paper’s own numbers.
Each contradiction between two passages listed here was confirmed by an independent check.
Rated minor: it would not touch a result — a value no result rests on, a p-value that stays on the same side of the significance level, or a conflict that is clerical, resolved elsewhere in the paper, or outside its own findings.
In the paper
§ How many mammal species are there now? Updates and trends in taxonomic, nomenclatural, and geographic knowledge > Abstract
“| Species | 4,809 | 5,115 | 5,416 | 5,489 | 6,495 | 6,554 | 5,983 | 6,753 |”
§ How many mammal species are there now? Updates and trends in taxonomic, nomenclatural, and geographic knowledge > Results > Taxonomic change and global biodiversity.
“MDD2 catalogs the taxonomy and distribution of 6,759 valid mammal species (6,629 wild extant; 113 extinct; 17 domestic)”
Rated minor: it would not touch a result — a value no result rests on, a p-value that stays on the same side of the significance level, or a conflict that is clerical, resolved elsewhere in the paper, or outside its own findings.
In the paper
§ How many mammal species are there now? Updates and trends in taxonomic, nomenclatural, and geographic knowledge > Results > Taxonomic change and global biodiversity.
“there would be ∼7,079 species by 2030, ∼7,727 by 2040, ∼8,376 by 2050, and ∼11,619 by 2100.”
§ How many mammal species are there now? Updates and trends in taxonomic, nomenclatural, and geographic knowledge > Discussion > Patterns and shortfalls in global mammal biodiversity.
“If this trend continues, we estimate that the total recognized mammal species richness will increase to ∼7,084 species by 2030 and ∼8,382 species by 2050.”
Citations
Cites
Terrestrial ecoregions of the world: a new map of life on Earth
Olson, D. M., Dinerstein, E., Wikramanayake, E. D., Burgess, N. D., Powell, G. V. N., Underwood, E. C., D'amico, J. A., Itoua, I., Strand, H. E., Morrison, J. C., et al. (2001) · BioScience · doi:10.1641/0006-3568(2001)051[0933:teotwa]2.0.co;2 · Cited by 8,488
Darwin, C. R., Murray, J. J., Sons, W. C. A., & Evans., B. &. (1859) · Biodiversity Heritage Library (Smithsonian Institution) · doi:10.5962/bhl.title.82303 · Cited by 5,696
Mammal Species of the World: A Taxonomic and Geographic Reference
Schmid, R., Wilson, D. E., & Reeder, D. M. (1993) · Taxon · doi:10.2307/1223169 · Cited by 5,384
Hennig, W. (1965) · Annual Review of Entomology · doi:10.1146/annurev.en.10.010165.000525 · Cited by 4,248
Nowak, R. (1999) · doi:10.56021/9780801857898 · Cited by 4,102
Mammal species of the world: a taxonomic and geographic reference
(2006) · Choice Reviews Online · doi:10.5860/choice.44-1281 · Cited by 3,008
Ceballos, G., Ehrlich, P. R., & Dirzo, R. (2017) · Proceedings of the National Academy of Sciences · doi:10.1073/pnas.1704949114 · Cited by 2,663
NCBI Taxonomy: a comprehensive update on curation, resources and tools
Schoch, C. L., Ciufo, S., Domrachev, M., Hotton, C. L., Kannan, S., Khovanskaya, R., Leipe, D., Mcveigh, R., O’Neill, K., Robbertse, B., et al. (2020) · Database · doi:10.1093/database/baaa062 · Cited by 2,635
The principles of classification and a classification of mammals
Simpson, G. G. (1945) · Zenodo · doi:10.5281/zenodo.18028696 · Cited by 2,529
Endless Forms: Species and Speciation
Howard, D. J., & Berlocher, S. H. (1998) · Medical Entomology and Zoology · Cited by 2,490
Research works printed but not linked: 48
- Borisenko, 2001, Types of vertebrates in the zoological museum of moscow university
- Cabrera, 1961, Catálogo de los mamíferos de America del Sur, Revista Del Museo Argentino de Ciencias Naturales “Bernardino Rivadavia” e Institutio Nacional de Investigación de Las Ciencias Naturales, 4, 309
- Corbet, 1986, A world list of mammalian species
- Cracraft, 1983, Current Ornithology, 159
- Cuvier, 1797, Tableau élémentaire de l’histoire naturelle des animaux
- Dalapicolla, 2020, Species concepts and taxonomic practice in the integrative taxonomy era: an example using South American rodents, Boletim Da Sociedade Brasileira de Mastozoologia, 88, 36
- de Blainville, 1816, Prodrome d’une nouvelle distribution systématique du règne animal, 113
- de Blainville, 1864, Ostéographie ou description iconographique comparée du squelette et du système dentaire des mammifères recents et fossiles pour servir de la base à la zoologie et à la géologie
- Di Cecco, 2021, Observing the observers: how participants contribute data to iNaturalist and implications for biodiversity science, BioScience, 71, 1179
- Erxleben, 1777, Systema regni animalis per classes, ordines, genera, species, varietates cum synonymia et historia animalium. Classis I. Mammalia
- Fitzinger, 1867, Versuch einer natürlichen Anordnung der Nagethiere (Rodentia). (Schluss.), Sitzungsberichte Der Kaiserlichen Akademie Der Wissenschaften, 56, 57
- AL, 2008, Mammals of South america, volume 1: Marsupials, xenarthrans, shrews, and bats
- Gippoliti, 2012, “Taxonomic inflation” in the historical context of mammalogy and conservation, Hystrix, 23, 8
- Gippoliti, 2018, Impacts of taxonomic inertia for the conservation of African ungulate diversity: an overview, Biological Reviews, 93, 115
- Gmelin, 1788, Systema naturae per regna tria naturae, secundum classes, ordines, genera, species, cum characteribus, differentiis, synonymis, locis. Tomus I. Editio decima tertia, aucta, reformata
- Gray, 1821, On the natural arrangement of vertebrose animals, London Medical Repository, 15, 296
- Groves, 2001, Primate taxonomy
- Gutiérrez, 2018, Species delimitation based on diagnosis and monophyly, and its importance for advancing mammalian taxonomy, Zoological Research, 39, 301
- Hillis, 2020, The detection and naming of geographic variation within species, Herpe, 51, 52
- Huxley, 1881, On the application of the laws of evolution to the arrangement of the Vertebrata, and more particularly of the Mammalia, Proceedings of the Zoological Society of London, 1880, 649
- Kerr, 1792, The animal kingdom, or zoological system of the celebrated sir charles linnaeus. Class I. Mammalia
- Lawrence, 1993, Catalog of recent mammal types in the American Museum of Natural History, Bulletin of the American Museum of Natural History, 217, 1
- Lesson, 1842, Nouveau tableau du règne animal
- Linnaeus, 1758, Systema naturæ per regna tria naturæ, secundum classes, ordines, genera, species, cum characteribus, differentiis, synonymis, locis. Tomus I. Editio decima, reformata
- RA, 2013, Handbook of the mammals of the world
- Nowak, 1991, Walker’s mammals of the world
- Nowak, 1983, Walker’s mammals of the world
- Owen, 1868, On the anatomy of vertebrates
- Pallas, 1766, Miscellanea zoologica quibus novæ imprimis atque obscuræ animalium species describuntur et observationibus iconibusque illustrantur
- Pallas, 1767, Spicilegia zoologica. Fasciculus 1-12
- JL, 2015, Mammals of South america
- Siegismund, 2013, The mammals of Africa. VI. Pigs, hippopotamuses, chevrotain, giraffes, deer, and bovids, 373
- Smith, 2022, Species problems and beyond, 145
- Storer, 1943, General zoology
- Storer, 1951, General zoology. Second edition
- Trouessart, 1897, Catalogus mammalium tam viventium quam fossilium. Tomus I
- Trouessart, 1899, Catalogus mammalium tam viventium quam fossilium. Tomus II
- Uetz, 2016, The Reptile Database turns 20, Herpetological Review, 47, 330
- Uetz, 2021, A quarter century of reptile and amphibian databases, Herpetological Review, 52, 246
- Walker, 1964, Mammals of the world
- Walker, 1968, Mammals of the world
- Walker, 1975, Mammals of the world
- DE, 2016, Handbook of the mammals of the world
- DE, 2017, Handbook of the mammals of the world
- DE, 2009, Handbook of the mammals of the world
- DE, 2011, Handbook of the mammals of the world
- DE, 2014, Handbook of the mammals of the world
- DE, 2018, Handbook of the mammals of the world
Cited by
Sorted by citations
Sex Drives Intraspecific Scaling of Home Range Size in Mammals
Giroux, A., do Valle, D. R., Gurarie, E. D., Vieira, M. V., Forester, J. D., Börger, L., Sepulvida, R., Barbour, N., da Rocha, É. G., Oshima, J. E. D. F., et al. (2025) · Ecology Letters · doi:10.1111/ele.70245 · Cited by 5
Extending mammal specimens with their essential phenotypic traits
McLean, B. S., Bloom, D., Davis, E., Guralnick, R., Santana, S. E., Allen, J. M., Amarilla-Stevens, H. N., Bell, K. C., Blackburn, D. C., Bradley, J. E., et al. (2025) · Journal of Mammalogy · doi:10.1093/jmammal/gyaf062 · Cited by 5
Self-citationMoura, M. R., Carvalho, R. L., Ceron, K., Guedes, J. J. M., Moroti, M. D. T., & Nakamura, G. (2026) · npj Biodiversity · doi:10.1038/s44185-026-00137-6 · Cited by 4
Species delimitation using genome-wide estimates of Dxy and FstPreprint
de Jong, M., Wambach, C., Muloongo, M., Ferrette, B. L. D. S., Wolf, M., & Janke, A. (2025) · bioRxiv (Cold Spring Harbor Laboratory) · doi:10.64898/2025.12.08.692692 · Cited by 4
Umbrello, L. S., Westerman, M., Travouillon, K. J., Blacket, M. J., Cameron, S. F., Mulder, E., & Baker, A. M. (2026) · Zoological Journal of the Linnean Society · doi:10.1093/zoolinnean/zlag082 · Cited by 3
Historical shifts, geographic biases, and biological constraints shape mammal species discovery
Moroti, M. D. T., Guedes, J. J. M., Missio, G. M., Diegues, G. L., Bezerra, A. M. R., & Moura, M. R. (2026) · Journal of Systematics and Evolution · doi:10.1111/jse.70040 · Cited by 3
Cryptic species and taxonomic revision of kangaroo mice, the rodent genus Microdipodops
Hafner, J. C., Upham, N. S., Gowen-Huang, F., & Light, J. E. (2025) · Journal of Mammalogy · doi:10.1093/jmammal/gyaf070 · Cited by 2
Self-citationCronin, C. E., Juman, M. M., Richardson, A. J., Whittier, C. A., Becker, D. J., & Ferguson, A. W. (2025) · bioRxiv (Cold Spring Harbor Laboratory) · doi:10.1101/2025.11.28.691153 · Cited by 2
Identification of novel gammaherpesviruses in North American carnivores
Adibi, R., McLinton, G. M., Chieu, R. V., Kamal, S., Dixon, R.-A. E., Shah, U., Cheung, L. Y. N., Richer, C. G., Hill, M. A. M., Shirose, L. J., et al. (2025) · Virology · doi:10.1016/j.virol.2025.110735 · Cited by 1
The true scale of global wildlife trade is obscured by data gaps
Hughes, A. C., Marshall, B. M., Challender, D. W. S., Edwards, D. P., Eskew, E. A., Lockwood, J. L., Morton, O., Malsch, K., Fukushima, C. S., Hinsley, A., et al. (2026) · Science Advances · doi:10.1126/sciadv.aei3504 · Cited by 1
Mammalian persistence and conservation priorities in a fragmented tropical refuge of Bangladesh
Das, B. K., Jaman, M. F., Jashimuddin, M., Saha, A., Mohajan, B., & Sarker, P. K. (2026) · Journal for Nature Conservation · doi:10.1016/j.jnc.2026.127281 · Cited by 1
Turcios-Casco, M. A., Teta, P., Reyes‐Amaya, N., López, C. M., Wilson, D. E., & Schiavetti, A. (2026) · Journal of Mammalian Evolution · doi:10.1007/s10914-026-09807-5 · Cited by 1
Chapman, O. S., & McLean, B. S. (2026) · Integrative and Comparative Biology · doi:10.1093/icb/icag070 · Cited by 1
Marivaux, L., Negri, F. R., Antoine, P., Stutz, N. S., Boivin, M., Fontoura, E., Pales, L., Hsiou, A. S., Pujos, F., Roddaz, M., et al. (2026) · Journal of Mammalian Evolution · doi:10.1007/s10914-026-09829-z · Cited by 1
Subspecies taxonomy reflects social and geographic patterns of taxonomic effort in tetrapods
Guedes, J. J. M., Diniz‐Filho, J. A. F., Freitas, A. V. L., & Moura, M. R. (2026) · Conservation Biology · doi:10.1111/cobi.70356 · Cited by 1
Pinilla‐Buitrago, G. E., Kass, J. M., & Anderson, R. P. (2026) · Ecography · doi:10.1002/ecog.08590 · Cited by 1
Elbert, J. A., Amman, B. R., Sealy, T. K., Atimnedi, P., Martin, K. A., Towner, J. S., & Howerth, E. W. (2026) · Veterinary Research · doi:10.1186/s13567-026-01785-z · Cited by 1
DNA Replication Timing, Genome Stability and Non-adaptive RadiationPreprint
Herrick, J. (2025) · arXiv (Cornell University) · doi:10.48550/arxiv.2511.12183
Estrada‐Villegas, S., Yantén, A. V., Ávila-García, A. M., Buitrago-Castaño, G., Castañeda, M., Hernández-Leal, O. F., Solari, S., Sepúlveda, L. L. L., Ortiz-Yusty, C. E., Sánchez, J., et al. (2026) · Biodiversity and Conservation · doi:10.1007/s10531-026-03421-w
Hopp, S. L. (2026) · The Wilson Journal of Ornithology · doi:10.1080/15594491.2025.2609438
Moreira, C. D. N., Oliveira, J. I. N., Yonenaga-Yassuda, Y., do Nascimento, V. A., Wolf, I. R., & Martins, C. E. M. D. A. (2026) · Mammalian Genome · doi:10.1007/s00335-026-10205-8
Population dynamics of Townsend's big‐eared bats: effect of age and drought on survival
Hamilton, N., Ruzicka, R. E., Light, J. E., & Morrison, M. L. (2026) · Journal of Wildlife Management · doi:10.1002/jwmg.70190
rmdd: Resolve Mammal Names with the Mammal Diversity Database
Andrade, P. E. S. (2026) · doi:10.32614/cran.package.rmdd
Torres, D. A., Botero, V. S., Ramirez-Chaves, H. E., & Ceballos-Márquez, A. (2026) · Biota Colombiana · doi:10.21068/2539200x.1304
Size Disparity in Putative Primate Adaptive Radiations and Other Mammalian Clades
Scott, J. E. (2026) · American Journal of Biological Anthropology · doi:10.1002/ajpa.70250
Okono, F. P. M., Ntonga, P. A., Grunwald, A. L., Demos, T. C., Nguesse, L. E., Hurme, E., Patterson, B. D., & Fils, E. M. B. (2026) · doi:10.3897/arphapreprints.e195471
Diversity and conservation status of terrestrial mammals in a wind farm in Tamaulipas, Mexico
Cruz-Oropeza, O., Bárcenas, H. V., Zarza, H., & Ceballos, G. (2026) · Check List · doi:10.15560/22.2.369
Species richness and photographic capture rate of mammals in Northwestern Ecuador
Barnuevo, M. L., Verdonk, J., Yancha, F. A., Arroyo, C. L., Guananga, H., Gonzaga, S., Tacuri, V., Garófalo, A., & Ríos, G. Z. (2026) · Mammalia · doi:10.1515/mammalia-2025-0104
Xie, S., Zhang, G., Chen, Z., Zhou, J., Tu, F., Yu, W., Wang, X., & He, K. (2026) · Molecular Phylogenetics and Evolution · doi:10.1016/j.ympev.2026.108640
Evaluating the use of taxonomy in the IUCN Red List
Garnett, S. T., Johnston, C. E., Bowles, P., Christidis, L., Conix, S., Duckworth, J. W., Lien, A. M., Zachos, F. E., & Witteveen, J. (2026) · Conservation Biology · doi:10.1111/cobi.70306
Brito, J., Curay, J., León-Caldas, V., Lojan-Cueva, P., Ojala‐Barbour, R., Pozo-Zamora, G. M., Simba, L., Tito, P., Vargas, R., Vega-Yánez, M. A., et al. (2026) · PeerJ · doi:10.7717/peerj.21382
A scalable exemplar-based method for aligning biological taxonomies
Rees, J., Franz, N. M., & Sterner, B. (2026) · Biodiversity Data Journal · doi:10.3897/bdj.14.e191754
Mammals from Los Mármoles National Park, one of the first protected areas in Mexico
Aguilar-López, M., Monter-Vargas, J. L., Ramos-Frías, J., Ángeles-Escudero, J. I., Aguilar-López, J. L., Guevara, L., & Aguilar‐Rodríguez, P. A. (2026) · Therya · doi:10.12933/therya.2026.6259
A global database of West Nile virus host prevalence and competence
Richter‐Boix, À., Froxán-Grabalosa, J., Bogdanović, N., Cerecedo-Iglesias, C., Wint, W., Olyzadeh, R., Hartung, T., Marini, G., Re, D. D., Koopmans, M., et al. (2026) · Scientific Data · doi:10.1038/s41597-026-07648-8
Contrasting patterns of alpine biodiversity across mountains and taxa worldwide
Schultz, L., Mottl, O., Riaño, L. C. P., Rentier, E. S., Denelle, P., Dullinger, S., Kreft, H., Urbach, D., Snethlage, M. A., Testolin, R., et al. (2026) · Nature Communications · doi:10.1038/s41467-026-75210-6
Montauban, C., Devenish, A. J. M., Budinski, I., Annorbah, N. N. D., Dwumah, K. A., Razgour, O., Monadjem, A., Sánchez, J. R., Dalton, D. L., & Tobias, J. A. (2026) · Global Ecology and Conservation · doi:10.1016/j.gecco.2026.e04327
Flores, A., Sobrevilla, C. T., & Guerra, J. (2026) · Mammalia aequatorialis · doi:10.59763/mam.aeq.v8i2.145
Historical, taxonomic, and cultural patterns in scientific naming across Animalia
Nojiri, K., Inoshita, K., Sugeno, H., & Taga, T. (2026) · PLoS ONE · doi:10.1371/journal.pone.0353612
Llancachahua-Tarqui, D., Sánchez-Vendizú, P. Y., Cadenillas, R., Novaes, R. L. M., & Pacheco, V. (2026) · Mammalia · doi:10.1515/mammalia-2026-0001
Dylewski, Ł., Bielicki, K., Hoffmann, N., Staniszewski, P., & Targoszyńska, M. (2026) · Springer eBooks · doi:10.1007/978-3-031-08956-5_2058-1
Wei, Q., Liu, N., Cao, L., Kang, X., Abramov, A. V., Duan, B., Lissovsky, A. A., Han, X., Shan, W., & Ge, D. (2026) · Journal of Systematics and Evolution · doi:10.1111/jse.70105
Bat–rodent–human interfaces in the Americas: a synthesis of zoonotic pathways
Arnathau, C., Garchitorena, A., Roche, B., García-Hernández, M.-E., Vigueras-Galván, A. L., Rodríguez‐Moreno, Á., Ibarra-Cerdeña, C. N., Zarza, H., Hernández-Villegas, E. N., Jacquet, S., et al. (2026) · Critical Reviews in Microbiology · doi:10.1080/1040841x.2026.2719579
Generalist Open-World Temporal PerceptionPreprint
Sminchisescu, C. (2026) · arXiv (Cornell University) · doi:10.48550/arxiv.2609.06823
Synonymy in Taxonomy: Where Is the Evidence?
Scott, G. H. (2026) · Geosciences · doi:10.3390/geosciences16090373
Colombia land of mammals: patterns of richness, natural history and biogeography
Telles-Ospina, S., Quintero-López, E. E., Montilla, S. O., & Buitrago‐Torres, D. L. (2026) · Mammal Research · doi:10.1007/s13364-026-00900-x
Barreda, S., Rengifo, E. M., Pacheco, J., Cabrera, A., Saucedo-Bazalar, M., & Orjeda, G. (2026) · Biotropica · doi:10.1111/btp.70261
Gray, A., Zhuk, A. S., Brito, J. C., Schmidt‐Küntzel, A., Marker, L. L., Edwards, C. W., Figueiró, H. V., & Koepfli, K. (2026) · Mammalia · doi:10.1515/mammalia-2026-0047
Takashina, N., & Kusumoto, B. (2026) · Ecology and Evolution · doi:10.1002/ece3.74433
Rowsey, D. M., Smith, S. M., Chavez, L. J. Z., Rivera, D. C., Hess, S., Jones, M. F., Bucci, M. E., Mohammadian, S., Alston, J. M., Baez, J., et al. (2026) · Journal of Mammalogy · doi:10.1093/jmammal/gyag077
Self-citationRuperto, E. F., Quiroga‐Carmona, M., Menéndez, J., Patterson, F. A., Novillo, A., & Sassi, P. L. (2026) · Journal of Zoology · doi:10.1111/jzo.70168
Shapiro, J. T., Barnes, C., Nielsen, I. B., Rasmussen, L., Monadjem, A., McCleery, R. A., & Hansen, A. J. (2026) · Web Ecology · doi:10.5194/we-26-223-2026
Barbero, S., Cassini, G. H., Soto, I. M., & Teta, P. (2026) · The Holocene · doi:10.1177/09596836261494529
Dianat, M., Bryja, J., Mamba, M. L., Torrent, L., & Monadjem, A. (2026) · Systematics and Biodiversity · doi:10.1080/14772000.2026.2736655
Taxon‐Specific Selection Drives Contrasting Fast–Slow Strategies of Montane Small Mammal Communities
Duan, C. W., Zou, Q., Wen, Z., Wang, X., Chen, S., Huang, G., Liu, S., & Wei, F. (2026) · Diversity and Distributions · doi:10.1111/ddi.70284
Metadata
- Authors
- Burgin, C. J., Zijlstra, J. S., Becker, M. A., Handika, H., Alston, J. M., Widness, J., Liphardt, S., Huckaby, D. G., & Upham, N. S.
- Affiliations
- University of New Mexico (US)
- Hesperomys Project , Orinda, CA 94563,
- Smithsonian Institution (US)
- Louisiana State University (US)
- University of Arizona (US)
- Yale University (US)
- University of Montana (US)
- California State University, Long Beach (US)
- Arizona State University (US)
- Corresponding author
- Burgin, Connor J
- Upham, Nathan S
- ORCID
- Venue
- Journal of Mammalogy
- Publisher
- Oxford University Press (OUP)
- Published
- 2025-09-14
- Volume
- 106
- Issue
- 5
- Pages
- 1082-1117
- ISSN
- 0022-2372 (ISSN-L)
- 1545-1542
- PMC
- PMC12526941
- OpenAlex
- W4414346270
- Cited by
- 54
- References
- 237
- Citations by year
- 2026: 47 · 2025: 7
- FWCI
- 29.16
- Type
- journal article
- Language
- en
- Open access
- hybrid
- doi.org
- Licence
- Locations
- Journal of Mammalogy (publishedVersion, cc-by-nc)
- bioRxiv (Cold Spring Harbor Laboratory) (submittedVersion, cc-by-nc)
- Europe PMC (PubMed Central) (publishedVersion, cc-by-nc)
- PubMed (publishedVersion)
- Europe PMC (PubMed Central) (submittedVersion, cc-by-nc)
- PubMed Central (submittedVersion, cc-by-nc)
- Zenodo (CERN European Organization for Nuclear Research)
- Funders
- American Society of Mammalogists
- National Science Foundation
- VertLife Terrestrial (DEB 1441737)
- National Institutes of Health (1R21AI164268, 1R35GM156919)
- Topics
- Physical Sciences › Earth and Planetary Sciences › Paleontology › Evolution and Paleontology Studies
- Physical Sciences › Environmental Science › Ecology › Wildlife Ecology and Conservation
- Physical Sciences › Computer Science › Information Systems › Research Data Management Practices
- Keywords
- mammal diversity, mammal taxonomy, zoological nomenclature, geographic distribution, biogeographic realms, type specimens, species delimitation, Hesperomys, synonymy, mammals, bats
About these checks
Registry, retraction, Cites and statistics results are computed, not judged, with one exception: a printed reference that no index lists is read once by a model before it counts as a citation error. Claims are extracted by a model and kept only when their quote appears verbatim in the text; each cited source is then checked, with a model’s help, for whether it says what the claim relies on. Those verdicts can be wrong — read the claim’s quote and the cited source before relying on one.
A language model drew the claims from the paper on 2026-10-10, under version 3 of the claim definition (model deepseek-v4.1-flash, prompt extract-v3).
A second model labelled each claim on 2026-10-10 (model jev-1.13-20260917, definition revision gold-guideline-v0.2).
Cited sources are checked with a language model’s help (gpt-6-sol).
Statistics and arithmetic are recomputed, not judged.
Confidence bands are shown only for fields calibrated on our annotated test set. None is calibrated yet, so no band is shown.
What counts as a claim ›How we measure confidence ›How we check this ›
Are you an author, or do you see a problem with this page? Request a review
