

The DOI matches its Crossref record; 31 of the 31 references it cites were found in a registry or an index; 17 of the 31 sources its claims cite were checked for support.
ZFP36L1 and ZFP36L2 control LDLR mRNA stability via the ERK–RSK pathway
Open accessAbstract
Low-density lipoprotein receptor (LDLR) mRNA is unstable, but is stabilized upon extracellular signal-regulated kinase (ERK) activation, possibly through the binding of certain proteins to the LDLR mRNA 3′-untranslated region (UTR), although the detailed mechanism underlying this stability control is unclear. Here, using a proteomic approach, we show that proteins ZFP36L1 and ZFP36L2 specifically bind to the 3′-UTR of LDLR mRNA and recruit the CCR4-NOT-deadenylase complex, resulting in mRNA destabilization. We also show that the C-terminal regions of ZFP36L1 and ZFP36L2 are directly phosphorylated by p90 ribosomal S6 kinase, a kinase downstream of ERK, resulting in dissociation of the CCR4-NOT-deadenylase complex and stabilization of LDLR mRNA. We further demonstrate that targeted disruption of the interaction between LDLR mRNA and ZFP36L1 and ZFP36L2 using antisense oligonucleotides results in upregulation of LDLR mRNA and protein. These results indicate that ZFP36L1 and ZFP36L2 regulate LDLR protein levels downstream of ERK. Our results also show the usefulness of our method for identifying critical regulators of specific RNAs and the potency of antisense oligonucleotide-based therapeutics.
Overview
AI snapshot
Written from the paper’s full text.
TL;DR
ZFP36L1 and ZFP36L2 bind the LDLR mRNA 3′-UTR ARE1 region and recruit the CCR4-NOT deadenylase complex to destabilize LDLR mRNA; ERK–RSK signaling phosphorylates their C-termini, dissociating CCR4-NOT and stabilizing LDLR mRNA. LNA antisense oligonucleotide Oligo-L1 disrupts this interaction, increasing LDLR mRNA/protein and LDL uptake in Hep3B cells.
Key findings
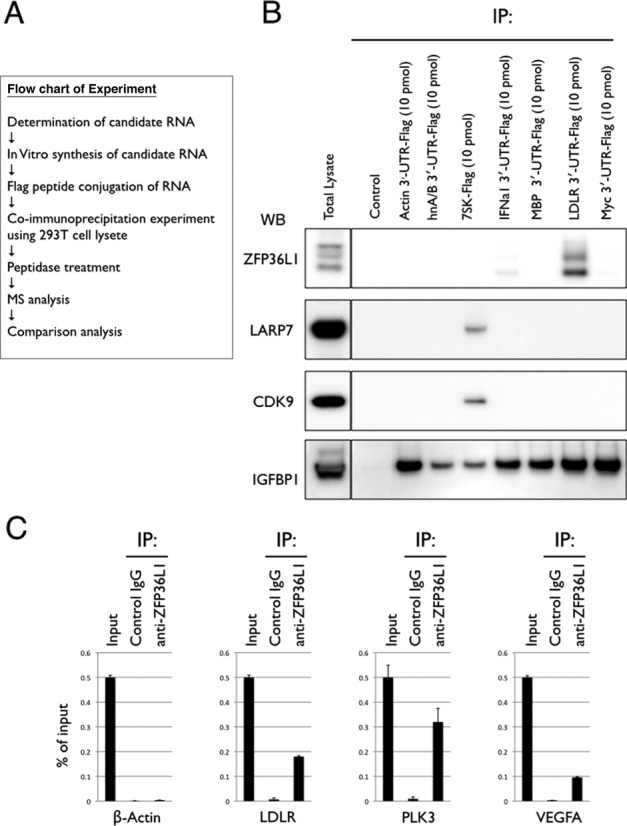
- A proteomic screen using seven Flag-tagged bait RNAs identified ZFP36L1 and ZFP36L2 as specific binders of the LDLR mRNA 3′-UTR (ARE1–3); about 400 peptides from ∼150 proteins were identified, with ∼25% common to all baits, and ZFP36L1/L2 appeared in all four LDLR MS analyses. Endogenous ZFP36L1 co-immunoprecipitated LDLR, PLK3, and VEGFA mRNAs but not β-actin mRNA.
- ZFP36L1 and ZFP36L2 predominantly bound the ARE1 UAUUUAUU sequence. Double siRNA knockdown of ZFP36L1 and ZFP36L2 in HeLa cells increased LDLR mRNA and protein and stabilized LDLR mRNA; PMA-mediated LDLR mRNA stabilization was lost after knockdown. LNA Oligo-L1 blocked the LDLR–ZFP36L1/L2 interaction, increased LDLR mRNA and protein in HeLa and Hep3B cells, and increased DiI-LDL uptake in Hep3B cells; control oligos L2–L6 did not.
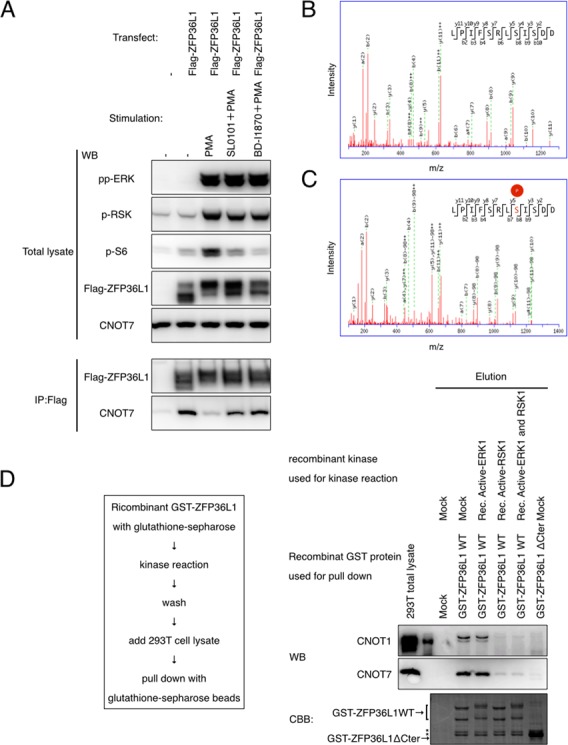
- ERK-dependent phosphorylation was mapped to C-terminal serine-334 of ZFP36L1 and serine-493/495 of ZFP36L2 by iTRAQ MS; PMA increased these phosphorylations and U0126 reversed them. PMA inhibited ZFP36L1–CNOT7 interaction, reversed by U0126 or RSK inhibitors BI-D1870/SL0101; recombinant RSK1 directly phosphorylated GST-ZFP36L1 at serine-334 and reduced CNOT1/CNOT7 binding.
- ZFP36L1-SASA or ZFP36L1-ΔC mutants prevented PMA-mediated stabilization of an RFP-LDLR-3′-UTR reporter. PLK3 and VEGFA mRNAs were also stabilized by PMA, whereas cMYC mRNA was not.
Methods
- In vitro RNA-binding protein purification: seven Flag-peptide-tagged bait RNAs, including LDLR 3′-UTR fragments, stable RNAs, and c-Myc, were incubated with 293T lysates, immunoprecipitated, and analyzed by nanoscale LC/MS/MS; interactions were validated by western blot and qPCR co-immunoprecipitation.
- Cell-based assays in HEK293T, HeLa, and Hep3B cells: siRNA knockdown (20 nM), LNA-modified antisense oligonucleotides (80 nM), actinomycin D chase with or without PMA, qPCR normalized to β-actin or Luc2, mRNA half-lives fitted by exponential decay, western blot, and DiI-LDL uptake in Hep3B cells.
- Phosphorylation analysis: iTRAQ-based quantitative MS of Flag-ZFP36L1/L2 from mock-, PMA-, or PMA+U0126-treated 293T cells; in vitro kinase assays with recombinant RSK1/ERK1 and GST-ZFP36L1; Student’s t-test with P < 0.002, n = 3 for qPCR groups.
Limitations
- The paper states that the mechanisms and meaning of PMA-enhanced ZFP36L1 binding to LDLR mRNA remain unknown, and whether ZFP36 family proteins are commonly regulated by these pathways or differ is an open question.
- The paper states that UAUUUAUU is necessary but not sufficient for ZFP36L1/L2 interaction and destabilization, and that further investigation is required to predict target mRNAs in silico; off-target effects of antisense oligonucleotides are important to consider for therapeutic applications.
- Evident from the text: no in vivo animal or human data are presented, and delivery of Oligo-L1 to the liver is not tested; the in vitro RBP purification approach may not fully capture in vivo RNA–protein interactions, although the authors argue it has advantages.
Model-written summary. Check it against the paper before relying on it.
Integrity signals
Registry
Cites
Statistics
Figures
Verification
Claims the paper makes
55 Own result · 25 Own interpretation · 7 Partly supported · 5 No full text of the sources · 3 Supported · 2 Not checked yet · 2 Own method · 1 Supported so far · 1 Not supported · 1 Couldn’t confirm · accuracy not yet measured
Every source the paper cites for this claim was checked and supports it.
In the paper
“We used RNAi-based knockdown to assess the function of ZRP36L1 and ZFP36L2, but as with many RNA-regulating proteins, ZFP36L1 and ZFP36L2 regulate multiple target mRNAs (6).”
§ ZFP36L1 and ZFP36L2 control LDLR mRNA stability via the ERK–RSK pathway > DISCUSSION > Oligonucleotide-based functional validation
What the sources say
- Supportedcites [6] Sanduja, 2011, The roles of TTP and BRF proteins in regulated mRNA decay, Wiley Interdiscip. Rev. RNA source
The TIS11 Family of RNA-Binding Proteins section identifies ZFP36L1 and ZFP36L2 as BRF-1 and BRF-2 and discusses their regulation of target transcripts. The targeted-disruption section describes BRF-1 regulation of VEGF-A mRNA and links BRF-2 to maternal mRNA turnover, consistent with the broad claim that these RNA-regulating proteins act on target mRNAs. No page numbers were available in our copy. (LLM, conf=0.82)
plaindirect- Asserted: passes — The authors put it forward as true.
- Checkable: passes — It can be checked against evidence.
- Load-bearing: passes — The paper’s conclusions depend on it.
- Based: passes — The paper gives a reason why it holds.
- Supported
A result the paper reports from its own data — it cites no other source for it, so there is none to check. The quote shows it is in the paper.
In the paper
“We also examined the effect of Oligo-L1 on the stability of LDLR mRNA in HeLa and 293T cells using an ActD chase experiment and we found that Oligo-L1 stabilized LDLR mRNA in these cell lines (Figure 3F, Supplementary Figure S3G and H).”
§ ZFP36L1 and ZFP36L2 control LDLR mRNA stability via the ERK–RSK pathway > RESULTS > ZFP36L1 and ZFP36L2 destabilize LDLR mRNA
plaindirect- Asserted: passes — The authors put it forward as true.
- Checkable: passes — It can be checked against evidence.
- Load-bearing: passes — The paper’s conclusions depend on it.
- Based: passes — The paper gives a reason why it holds.
A result the paper reports from its own data — it cites no other source for it, so there is none to check. The quote shows it is in the paper.
In the paper
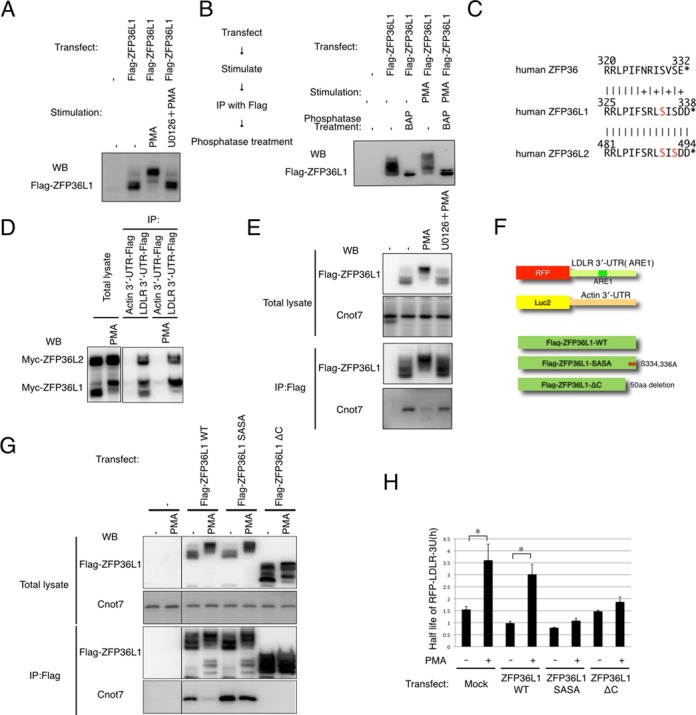
“We also found that the mobility shift of Flag-ZFP36L1, which we immunopurified from Flag-ZFP36L1-overexpressing and PMA-treated 293T cells, could be reversed by treatment with bacterial alkaline phosphatase (Figure 4B).”
§ ZFP36L1 and ZFP36L2 control LDLR mRNA stability via the ERK–RSK pathway > RESULTS > ZFP36L1 is regulated by phosphorylation downstream of ERK
hedgeddirect- Asserted: passes — The authors put it forward as true.
- Checkable: passes — It can be checked against evidence.
- Load-bearing: passes — The paper’s conclusions depend on it.
- Based: passes — The paper gives a reason why it holds.
A result the paper reports from its own data — it cites no other source for it, so there is none to check. The quote shows it is in the paper.
In the paper
“ZFP36L1 did not interact with β-actin mRNA (Figure 1C).”
§ ZFP36L1 and ZFP36L2 control LDLR mRNA stability via the ERK–RSK pathway > RESULTS
plain- Asserted: passes — The authors put it forward as true.
- Checkable: passes — It can be checked against evidence.
- Load-bearing: unclear — It is unclear whether the paper’s conclusions depend on it.
- Based: passes — The paper gives a reason why it holds.
A result the paper reports from its own data — it cites no other source for it, so there is none to check. The quote shows it is in the paper.
In the paper
“We found that CNOT7, a critical enzymatic component of CCR4-NOT deadenylase, interacts with ZFP36L1 and interestingly, this interaction is inhibited by PMA treatment and reversed by U0126 treatment, indicating that this regulation is mediated by the ERK pathway (Figure 4E).”
§ ZFP36L1 and ZFP36L2 control LDLR mRNA stability via the ERK–RSK pathway > RESULTS > ZFP36L1 is regulated by phosphorylation downstream of ERK
plaincorrelational- Asserted: passes — The authors put it forward as true.
- Checkable: passes — It can be checked against evidence.
- Load-bearing: passes — The paper’s conclusions depend on it.
- Based: passes — The paper gives a reason why it holds.
A result the paper reports from its own data — it cites no other source for it, so there is none to check. The quote shows it is in the paper.
In the paper
“the C-terminal regions of ZFP36L1 and ZFP36L2 are directly phosphorylated by p90 ribosomal S6 kinase, a kinase downstream of ERK”
§ ZFP36L1 and ZFP36L2 control LDLR mRNA stability via the ERK–RSK pathway > Abstract
plaindirect- Asserted: passes — The authors put it forward as true.
- Checkable: passes — It can be checked against evidence.
- Load-bearing: passes — The paper’s conclusions depend on it.
- Based: passes — The paper gives a reason why it holds.
- Rests on an assumption: RSK is downstream of ERK.
A result the paper reports from its own data — it cites no other source for it, so there is none to check. The quote shows it is in the paper.
In the paper
“We then examined the interaction between CNOT7 and these ZFP36L1 mutants and found that the ZFP36L1-SASA mutant retained the ability to interact with CNOT7 after PMA treatment, whereas the ZFP36L1-ΔC mutant did not (Figure 4G).”
§ ZFP36L1 and ZFP36L2 control LDLR mRNA stability via the ERK–RSK pathway > RESULTS > ZFP36L1 is regulated by phosphorylation downstream of ERK
plain- Asserted: passes — The authors put it forward as true.
- Checkable: passes — It can be checked against evidence.
- Load-bearing: passes — The paper’s conclusions depend on it.
- Based: passes — The paper gives a reason why it holds.
A result the paper reports from its own data — it cites no other source for it, so there is none to check. The quote shows it is in the paper.
In the paper
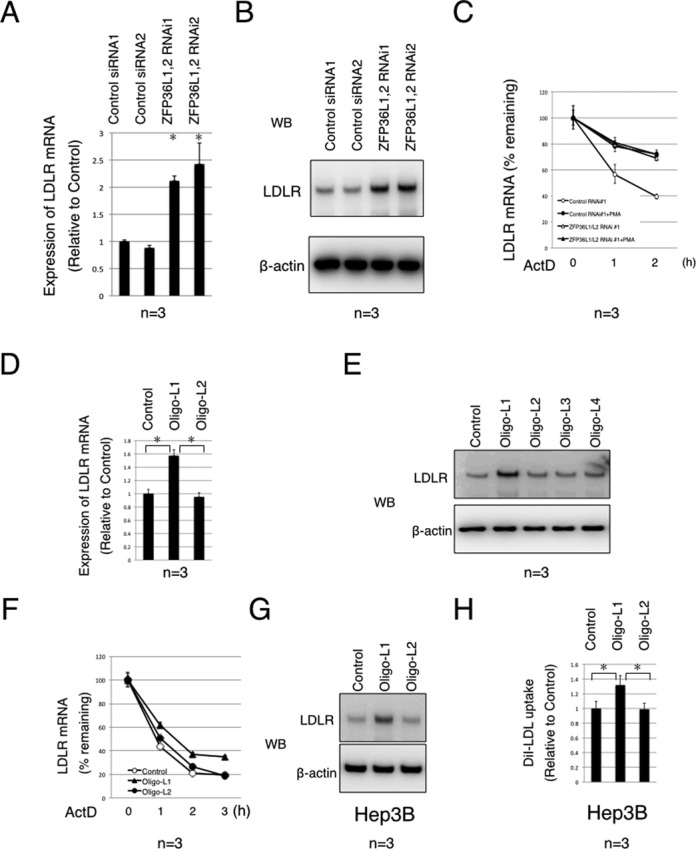
“We found that LDLR mRNA in cells transfected with ZFP36L1 and ZFP36L2 siRNA was clearly more stabilized than that in control siRNA-transfected cells (Figure 3C, Supplementary Figure S3C).”
§ ZFP36L1 and ZFP36L2 control LDLR mRNA stability via the ERK–RSK pathway > RESULTS > ZFP36L1 and ZFP36L2 destabilize LDLR mRNA
boosteddirect- Asserted: passes — The authors put it forward as true.
- Checkable: passes — It can be checked against evidence.
- Load-bearing: passes — The paper’s conclusions depend on it.
- Based: passes — The paper gives a reason why it holds.
A result the paper reports from its own data — it cites no other source for it, so there is none to check. The quote shows it is in the paper.
In the paper
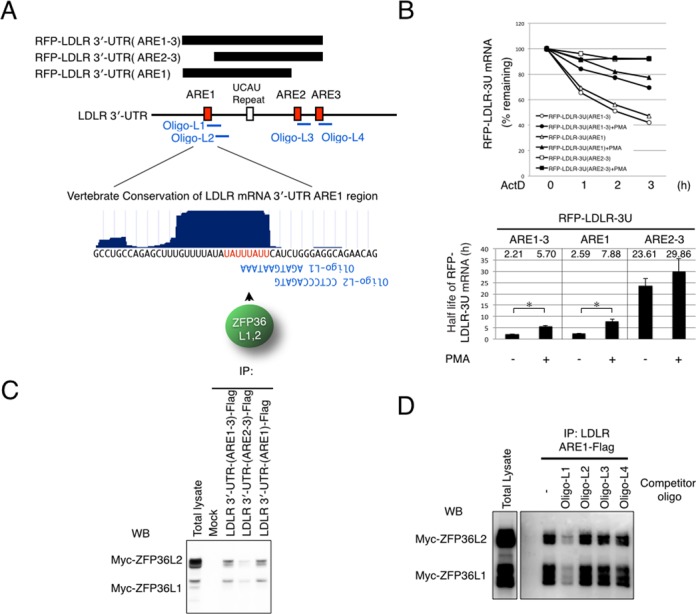
“We found that PMA treatment slightly increased the interaction between Myc-ZFP36L1 and LDLR mRNA, while that with Myc-ZFP36L2 was not affected by PMA treatment (Figure 4C).”
§ ZFP36L1 and ZFP36L2 control LDLR mRNA stability via the ERK–RSK pathway > RESULTS > ZFP36L1 is regulated by phosphorylation downstream of ERK
plain- Asserted: passes — The authors put it forward as true.
- Checkable: passes — It can be checked against evidence.
- Load-bearing: unclear — It is unclear whether the paper’s conclusions depend on it.
- Based: passes — The paper gives a reason why it holds.
A result the paper reports from its own data — it cites no other source for it, so there is none to check. The quote shows it is in the paper.
In the paper
“We then examined the interaction between CNOT7 and these ZFP36L1 mutants and found that the ZFP36L1-SASA mutant retained the ability to interact with CNOT7 after PMA treatment, whereas the ZFP36L1-ΔC mutant did not (Figure 4G).”
§ ZFP36L1 and ZFP36L2 control LDLR mRNA stability via the ERK–RSK pathway > RESULTS > ZFP36L1 is regulated by phosphorylation downstream of ERK
plain- Asserted: passes — The authors put it forward as true.
- Checkable: passes — It can be checked against evidence.
- Load-bearing: passes — The paper’s conclusions depend on it.
- Based: passes — The paper gives a reason why it holds.
- Probably not a substantial claim. 19
- It may state two separate claims as one. 29
- The quote only partly states this claim. 2
At least one cited source doesn’t support this claim or points to a different paper, and none confirmed it — see the verdicts below.
In the paper
“PLK3 and VEGFA mRNAs have recently been identified as targets of ZFP36L1 (7,8), whereas cMYC mRNA does not bind to ZFP36L1 or ZFP36L2.”
§ ZFP36L1 and ZFP36L2 control LDLR mRNA stability via the ERK–RSK pathway > RESULTS > RSK directly phosphorylates ZFP36L1 downstream of ERK
What the sources say
- Disputedcites [7] Horner, 2009, Stimulation of polo-like kinase 3 mRNA decay by tristetraprolin, Mol. Cell. Biol. sourceExperimental — accuracy not yet measured
The Discussion (page unavailable) identifies PLK3 mRNA as a physiological target of TTP (ZFP36), apparently specific to that family member in the tested fibroblasts. The Results report that PLK3 mRNA decay was not slowed by ZFP36L1 deficiency, contrary to the attributed PLK3 claim. The retrieved passages do not address VEGFA as a ZFP36L1 target. (LLM, conf=0.90)
Checked by a reasoning model — may be wrong.
- Not checked — no full text of the sourcecites [8] Hacker, 2010, ZFP36L1 is regulated by growth factors and cytokines in keratinocytes and influences their VEGF production, Growth Factors source
plaindirect- Asserted: passes — The authors put it forward as true.
- Checkable: passes — It can be checked against evidence.
- Load-bearing: fails — The paper’s conclusions may not depend on it.
- Based: passes — The paper gives a reason why it holds.
Probably not a substantial claim. The paper’s conclusions may not depend on it. It may state two separate claims as one.
- Disputed
The cited sources support only part of this claim — read each source’s verdict below.
In the paper
“The CCR4-NOT deadenylase complex has recently been shown to interact with the C-terminus of ZFP36 (16,17); therefore, we next examined whether ZFP36L1 interacts with the CCR4-NOT deadenylase complex and whether this interaction is affected by PMA.”
§ ZFP36L1 and ZFP36L2 control LDLR mRNA stability via the ERK–RSK pathway > RESULTS > ZFP36L1 is regulated by phosphorylation downstream of ERK
What the sources say
- Partly supportedcites [16] Marchese, 2010, MAPKAP kinase 2 blocks tristetraprolin-directed mRNA decay by inhibiting CAF1 deadenylase recruitment, J. Biol. Chem. sourceExperimental — accuracy not yet measured
The section on CAF1 recruitment (Fig. 9A–B; page unavailable) reports that CAF1a and CAF1b interact with TTP, supporting an association with a deadenylase complex. The experiments use full-length TTP and do not locate the interaction at its C-terminus; the paper describes the complex as CCR4–CAF1 rather than demonstrating an interaction with CCR4–NOT as a whole. (LLM, conf=0.86)
- Supportedcites [17] Sandler, 2011, Not1 mediates recruitment of the deadenylase Caf1 to mRNAs targeted for degradation by tristetraprolin, Nucleic Acids Res. source
The Abstract states that Not1, a scaffold of the Ccr4–Not complex, associates with the C-terminal domain of tristetraprolin (TTP/ZFP36). The Results section, “The C-terminal domain of TTP is critical for recruitment of Not1 and Caf1” (page not provided), also reports interaction with Not1, Caf1a and Ccr4a through that domain. (LLM, conf=0.93)
plaincorrelational- Asserted: passes — The authors put it forward as true.
- Checkable: passes — It can be checked against evidence.
- Load-bearing: passes — The paper’s conclusions depend on it.
- Based: passes — The paper gives a reason why it holds.
Probably not a substantial claim.
- Partly supported
The cited sources that could be checked couldn’t confirm or dispute this claim.
In the paper
“We found that endogenous ZFP36L1 interacts with LDLR mRNA, and also with PLK3 and VEGFA mRNAs, previously identified ZFP36L1-interacting mRNAs (7,8).”
§ ZFP36L1 and ZFP36L2 control LDLR mRNA stability via the ERK–RSK pathway > RESULTS
What the sources say
- Could not verifycites [7] Horner, 2009, Stimulation of polo-like kinase 3 mRNA decay by tristetraprolin, Mol. Cell. Biol. sourceExperimental — accuracy not yet measured
The Results and Discussion report that Plk3 mRNA decay was unchanged in ZFP36L1-deficient fibroblasts and identify Plk3 as a physiological target of TTP in that setting. Those findings do not test whether endogenous ZFP36L1 physically interacts with Plk3 mRNA. No passage found addresses an interaction between ZFP36L1 and VEGFA mRNA (searched: ZFP36L1 binding, VEGFA, VEGF). (LLM, conf=0.75)
- Not checked — no full text of the sourcecites [8] Hacker, 2010, ZFP36L1 is regulated by growth factors and cytokines in keratinocytes and influences their VEGF production, Growth Factors source
plaincorrelational- Asserted: passes — The authors put it forward as true.
- Checkable: passes — It can be checked against evidence.
- Load-bearing: fails — The paper’s conclusions may not depend on it.
- Based: passes — The paper gives a reason why it holds.
Probably not a substantial claim. The paper’s conclusions may not depend on it.
- Could not verify
The cited sources support only part of this claim — read each source’s verdict below.
In the paper
“ZFP36 family proteins bind to AREs and trigger the degradation of several ARE-containing mRNAs, including PLK3 and vascular endothelial growth factor A (VEGFA) (7,8).”
§ ZFP36L1 and ZFP36L2 control LDLR mRNA stability via the ERK–RSK pathway > INTRODUCTION
What the sources say
- Partly supportedcites [7] Horner, 2009, Stimulation of polo-like kinase 3 mRNA decay by tristetraprolin, Mol. Cell. Biol. sourceExperimental — accuracy not yet measured
The Discussion (page not provided) establishes that TTP/ZFP36 binds AREs in PLK3 mRNA and promotes its decay. It also reports that PLK3 mRNA was not stabilized in fibroblasts lacking the related proteins ZFP36L1 or ZFP36L2. No passage in our copy supports VEGFA as a target, so the full list attributed to this paper is not supported. (LLM, conf=0.88)
- Not checked — no full text of the sourcecites [8] Hacker, 2010, ZFP36L1 is regulated by growth factors and cytokines in keratinocytes and influences their VEGF production, Growth Factors source
plaindirect- Asserted: passes — The authors put it forward as true.
- Checkable: passes — It can be checked against evidence.
- Load-bearing: fails — The paper’s conclusions may not depend on it.
- Based: passes — The paper gives a reason why it holds.
Probably not a substantial claim. The paper’s conclusions may not depend on it.
- Partly supported
Every source the paper cites for this claim was checked and supports it.
In the paper
“Using this method, we also found well-known 7SK RBPs, including CDK9 and LARP7 as 7SK-Flag specific binding porteins (14) (Table S4). This result demonstrates the accuracy of our strategy.”
§ ZFP36L1 and ZFP36L2 control LDLR mRNA stability via the ERK–RSK pathway > RESULTS
What the sources say
- Supportedcites [14] Diribarne, 2009, 7SK RNA, a non-coding RNA regulating P-TEFb, a general transcription factor, RNA Biol. source
The Introduction identifies CDK9 as a subunit of P-TEFb, and “7SK RNA and HEXIM Proteins Cooperate in P-TEFb Inhibition” reports that 7SK RNA co-immunoprecipitates with P-TEFb. “7SK RNA Released from HEXIM1/2 is Trapped by hnRNPs” describes LARP7 as a highly specific 7SK partner. The citation supports identifying these as known 7SK-associated proteins; the citing authors’ method result and assessment of its accuracy are their own. (LLM, conf=0.88)
boosteddirect- Asserted: passes — The authors put it forward as true.
- Checkable: passes — It can be checked against evidence.
- Load-bearing: fails — The paper’s conclusions may not depend on it.
- Based: passes — The paper gives a reason why it holds.
Probably not a substantial claim. The paper’s conclusions may not depend on it. It may state two separate claims as one.
- Supported
The cited sources support only part of this claim — read each source’s verdict below.
In the paper
“It is known to interact with ZFP36 and ZFP36L1 and to act as an important effector complex of ZFP36-mediated mRNA-destabilization (16,17).”
§ ZFP36L1 and ZFP36L2 control LDLR mRNA stability via the ERK–RSK pathway > DISCUSSION > Regulation of ZFP36L1
What the sources say
- Partly supportedcites [16] Marchese, 2010, MAPKAP kinase 2 blocks tristetraprolin-directed mRNA decay by inhibiting CAF1 deadenylase recruitment, J. Biol. Chem. sourceExperimental — accuracy not yet measured
The Discussion (page unavailable) identifies CCR4–CAF1 as the main deadenylase complex involved in TTP-directed deadenylation, and the recruitment section reports that CAF1 interacts with TTP (ZFP36). Our copy does not establish an interaction with ZFP36L1, so that part of the attributed claim is unsupported. (LLM, conf=0.88)
- Partly supportedcites [17] Sandler, 2011, Not1 mediates recruitment of the deadenylase Caf1 to mRNAs targeted for degradation by tristetraprolin, Nucleic Acids Res. sourceExperimental — accuracy not yet measured
The Results sections report that Not1, a scaffold of the CCR4–NOT complex, associates with tristetraprolin (TTP/ZFP36) and is required for TTP-mediated mRNA decay. The Introduction mentions related proteins BRF1 and BRF2, but our copy does not show an interaction between CCR4–NOT and ZFP36L1; that part of the claim is unsupported. (LLM, conf=0.86)
boosteddirect- Asserted: passes — The authors put it forward as true.
- Checkable: passes — It can be checked against evidence.
- Load-bearing: fails — The paper’s conclusions may not depend on it.
- Based: passes — The paper gives a reason why it holds.
Probably not a substantial claim. The paper’s conclusions may not depend on it. It may state two separate claims as one.
- Partly supported
The cited sources support only part of this claim — read each source’s verdict below.
In the paper
“ZFP36L1 and ZFP36L2 belong to the family of CCCH tandem zinc finger proteins (the ZFP36 family), members of which interact with AREs containing a UAUUUAUU sequence and trigger the degradation of several ARE-containing mRNAs, including PLK3 and VEGFA (7,8,18,19).”
§ ZFP36L1 and ZFP36L2 control LDLR mRNA stability via the ERK–RSK pathway > DISCUSSION > Target prediction of ZFP36L1 and ZFP36L2
What the sources say
- Partly supportedcites [7] Horner, 2009, Stimulation of polo-like kinase 3 mRNA decay by tristetraprolin, Mol. Cell. Biol. sourceExperimental — accuracy not yet measured
The Abstract says ZFP36 family members bind an ARE consensus site, UUAUUUAUU, which contains the claimed UAUUUAUU sequence. The Abstract and Discussion establish that TTP promotes PLK3 mRNA decay, but the Results find no equivalent effect for ZFP36L1 or ZFP36L2 in the fibroblasts studied. No passage located in our copy supports VEGFA as a target. (LLM, conf=0.88)
- Not checked — no full text of the sourcecites [8] Hacker, 2010, ZFP36L1 is regulated by growth factors and cytokines in keratinocytes and influences their VEGF production, Growth Factors source
- Not checked — no full text of the sourcecites [18] Hudson, 2004, Recognition of the mRNA AU-rich element by the zinc finger domain of TIS11d, Nat. Struct. Mol. Biol. source
- Partly supportedcites [19] Duan, 2009, cAMP-dependent posttranscriptional regulation of steroidogenic acute regulatory (STAR) protein by the zinc finger protein ZFP36L1/TIS11b, Mol. Endocrinol. sourceExperimental — accuracy not yet measured
The paper's background section says that ZFP36-family proteins bind AU-rich elements and promote mRNA degradation, and identifies UAUUUAUU as a binding sequence. It also reports TIS11b-mediated destabilization of VEGF mRNA. Our copy does not identify PLK3 as a target (searched: PLK3, polo-like kinase 3). Page numbers were not available in the indexed passages. (LLM, conf=0.88)
plaindirect- Asserted: passes — The authors put it forward as true.
- Checkable: passes — It can be checked against evidence.
- Load-bearing: fails — The paper’s conclusions may not depend on it.
- Based: passes — The paper gives a reason why it holds.
Probably not a substantial claim. The paper’s conclusions may not depend on it. It may state two separate claims as one.
- Partly supported
The cited sources support only part of this claim — read each source’s verdict below.
In the paper
“Given these advantages, plus our fully automated robotic IP and protein identification system, which is highly sensitive and reproducible (11), we opted to use the in vitro purification approach, combined with comparison analysis.”
§ ZFP36L1 and ZFP36L2 control LDLR mRNA stability via the ERK–RSK pathway > DISCUSSION > Methods used to identify the regulator of RNA stability
What the sources say
- Partly supportedcites [11] Iemura, 2012, One-by-one sample preparation method for protein network analysis sourceExperimental — accuracy not yet measured
The concluding section reports that the automated one-by-one system enabled reproducible identification of protein interaction partners. The Discussion reports improved signal-to-noise ratio and more known interactors, but the paper presents highly sensitive analyses as an expectation, not an established performance result. (LLM, conf=0.85)
plain- Asserted: passes — The authors put it forward as true.
- Checkable: passes — It can be checked against evidence.
- Load-bearing: passes — The paper’s conclusions depend on it.
- Based: passes — The paper gives a reason why it holds.
Probably not a substantial claim. It may state two separate claims as one.
- Partly supported
Every source the paper cites for this claim was checked and supports it.
In the paper
“Recently, KHSRP, hnRNPD and PTBP1 have been reported to be LDLR-destabilizing proteins (5).”
§ ZFP36L1 and ZFP36L2 control LDLR mRNA stability via the ERK–RSK pathway > DISCUSSION
What the sources say
- Supportedcites [5] Li, 2009, Identification of mRNA binding proteins that regulate the stability of LDL receptor mRNA through AU-rich elements, J. Lipid. Res. source
The Abstract states that hnRNP D, hnRNP I and KSRP act as negative regulators of LDLR mRNA stability. The Results also report increased LDLR mRNA after depletion of all three. These are the proteins named in the claim as hnRNPD, PTBP1 and KHSRP, respectively. (LLM, conf=0.93)
plaindirect- Asserted: passes — The authors put it forward as true.
- Checkable: passes — It can be checked against evidence.
- Load-bearing: fails — The paper’s conclusions may not depend on it.
- Based: passes — The paper gives a reason why it holds.
Probably not a substantial claim. The paper’s conclusions may not depend on it. It may state two separate claims as one.
- Supported
The cited sources support only part of this claim — read each source’s verdict below.
In the paper
“Recently, MAPKAPK2, a downstream kinase of p38, has been shown to phosphorylate ZFP36, but not in the C-terminal region, leading to dissociation of ZFP36 and CNOT7 (16,17).”
§ ZFP36L1 and ZFP36L2 control LDLR mRNA stability via the ERK–RSK pathway > DISCUSSION > Regulation of ZFP36L1
What the sources say
- Partly supportedcites [16] Marchese, 2010, MAPKAP kinase 2 blocks tristetraprolin-directed mRNA decay by inhibiting CAF1 deadenylase recruitment, J. Biol. Chem. sourceExperimental — accuracy not yet measured
The paper identifies MK2 as a downstream kinase of p38 and reports that its phosphorylation of TTP (ZFP36) reduces binding to CAF1a (CNOT7) by about 50% (introduction and ‘Recruitment of CAF1 to TTP’ section; page unavailable). It identifies Ser-52 and Ser-178 as necessary for the effect, but our copy does not establish that phosphorylation excludes the C-terminal region. The reported reduction in binding also does not establish complete dissociation. (LLM, conf=0.86)
- Partly supportedcites [17] Sandler, 2011, Not1 mediates recruitment of the deadenylase Caf1 to mRNAs targeted for degradation by tristetraprolin, Nucleic Acids Res. sourceExperimental — accuracy not yet measured
The Discussion (page unavailable) says MK2 phosphorylates TTP/ZFP36 at S52 and S178 and that phosphorylation reduces its interaction with Caf1; the Introduction identifies Caf1a as CNOT7. Our copy does not establish that phosphorylation excludes the C-terminal region or identify MK2 as downstream of p38. It reports reduced interaction, not complete dissociation. (LLM, conf=0.86)
plaindirect- Asserted: passes — The authors put it forward as true.
- Checkable: passes — It can be checked against evidence.
- Load-bearing: fails — The paper’s conclusions may not depend on it.
- Based: passes — The paper gives a reason why it holds.
Probably not a substantial claim. The paper’s conclusions may not depend on it. It may state two separate claims as one.
- Partly supported
The cited sources support only part of this claim — read each source’s verdict below.
In the paper
“As Cibois et al. have also reported (27), antisense oligonucleotides allow us to elucidate the binding sites and the function of RNA/RBP interactions in cells.”
§ ZFP36L1 and ZFP36L2 control LDLR mRNA stability via the ERK–RSK pathway > DISCUSSION > Oligonucleotide-based functional validation
What the sources say
- Partly supportedcites [27] Cibois, 2010, A strategy to analyze the phenotypic consequences of inhibiting the association of an RNA-binding protein with a specific RNA, RNA sourceExperimental — accuracy not yet measured
The Results and Discussion report that a morpholino antisense oligonucleotide blocked a specific RNA–protein interaction and, with a rescue experiment, helped establish its role in Xenopus embryos. But the binding region was identified first by electrophoretic mobility shift assays; the paper does not show antisense oligonucleotides themselves elucidating binding sites. (LLM, conf=0.85)
plaindirect- Asserted: passes — The authors put it forward as true.
- Checkable: passes — It can be checked against evidence.
- Load-bearing: fails — The paper’s conclusions may not depend on it.
- Based: passes — The paper gives a reason why it holds.
Probably not a substantial claim. The paper’s conclusions may not depend on it.
- Partly supported
The sources with a verdict support this claim; the rest weren’t checked yet, have no full text we could read, or their verdicts aren’t rated yet.
In the paper
“Recently, some reports have shown that an anti-microRNA antisense oligonucleotide efficiently blocked the function of the microRNA, thereby alleviating diseases in rodents and nonhuman primates (29,30).”
§ ZFP36L1 and ZFP36L2 control LDLR mRNA stability via the ERK–RSK pathway > DISCUSSION > Oligonucleotide-based functional validation
What the sources say
- Not checked — no full text of the sourcecites [29] Elmén, 2008, LNA-mediated microRNA silencing in non-human primates, Nature source
- Supportedcites [30] Lanford, 2010, Therapeutic silencing of microRNA-122 in primates with chronic hepatitis C virus infection, Science source
The paper’s treatment results report that an oligonucleotide complementary to miR-122 antagonized miR-122 in chimpanzees with chronic HCV infection. The Abstract reports sustained suppression of viremia and improvement of HCV-induced liver pathology. This supports the nonhuman-primate part of the jointly cited sentence; the rodent part is not attributed to this paper alone. (LLM, conf=0.91)
plaindirect- Asserted: passes — The authors put it forward as true.
- Checkable: passes — It can be checked against evidence.
- Load-bearing: fails — The paper’s conclusions may not depend on it.
- Based: passes — The paper gives a reason why it holds.
Probably not a substantial claim. The paper’s conclusions may not depend on it.
A result the paper reports from its own data — it cites no other source for it, so there is none to check. The quote shows it is in the paper.
In the paper
“We also observed PMA-mediated LDLR mRNA stabilization in cells transfected with control siRNA but, interestingly, not in cells transfected with ZFP36L1 and ZFP36L2 siRNAs (Figure 3C, Supplementary Figure S3C).”
§ ZFP36L1 and ZFP36L2 control LDLR mRNA stability via the ERK–RSK pathway > RESULTS > ZFP36L1 and ZFP36L2 destabilize LDLR mRNA
plain- Asserted: passes — The authors put it forward as true.
- Checkable: passes — It can be checked against evidence.
- Load-bearing: passes — The paper’s conclusions depend on it.
- Based: passes — The paper gives a reason why it holds.
It may state two separate claims as one.
A result the paper reports from its own data — it cites no other source for it, so there is none to check. The quote shows it is in the paper.
In the paper
“We found that CNOT7, a critical enzymatic component of CCR4-NOT deadenylase, interacts with ZFP36L1 and interestingly, this interaction is inhibited by PMA treatment and reversed by U0126 treatment, indicating that this regulation is mediated by the ERK pathway (Figure 4E).”
- Also stated in: § Regulation of ZFP36L1 · plain
“We show in this report that PMA treatment causes dissociation of ZFP36L1 and CNOT7, and does not cause the dissociation of LDLR and ZFP36L1/L2 (Figure 4D).”
§ ZFP36L1 and ZFP36L2 control LDLR mRNA stability via the ERK–RSK pathway > RESULTS > ZFP36L1 is regulated by phosphorylation downstream of ERK
plaindirect- Asserted: passes — The authors put it forward as true.
- Checkable: passes — It can be checked against evidence.
- Load-bearing: passes — The paper’s conclusions depend on it.
- Based: passes — The paper gives a reason why it holds.
It may state two separate claims as one.
- Also stated in: § Regulation of ZFP36L1 · plain
A result the paper reports from its own data — it cites no other source for it, so there is none to check. The quote shows it is in the paper.
In the paper
“We found that interaction was clearly blocked by Oligo-L1, but was not affected by Oligo-L2, -L3 or -L4 (Figure 2D).”
§ ZFP36L1 and ZFP36L2 control LDLR mRNA stability via the ERK–RSK pathway > RESULTS > ZFP36L1 and ZFP36L2 bind to LDLR mRNA
boosteddirect- Asserted: passes — The authors put it forward as true.
- Checkable: passes — It can be checked against evidence.
- Load-bearing: passes — The paper’s conclusions depend on it.
- Based: passes — The paper gives a reason why it holds.
It may state two separate claims as one.
A result the paper reports from its own data — it cites no other source for it, so there is none to check. The quote shows it is in the paper.
In the paper
“In addition, as expected, Oligo-L1 had no effect on the levels of VEGFA or PLK3 mRNAs (Supplementary Figure S3F).”
§ ZFP36L1 and ZFP36L2 control LDLR mRNA stability via the ERK–RSK pathway > RESULTS > ZFP36L1 and ZFP36L2 destabilize LDLR mRNA
plain- Asserted: passes — The authors put it forward as true.
- Checkable: passes — It can be checked against evidence.
- Load-bearing: fails — The paper’s conclusions may not depend on it.
- Based: passes — The paper gives a reason why it holds.
Probably not a substantial claim. The paper’s conclusions may not depend on it. It may state two separate claims as one.
A result the paper reports from its own data — it cites no other source for it, so there is none to check. The quote shows it is in the paper.
In the paper
“We found that knockdown of ZFP36L1 and ZFP36L2 together resulted in an increase in both LDLR mRNA and protein (Figure 3A and B, Supplementary Figure S3B).”
§ ZFP36L1 and ZFP36L2 control LDLR mRNA stability via the ERK–RSK pathway > RESULTS > ZFP36L1 and ZFP36L2 destabilize LDLR mRNA
plaindirect- Asserted: passes — The authors put it forward as true.
- Checkable: passes — It can be checked against evidence.
- Load-bearing: passes — The paper’s conclusions depend on it.
- Based: passes — The paper gives a reason why it holds.
It may state two separate claims as one.
A result the paper reports from its own data — it cites no other source for it, so there is none to check. The quote shows it is in the paper.
In the paper
“We found that the ARE1-containing region is not only responsible for LDLR mRNA instability, but is also responsible for PMA-mediated stabilization of LDLR mRNA.”
§ ZFP36L1 and ZFP36L2 control LDLR mRNA stability via the ERK–RSK pathway > RESULTS > ZFP36L1 and ZFP36L2 bind to LDLR mRNA
plaindirect- Asserted: passes — The authors put it forward as true.
- Checkable: passes — It can be checked against evidence.
- Load-bearing: passes — The paper’s conclusions depend on it.
- Based: passes — The paper gives a reason why it holds.
It may state two separate claims as one.
A result the paper reports from its own data — it cites no other source for it, so there is none to check. The quote shows it is in the paper.
In the paper
“Neither of these oligonucleotides could inhibit the interaction between LDLR mRNA and ZFP36L1, nor could they increase the stability of LDLR mRNA or the levels of LDLR protein in cells (Supplementary Figure S3I and J)”
§ ZFP36L1 and ZFP36L2 control LDLR mRNA stability via the ERK–RSK pathway > RESULTS > ZFP36L1 and ZFP36L2 destabilize LDLR mRNA
plain- Asserted: passes — The authors put it forward as true.
- Checkable: passes — It can be checked against evidence.
- Load-bearing: passes — The paper’s conclusions depend on it.
- Based: passes — The paper gives a reason why it holds.
It may state two separate claims as one.
A result the paper reports from its own data — it cites no other source for it, so there is none to check. The quote shows it is in the paper.
In the paper
“We found that ZFP36L1 and ZFP36L2 predominantly bind to the ARE1 region, and only modestly bind to the ARE2–3 region, despite the presence of the UAUUUAUU sequence (Figure 2A and C).”
§ ZFP36L1 and ZFP36L2 control LDLR mRNA stability via the ERK–RSK pathway > RESULTS > ZFP36L1 and ZFP36L2 bind to LDLR mRNA
plaincorrelational- Asserted: passes — The authors put it forward as true.
- Checkable: passes — It can be checked against evidence.
- Load-bearing: passes — The paper’s conclusions depend on it.
- Based: passes — The paper gives a reason why it holds.
It may state two separate claims as one.
- Rests on an assumption: ARE1 and ARE2 of the LDLR mRNA 3′-UTR are comprised of the UAUUUAUU sequence.
A result the paper reports from its own data — it cites no other source for it, so there is none to check. The quote shows it is in the paper.
In the paper
“We transfected these oligonucleotides into HeLa cells and found that Oligo-L1 increased the levels of LDLR mRNA and protein (Figure 3D and E, Supplementary Figure S3E).”
§ ZFP36L1 and ZFP36L2 control LDLR mRNA stability via the ERK–RSK pathway > RESULTS > ZFP36L1 and ZFP36L2 destabilize LDLR mRNA
plaindirect- Asserted: passes — The authors put it forward as true.
- Checkable: passes — It can be checked against evidence.
- Load-bearing: passes — The paper’s conclusions depend on it.
- Based: passes — The paper gives a reason why it holds.
It may state two separate claims as one.
A result the paper reports from its own data — it cites no other source for it, so there is none to check. The quote shows it is in the paper.
In the paper
“We found that phosphorylation of the C-terminal serine-334 residue of ZFP36L1 and of the C-terminal serine-493 and -495 residues of ZFP36L2 was increased upon PMA treatment, but was reversed by U0126 treatment (Figure 4C, Supplementary Figure S5A).”
§ ZFP36L1 and ZFP36L2 control LDLR mRNA stability via the ERK–RSK pathway > RESULTS > ZFP36L1 is regulated by phosphorylation downstream of ERK
plaindirect- Asserted: passes — The authors put it forward as true.
- Checkable: passes — It can be checked against evidence.
- Load-bearing: passes — The paper’s conclusions depend on it.
- Based: passes — The paper gives a reason why it holds.
It may state two separate claims as one.
A result the paper reports from its own data — it cites no other source for it, so there is none to check. The quote shows it is in the paper.
In the paper
“We found that phosphorylation of the C-terminal serine-334 residue of ZFP36L1 and of the C-terminal serine-493 and -495 residues of ZFP36L2 was increased upon PMA treatment, but was reversed by U0126 treatment (Figure 4C, Supplementary Figure S5A).”
§ ZFP36L1 and ZFP36L2 control LDLR mRNA stability via the ERK–RSK pathway > RESULTS > ZFP36L1 is regulated by phosphorylation downstream of ERK
plaindirect- Asserted: passes — The authors put it forward as true.
- Checkable: passes — It can be checked against evidence.
- Load-bearing: passes — The paper’s conclusions depend on it.
- Based: passes — The paper gives a reason why it holds.
It may state two separate claims as one.
A result the paper reports from its own data — it cites no other source for it, so there is none to check. The quote shows it is in the paper.
In the paper
“We also identified several known interactions with other bait RNAs including 7SK-CDK9 and 7SK-LARP7.”
§ ZFP36L1 and ZFP36L2 control LDLR mRNA stability via the ERK–RSK pathway > DISCUSSION > Methods used to identify the regulator of RNA stability
plaincorrelational- Asserted: passes — The authors put it forward as true.
- Checkable: passes — It can be checked against evidence.
- Load-bearing: fails — The paper’s conclusions may not depend on it.
- Based: passes — The paper gives a reason why it holds.
Probably not a substantial claim. The paper’s conclusions may not depend on it.
A result the paper reports from its own data — it cites no other source for it, so there is none to check. The quote shows it is in the paper.
In the paper
“However, using our approach, we identified KHSRP as a binding protein for the 3′-UTRs of IFNA1, β-actin and cMYC mRNAs and hnRNPD and PTBP1 were common to all the RNA baits.”
§ ZFP36L1 and ZFP36L2 control LDLR mRNA stability via the ERK–RSK pathway > DISCUSSION
plaincorrelational- Asserted: passes — The authors put it forward as true.
- Checkable: passes — It can be checked against evidence.
- Load-bearing: unclear — It is unclear whether the paper’s conclusions depend on it.
- Based: passes — The paper gives a reason why it holds.
It may state two separate claims as one.
A result the paper reports from its own data — it cites no other source for it, so there is none to check. The quote shows it is in the paper.
In the paper
“Interestingly, IFNA1 mRNA, which also has a UAUUUAUU sequence in its 3′-UTR, is stable in cells and ZFP36L1 does not interact strongly with the 3′-UTR of this mRNA (Figure 1B, Supplementary Table S2).”
§ ZFP36L1 and ZFP36L2 control LDLR mRNA stability via the ERK–RSK pathway > DISCUSSION > Target prediction of ZFP36L1 and ZFP36L2
plain- Asserted: passes — The authors put it forward as true.
- Checkable: passes — It can be checked against evidence.
- Load-bearing: passes — The paper’s conclusions depend on it.
- Based: passes — The paper gives a reason why it holds.
It may state two separate claims as one.
A result the paper reports from its own data — it cites no other source for it, so there is none to check. The quote shows it is in the paper.
In the paper
“We examined the interaction between CNOT7 and ZFP36 or ZFP36L2 and found that ZFP36L2, in addition to ZFP36 and ZFP36L1, also interacts with CNOT7 and that the interactions between CNOT7 and ZFP36 or ZFP36L2 are inhibited by PMA treatment (Supplementary Figure S5E).”
§ ZFP36L1 and ZFP36L2 control LDLR mRNA stability via the ERK–RSK pathway > RESULTS > ZFP36L1 is regulated by phosphorylation downstream of ERK
plaindirect- Asserted: passes — The authors put it forward as true.
- Checkable: passes — It can be checked against evidence.
- Load-bearing: passes — The paper’s conclusions depend on it.
- Based: passes — The paper gives a reason why it holds.
It may state two separate claims as one.
A result the paper reports from its own data — it cites no other source for it, so there is none to check. The quote shows it is in the paper.
In the paper
“In spite of the binding of these proteins, IFNA1 and β-actin mRNAs were stable, whereas cMYC mRNA was unstable and was not stabilized by ERK signaling.”
§ ZFP36L1 and ZFP36L2 control LDLR mRNA stability via the ERK–RSK pathway > DISCUSSION
plain- Asserted: passes — The authors put it forward as true.
- Checkable: passes — It can be checked against evidence.
- Load-bearing: unclear — It is unclear whether the paper’s conclusions depend on it.
- Based: passes — The paper gives a reason why it holds.
It may state two separate claims as one.
A result the paper reports from its own data — it cites no other source for it, so there is none to check. The quote shows it is in the paper.
In the paper
“(i) Oligo-L1 could inhibit the interaction between ZFP36L1 and LRLD mRNA, without affecting the interaction between LDLR and hnRNPD, hnRNPI or KHSRP, or the interaction of ZFP36L1 with the 3′-UTRs of PLK3 or VEGFA mRNAs (Supplementary Figure S2B).”
§ ZFP36L1 and ZFP36L2 control LDLR mRNA stability via the ERK–RSK pathway > DISCUSSION > Oligonucleotide-based functional validation
hedgeddirect- Asserted: passes — The authors put it forward as true.
- Checkable: passes — It can be checked against evidence.
- Load-bearing: passes — The paper’s conclusions depend on it.
- Based: passes — The paper gives a reason why it holds.
It may state two separate claims as one.
A result the paper reports from its own data — it cites no other source for it, so there is none to check. The quote shows it is in the paper.
In the paper
“(v) Four control oligonucleotides, Oligo-L2, -L3, -L4, -L5 and -L6, could not inhibit the interaction between LDLR mRNA and ZFP36L1, and also could not increase the levels of LDLR mRNA or protein in cells (Figure 3D, E and G, Supplementary Figure S3E, J and L).”
§ ZFP36L1 and ZFP36L2 control LDLR mRNA stability via the ERK–RSK pathway > DISCUSSION > Oligonucleotide-based functional validation
hedgedn = 4- Asserted: passes — The authors put it forward as true.
- Checkable: passes — It can be checked against evidence.
- Load-bearing: passes — The paper’s conclusions depend on it.
- Based: passes — The paper gives a reason why it holds.
It may state two separate claims as one.
A result the paper reports from its own data — it cites no other source for it, so there is none to check. The quote shows it is in the paper.
In the paper
“We found that PLK3 and VEGFA mRNAs were also stabilized by PMA, but that this was not the case for cMYC mRNA (Supplementary Figure S7).”
§ ZFP36L1 and ZFP36L2 control LDLR mRNA stability via the ERK–RSK pathway > RESULTS > RSK directly phosphorylates ZFP36L1 downstream of ERK
plaindirect- Asserted: passes — The authors put it forward as true.
- Checkable: passes — It can be checked against evidence.
- Load-bearing: passes — The paper’s conclusions depend on it.
- Based: passes — The paper gives a reason why it holds.
It may state two separate claims as one.
In the paper
“LDLR mRNA is known to be unstable, but is stabilized upon phorbol 12-myristate 13-acetate (PMA) treatment through the activation of extracellular signal-regulated kinase (ERK) (4).”
§ ZFP36L1 and ZFP36L2 control LDLR mRNA stability via the ERK–RSK pathway > INTRODUCTION
What the sources say
- Not checked — no full text of the sourcecites [4] Kong, 2004, Berberine is a novel cholesterol-lowering drug working through a unique mechanism distinct from statins, Nat. Med. source
boosteddirect- Asserted: passes — The authors put it forward as true.
- Checkable: passes — It can be checked against evidence.
- Load-bearing: passes — The paper’s conclusions depend on it.
- Based: passes — The paper gives a reason why it holds.
It may state two separate claims as one.
None of the sources cited for this claim have been checked yet.
In the paper
“Although some LDLR mRNA-binding proteins have been identified, the detailed mechanisms underlying the control of LDLR mRNA stability remain unknown (4,5), and the critical regulator of this control has not been identified.”
§ ZFP36L1 and ZFP36L2 control LDLR mRNA stability via the ERK–RSK pathway > INTRODUCTION
What the sources say
- Not checked — no full text of the sourcecites [4] Kong, 2004, Berberine is a novel cholesterol-lowering drug working through a unique mechanism distinct from statins, Nat. Med. source
- Not checked yetcites [5] Li, 2009, Identification of mRNA binding proteins that regulate the stability of LDL receptor mRNA through AU-rich elements, J. Lipid. Res. source
Checked before — its earlier verdict is held back until a new check runs.
plain- Asserted: passes — The authors put it forward as true.
- Checkable: passes — It can be checked against evidence.
- Load-bearing: passes — The paper’s conclusions depend on it.
- Based: passes — The paper gives a reason why it holds.
Probably not a substantial claim. It may state two separate claims as one.
What the paper did — it cites no source for this, so there is none to check. The quote shows it is in the paper.
In the paper
“The data are representative of at least three independent experiments.”
§ ZFP36L1 and ZFP36L2 control LDLR mRNA stability via the ERK–RSK pathway > RESULTS
plain- Asserted: passes — The authors put it forward as true.
- Checkable: passes — It can be checked against evidence.
- Load-bearing: fails — The paper’s conclusions may not depend on it.
- Based: passes — The paper gives a reason why it holds.
Probably not a substantial claim. The paper’s conclusions may not depend on it.
None of the sources cited for this claim have been checked yet.
In the paper
“ZFP36L1 and ZFP36L2 belong to the family of CCCH tandem zinc finger proteins (the ZFP36 family, which includes ZFP36, ZFP36L1 and ZFP36L2) (6).”
§ ZFP36L1 and ZFP36L2 control LDLR mRNA stability via the ERK–RSK pathway > INTRODUCTION
What the sources say
- Not checked yetcites [6] Sanduja, 2011, The roles of TTP and BRF proteins in regulated mRNA decay, Wiley Interdiscip. Rev. RNA source
Checked before — its earlier verdict is held back until a new check runs.
plain- Asserted: passes — The authors put it forward as true.
- Checkable: passes — It can be checked against evidence.
- Load-bearing: fails — The paper’s conclusions may not depend on it.
- Based: passes — The paper gives a reason why it holds.
Probably not a substantial claim. The paper’s conclusions may not depend on it.
- Not checked yet
A conclusion the paper draws from its own results — it cites no other source for it, so there is none to check. The quote shows it is in the paper.
In the paper
“These results suggest that ZFP36L1 and ZFP36L2 are LDLR mRNA-destabilizing factors that are indispensable for PMA-mediated stabilization of LDLR mRNA.”
§ ZFP36L1 and ZFP36L2 control LDLR mRNA stability via the ERK–RSK pathway > RESULTS > ZFP36L1 and ZFP36L2 destabilize LDLR mRNA
hedgeddirect- Asserted: passes — The authors put it forward as true.
- Checkable: passes — It can be checked against evidence.
- Load-bearing: passes — The paper’s conclusions depend on it.
- Based: passes — The paper gives a reason why it holds.
It may state two separate claims as one.
A conclusion the paper draws from its own results — it cites no other source for it, so there is none to check. The quote shows it is in the paper.
In the paper
“ZFP36L1 and ZFP36L2-mediated LDLR mRNA destabilization was also observed in other cell lines, including 293T cells and Hep3B cells, indicating that this regulation is conserved among these cells (Supplementary Figure S3D).”
§ ZFP36L1 and ZFP36L2 control LDLR mRNA stability via the ERK–RSK pathway > RESULTS > ZFP36L1 and ZFP36L2 destabilize LDLR mRNA
hedgeddirect- Asserted: passes — The authors put it forward as true.
- Checkable: passes — It can be checked against evidence.
- Load-bearing: unclear — It is unclear whether the paper’s conclusions depend on it.
- Based: passes — The paper gives a reason why it holds.
The quote only partly states this claim.
A conclusion the paper draws from its own results — it cites no other source for it, so there is none to check. The quote shows it is in the paper.
In the paper
“resulting in dissociation of the CCR4-NOT-deadenylase complex and stabilization of LDLR mRNA”
§ ZFP36L1 and ZFP36L2 control LDLR mRNA stability via the ERK–RSK pathway > Abstract
plaindirect- Asserted: passes — The authors put it forward as true.
- Checkable: passes — It can be checked against evidence.
- Load-bearing: passes — The paper’s conclusions depend on it.
- Based: passes — The paper gives a reason why it holds.
The quote only partly states this claim.
- Rests on an assumption: RSK is downstream of ERK.
A conclusion the paper draws from its own results — it cites no other source for it, so there is none to check. The quote shows it is in the paper.
In the paper
“These results demonstrate the potency of antisense oligonucleotide-based therapeutics.”
§ ZFP36L1 and ZFP36L2 control LDLR mRNA stability via the ERK–RSK pathway > DISCUSSION > Oligonucleotide-based functional validation
boosted- Asserted: passes — The authors put it forward as true.
- Checkable: passes — It can be checked against evidence.
- Load-bearing: fails — The paper’s conclusions may not depend on it.
- Based: passes — The paper gives a reason why it holds.
Probably not a substantial claim. The paper’s conclusions may not depend on it.
A conclusion the paper draws from its own results — it cites no other source for it, so there is none to check. The quote shows it is in the paper.
In the paper
“Our results suggest that the UAUUUAUU sequence is necessary but not sufficient for ZFP36L1 and ZFP36L2 to interact with and destabilize mRNA.”
§ ZFP36L1 and ZFP36L2 control LDLR mRNA stability via the ERK–RSK pathway > DISCUSSION > Target prediction of ZFP36L1 and ZFP36L2
hedgeddirect- Asserted: passes — The authors put it forward as true.
- Checkable: passes — It can be checked against evidence.
- Load-bearing: passes — The paper’s conclusions depend on it.
- Based: passes — The paper gives a reason why it holds.
It may state two separate claims as one.
In the paper
“It has been reported that increasing the amount of LDLR protein in the liver could be a therapeutic approach for hyperlipidemia (28).”
§ ZFP36L1 and ZFP36L2 control LDLR mRNA stability via the ERK–RSK pathway > DISCUSSION > Oligonucleotide-based functional validation
What the sources say
- Not checked — no full text of the sourcecites [28] Garg, 2007, Update on dyslipidemia, J. Clin. Endocrinol. Metab. source
hedgedconditional- Asserted: passes — The authors put it forward as true.
- Checkable: passes — It can be checked against evidence.
- Load-bearing: passes — The paper’s conclusions depend on it.
- Based: passes — The paper gives a reason why it holds.
Probably not a substantial claim.
The paper relies on this without support.
RSK is downstream of ERK.
“p90 ribosomal S6 kinase, a kinase downstream of ERK”
The paper relies on this without support.
ARE1 and ARE2 of the LDLR mRNA 3′-UTR are comprised of the UAUUUAUU sequence.
“ARE1 and ARE2 are comprised of the UAUUUAUU sequence.”
The paper relies on this without support.
The UAUUUAUU sequence is the consensus binding sequence for ZFP36L1 and ZFP36L2.
“ZFP36L1 and ZFP36L2 are known as proteins that bind to a certain type of ARE that contains the sequence UAUUUAUU, causing destabilization of target mRNAs.”
The paper relies on this without support.
LDLR in the liver binds LDL and thereby lowers blood LDL levels.
“In the liver, the LDLR binds to LDL, thereby lowering blood LDL levels.”
The paper relies on this without support.
cMYC mRNA does not bind to ZFP36L1 or ZFP36L2.
“whereas cMYC mRNA does not bind to ZFP36L1 or ZFP36L2.”
Claims other papers make about this one
Each is checked against this paper’s own text: does it say what the citing paper says it does?
The source backs part of the claim, not all of it — or backs it for a different population, condition or comparison.
In the citing paper
“CSDE1, hnRNPD, hnRNPI, KSRP, ZFP36L1, ZFP36L2 Bind to AREs in the 3′UTR and lead to degradation of LDLR mRNA ↓ [29-31]”
From The low-density lipoprotein receptor: Emerging post-transcriptional regulatory mechanisms (2025) · cites this paper as [30]
Experimental — accuracy not yet measuredThe source backs part of the claim, not all of it — or backs it for a different population, condition or comparison.
In the citing paper
“While these RBPs destabilize their mRNA targets leading to degradation of LDLR, human antigen R (HuR), also known as ELAV-like RNA binding protein 1 (ELAVL1), binds the same AREs to stabilize LDLR mRNA and increase LDLR proteins in hepatocytes65,66.”
From Pathways and Molecular Mechanisms Governing LDL Receptor Regulation (2025) · cites this paper as [64]
Experimental — accuracy not yet measuredThe source backs part of the claim, not all of it — or backs it for a different population, condition or comparison.
In the citing paper
“For instance, LDLR 3′UTR has been shown to associate with not only the mRNA-stabilizing factor, human antigen R (HuR), but also with decay-promoting factors, such as ZFP36 ring finger protein-like 1 and –like 2 proteins (ZFP36L1 and ZFP36L2), KH-type splicing regulatory protein (KSRP) as well as the D and I members of the heterogeneous nuclear ribonucleoprotein family (hnRNP D and hnRNP I)16–18.”
From Triciribine increases LDLR expression and LDL uptake through stabilization of LDLR mRNA (2018) · cites this paper as [17]
Experimental — accuracy not yet measuredThe source backs part of the claim, not all of it — or backs it for a different population, condition or comparison.
In the citing paper
“only the ERK-dependent phosphorylation of endogenous ZFP36L1 has been rigorously examined [15]”
From Triciribine Engages ZFP36L1 and HuR to Stabilize LDLR mRNA (2020) · cites this paper as [15]
Experimental — accuracy not yet measuredThe source backs part of the claim, not all of it — or backs it for a different population, condition or comparison.
In the citing paper
“Similarly, the phosphorylation of ZFP36L1 and ZFP36L2 by p90 ribosomal S6 kinase 1 (RSK1), a downstream effector of ERK signaling, has been shown to induce their disengagement from CCR4-NOT complex and the loss of its de-stabilizing function, resulting in the stabilization of LDLR mRNA [15].”
From Triciribine Engages ZFP36L1 and HuR to Stabilize LDLR mRNA (2020) · cites this paper as [15]
Experimental — accuracy not yet measured
The source backs part of the claim, not all of it — or backs it for a different population, condition or comparison.
In the citing paper
“These two proteins were considered to be likely candidates, because (1) they have been reported to modulate LDLR mRNA stability in response to agents that activate ERK and (2) the mechanisms underlying their regulatory effect on LDLR mRNA stability have been partially resolved [9,13,14,15].”
From Triciribine Engages ZFP36L1 and HuR to Stabilize LDLR mRNA (2020) · cites this paper as [15]
Experimental — accuracy not yet measuredThe cited source says what the claim attributes to it.
In the citing paper
“Using a proteomics-based approach, two additional RBPs, ZFP36L1 and ZFP36L2, that influence LDLR mRNA stability were identified [30].These proteins operate in an ERK-dependent manner, binding to the 3′UTR of LDLR mRNA and promoting its destabilization.”
From The low-density lipoprotein receptor: Emerging post-transcriptional regulatory mechanisms (2025) · cites this paper as [30]
The cited source says what the claim attributes to it.
In the citing paper
“Another family of RBPs that bind AREs in the 3’UTR of target genes, including LDLR, is the ZFP36 family of proteins64.”
From Pathways and Molecular Mechanisms Governing LDL Receptor Regulation (2025) · cites this paper as [64]
The cited source says what the claim attributes to it.
In the citing paper
“Adachi et al. demonstrated that PMA increased LDLR mRNA stability through the phosphorylation of ZFP36L1 and its subsequent release from CNOT7 [15].”
From Triciribine Engages ZFP36L1 and HuR to Stabilize LDLR mRNA (2020) · cites this paper as [15]
The cited source says what the claim attributes to it.
In the citing paper
“ERK induces phosphorylation of ZFP36L1 through its downstream target, p90 ribosomal S6 kinase 1 (RSK1) [15]”
From Triciribine Engages ZFP36L1 and HuR to Stabilize LDLR mRNA (2020) · cites this paper as [15]
The cited source says what the claim attributes to it.
In the citing paper
“Upon phosphorylation of ZFP36L1, it dissociates from the CCR4-NOT complex and consequently stabilizes LDLR mRNA [15].”
From Triciribine Engages ZFP36L1 and HuR to Stabilize LDLR mRNA (2020) · cites this paper as [15]
The cited source says what the claim attributes to it.
In the citing paper
“ZFP36L1 has been shown to recruit the CCR4-NOT deadenylase complex to LDLR 3′ UTR through interaction with CNOT7, which results in its mRNA degradation [15].”
From Triciribine Engages ZFP36L1 and HuR to Stabilize LDLR mRNA (2020) · cites this paper as [15]
The cited source says what the claim attributes to it.
In the citing paper
“PMA has been shown to partially increase LDLR-mRNA stability through ERK-induced ZFP36L1 phosphorylation [15].”
From Triciribine Engages ZFP36L1 and HuR to Stabilize LDLR mRNA (2020) · cites this paper as [15]
The cited source says what the claim attributes to it.
In the citing paper
“Adachi et al. [15] demonstrated that the destabilizing effect of ZFP36L1 on LDLR mRNA requires the binding of the CCR4-NOT-deadenylase complex to its 3‘UTR.”
From Triciribine Engages ZFP36L1 and HuR to Stabilize LDLR mRNA (2020) · cites this paper as [15]
The cited source says what the claim attributes to it.
In the citing paper
“whereas ZFP36 ring finger protein like-1 and -2 proteins (ZFP36L1 and ZFP36L2) and KH-type splicing regulatory protein (KSRP) accelerate the turnover of LDLR mRNA [13,15].”
From Triciribine Engages ZFP36L1 and HuR to Stabilize LDLR mRNA (2020) · cites this paper as [15]
In the citing paper
“ZFP36L1 and ZFP36L2 belong to the TPA-inducible sequence 11 (TIS11) protein families that, upon binding to AREs in the 3′ UTRs of their target mRNAs, recruit the CCR4-NOT complex to the adjoining polyA tail, thus promoting the deadenylation of mRNA and ultimately its degradation [15].”
From Triciribine Engages ZFP36L1 and HuR to Stabilize LDLR mRNA (2020) · cites this paper as [15]
In the citing paper
“confirms ZFP36L1 as a LDLR mRNA-destabilizing protein in HepG2 cells [9,13,14,15]”
From Triciribine Engages ZFP36L1 and HuR to Stabilize LDLR mRNA (2020) · cites this paper as [15]
In the citing paper
“although both isoforms have been shown to control the stability of LDLR mRNA via the ERK pathway”
From Triciribine Engages ZFP36L1 and HuR to Stabilize LDLR mRNA (2020) · cites this paper as [15]
Self-check
Percentages, sums and reported differences re-computed from the paper’s own numbers.
Each contradiction between two passages listed here was confirmed by an independent check.
Rated minor: it would not touch a result — a value no result rests on, a p-value that stays on the same side of the significance level, or a conflict that is clerical, resolved elsewhere in the paper, or outside its own findings.
In the paper
§ ZFP36L1 and ZFP36L2 control LDLR mRNA stability via the ERK–RSK pathway > DISCUSSION > Oligonucleotide-based functional validation
“Four control oligonucleotides”
§ ZFP36L1 and ZFP36L2 control LDLR mRNA stability via the ERK–RSK pathway > DISCUSSION > Oligonucleotide-based functional validation
“Oligo-L2, -L3, -L4, -L5 and -L6”
Rated minor: it would not touch a result — a value no result rests on, a p-value that stays on the same side of the significance level, or a conflict that is clerical, resolved elsewhere in the paper, or outside its own findings.
In the paper
§ ZFP36L1 and ZFP36L2 control LDLR mRNA stability via the ERK–RSK pathway > RESULTS > ZFP36L1 is regulated by phosphorylation downstream of ERK
“could be reversed by treatment with bacterial alkaline phosphatase (Figure 4B).”
§ ZFP36L1 and ZFP36L2 control LDLR mRNA stability via the ERK–RSK pathway > RESULTS > ZFP36L1 is regulated by phosphorylation downstream of ERK
“Immunopurified Flag-ZFP36L1 was treated with or without bacterial acid phosphatase (BAP)”
Rated minor: it would not touch a result — a value no result rests on, a p-value that stays on the same side of the significance level, or a conflict that is clerical, resolved elsewhere in the paper, or outside its own findings.
In the paper
§ ZFP36L1 and ZFP36L2 control LDLR mRNA stability via the ERK–RSK pathway > RESULTS > ZFP36L1 is regulated by phosphorylation downstream of ERK
“We transfected the RFP-LDLR-3′-UTR expression vector and a luciferase-β-actin-3′-UTR vector along with ZFP36L1-WT, ZFP36L1-SASA or ZFP36L1-ΔC into 293T cells and preformed ActD chase experiments with or without PMA treatment.”
§ ZFP36L1 and ZFP36L2 control LDLR mRNA stability via the ERK–RSK pathway > RESULTS > ZFP36L1 is regulated by phosphorylation downstream of ERK
“(H) HeLa cells were transfected with RFP-LDLR 3′-UTR (ARE1) or Luc2-β-Actin-UTR along with the indicated ZFP36L1 constructs.”
Citations
Cites
LNA-mediated microRNA silencing in non-human primates
Elmén, J., Lindow, M., Schütz, S., Lawrence, M., Petri, A., Obad, S., Lindholm, M., Hedtjärn, M., Hansen, H. F., Berger, U., et al. (2008) · Nature · doi:10.1038/nature06783 · Cited by 1,589
Therapeutic silencing of microRNA-122 in primates with chronic hepatitis C virus infection
Lanford, R. E., Hildebrandt-Eriksen, E. S., Petri, A., Persson, R., Lindow, M., Munk, M. E., Kauppinen, S., & Ørum, H. (2010) · Science · doi:10.1126/science.1178178 · Cited by 1,459
Kong, W., Wei, J., Abidi, P., Lin, M., Inaba, S., Li, C., Wang, Y., Wang, Z., Si, S., Pan, H., et al. (2004) · Nature Medicine · doi:10.1038/nm1135 · Cited by 1,391
AU-rich elements and associated factors: are there unifying principles?
Barreau, C. (2005) · Nucleic Acids Research · doi:10.1093/nar/gki1012 · Cited by 907
Obika, S., Nanbu, D., Hari, Y., Andoh, J., Morio, K., Doi, T., & Imanishi, T. (1998) · Tetrahedron Letters · doi:10.1016/s0040-4039(98)01084-3 · Cited by 701
The 7SK small nuclear RNA inhibits the CDK9/cyclin T1 kinase to control transcription
Yang, Z., Zhu, Q., Luo, K., & Zhou, Q. (2001) · Nature · doi:10.1038/35104575 · Cited by 695
AU-rich-element-mediated upregulation of translation by FXR1 and Argonaute 2
Vasudevan, S., & Steitz, J. A. (2007) · Cell · doi:10.1016/j.cell.2007.01.038 · Cited by 656
Isolation of an active step I spliceosome and composition of its RNP core
Bessonov, S., Anokhina, M. M., Will, C. L., Urlaub, H., & Lührmann, R. (2008) · Nature · doi:10.1038/nature06842 · Cited by 396
Recognition of the mRNA AU-rich element by the zinc finger domain of TIS11d
Hudson, B. P., Martinez-Yamout, M. A., Dyson, H. J., & Wright, P. E. (2004) · Nature Structural & Molecular Biology · doi:10.1038/nsmb738 · Cited by 336
ARED 3.0: the large and diverse AU-rich transcriptome
Bakheet, T. M. (2005) · Nucleic Acids Research · doi:10.1093/nar/gkj052 · Cited by 327
Sandler, H., Kreth, J., Timmers, H. T. M., & Stoecklin, G. (2011) · Nucleic Acids Research · doi:10.1093/nar/gkr011 · Cited by 221
Wassarman, D. A., & STEITZ, J. A. (1991) · Molecular and Cellular Biology · doi:10.1128/mcb.11.7.3432-3445.1991 · Cited by 173
RNA-based affinity purification reveals 7SK RNPs with distinct composition and regulation
Hogg, J. R., & Collins, K. (2007) · RNA · doi:10.1261/rna.565207 · Cited by 154
The roles of TTP and BRF proteins in regulated mRNA decay
Sanduja, S., Blanco, F. F., & Dixon, D. A. (2011) · WIREs RNA · doi:10.1002/wrna.28 · Cited by 144
Marchese, F. P., Aubareda, A., Tudor, C., Saklatvala, J., Clark, A. R., & Dean, J. L. E. (2010) · Journal of Biological Chemistry · doi:10.1074/jbc.m110.136473 · Cited by 136
7SK RNA, a non-coding RNA regulating P-TEFb, a general transcription factor
Diribarne, G., & Bensaude, O. (2009) · RNA Biology · doi:10.4161/rna.6.2.8115 · Cited by 130
In vivo expression and purification of aptamer-tagged small RNA regulators
Said, N., Rieder, R., HURWITZ, R. M., Deckert, J., Urlaub, H., & Vogel, J. (2009) · Nucleic Acids Research · doi:10.1093/nar/gkp719 · Cited by 114
Locked nucleic acid (LNA): High affinity targeting of RNA for diagnostics and therapeutics
Kauppinen, S., Vester, B., & Wengel, J. (2005) · Drug Discovery Today Technologies · doi:10.1016/j.ddtec.2005.08.012 · Cited by 107
Garg, A., & Simha, V. (2007) · The Journal of Clinical Endocrinology & Metabolism · doi:10.1210/jc.2007-0275 · Cited by 89
Li, H., Chen, W., Zhou, Y., Abidi, P., Sharpe, O., Robinson, W. H., Kraemer, F. B., & Liu, J. (2009) · Journal of Lipid Research · doi:10.1194/jlr.m800375-jlr200 · Cited by 85
Wassarman, D. A., & Steitz, J. A. (1991) · Molecular and Cellular Biology · doi:10.1128/mcb.11.7.3432 · Cited by 83
Genome-wide analysis of mRNAs bound to the histone stem–loop binding protein
Townley-Tilson, W. H. D., Pendergrass, S. A., Marzluff, W. F., & Whitfield, M. L. (2006) · RNA · doi:10.1261/rna.76006 · Cited by 78
Matsumoto, M., Oyamada, K., Takahashi, H., Sato, T., Hatakeyama, S., & Nakayama, K. I. (2009) · PROTEOMICS · doi:10.1002/pmic.200900011 · Cited by 54
Self-citationDuan, H., Cherradi, N., Feige, J.-J., & Jefcoate, C. (2009) · Molecular Endocrinology · doi:10.1210/me.2008-0296 · Cited by 42
Stimulation of polo-like kinase 3 mRNA decay by tristetraprolin
Horner, T. J., Lai, W. S., Stumpo, D. J., & Blackshear, P. J. (2009) · Molecular and Cellular Biology · doi:10.1128/mcb.00982-08 · Cited by 26
Hacker, C., Valchanova, R., Adams, S., & Munz, B. (2010) · Growth Factors · doi:10.3109/08977190903578660 · Cited by 24
Kourouklis, D., Murakami, H., & Suga, H. (2005) · Methods · doi:10.1016/j.ymeth.2005.04.001 · Cited by 21
Self-citationCibois, M., Gautier-Courteille, C., Vallée, A., & Paillard, L. (2010) · RNA · doi:10.1261/rna.1742610 · Cited by 20
Shin, S., Kim, Y. S., Kim, J., Kwon, H.-M., Kim, D.-E., & Hah, S. S. (2013) · Nucleic Acid Therapeutics · doi:10.1089/nat.2012.0396 · Cited by 9
One-by-one sample preparation method for protein network analysis
Iemura, S.-I., & Natsume, T. (2012) · Protein Interactions · doi:10.5772/37931 · Cited by 2
Self-citation(2012) · Europe PMC (PubMed Central)
Cited by
Sorted by citations
Hepatic cholesterol transport and its role in non-alcoholic fatty liver disease and atherosclerosis
Li, H., Yu, X.-H., Ou, X., Ouyang, X.-P., & Tang, C. (2021) · Progress in Lipid Research · doi:10.1016/j.plipres.2021.101109 · Cited by 237
Codon bias confers stability to human mRNAs
Hia, F., Yang, S. F., Shichino, Y., Yoshinaga, M., Murakawa, Y., Vandenbon, A., Fukao, A., Fujiwara, T., Landthaler, M., Natsume, T., et al. (2019) · EMBO Reports · doi:10.15252/embr.201948220 · Cited by 171
Self-citationExosome-based Ldlr gene therapy for familial hypercholesterolemia in a mouse model
Li, Z., Zhao, P., Zhang, Y., Wang, J., Wang, C., Liu, Y., Yang, G., & Yuan, L. (2021) · Theranostics · doi:10.7150/thno.49874 · Cited by 108
Clark, A. R., & Dean, J. L. E. (2016) · Biochemical Society Transactions · doi:10.1042/bst20160166 · Cited by 91
Son, Y., Kim, H., Choi, W.-S., Chun, C. H., & Chun, J. (2019) · Nature Communications · doi:10.1038/s41467-018-08035-7 · Cited by 83
Metadata
- Authors
- Adachi, S., Homoto, M., Tanaka, R., Hioki, Y., Murakami, H., Suga, H., Matsumoto, M., Nakayama, K. I., Hatta, T., Iemura, S.-I., & Natsume, T.
- Affiliations
- National Institute of Advanced Industrial Science and Technology (JP)
- The University of Tokyo (JP)
- Kyushu University (JP)
- Corresponding author
- Natsume, Tohru
- ORCID
- Venue
- Nucleic Acids Research
- Publisher
- Oxford University Press (OUP)
- Published
- 2014-08-08
- Volume
- 42
- Issue
- 15
- Pages
- 10037-10049
- ISSN
- 0305-1048 (ISSN-L)
- 1362-4962
- PMC
- PMC4150769
- OpenAlex
- W2019768782
- Cited by
- 109
- References
- 30
- Citations by year
- 2026: 9 · 2025: 10 · 2024: 20 · 2023: 9 · 2022: 7 · 2021: 16 · 2020: 9 · 2019: 8 · 2018: 6 · 2017: 3 · 2016: 3 · 2015: 8 · 2014: 1
- FWCI
- 1.65
- Type
- journal article
- Language
- en
- Open access
- gold
- doi.org
- Locations
- Nucleic Acids Research (publishedVersion, cc-by)
- PubMed Central (publishedVersion, cc-by)
- PubMed (publishedVersion)
- Funders
- National Institute of Advanced Industrial Science and Technology
- Japan Society for the Promotion of Science (26640080, 24115001)
- Topics
- Life Sciences › Biochemistry, Genetics and Molecular Biology › Molecular Biology › RNA Research and Splicing
- Life Sciences › Biochemistry, Genetics and Molecular Biology › Biochemistry › Cholesterol and Lipid Metabolism
- Life Sciences › Biochemistry, Genetics and Molecular Biology › Molecular Biology › RNA Interference and Gene Delivery
- Keywords
- ZFP36L1, ZFP36L2, LDL receptor, mRNA stability, ERK signaling, p90 ribosomal S6 kinase, CCR4-NOT complex, mRNA deadenylation, 3' untranslated region, protein phosphorylation, antisense oligonucleotides, lipid metabolism
- MeSH terms
- Cell Line, HeLa Cells, Humans, Phosphorylation, Receptors, LDL, RNA, Messenger, Transcription Factors, 3' Untranslated Regions, RNA Stability, MAP Kinase Signaling System, Ribosomal Protein S6 Kinases, 90-kDa, Extracellular Signal-Regulated MAP Kinases, Butyrate Response Factor 1, HEK293 Cells
About these checks
Registry, retraction, Cites and statistics results are computed, not judged, with one exception: a printed reference that no index lists is read once by a model before it counts as a citation error. Claims are extracted by a model and kept only when their quote appears verbatim in the text; each cited source is then checked, with a model’s help, for whether it says what the claim relies on. Those verdicts can be wrong — read the claim’s quote and the cited source before relying on one.
A language model drew the claims from the paper on 2026-11-09, under version 3 of the claim definition (model deepseek-v4.1-flash, prompt extract-v3).
A second model labelled each claim on 2026-11-09 (model jev-1.13-20260917, definition revision gold-guideline-v0.2).
Cited sources are checked with a language model’s help (gpt-6-sol).
Statistics and arithmetic are recomputed, not judged.
Confidence bands are shown only for fields calibrated on our annotated test set. None is calibrated yet, so no band is shown.
What counts as a claim ›How we measure confidence ›How we check this ›
Are you an author, or do you see a problem with this page? Request a review
